Embed Size (px)
Citation preview

BELLEVUE SCHOOL DISTRICT STRATEGIC PLAN 2018–2023
AFFIRM. INSPIRE. THRIVE.
Presented on December 17, 2019Prepared by: Eva Collins, Patty Siegwarth, John Harrison, Heather Sanchez and Kelly AramakiFinalized and Approved by Superintendent Dr. Duran: December 2, 2019
2019 – 2020 School Improvement PlansBoard Report

1. 2018-2019 District Summary of School Improvement Plans (SIPs)2. Student Academic Data3. Student Panorama Data4. Looking Ahead: 2019-20 School Improvement Plans
➢Purpose of School Improvement Plans➢Cycles of Continuous Improvement➢SIP Structure➢SIP Timeline➢Key Strategies (Best Practices, Next Practices)
5. SIPs Through the Lens of the Critical Criteria6. Next Steps
Content
2

3
Per Board Policy 0300 School Improvement Plan (SIP) goals:
Once per year, by the month prior to which SIPs must be approved by the Board, the District shall present a SIP-oriented summative progress report that reflects school progress related to relevant annual and strategic plan goals for the previous school year. In this report, the unit of measure will be schools rather than individual students, though supplemental data on students may be provided as appropriate, to offer greater context for understanding the progress. Numbers may be presented in appropriate groupings (e.g., elementary, middle, high; or based on feeder patterns; or other groupings as appropriate to provide the most accurate and productive understanding of student outcomes and experiences, and school experiences and needs that relate to student outcomes and goal progress).
Policy 0300 Reporting and Monitoring

4
2018 – 2019 SIPs were collaboratively developed prior to the adoption of:
• Strategic Plan (October, 2018), and
• Policy 0300 (Reporting) with guidance for SIP summary reporting (October, 2019).
Therefore, 2018 – 2019 school year SIPs were created during a transition year. We are planning for tight alignment between the 2019 – 2020 SIPs and Strategic Plan.
2018 – 2019 - A Transition Year

High Quality Instruction Goal
Measure Data Source Progress Rating
Each school set overall and subgroup targets for academic achievement in ELA and Math.
ELA School SIP Targets
Math School SIP Targets
Rationale
Progress is below expectations. The majority of schools at all levels did not meet the ELA and Math targets included in theirSIP Plans. Last year’s plans were not aligned to the Strategic Goals.
5
Note: To monitor academic progress, we reviewed schools’ achievement of the SBA targets in their 2018-19 SIPs.

6
• BSD sets Smarter Balanced Assessment proficiency targets based on State guidelines, outlined in the Washington School Improvement Framework.
• The State directs districts to set annual targets for all students and for specified subgroups (race, income, English Language Learners, and students with disabilities) based on the most recent year of data available. Targets are calculated as the linear incremental progress needed to reach 90% proficiency by 2027.
• Because targets are set as linear increments, they are not all equally ambitious or even necessarily feasible. In particular, wedo not expect students designated as English Language Learners to be proficient on the SBA English Language Arts exam. Once students have acquired enough English to pass that exam they have typically also passed the English proficiency exam and exited English Language Learner status. The percent of English Learners on track to exit ELL services by the end of six years is a better measure of progress for these students than SBA proficiency rates.
Background Context: How student proficiency targets are set

7
District Summary: % of Schools Meeting SBA Proficiency Targets By Level, including Subgroups
Smarter Balanced Assessment 2019 % (#/Total) Schools Meeting TargetsGroup Elementary Middle School High SchoolEnglish Language ArtsAll Students 47% (8 of 17 schools) 14% (1 of 7 schools) 50% (3 of 6 schools)Asian 47% (8 of 17 schools) 43% (3 of 7 schools) 60% (3 of 5 schools)Black 40% (2 of 5 schools) 60% (3 of 5 schools) 50% (1 of 2 schools)Hispanic 14% (2 of 14 schools) 43% (3 of 7 schools) 75% (3 of 4 schools)Two or More Races 50% (8 of 16 schools) 43% (3 of 7 schools) 100% (4 of 4 schools)White 53% (9 of 17 schools) 43% (3 of 7 schools) 50% (3 of 6 schools)Eligible for Free/Reduced Price Meals 25% (4 of 16 schools) 14% (1 of 7 schools) 75% (3 of 4 schools)Students with Disabilities 25% (4 of 16 schools) 43% (3 of 7 schools) 0% (0 of 5 schools)English Language Learners 21% (3 of 14 schools) 20% (1 of 5 schools) 75% (3 of 4 schools)Math All Students 35% (6 of 17 schools) 29% (2 of 7 schools) 0% (0 of 6 schools)Asian 65% (11 of 17 schools) 29% (2 of 7 schools) 20% (1 of 5 schools)Black 40% (2 of 5 schools) 60% (3 of 5 schools) 50% (1 of 2 schools)Hispanic 29% (4 of 14 schools) 43% (3 of 7 schools) 50% (2 of 4 schools)Two or More Races 56% (9 of 16 schools) 29% (2 of 7 schools) 50% (2 of 4 schools)White 41% (7 of 17 schools) 29% (2 of 7 schools) 0% (0 of 6 schools)Eligible for Free/Reduced Price Meals 27% (4 of 15 schools) 29% (2 of 7 schools) 25% (1 of 4 schools)Students with Disabilities 25% (4 of 16 schools) 29% (2 of 7 schools) 0% (0 of 5 schools)English Language Learners 27% (4 of 15 schools) 0% (0 of 5 schools) 75% (3 of 4 schools)
8
Data Summary: SIP ELA Goals and Actuals 2018-19
Elementary Schools

9
Data Summary: SIP ELA Goals and Actuals 2018-19
Elementary Schools (continued)

10
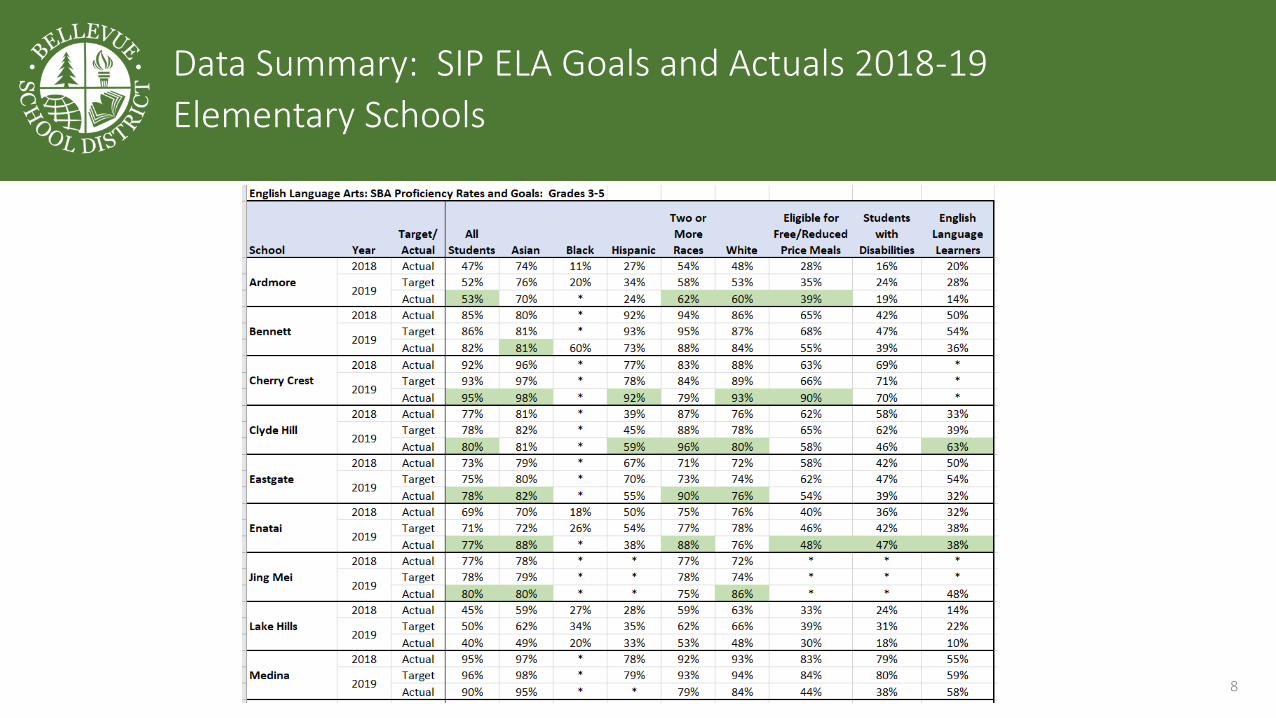
Data Summary: SIP Math Goals and Actuals 2018-19
Elementary Schools
11
Data Summary: SIP Math Goals and Actuals 2018-19
Elementary Schools (continued)

12
Data Summary: SIP ELA Goals and Actuals 2018-19
Middle Schools
English Language Arts: Smarter Balanced Assessment (SBA) Proficiency Targets & Actuals, Grades 6-8
School Year
Target/
ActualAll
Students Asian Black Hispanic
Two or
More Races White
Eligible for
Free/Reduce
d Price Meals
Students with
Disabilities
English
Language
Learners
2018 Actual 78% 91% 60% 71% 86% 74% 70% 53% *
Target 79% 92% 63% 73% 87% 76% 72% 57% *
Actual 78% 86% * 61% 76% 80% 62% 54% 36%
2018 Actual 73% 80% 44% 53% 78% 73% 40% 25% 27%
Target 75% 81% 49% 57% 79% 75% 46% 32% 34%
Actual 79% 83% 58% 61% 81% 81% 55% 40% 28%
2018 Actual 56% 69% 34% 39% 49% 69% 36% 26% 2%
Target 60% 71% 40% 45% 54% 71% 42% 33% 12%
Actual 53% 66% 34% 32% 60% 72% 34% 43% 17%
2018 Actual 87% 91% * 54% 84% 86% 68% 41% *
Target 88% 92% * 58% 85% 87% 70% 46% *
Actual 86% 92% * 63% 87% 84% 64% 58% 10%
2018 Actual 86% 95% 38% 52% 84% 86% 53% 41% 18%
Target 87% 96% 44% 56% 85% 87% 57% 46% 26%
Actual 84% 93% 50% 45% 87% 84% 50% 17% 18%
2018 Actual 77% 80% 47% 66% 74% 81% 48% 34% 21%
Target 78% 81% 52% 69% 76% 82% 53% 40% 29%
Actual 77% 84% 53% 69% 73% 79% 41% 27% 4%
2018 Actual 88% 91% 59% 77% 88% 87% 68% 56% 42%
Target 89% 92% 62% 78% 89% 88% 70% 60% 47%
Actual 84% 88% 67% 62% 82% 82% 63% 35% 28%
2019
Tillicum
Tyee
2019
2019
2019
2019
2019
Big Picture
Chinook
Highland
International
Odle
2019
13
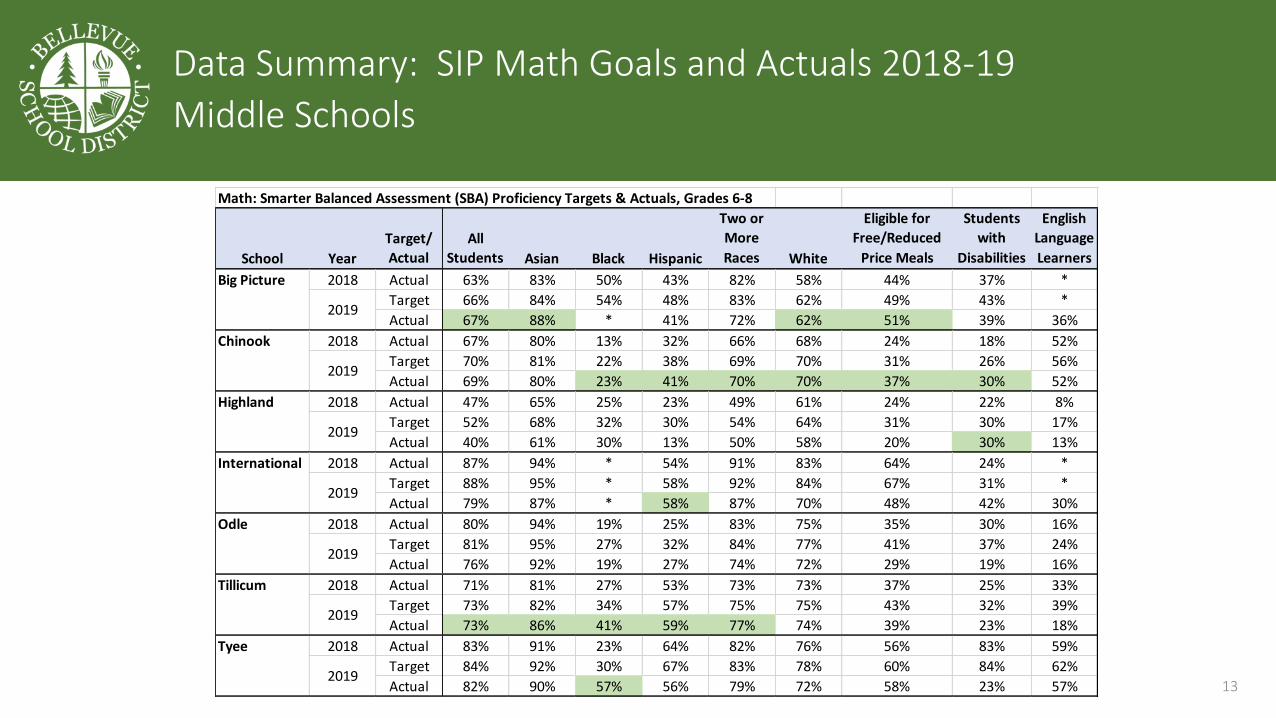
Data Summary: SIP Math Goals and Actuals 2018-19
Middle Schools
Math: Smarter Balanced Assessment (SBA) Proficiency Targets & Actuals, Grades 6-8
School Year
Target/
Actual
All
Students Asian Black Hispanic
Two or
More
Races White
Eligible for
Free/Reduced
Price Meals
Students
with
Disabilities
English
Language
Learners
2018 Actual 63% 83% 50% 43% 82% 58% 44% 37% *
Target 66% 84% 54% 48% 83% 62% 49% 43% *
Actual 67% 88% * 41% 72% 62% 51% 39% 36%
2018 Actual 67% 80% 13% 32% 66% 68% 24% 18% 52%
Target 70% 81% 22% 38% 69% 70% 31% 26% 56%
Actual 69% 80% 23% 41% 70% 70% 37% 30% 52%
2018 Actual 47% 65% 25% 23% 49% 61% 24% 22% 8%
Target 52% 68% 32% 30% 54% 64% 31% 30% 17%
Actual 40% 61% 30% 13% 50% 58% 20% 30% 13%
2018 Actual 87% 94% * 54% 91% 83% 64% 24% *
Target 88% 95% * 58% 92% 84% 67% 31% *
Actual 79% 87% * 58% 87% 70% 48% 42% 30%
2018 Actual 80% 94% 19% 25% 83% 75% 35% 30% 16%
Target 81% 95% 27% 32% 84% 77% 41% 37% 24%
Actual 76% 92% 19% 27% 74% 72% 29% 19% 16%
2018 Actual 71% 81% 27% 53% 73% 73% 37% 25% 33%
Target 73% 82% 34% 57% 75% 75% 43% 32% 39%
Actual 73% 86% 41% 59% 77% 74% 39% 23% 18%
2018 Actual 83% 91% 23% 64% 82% 76% 56% 83% 59%
Target 84% 92% 30% 67% 83% 78% 60% 84% 62%
Actual 82% 90% 57% 56% 79% 72% 58% 23% 57%
2019
Chinook
Highland
Big Picture
2019
2019
2019
International
Odle
Tillicum
2019
2019
Tyee
2019

14
Data Summary: SIP ELA Goals and Actuals 2018-19
High Schools

15
Data Summary: SIP Math Goals and Actuals 2018-19
High Schools

16
• At the elementary level, of the schools with a large enough sample size for reporting, elementary schools met 34% of subgroup proficiency targets (48 out of 141) in ELA and met 37% of subgroup proficiency targets (52 out of 141) in math.
• One elementary school met all targets for all subgroups in both ELA and math.
• At the elementary level, of the schools with a large enough sample size for reporting, schools were most effective in meeting our ELA targets in the following subgroups: White and Two or More Races.
• At the elementary level, of the schools with a large enough sample size for reporting, schools were most effective in meeting our Math targets in the following subgroups: Asian and Two or More Races.
• At the elementary level, of the schools with a large enough sample size for reporting, schools were least effective in meeting our ELA and Math proficiency targets in the following subgroups: Hispanic/Latino, Students Receiving ELL services, Students Receiving Special Education Services, and Students Eligible for Free/Reduced Lunch Services.
Findings – Elementary School

17
• At the middle level, of the schools with a large enough sample size for reporting, middle schools met 34% (21 out of 61) proficiency targets in ELA and 30% (18 out of 61) proficiency targets in math.
• One middle school met all subgroups but one in ELA and all subgroups but two in Math.
• At the middle level, of the schools with a large enough sample size for reporting, schools were most effective in meeting our ELA and Math proficiency targets in one subgroup: Black/ African American.
• At the middle level, of the schools with a large enough sample size for reporting, schools were least effective in meeting our ELA proficiency targets in the following subgroups: Students Receiving ELL Services and Students Eligible for Free/Reduced Lunch Services.
• At the middle level, of the schools with a large enough sample size for reporting, schools were least effective in meeting our Math proficiency targets in the following subgroup: Students Receiving ELL Services.
Findings – Middle School

18
• At the high school level, of the schools with a large enough sample size for reporting, high schools met 58% (23 out of 40) of proficiency targets in ELA and 25% (10 out of 40) proficiency targets in math.
• One high school met the ELA target in 10th grade in all but one of the subgroups.
• At the high school level, of the schools with a large enough sample size for reporting, schools were most effective in meeting our ELA proficiency targets in the following subgroups: Two or More Races, Hispanic/Latino, Students Eligible for Free/Reduced Lunch Services and Students Receiving ELL Services.
• At the high school level, of the schools with a large enough sample size for reporting, schools were least effective in meeting our ELA proficiency targets in the following subgroups: Students Receiving Special Education Services.
• At the high school level, of the schools with a large enough sample size for reporting, schools were most effective in meeting our Math proficiency targets in the following subgroups: Students Receiving ELL Services.
• At the high school level, of the schools with a large enough sample size for reporting, schools were least effective meeting our Math proficiency targets in the following subgroups: White, Students Receiving Special Education Services and Asian.
Findings – High School

VISION: TO AFFIRM AND INSPIRE EACH AND EVERY STUDENT TO LEARN AND THRIVE AS CREATORS OF THEIR FUTURE WORLD.
Reflections
Providing targeted coaching and professional development on standards and assessment implementation at the elementary and middle school levels showed promising, positive outcomes compared to other schools.
o Three out of four elementary schools implementing Achievement Network (ANet) interim assessments in ELA met their proficiency targets for all students on the ELA Smarter Balanced Assessment.
o At the middle level, the one middle school implementing Achievement Network (Anet) interim assessments in ELA And math met their proficiency targets in 7 of 8 subgroups in ELA and 6 of 8 in Math.
Students at the secondary level who have traditionally been most marginalized were more
successful at meeting the proficiency targets overall than at the elementary level.
19

VISION: TO AFFIRM AND INSPIRE EACH AND EVERY STUDENT TO LEARN AND THRIVE AS CREATORS OF THEIR FUTURE WORLD.
Adjustments
➢ Expanded professional development in the area of standards-aligned instruction and the use of interim
assessments at the elementary and middle school level.
➢ Increased resources tied to effective practices.
• Elementary Title 1 Schools (Ardmore, Lake Hills, Sherwood, Stevenson) o Allocated co-teacher at each grade level, K-3
o Implemented structured Professional Learning Communities
o Implemented Computer Science program
• Middle Title 1 School (Highland)o Allocated additional staffing based on student data and needs (Co-teacher, math interventionist, behavior analyst,
literacy specialist, Spanish-speaking support staff)
➢ Developed clear goals and targets for student well-being.
➢ Developed a student well-being task force centrally to support schools.
➢ Added 8th, 9th, and 10th grade Multi-Tiered Systems of Support (MTSS) Teams to the existing 12th grade team
➢ Implemented system-wide focus on structured cycles of continuous improvement in goal areas including
emphasis on learner-driven data to drive decision making, progress monitoring, and adjusting. 20

Student Wellbeing Goal
Measure Data Source Progress Rating
During the 2018-19 school year, schools focused on data linked to the relationships domain of Panorama.
Panorama Data
Rationale
For the relationships domain, grades 3-5 saw a 6% increase (increasing from 67% to 73%), while results in grades 6-8 and grades 9-12 stayed flat.
21

22
• Prior to our new strategic plan’s focus on student “sense of belonging”, much of our work during the 2018-19 school year focused on relationships (both student-student and student-staff), because:
• Fostering strong relationships is a core practice of Culturally Responsive Teaching & Learning (Relationships, Realness, Relevance, and Rigor).
• Students need to know that others care about them in order to be successful academically and emotionally.
• The following data show our schools progress on improving relationships.
• Note: For 2019-20, we have expanded our focus on relationships to include an overall student sense of belonging, which includes our focus on Positive Behavior and Intervention Support (PBIS).
Area of Focus: Relationships

23
Summary of Results from Fall 2016 to Fall 2018
% Responding Favorably
Note: Data are color-coded to make trends more apparent, with higher scores greener.
GRADES 3-5 GRADES 6-8 GRADES 9-12
DOMAINFall
2016Fall
2017Fall
2018Fall
2016Fall
2017Fall
2018Fall
2016Fall
2017Fall
2018
School Climate72 72 72 67 61 61 64 62 63
Pedagogical Effectiveness72 74 79 72 70 69 69 68 69
Supportive Relationships65 67 73 63 61 60 61 61 62
Classroom Environment58 58 57 77 76 74 81 79 79
Student EngagementNA NA NA 66 66 65 63 63 64
Focus: Relationships

24
Grades 3-5: Relationship Questions by Sub-Groups
% Responding Favorably (Fall 2018)
Note: Colors are a “heat map” intended to help make data trends more apparent. Green is high and red is low.
CategoryHow much do you
feel like you belong at your school?
How friendly are students at this
school?
How connected do you feel to adults at
your school?
How well do students with different skin colors treat each other at school?
How comfortable are you asking your
teacher questions in class?
Does your teacher care about how you're feeling?
If you walked into class upset, how concerned would your teacher be?
How well does your teacher know you?
Overall % Favorable 71 65 56 86 69 80 75 68
ELL 71 63 64 75 64 80 78 76
Not ELL 71 65 54 88 70 80 75 67
Low Income 67 56 59 76 66 82 78 69
Not Low Income 71 67 55 88 70 80 75 68
IEP 71 63 62 83 64 80 68 72
No IEP 71 65 55 86 70 80 76 68
Female 69 65 57 86 66 80 77 67
Male 72 65 54 86 72 80 74 70
Asian 71 67 57 85 70 81 77 68
White 70 66 53 89 70 80 74 68
Hispanic 71 59 60 80 68 82 78 72
Black 70 52 67 73 74 85 73 75
Multi-Ethnic 68 64 52 92 65 76 71 65
Pacific Islander 73 73 55 90 75 92 67 67
Advanced Learning 73 68 49 89 70 76 73 63
Traditional 70 64 57 86 69 81 76 70
Grade 3 73 69 59 84 68 83 76 76
Grade 4 71 65 59 87 70 81 77 69
Grade 5 68 61 49 88 71 76 73 60

25
Grades 6-8: Relationship Questions by Sub-Group
% Responding Favorably (Fall 2018)
Category
Overall, how much do you feel like you belong at your
school?
Is your school a warm and welcoming place?
How friendly are students at your
school?
How connected do you feel to the adults
at your school?
How well do students of different
races/ethnicities get along with each other
at your school?
How comfortable are you asking this
teacher questions about what you are
learning in class?
Does this teacher take the time to get to
know you?
If you walked into class upset, how
concerned would your teacher be?
When your teacher asks how you are
doing, how often do you feel that your teacher is really
interested in your answer?
Overall % Favorable 59 57 55 42 74 71 48 55 65
ELL 59 64 59 51 68 65 58 58 68
Not ELL 59 56 55 41 75 71 48 55 64
Low Income 55 52 49 47 72 67 53 60 63
Not Low Income 60 57 56 40 75 72 48 55 65
IEP 61 59 54 48 73 67 59 62 64
No IEP 59 56 55 41 75 71 48 55 65
Female 56 57 53 39 75 69 46 53 62
Male 63 56 57 44 74 73 51 57 67
Asian 60 59 57 40 71 71 46 54 65
White 60 56 53 43 77 72 50 56 66
Hispanic 59 56 55 46 77 69 53 59 64
Black 50 43 48 45 65 70 52 60 65
Multi-Ethnic 57 51 54 39 81 70 46 53 61
Native American 75 56 50 67
Pacific Islander 72 78 61 78
Advanced Learning 60 54 56 34 69 72 43 52 63
Traditional 59 57 55 43 76 71 50 56 65
Grade 6 62 62 56 45 79 72 50 59 66
Grade 7 57 52 51 40 73 70 47 54 64
Grade 8 60 55 58 40 71 71 48 53 65
Note: Colors are a “heat map” intended to help make data trends more apparent. Green is high and red is low.

26
Grades 9-12: Relationship Questions by Sub-Group
% Responding Favorably (Fall 2018)
CategoryOverall, how much do
you feel like you belong at your school?
Is your school a warm and welcoming place?
How friendly are students at your
school?
How connected do you feel to the adults
at your school?
How well do students of different
races/ethnicities get along with each other
at your school?
How comfortable are you asking this
teacher questions about what you are
learning in class?
Does this teacher take the time to get to
know you?
If you walked into class upset, how
concerned would your teacher be?
When your teacher asks how you are
doing, how often do you feel that your teacher is really
interested in your answer?
Overall % Favorable 55 55 59 38 71 74 48 56 68
ELL 51 61 59 44 61 69 59 60 67
Not ELL 55 55 59 37 72 74 47 55 68
Low Income 47 52 58 35 66 71 52 55 65
Not Low Income 56 56 59 38 72 74 47 56 69
IEP 53 54 58 49 66 72 61 62 69
No IEP 55 55 59 37 72 74 47 55 68
Female 50 51 54 33 69 72 45 55 66
Male 59 59 64 42 73 76 51 57 71
Asian 53 56 59 36 67 73 46 55 67
White 59 56 60 40 78 76 50 57 71
Hispanic 47 53 59 39 66 69 52 54 64
Black 46 42 52 34 61 73 50 52 63
Multi-Ethnic 55 52 56 38 72 74 45 57 69
Native American 94 69 63 75
Pacific Islander 36 18 18 27
Advanced Learning 50 50 56 31 66 75 39 55 67
Traditional 56 56 60 39 72 74 50 56 68
Grade 9 54 57 59 32 74 69 42 50 63
Grade 10 54 53 57 36 71 72 47 55 66
Grade 11 55 53 60 38 69 77 50 58 71
Grade 12 57 57 61 47 71 80 56 62 75
Note: Colors are a “heat map” intended to help make data trends more apparent. Green is high and red is low.

27
• Elementary• Supportive relationships has increased over the past 3 years• Students across subgroups report positive relationships between students of different races• Black and Students Eligible for Free/Reduced Lunch Services reported lower perceptions of student
friendliness at their schools• Students across subgroups reported their feelings of connections to adults at their schools as the lowest
category
• Secondary• Supportive relationships has been flat for high school and slightly declining for middle school over the past
3 years• Students getting along with students of different races and ethnicities is the highest percent favorable at
the middle school• Asking teachers questions about their learning was the highest percent favorable at the high school• Connection to adults was the lowest percent favorable at the middle and high school levels
Findings Related to Positive Relationships

28
• Equity work and efforts to increase student voice/affinity may be contributing to students feeling positive about relationships with students of different races and ethnicities.
• Relationships with adults continues to be an area requiring focused attention at all levels.
• Lower positive favorable student responses on sense of belonging and welcoming environment necessitates a district and school-wide focus on the broader category of sense of belonging.
Reflections

29
• Provide professional learning on building relationships with students (Knowing students’ stories, strengths and aspirations).
• Increase opportunities for student voice and agency; conduct focus groups to better understand student responses on Panorama; involve students in solutions.
• Expand student affinity opportunities to support positive student identity.
• Utilize Cycles of Continuous Improvement to identify site-specific challenges, root causes, strategies, and progress monitoring.
• Engage staff, students and families in addressing the broader “sense of belonging” as measured by the following questions:
Adjustments
How much do you feel you belong at school? How connected to you feel to adults at school?
How friendly are students at the school? How well do students with different skin colors treat each other at school?
Does this school respect all students’ cultures? How safe do you usually feel at school?
Do students treat each other well in the cafeteria? Do students treat each other well in the hallways?
Do students treat each other well on the bus? Do students treat each other well on the playground?

30
Looking Ahead: School Improvement Plans 2019-20

31
• Provide structure for the continuous improvement process,
• Serve as the main vehicle for accomplishing the district’s Strategic Plan at the school level,
• Describe when and how schools are implementing components of the Strategic Plan, and
• Outline how schools are monitoring implementation and impact.
Since SIPs must be tightly aligned with the Strategic Plan, we take an approach of bounded autonomy: some aspects are required, others are flexible depending on the needs of the school.
Purpose of School Improvement Plans (SIPs)
To affirm and inspire each and every student to learn and thrive as creators of their future world.

32
• Developing greater system coherence in alignment to the Strategic and Annual Plans
• Results-oriented goals
• Training school leaders on data analysis, including comprehensive needs assessment
• Utilizing the “Plan, Do, Study, Adjust” approach to continuous improvement
• Developing a “Theory of Action” with principals for each cycle of improvement
• Encouraging innovative approaches to meet goals
SIP Overview 2019-20

33
SIPs are learner-driven and grounded in cycles of continuous improvement (Plan, Do, Study, Adjust) including the following steps:
Cycles of Continuous Improvement
To affirm and inspire each and every student to learn and thrive as creators of their future world.
Cycle Steps
PLAN • Conduct needs assessment (analyze data, identify performance challenges, understand root
causes and bright spots)
• Select strategies based on needs assessment and alignment to the Annual Plan and Strategic
Plan
DO • Develop a theory of action and work plan
• Implement plan
STUDY • Monitor progress, including changes to adult practice and student outcomes
ADJUST • Adjust strategies based on implementation and outcome data

34
School Background – Narrative including what makes each school unique
School Profile – Data snapshot of each school
Strategic Plan Goal Areas (High Quality Instruction, Student Well-Being, and Family & Community Engagement)
• Outcome goals aligned to Annual Plan• Washington State Improvement Framework (WSIF) data tables & goals• Strengths• Key Performance Indicators (data sources to measure progress along the way)• Key Strategies
SIP Structure
To affirm and inspire each and every student to learn and thrive as creators of their future world.

35
SIP Timeline
January 2020 Board Approval of 2019-20 SIPs
January-May 2020Schools continue to develop their three-year SIPs for 2020-21 through 2022-23, including
needs assessments and strategy development
June 2020 Draft three-year SIPs due internally
August/September 2020 Three-year SIP drafts refined as state test scores become available
November 2020 Final three-year SIPs provided to the Board for review
November/December 2020 Three-year SIPs approved by the Board
November/December 2021 Year 2 of SIP Cycle: Board approves SIP updates
November/December 2022 Year 3 of SIP Cycle: Board approves SIP updates

36
Universal Social Emotional Learning (SEL) Instruction and Positive Behaviors and Intervention Supports (PBIS)
• Implementing a strong universal approach to SEL, including RULER at K-2 to build social emotional learning, Second Step at 3-5 to build social skills, and anti-bullying curriculum K-5
• Strengthening PBIS systems and structures to continually teach and reinforce positive behaviors
Multi-Tiered Systems of Support (MTSS)• Utilizing multiple sources of reading, math, and social-emotional data to plan and adjust instruction• Providing instructional interventions and monitoring progress
Balanced Literacy Instruction• Providing literacy instruction to include read-aloud, shared reading, guided reading, independent reading
and word work.
Standards-Based Math Instruction• Lessons aligned to grade-level standards or higher including aspects of rigor
Key Strategies (“Best” Practices) – Elementary Schools
To affirm and inspire each and every student to learn and thrive as creators of their future world.
“Best” practices are evidence-based strategies and practices implemented at all schools.

37
Universal Social Emotional Learning (SEL) Instruction and Positive Behaviors and Intervention Supports (PBIS)• Common lessons to build social emotional learning and social skills and PBIS systems and structures
Multi-Tiered Systems of Support (MTSS)• Utilizing multiple sources of reading, math, and social-emotional data to plan and adjust instruction• Providing instructional interventions and monitoring progress• Each school has an 8th Grade Student Engagement Team that has identified students needing additional support
and intervention based on early warning indicators (EWIs). The team assigns a case manager for each student and develops a student support plan that includes the supports/interventions and progress monitoring timelines.
Literacy Instruction Using Complex Text• Literacy instruction focused on complex texts using common strategies in English Language Arts, Social Studies
and Science• Each school has a 6th grade Literacy Teams with members from each content area working collaboratively to
improve literacy across the curriculum
Equity-Driven, Data-Informed Leadership Teams (Equity and Inclusion Teams)• Developing educator leadership and a collaborative approach to improving instruction and student learning• Ensuring an equity focus and multiple data sources in cycles of continuous improvement
Key Strategies (“Best” Practices) – Middle Schools
To affirm and inspire each and every student to learn and thrive as creators of their future world.
“Best” practices are evidence-based strategies and practices implemented at all schools.

38
“Best” practices are research-based strategies and practices that we are working to strengthen at all schools.
Universal Social Emotional Learning (SEL) Instruction and Positive Behaviors and Intervention Supports (PBIS)
• Implementing a strong universal approach to SEL, including common lessons to build social emotional learning and social skills
• Strengthening PBIS systems and structures to continually teach positive behaviors
Multi-Tiered Systems of Support (MTSS)
• Utilizing multiple sources of 9th and 10th grade reading, math and social-emotional data to plan and adjust instruction
• Utilizing multiple sources of 12th grade graduation success data (SBA standard, community service, Washington State History, grad credit requirement, etc.) to plan and adjust instruction
• Providing instructional interventions and monitoring progress
Mental Health Interventions and Resources
• Facilitating interventions and providing resources to students based on individual needs identified through multiple avenues, to include Mental Health Assistance Team (MHAT) and BIMAS 2 screeners
Equity-Driven, Data-Informed Leadership Teams (Equity and Inclusion Teams)
• Developing educator leadership and a collaborative approach to improving instruction and student learning
• Ensuring an equity focus and multiple data sources in cycles of continuous improvement
Key Strategies (“Best” Practices) – High Schools
To affirm and inspire each and every student to learn and thrive as creators of their future world.

39
Standards-based Interim Assessments• Building interim assessments at Ardmore, Enatai, Phantom Lake, Sherwood Forest, Somerset with
ANet partnership
Computer Science Instruction & Integration• Piloting at Ardmore, Lake Hills, Sherwood Forest, Stevenson and Wilburton
Global Competence Interdisciplinary Units• Developing interdisciplinary units that not only teach academics, but also teach students how to be productive
global citizens (Jing Mei)
Continuum of Service Model• Providing special education services to students in their neighborhood schools at Enatai, Stevenson and
Wilburton
Students Organized Against Racism (SOAR)• Developing student agency and anti-racist student leadership at Phantom Lake, Sherwood Forest, Enatai,
Stevenson, Lake Hills, Jing Mei, Medina, Wilburton and Puesta del Sol
Key Strategies (“Next” Practices) – Elementary Schools
To affirm and inspire each and every student to learn and thrive as creators of their future world.
“Next” practices are innovative, forward-thinking strategies.

40
Standards-based Instruction and Assessment• Developing a system of interim assessments with Chinook, Highland and Odle receiving technical
assistance from ANet to inform instruction
Continuum of Service Model• Chinook is providing special education services to students formerly served in centered programs in their
neighborhood
Student Voice and Advocacy• Collaborating with students to develop and implement SEL lessons and school-wide activities at Odle• Developing student-agency and anti-racist student leadership at every middle school. At Big Picture School
SOAR students serve on the Equity and Inclusion Leadership Team
Student Well-Being Extensions• Expanding SEL curriculum to include monthly school-wide lessons to develop social emotional learning
skills and school-wide activities designed to put SEL learning into practice, launching a Digital Citizenship Task force to foster ethical use of digital resources and safe use of social media and implementing Daily Mindful Moments
Key Strategies (“Next” Practices) – Middle Schools
To affirm and inspire each and every student to learn and thrive as creators of their future world.
“Next” practices are innovative, forward-thinking strategies.

41
Graduation Success in Partnership with Nintendo• Identifying current reality flows for Areas of Focus (high occurrence student needs), as well as related problem statements• Developing countermeasures to address problem statements• Creating desired future state flows for Areas of Focus• Generating and implementing work plans for Areas of Focus through implementation and evaluation• Replicating process for additional high priority areas of need
Graduation Success in Partnership with Eastside Pathways, Lake Washington SD and YMCA• Identifying current reality and future state as it relates to graduation• Engaging in a cycle of continuous improvement related to engagement of parents/guardians of students who identify as African American/Black and
Hispanic/Latino to increase students' Sense of Belonging• Understanding from the Parent/guardian perspective what level of engagement (inform, consult, involve, collaborate, empower) they desire and what that
engagement would look like in support of their students' Sense of Belonging
Student Voice and Advocacy• Collaborating with students to develop and implement SEL lessons and school-wide activities and/or events in collaboration with students and staff
(Bellevue, Interlake, Sammamish, and Newport)• Developing and implementing a comprehensive student onboarding system (Sammamish)• Soliciting student voice to identify trends, wants, and needs to guide planning and implementation (Bellevue, Interlake, Newport, and Sammamish)
Continuum of Service Model• Providing special education services to students in their neighborhood school at Bellevue High
Standards-based Interim Assessments• Building and piloting interim ELA assessments in 9th grade
Key Strategies (“Next” Practices) – High Schools
To affirm and inspire each and every student to learn and thrive as creators of their future world.
“Next” practices are innovative, forward-thinking strategies.

42
Consider Each and Every Student• SIPs are focused on data at the subgroup level in order to determine which student groups are most
impacted by our instructional program and improvement efforts.
• Key strategies are designed and selected to decrease and ultimately eliminate disparities in student outcomes (ex. Teams (MTSS, SOAR); Interim Assessments)
• Key strategies are designed and selected to promote opportunity for those who have been historically underserved and benefit all students equitable (ex. Computer Science in Elementary Title 1 Schools)
Serve All Students and Stakeholders• SIPs put students first by tying strategies to student outcomes. We believe it’s important to identify and
measure progress of adult practice improvements, but the ultimate goal is to improve the experiences of our students who have been historically underserved in our system.
• SIPs should be built by the community (staff, students, families). We are striving toward increased participation from diverse stakeholders in the school improvement planning process.
Through the Lens of Critical Criteria
To affirm and inspire each and every student to learn and thrive as creators of their future world.

43
Align with Values, Historic Realities, and Current Contexts• Student outcome goals are directly aligned to the equity-focused goals in the annual plan and strategic plan. If we achieve our
student outcome goals in our school improvement plans, we will achieve our student outcome goals in our annual and strategic plans.
• School Improvement Plans are aligned to the mission, vision and key strategies of the strategic plan (ex. High Quality Instruction, Student Well-Being, Family and Community Engagement).
• Leaders identify potential barriers to more equitable outcomes through the PDSA cycles of continuous improvement process. They identify root causes with the underlying mental models that contribute to inequitable outcomes and then work to eliminate those root causes.
Build in Accountability• District resource allocation, support and professional development are designed and coordinated from looking at the themes
across school improvement plans (ex. PD and coaching for co-teachers at Title 1 schools)• School Executive Directors work alongside school leaders in building the school improvement plan. They then observe
classrooms and staff PD alongside principals to determine implementation successes, challenges and needed supports or shiftsin strategy.
• Every school uses the Multi-Tiered Systems of Support Structure to monitor progress and evaluate impact of school improvement efforts.
• School leaders are also engaging in two cycles of continuous improvement this year with clear timelines and method to monitoring progress of improvements in adult practice, improvements in student engagement and improvements in student outcomes.
Through the Lens of Critical Criteria
To affirm and inspire each and every student to learn and thrive as creators of their future world.

44
Three-Year School Improvement Plan• Build a longer-term school improvement plan that allows for more strategic planning with regular progress
monitoring check points (implementation and outcomes) throughout the year aligned to annual plan and strategic plan goals.
• Strengthen our ability to answer the question, “How do we know we are making progress towards our goals?” We are doing this by building out intentional progress monitoring plans to monitor improvements in adult practice and student outcomes.
New Data Platform to Enhance Strategic Planning & Progress Monitoring• Launch a dynamic, new data platform, School Insights, that will support schools in strategic school
improvement planning and progress monitoring in academic areas as well as in non-academic areas (ex. attendance, behavior).
Board Approval of 2019-20 School Improvement Plans (January)
Next Steps
To affirm and inspire each and every student to learn and thrive as creators of their future world.