Embed Size (px)
Citation preview

ANNUAL REPORT2016-17
AFCONS INFRASTRUCTURE LIMITEDA Shapoorji Pallonji Group Company
“Afcons House”16, Shah Industrial Estate, Veera Desai Road,
Azad Nagar P. O., Andheri (West), Mumbai - 400 053

Mission“To be a prominent transnational infrastructure company recognised for business innovations,
focused on total satisfaction and enhanced value creation for all its stakeholders”
Kuwait project bags HSE award
The KNPC refinery project site in Kuwait has bagged the ASSE GCC HSE Excellence Award 2017. American Society of Safety Engineers (ASSE) recognised us with this award to appreciate our HSE leadership and measures undertaken for employees’ safety at work place. This is the first time Afcons has received this award.
Construction Week Award for AfconsAfcons Infrastructure Ltd was honoured with the Infrastructure Company of the Year Award at the
Construction Week Awards 2016 in Mumbai, on September 21, 2016. The award was received by the Deputy Managing Director, Mr. S. Paramasivan.
IRCON Tunnel - Award for IRCON Tunnel Project
IRCON Tunnel Project 2618-T74R (A) has been given Gold Award at the Greentech Environment Award 2017 held on February 1, 2017 in Bangalore.
Greentech Award for ALEP PKG II
Agra-Lucknow Expressway Package II has received the Gold Award in Construction Sector for outstanding achievement in Environment Management at the 17th Annual Greentech Environment Award 2017 held at Taj Bangalore on February 1, 2017.
Best Infrastructure Company in Roads & Bridges
Afcons received the award for Best Infrastructure Company in Roads & Bridges at the 2017 CIA World Builders & Infra Awards, in Mumbai, on July 31, 2017. Afcons bagged the award for its impressive performance, and, ahead-of-schedule delivery of two packages in the Agra Lucknow Expressway Project (ALEP).
Award for Jammu-Udhampur Highway Project
The Jammu-Udhampur Highway Project was awarded the Construction Times Award for the Best Executed Highway Project of the Year. The award was received by Mr R. Anantakumar, Executive Vice President, on December 12, 2016, in Gurgaon.
Afcons has started its journey from being a champion EPC player to being a Knowledge Enterprise. It is the only
Indian infrastructure company (Independent Operating Unit) to receive the Global, Asia & India MAKE award
2016. Mr. R Giridhar, Executive Director - Technical, and, Mr. Deepak Gaikwad, Head – Knowledge Management, received the award during the Asia Knowledge Forum,
held in Hong Kong, on January 12, 2017
The award is considered as the ace recognition internationally in the field of Knowledge Management.
The uniqueness of this award lies in the fact, that an organization can only be nominated by other external
experts and not by itself.
MAKE AWARD FOR AFCONS

BOARD OF DIRECTORSShapoor P. Mistry – Chairman
Pallon S. Mistry
N. D. Khurody
P. N. Kapadia
R. M. Premkumar
U. N. Khanna
R. M. Nentin (Ms.)
K. Subrahmanian - Vice Chairman & Managing Director
S. Paramasivan - Deputy Managing Director
Giridhar Rajagopalan – Executive Director (Technical)
Akhil Kumar Gupta – Executive Director (Operations)
AuDIT COmmITTEE mEmBERSN. D. Khurody - Chairman
P. N. KapadiaR. M. Premkumar
COmPANY SECRETARYP. R. Rajendran
AuDITORS
M/s. Deloitte Haskins & Sells, Chartered Accountants (ICAI registration no.117364W) M/s.HDS & Associates LLP, Chartered Accountants, (ICAI registration no. W100144)
REGISTERED OFFICE “AFCONS HOUSE” 16, Shah Industrial Estate, Veera Desai Road, Azad Nagar P.O. Andheri (West) Mumbai- 400 053 Website: www.afcons.com CIN : U45200MH1976PLC019335
Forty-First Annual General Meeting on 27th September, 2017 at 4.30 p.m. at “Afcons House”, 16, Shah Industrial Estate, Veera Desai Road, Andheri (West), Mumbai- 400 053.
AFCONS INFRASTRuCTuRE LImITED
BANKERSState Bank of India UCO BankOriental Bank of CommerceAxis Bank Ltd.Bank of IndiaDena BankBNP ParibasKotak Mahindra Bank Ltd.ICICI Bank Ltd.Union Bank of IndiaIDBI Bank Ltd.Standard Chartered BankYes Bank Ltd.Hongkong and Shanghai Banking Corporation Ltd.Export Import Bank of India
REGISTRARS & SHARE TRANSFER AGENTCameo Corporate Services LimitedSubramanian Building,1 Club House Road,Chennai-600002Tel. no.: 044-28460390Fax no.: 044-28460129Email id.: [email protected]
CONTENTS
Page Nos.
Boards’ Report 2
Management Discussion Analysis 19
Corporate Governance Report 23
Standalone Financial Statement 29
Consolidated Financial Statements 83
Financial Information of Subsidiary Companies
129

2
AFCONS INFRASTRUCTURE LIMITED
BOARDS’ REPORTDear members,Your Directors are pleased to present the Forty-First Annual Report together with the Audited Financial statement for the year ended 31st March 2017.1. FINANCIAL RESuLTS Pursuant to the notification datedFebruary 16, 2015 issuedby theMinistry ofCorporateAffairs, theCompanyhas adopted the
IndianAccountingStandards(“IndAS”)notifiedunder theCompanies(IndianAccountingStandards)Rules,2015witheffect from 1st April 2016. Financial Statement provides further explanation on the transition to Ind AS.
Particulars Consolidated Standalone` in crores ` in crores
31st march 2017 31st march 2016 31st march 2017 31st march 2016Total Income 6,405.72 4,474.18 5,842.59 4,309.47Profit/(Loss)beforeTax 206.85 147.82 113.86 157.61Provision for Taxation 53.83 69.72 38.38 69.67Excess/(short) provision for tax in respect of earlier years
0.32 0.23 0.36 0.21
Profit/(Loss)afterTax(beforeMinorityInterest) 152.70 77.87 75.12 87.73Minority Interest (1.53) (0.72) - -Profit/(Loss)fortheyear 154.23 78.59 75.12 87.73Balance brought forward from previous years 841.29 809.79 797.24 756.60Otheritemsclassifiedtoothercomprehensiveincome (3.66) (1.88) (3.66) (1.88)ProfitavailableforAppropriation 991.86 886.50 868.70 842.45Less: Appropriation(i) Interim Dividend on Equity 21.59 21.59 21.59 21.59(ii) Dividend on Preference Shares 0.05 0.05 0.05 0.05(ii) Tax on Dividend 4.40 4.40 4.40 4.40(iv) Transferred to Debenture Redemption Reserve (2.07) 19.17 (2.07) 19.17Balance Carried Forward to Balance Sheet 967.89 841.29 844.73 797.24
2. OPERATIONS(a) Standalone Results Your Company has achieved total income of ` 5,842.59 crores for the year compared to the previous year ` 4,309.47 crores
showingan increaseof35.58%.TheProfitbeforeTax for theyearwas` 113.86 crores compared to ` 157.61 crores in the previousyearresultingindecreaseof27.76%.TheProfitafterTaxfortheyearwas` 75.12 crores compared to ` 87.73 crores in the previous year resulting in decrease by 14.37%.
(b) Consolidated Results Your Company has achieved total income of ` 6,405.72 crores for the year compared to the previous year’s ` 4,474.18 crores
showing an increase of 43.17 %. The EBIDTA for the year was ` 646.71 crores compared to ` 550.66 crores in the previous year resulting in increase by 17.44%. The Consolidated Profit before Tax for the year was ` 206.85 crores compared to `147.82crores in thepreviousyear resulting inan increaseof39.93%.TheConsolidatedProfitafterTax for theyearwas ` 152.70 crores compared to ` 77.87 crores in the previous year resulting in increase by 96.10%. All intercompany transactions arenettedoutatthetimeofconsolidationandhence,theprofitsandrevenuesarereducedtothatextent.YourCompany’sOrderbook as on 31st March, 2017 was ` 19,173 crores.
(c) TherehasbeennomaterialchangesandcommentsaffectingthefinancialpositionoftheCompanywhichhaveoccurredbetweentheendofthefinancialyearoftheCompanytowhichthefinancialstatementsrelateandthedateoftheReport.
(d) During the year under review, the following major works were completed:i. Engineering, Procurement andConstruction of JettyModificationwork (Marine) atGCPTCL terminal Dahej ofGujarat
Chemical Port Terminal Company Limited.ii. Construction of Barge berth and Allied civil works for GSEZ Mineral port S.A. at Owendo, Gabon of GSEZ Mineral port S.A.iii. Civil Work of Dahej Expansion Phase lll A- LNG Storage Tanks of IHI Corporation.iv. Design Package CC-15: Part Design and Construction of elevated viaduct from Ch. Km. 26.739 to Km. 34.344 including
entry exit line to depot, elevated ramp at Kalkaji & special spans and Construction of six elevated stations of Phase-III of Delhi MRTS of Delhi Metro Rail Corporation Ltd..
v. Design Package CC-29: Part Design and Construction of elevated viaduct and Ramp length 2,654.44 m and Construction of two elevated stations of Phase-III of Delhi MRTS of Delhi Metro Rail Corporation Ltd.
vi. EPC contract for VOPAK Terminal Kandla CAPEX upgrade project phase I of CRL Terminals Pvt. Ltd.(e) During the year under review, the Company has secured the following major Contracts:
i. Construction of Single Standard Gauge Railway Line from Tema to Akosombo on Engineering, Procurement, Construction Basis of Ghana Railway Development Authority (GRDA) of ` 2,669 crores.
ii. Construction, completion and maintenance of roads, bridges, rainwater and sewage and other services to parts of Sheikh Jaber Al-Ahmad Al-Sabah Road including adjacent sectors of the 6th Ring Road and King Fahd Bin Abdul Aziz Road, Kuwait of Ministry of Public Works, kuwait of ` 2,084 crores.

3
AFCONS INFRASTRUCTURE LIMITED
iii. Projectontrafficde-congestioninLusakabyimprovingtheroadinfrastructureinLusakacityofZambiaofMinistryofLocalGovernment and Housing (MLGH), Zambia of ` 1,937 crores.
iv. Replacement of Superstructure of Existing 5.575 Km Long 4 lane M G Setu over Ganga River, Bihar, of Government of India MOR&TH awarded to the joint venture of the Company with OJSAC Sibmost. The Company’s share in the joint venture is ` 1,382 crores.
v. Construction of Annaram Barrage at Kaleshwaram Irrigation project across Godavari river in Telangana State of Government of Telangana Irrigation & CAD Department awarded to the Joint Venture of the Company with Vijeta construction Limited and P.E.S. Engineers Private Limited. The Company’s share in the Joint Venture is ` 1,210 crores.
vi. Design and Construction Underground Station and Tunnel for Ahmedabad Metro Rail Project Phase-I of Metro-Link Express for Gandhinagar and Ahmedabad (MEGA) Co. Limited of ` 775 crores.
vii. Life extension of Well Platform project, LEWPP - 2 of ONGC Limited awarded to the Consortium of the Company, Halani International Ltd. and Triune Energy Services Pvt. Ltd. The Company’s share in the Consortium is ` 690 crores.
viii. Entrances to Jewel of Creek Development in Diera, Dubai of RTA Dubai awarded to Afcons Construction Mideast, LLC Dubai (subsidiary of the Company) of ` 682 crores .
ix. Design and Construction of Viaduct in Reach-3 between Jhansi Rani Square and Lokmanya Nagar Stations from Ch 7825 m to Ch 18212 m on the East-West Corridor of Nagpur Metro Rail Project of Nagpur Metro Rail Corporation Limited of ` 477 crores.
x. Design and construction of works of UG station boxes at Sir Thiyagaraya College & Korrukupet, Package UAA - 08 of Chennai Metro Rail Corporation Ltd. of ` 411 crores.
xi. Project on port material handling of GAC Guinea Bauxite, awarded to Afcons Overseas Singapore Pte. Ltd (subsidiary of the Company) by Guinea Alumina Corporation of ` 381 crores.
xii. Design & construction of balance work of underground tunnel from Mayday Park to North Shaft of AG-DMS of Chennai Metro Railway Corporation Ltd. of ` 370 crores.
xiii. Extension of Water Transmission Pipeline from Lake Victoria Water Supply Scheme to Tabora, Nzega, and Igunga Towns Package III of The United Republic of Tanzania, Ministry of Water and Irrigation, awarded to Joint Venture of the Company and SMC Infrastructure Pvt. Ltd. The Company’s share in the Joint Venture is ` 257 crores.
xiv. Engineering, Procurement & Construction (EPC) Contract for Construction of Container Berth and Fishery Harbour at Vizhinjam, Kerala of HOWE Engineering Projects (India) Private Ltd. of ` 258 crores.
xv. Construction of 16th Berth for Multipurpose Cargo (other than Liquid) of M/s. Kandla Port Trust of ` 150 Crores.xvi. Construction of 14th Berth for Multipurpose Cargo (other than liquid /Container) of M/s. Kandla Port Trust of ` 138 crores.xvii. Tail Gas Treating Unit (TGTU) at DTA, Jamnagar, of Reliance Industries Ltd. of ` 62 crores.xviii. Construction of barge berth and allied civil works for GSEZ Mineral Port SA at Owendo (Gabon) of Gabon Special
Economic Zone Ports, S.A. awarded to Afcons Overseas Project Gabon SARL (Stepdown Subsidiary of the Company) of ` 47 crores.
xix. Shore protection works at Libreville, Gabon of Gabon Special Economic Zone Ports, S.A. awarded to Afcons Overseas Project Gabon SARL (Stepdown Subsidiary of the Company ) of ` 35 crores.
xx. Construction of Mine road Project, Gangra, Liberia of M/s. Arcelor Mittal of ` 26 crores.3. CREDIT RATING ICRAhasreaffirmedthelongtermratingof“AA/Stable”whichsignifieshighcreditqualityandshorttermratingof“A1+”whichreflects
highest credit quality. Dun&Bradstreethasassignedratingof“5A2”whichsignifiestheoverallstatusoftheCompanyisgood.4. DIVIDEND The Company has declared an Interim dividend to the equity shareholders @ 30% (i.e. ` 3/- per equity share of ` 10/- each) on the
paid-up capital of `71,97,02,380aggregatingtototaloutflowof` 25.99/- crores (i.e. Interim dividend amount of ` 21.59/- crores and dividend distribution tax of `4.40/-crores).YourDirectorsrecommendthesaidInterimdividendontheEquitysharesasfinaldividendforthefinancialyear2016-17.
The Directors recommend, for approval of members, dividend of 0.01% on the Convertible Preference Shares of the Company. The dividend,ifdeclared,wouldinvolveanoutflowof` 0.054 crores including dividend distribution tax.
5. SHARE CAPITAL There was no change in the Company’s Share Capital during the year under review.6. SuBSIDIARIES/ ASSOCIATE/ JOINT VENTuRE
(a) During the year under review, your Company has not incorporated any new Subsidiary Company.(b) Your Company had in the year 2012 incorporated a subsidiary Company in Qatar in the name of Afcons Overseas Construction
LLC to undertake Infrastructure Projects in Qatar. As there are no potential business opportunities of interest to the Company in Qatar, the Company has decided to wind–up Afcons Overseas Construction LLC and necessary process to this effect has been initiated during the year under review.
(c) Your Company had in the year 2014 incorporated a Subsidiary Company in the name of Afcons Saudi Constructions LLC to undertake Infrastructure Projects in Saudi Arabia. As there are no potential business opportunities of interest to the Company in Saudi Arabia, during the year under review, the Company has decided to wind–up Afcons Saudi Constructions LLC. The Company shall initiate the necessary process to this effect.
(d) PursuanttoprovisionsofSection129(3)oftheCompaniesAct,2013,astatementcontainingsalientfeaturesofthefinancialstatementsoftheCompany’ssubsidiaries,associatecompanyandjointventureinFormAOC-1isattachedtofinancialstatementof the Company.

4
AFCONS INFRASTRUCTURE LIMITED
(e) The consolidated financial statements presented by the Company include financial statement of the Subsidiaries preparedin accordancewith the applicable accounting standards. Pursuant to the provisions of section 136 of theAct, the financialstatementsoftheCompany,consolidatedfinancialstatementsalongwithrelevantdocumentsandseparateauditedaccountsinrespect of subsidiaries, are available on the website of the Company.
(f) There are no material changes in the nature of business of the Company or any of its subsidiaries or associates.7. CORPORATE GOVERNANCE Your Company, being a value driven organization, believes in coherent and self-regulatory approach in the conduct of its business
to achieve the highest levels of good corporate governance practices. Therefore, the Company in the interest of the Stakeholders voluntarily complies with the requirements of Corporate Governance. A Report on Corporate Governance is attached separately to this Annual Report. The details of Committees of the Board, their composition, terms of reference and details of such committee meetings held are provided in Corporate Governance Report.
8. mANAGEmENT DISCuSSION AND ANALYSIS REPORT The Company in the interest of the Stakeholders has voluntarily provided Management Discussion and Analysis Report for the year
under review in a separate section which forms part of this Annual Report.9. DIRECTORS AND KEY mANAGERIAL PERSONNELS OF THE COmPANY
(a) Mr. Pallon S. Mistry (DIN: 05229734) and Ms.Roshen M Nentin (DIN: 00004884), Non-Executive Directors of the Company retires by rotation at the ensuing Annual General Meeting of the Company and being eligible offer themselves for re-appointment.
(b) Pursuant to the recommendation of the Nomination and Remuneration Committee and subject to Members approval at the ensuing Annual General Meeting, the Board of Directors at its meeting held on 29th September, 2016 appointed Mr. Giridhar Rajagopalan (DIN: 02391515) as an Additional Director and Whole-time Director designated as Executive Director (Technical) and Mr. Akhil Kumar Gupta (DIN: 03188873) as an Additional Director and Whole-time Director designated as Executive Director (Operations) with effect from 1st October, 2016 and upto 30th June, 2019. As per section 161(1) to the Companies Act,2013,Mr.GiridharRajagopalanandMr.AkhilKumarGuptaholdsofficeuptothisAnnualGeneralMeeting.TheCompanyhas received notices from members of the Company in writing along with a deposit of ` 1,00,000/- each in terms of section 160(1) of the Companies Act, 2013 signifying its intention to propose the candidature of Mr. Giridhar Rajagopalan and Mr. Akhil Kumar Gupta as Directors of the Company.
(c) Pursuant to the recommendation of the Nomination and Remuneration Committee and subject to Members approval at the ensuing Annual General Meeting, the Board of Directors at its meeting held on 22nd June 2017 have re-appointed Mr.K.Subrahmanian as Vice Chairman and Managing Director and Mr.S.Paramasivan as Deputy Managing Director for a further period of 3 (three) years with effect from 1st July 2017 upto 30th June 2020 respectively.
(d) The current terms of appointment of Mr.N.D.Khurody (DIN-00007150) and Mr.R.M.Premkumar (DIN-00328942) as an Independent Directors, not liable to retire by rotation expires at the ensuing Annual General Meeting. The Board of Directors of the Company recommends to the members for the re-appointment of Mr. N.D.Khurody and Mr.R.M.Premkumar as Independent Directors of theCompany,notliabletoretirebyrotation,toholdofficeforatermof3(three)consecutiveyearsuptotheconclusionoftheForty-Fourth Annual General Meeting of the Company to be held in the calendar year 2020.
The Company has received notices from members of the Company in writing along with a deposit of ` 1,00,000/- each in terms of section 160(1) of the Companies Act, 2013 signifying its intention to propose the candidature of Mr. N.D.Khurody and Mr. R.M.Premkumar as Independent Directors of the Company, not liable to retire by rotation.
IntheopinionoftheBoardofDirectors,Mr.N.D.KhurodyandMr.R.M.PremkumarfulfillstheconditionsforappointmentastheIndependentDirectorsasspecifiedintheCompaniesAct,2013andtheRulesmadethereunderandisindependentofthemanagement.
(e) Details of proposal of the above appointment and re-appointment are mentioned in the Explanatory Statement attached to the Notice of the Forty-First Annual General Meeting.
10. POLICY ON DIRECTORS’ APPOINTmENT AND REmuNERATION The Company’s policy on Directors’ appointment and remuneration and other matters provided in Section 178(3) of the Companies
Act, 2013 has been enclosed as Annexure I to this Report.11. STATEmENT ON EVALuATION OF PERFORmANCE OF DIRECTORS Pursuant to the provisions of the Companies Act, 2013, the Board, based on recommendations of the Nomination and Remuneration
Committee, has carried out the annual performance evaluation of its own performance, Board Committees and that of Individual Directors of the Company. The performance evaluation of the Independent Directors was carried out by the entire Board. The performance evaluation of the Chairman and the Non-Independent Directors was carried out by the Independent Directors. The Directors expressed their satisfaction with the evaluation process.
12. DECLARATION FROm INDEPENDENT DIRECTORS The Board has received declarations from the Independent Directors as per the requirement of Section 149(7) of the Companies Act,
2013 that there has been no change in the circumstances which may affect their status as independent director during the year and the BoardissatisfiedthattheIndependentDirectorsmeetthecriteriaofindependenceasmentionedinSection149(6)oftheCompaniesAct, 2013.
13. mEETINGS OF BOARD Four(4)meetingsoftheBoardwereheldduringthefinancialyear.ThedetailsofthemeetingsoftheBoard,isgivenintheCorporate
Governance Report. The intervening gap between the meetings was within the period prescribed under the Companies Act, 2013.14. DIRECTOR’S RESPONSIBILITY STATEmENT PursuanttotherequirementunderSection134oftheCompaniesAct,2013,yourDirectorsherebystateandconfirmthat:
i. in the preparation of the annual accounts, the applicable accounting standards had been followed along with proper explanation relating to material departures;
ii. the directors had selected such accounting policies and applied them consistently and made judgments and estimates that are reasonableandprudentsoastogiveatrueandfairviewofthestateofaffairsofthecompanyattheendofthefinancialyearandoftheprofitofthecompanyforthatperiod;

5
AFCONS INFRASTRUCTURE LIMITED
iii. thedirectorshadtakenproperandsufficientcareforthemaintenanceofadequateaccountingrecordsinaccordancewiththeprovisions of Companies Act, 2013 for safeguarding the assets of the company and for preventing and detecting fraud and other irregularities;
iv. the directors had prepared the annual accounts on a going concern basis;v. the Directors, had devised proper systems to ensure compliance with the provisions of all applicable laws and that such systems
were adequate and operating effectively.15. QuALITY, HEALTH, SAFETY & ENVIRONmENT TheCompanyfirmlybelievesthatthepursuitofexcellenceisoneofthemostcriticalcomponentsforacompetitivesuccess.With
Quality, Health, Safety & Environment being an essential part of the Company’s policy, it strives to deliver services by maintaining the highest level of Quality, Health, Safety & Environmental Standards.
The policy of the Company is to conduct its construction business through an established Quality, Health, Safety & Environmental (QHSE) Management System, which aims to achieve customer satisfaction and in the process a continual improvement of Company’s competencies and competitiveness.
The Company is certified for ISO 9001:2008 for Quality Management System, ISO:14001:2004 for Environment ManagementSystem and OHSAS:18001:2007 for Occupation, Health & Safety Management Systems. All the three systems are well established, documented, implemented and maintained across the Company.
The Company has a commendable record in terms of safety at our various project sites and has received awards as well as appreciation letters from our clients, which are detailed below:i. American Society of safety engineers Kuwait Chapter has awarded ASSE GCC HSE Excellence Award 2017 Category: Silver for
Sulphur handling facility project – Kuwait.ii. British Safety Council - UK has awarded International Safety Award 2017 Category : Merit for Sulphur handling facility project – Kuwait.iii. British Safety Council - UK has awarded International Safety Award 2016 Category :Merit for Chennai Metro Rail Limited Pkg. 01.iv. The Royal Society for the Prevention of Accidents. - UK has awarded ROSPA Health and Safety Award 2016 for the Prevention
of Accidents Category :Gold for Chennai Metro Rail Limited Pkg. 01.v. World Safety Organization (WSO) - USA has awarded World Safety Organization (WSO) Award 2016 USA for Safety concern
company for Chennai Metro Rail Limited Pkg. 01.vi. National Safety Council of India has awarded Safety Awards 2016 for design and construction of Underground stations for
Chennai Metro Rail Limited Pkg. 01.vii. Confederation of Indian Industries - CII has awarded SHE Excellence Award 2016 (Western region) Category: Third Rank for
EPC contract for Vopak terminal Kandla.viii. Green-Tech Foundation has awarded Green-Tech Environment Award – 2017 Category:Gold for Agra Lucknow Express way
Pkg. 2 and Tunnel T 74 R – J& K. Thesemilestonesare the reflectionsof the strictHSEstandards followedat theworksite and the commitment ofAFCONS
management towards Quality, Health, Safety & Environment.16. AWARDS AND RECOGNITIONS During the year, the Company received the following awards and recognitions:
i. Most Admired Knowledge Enterprise Award (MAKE) in three categories:a. Global Independent Operating Unit (IOU) Most Admired Knowledge Enterprises (MAKE Award).b. ASIAN Most Admired Knowledge Enterprise Award 2016 (MAKE Award).c. India Most Admired Knowledge Enterprise Award 2016 (MAKE Award).
ii. The Construction Times Award for the Best Executed Highway Project of the Year for the Jammu-Udhampur Highway Project.iii. Awarded “Infrastructure Company of the Year Award” at the Construction Week Awards 2016.
17. AuDITOR AND AuDITOR’S REPORT(a) STATuTORY AuDITORS AND THEIR REPORT M/s. Deloitte Haskins & Sells, Chartered Accountants (ICAI Registration No.117364W) (“DHS”) had been the Joint Statutory
AuditoroftheCompanysincefinancialyear2007-08pursuanttotheirappointmentattheThirty-FirstAnnualGeneralMeeting(“AGm”) of the Company held on 27th September 2007. As per provision of section 139 of the Act read with rules made thereunder DHS have completed the maximum permitted term and their appointment is upto the conclusion of this AGM. On the recommendation of the Audit Committee, the Board of Directors at its meeting held on 22nd June, 2017, has proposed the appointment of, Price Waterhouse & Co Chartered Accountants LLP, Chartered Accountants (ICAI Firm Registration no. 012754N/N500016)asoneof theJointStatutoryAuditors inplaceofDHStoholdoffice fromtheconclusionof thisAnnualGeneral Meeting until the conclusion of the Forty-Sixth Annual General Meeting of the Company to be held in the year 2022.
HDS & Associates LLP, Chartered Accountants (ICAI registration no.W100144) were appointed as one of the Joint Statutory Auditors of the Company with the approval of the members at the Fortieth Annual General Meeting held on 29th September, 2016foraperiodoffiveyearscommencingfromtheFortiethAnnualGeneralMeetingtilltheconclusionoftheForty-FifthAnnualGeneralMeetingsubject to the ratificationbymemberseveryyear.As recommendedby theAuditCommittee, theBoardofDirectorshasproposedtheratificationofappointmentofHDS&AssociatesLLP,CharteredAccountants(ICAIregistrationno.W100144)asoneoftheJointStatutoryAuditorforthefinancialyear2017-18.
Price Waterhouse & Co Chartered Accountants LLP, Chartered Accountant (ICAI Firm Registration no. 012754N/N500016) and HDS&AssociatesLLP,CharteredAccountants(ICAIregistrationno.W100144)haveprovidedtheirrespectiveconsent,certificatesand declarations as required under Section 139 and 141 of the Companies Act, 2013 and Companies (Audit and Auditors) Rules, 2014.
TheStatutoryAuditor’sReporttothemembersontheAccountsoftheCompanyforthefinancialyearended31st March, 2017 doesnotcontainanyqualificationsorreservationoradverseremarkordisclaimer.

6
AFCONS INFRASTRUCTURE LIMITED
(b) SECRETARIAL AuDITORS AND THEIR REPORT Pursuant to Section 204 of the Companies Act, 2013 and the Companies (Appointment and Remuneration of Managerial
Personnel) Rules, 2014 the Company has appointed M/s. Parikh Parekh & Associates, Company Secretaries in Practice to undertaketheSecretarialAuditoftheCompanyforthefinancialyear2016-17.ThereportoftheSecretarialAuditorisenclosedas Annexure II to this Report.
TheSecretarialAuditor’sReportforthefinancialyearended31stMarch2017doesnotcontainanyqualificationsorreservationor adverse remark or disclaimer.
(c) COST AuDITOR In terms of Section 148 of the Companies Act, 2013 read with Companies (Cost records and audits) Rules, 2014, as amended,
your Company is covered under the ambit of mandatory cost audit. The Audit Committee recommended and the Board of Directors has re-appointed M/s. Kishore Bhatia & Associates, Cost
Accountant (Firm Registration no. 00294) as the Cost Auditors, to carry out the cost audit for the Company in relation to thefinancial year from1st April, 2017 to 31st March, 2018. The Company has received consent from M/s. Kishore Bhatia & Associatesfortheirre-appointment.NecessaryresolutionisproposedattheensuingAnnualGeneralMeetingforratificationoftheremunerationoftheCostAuditorforthefinancialyear2017-18.
18. INTERNAL FINANCIAL CONTROLS TheCompanyhasinplaceadequateinternalfinancialcontrolscommensuratewiththenature,size,complexityofthebusinessand
the business processes followed by the Company. Your Company has adopted accounting policies which are in line with the Indian Accounting Standards and Generally Accepted
Accounting Principles in India. Any changes in policies, if any, are approved by Audit Committee in consultation with the Statutory Auditor.
19. FIXED DEPOSIT Your Company did not invite or accept deposits from the public or shareholders under the Companies Act, 2013 and rules made
thereunder during the year under review.20. TRANSFER TO INVESTOR EDuCATION AND PROTECTION FuND (IEPF) During the year under review, there was no unclaimed dividend which was required to be transferred to Investor Education and
Protection Fund (IEPF) established by the Central Government.21. PARTICuLARS OF EmPLOYEES In terms of the Rule 5(2) of the Companies (Appointment and Remuneration of Managerial Personnel) Rules, 2014 as amended, the
name and other particulars of the employees are enclosed to this Annual Report.22. PARTICuLARS OF CONSERVATION OF ENERGY, TECHNOLOGY ABSORPTION, FOREIGN EXCHANGE EARNINGS AND
OuTGO(a) Conservation of energy Whenever you save energy, you not only save money, you also reduce the demand for such fossil fuels as coal, oil, and natural
gas. Less burning of fossil fuels also means lower emissions of gases such as CO2, CO, HFC etc., the primary contributor to global warming, and other pollutants.i. The Company is continuing its effort to convert all sites from fossil power to grid power thereby minimizing the carbon foot
print. This has been implemented to all sites as per feasibility. The total conversion of fossil power of 68.57 MVA by Grid power of
9.2 MVA considering all the sites. The reduction GHG (Green House Gas) emission by 34776 tonnes.ii. The steps taken by the company for utilizing alternate sources of energy - NILiii. The capital investment on energy conservation equipments - NIL
(b) Technology absorption1. KWH meter become mandatory in all New and old panels installed at site to monitor energy consumption parameter, the
work is in progress.2. i. Automatic power factor correction panels installed at all sites where grid power is available used for maximum utilization
of Energy. ii. Availing rebate in electricity bill as per contract agreement with Electricity Board. iii. ReplacementofFluorescentLightfixtureswithLEDlightfixturesatAfconsHousebuildingrenovationtosaveenergy
andenhancelifeoffixtures,workisinprogress.3. Importedtechnology(importedduringthelastthreeyearsreckonedfromthebeginningofthefinancialyear)-
A) Modifiedthecontrolsystemhardware,SCADASystem&PLC(AllanBradley)of200TPHHotMixplant(i.e.predosage,coldfeeder, dedusting, drydrum & mixer unit) at Lucknow sites.
B) Update CP-30 Schwing stetter Batching Plant PLC & Control panel from CP30V2 to CP30V3 version for Guinea site.(c) FOREIGN EXCHANGE EARNING AND OuTGO (Standalone)
(` in crores)Current year Previous year
Earnings 885.85 708.49Outgo 866.96 654.25
23. PARTICuLARS OF LOANS GuARANTEES OR INVESTmENTS The Company is exempt from the provisions of Section 186 except sub-section (1) pertaining to loans, guarantees and securities as
the Company is engaged in providing infrastructure facilities. In view of non-applicability of section 186 of the Companies Act, 2013, thedetailparticularsrequiredtobemadethereunderinthefinancialstatementsarenotapplicableinrelationtoloanmade,guaranteegiven or security provided. The particulars of investments covered under the provisions of Section 186 of the Companies Act, 2013 aredisclosedinthefinancialstatements.

7
AFCONS INFRASTRUCTURE LIMITED
24. RELATED PARTY TRANSACTIONS All relatedparty transactions thatwereenteredduring thefinancialyear2016-17wereonanarm’s lengthbasisandwere in the
ordinary course of business. All related party transactions are placed before the Audit Committee for approval. In terms of Section 134(3)(h) read with section 188(2) of the Companies Act, 2013, there are no material related party transactions
enteredbyyourCompanyduringtheyear,thatindividuallyortakentogetherwithprevioustransactionsduringafinancialyear,exceedthe prescribed limits under Rule 15(3) of Companies (Meeting of Board and its Powers) Rules, 2014, as amended. Accordingly, there beingnoinformationtobedisclosedinAOC-2format.Thedisclosureofrelatedpartytransactionsismadeinthefinancialstatementsof the Company.
The Company has out of abundant precautionary measure obtained Shareholders approval (vide postal ballot, result declared on 29th March, 2016) for entering the related party transactions which may exceed the thresholds prescribed under Rule 15 of Companies (Meeting of Board and its Powers) Rules, 2014 as amended.
25. EXTRACT OF THE ANNuAL RETuRN The details forming part of the extract of Annual Return as on 31st March 2017 in prescribed form MGT - 9 in accordance with Section
92 (3) of the Companies Act, 2013 read with Companies (Management and Administration) Rules, 2014 is enclosed as Annexure III to this Report.
26. VIGIL mECHANISm POLICY In accordance with section 177(9) of the Companies Act, 2013 read with rule 7 of the Companies (Meeting of Board and its Powers)
Rules, 2014, the Company has established a Vigil Mechanism Policy to provide a framework for responsible whistle blowing and for adequate safeguards against victimization of persons who use such mechanism. The said vigil mechanism policy is posted on the website of the Company.
There have been no cases of frauds reported to the Audit Committee/Board during the year under review.27. RISK mANAGEmENT The Company has in place a Risk Management Committee to promote a pro-active approach in reporting, evaluating and resolving
risksassociatedwiththebusinessandtoensuresustainablebusinessgrowthwithstability.Thereisnoriskidentifiedwhichintheopinion of the Board may threaten the existence of the Company.
28. CORPORATE SOCIAL RESPONSIBILITY The Company is committed to conduct business in an economically, socially and environmentally sustainable manner that is
transparent and ethical. The Company has framed Corporate Social Responsibility (CSR) Policy. A brief outline of the CSR Policy of theCompanyandtheinitiativesundertakenbytheCompanyonCSRactivitiesduringthefinancialyearisenclosedasAnnexure IV to this Report in the format prescribed in the Companies (Corporate Social Responsibility Policy) Rules, 2014. The policy is available on the website of the Company.
29. DISCLOSuRES uNDER SEXuAL HARASSmENT OF WOmEN AT WORKPLACE (PREVENTION, PROHIBITION AND REDRESSAL) ACT, 2013
In compliance with the provision of the Sexual Harassment of Women at Workplace (Prevention, Prohibition and Redressal) Act, 2013, the Company has in place Anti-Sexual Harassment Policy. A Committee has also been set up to redress complaints received regarding sexual harassment. All employees (permanent, contractual, temporary, trainees) are covered under this policy.
During the year under review, no complaints pertaining to sexual harassment were received by the Company.30. EmPLOYEE STOCK OPTION SCHEmE On 22nd December, 2006, the Company, had obtained shareholder approval for issue of 17,85,000 ESOP, of which the Company has
granted 721,150 stock options to its eligible employees at a price of ` 17/- per option in terms of Employees Stock Option Scheme 2006 of the Company. There is no ESOP in force since 31st March 2015 and Company has not granted any options during the Financial Year. As on 31st March 2017 there are no Options outstanding in any manner. Accordingly, there is no information to be disclosed under Rule 12(9) of the Companies (Share Capital and Debentures) Rules, 2014.
31. OTHER DISCLOSuRES/REPORTINGa) No disclosure or reporting is required in respect of the following items as there were no transactions on these items during the
year under review:• Issueofequityshareswithdifferentialrightsastodividend,votingorotherwise.• Buybackofshares• Issueofshares(includingsweatequityshares)toemployeesoftheCompanyunderanyscheme.• NeithertheManagingDirectornortheWhole-timeDirectorsoftheCompanyreceiveanyremunerationorcommissionfrom
any of its subsidiaries.b) Therearenosignificantandmaterialorderspassedbytheregulatororcourtsortribunalimpactingthegoingconcern.c) Thereisnomaterialchangeorcommitmentsafterclosureofthefinancialyeartillthedateofthereport.
32. ACKNOWLEDGEmENT Your Directors would like to acknowledge with gratitude the continued support and co-operation received by the Company from its
Clients, Bankers, Financial Institutions, Government authorities, Suppliers, Subcontractors, Employees and its valued Investors.
FOR AND ON BEHALF OF THE BOARD OF DIRECTORS
Place: Mumbai SHAPOOR P. mISTRYDate: 22nd June, 2017 CHAIRmAN

8
AFCONS INFRASTRUCTURE LIMITED
Annexure I to Boards’ Report NOmINATION AND REmuNERATION POLICY
I Introduction: In pursuance of the Company’s policy to consider human resources as its invaluable assets, to pay equitable remuneration to Executive Directors, Key Managerial Personnel (KMP) and the Senior Management Personnel# of the Company, to harmonize the aspirations
of human resources consistent with the goals of the Company and in terms of the provisions of the Companies Act, 2013 and Rules thereto as amended from time to time, this Nomination and Remuneration Policy has been formulated by the Committee.
# The expression Senior Management Personnel means personnels of the Company who are members of its core management team excluding Board of Directors comprising all members of the management one level below the executive directors, including functional heads.
II Objective and purpose of the Policy• ThePolicyshalladheretotheprovisionsoftheCompaniesAct,2013andRulestheretoasamendedfromtimetotime.• FormulatingthecriteriafordeterminingqualificationsandpositiveattributesofDirectors,KMPandSeniorManagementPersonnel.• To laydowncriteriaandtermsandconditionswithregardto identifyingpersonswhoarequalifiedtobecomeDirectorof the
Company.• TocarryoutevaluationoftheperformanceoftheDirectorsoftheCompany.• To determine remuneration based on theCompany’s size and financial position and trends and practices on remuneration
prevailing in peer companies of the Infrastructure business.III Appointmentcriteriaandqualifications:
• ThecandidateshouldbefreefromanydisqualificationsasprovidedunderSections164and167oftheCompaniesAct,2013;• The candidate should meet the conditions of being independent as stipulated under the CompaniesAct, 2013 in case of
appointment of an independent director;• TheCompanyshallnotappointorcontinuetheemploymentofanypersonasWhole-timeDirectorwhohasattainedtheageof
70 years. Provided that the term of the person holding this position may be extended beyond the age of 70 years with the approval
of shareholders by passing a special resolution based on the explanatory statement annexed to the notice for such motion indicatingthejustificationforextensionofappointmentbeyond70years.
IV Remuneration of Directors, KmP and Senior management Personnel The Nomination and Remuneration Committee shall ensure that:
• Thelevelandcompositionofremuneration isreasonableandsufficient toattract,retainandmotivatedirectorsof thequalityrequired to run the company successfully;
• Therelationshipofremunerationtoperformanceisclearandmeetsappropriateperformancebenchmarks;and• Theremunerationshallinvolveabalancebetweenfixedandincentivepayreflectingshortandlong-termperformanceobjectives
appropriate to the working of the company and its goals.• The remuneration (including payment of minimum remuneration) to Executive Directors shall be within the overall ceiling
prescribed under the Companies Act 2013. Within the said overall ceiling of remuneration, the Executive Directors will be entitled to avail of the perquisites under different heads as may be applicable to the other Senior Management Personnel of the Company. Such remuneration to the Executive Directors will be determined by the Committee and recommended to the Board for approval. The remuneration shall be subject to prior/post approval of the shareholders of the Company.
The annual increments to Executive Directors, will be decided by the Committee and/or the Board of Directors in its absolute discretion and will be merit based and will also take into account Company’s performance.
V Appointment / Removal/ Retirement and Evaluation of Performance of Directors• TheCommitteeshallidentifyandascertaintheintegrity,qualification,expertiseandexperienceofthepersonforappointmentas
Director and recommend to the Board his / her appointment.• Due to reasons for any disqualificationmentioned in theCompaniesAct, 2013, rulesmade thereunder or under any other
applicable Act, rules and regulations, the Committee may recommend, to the Board with reasons recorded in writing, removal of a Director.
• TheCommitteeshallevaluatetheperformanceoftheDirectoraspertherequirementoftheCompaniesAct2013.VI Appointment / Removal, Remuneration and Evaluation of Performance of KmP and Senior management Personnel
• Thequalificationattributes,termsandconditionsofappointmentandremovalofKMPandSeniorManagementPersonnelasalsotheir remuneration and the evaluation of their performance shall be as decided by the Vice Chairman & Managing Director in line with the Company’s policies as enumerated at points III above.
• TheNominationandRemunerationCommittee shall ratify suchappointment and removal ofKMPandSeniorManagementPersonnel.
VII Effective Date: This policy shall be effective from 1st April, 2014.VIII AmENDmENT: ThePolicyshallbemodifiedoramendedinwholeorinpart,atanytimeastheNominationandRemunerationCommitteedeemsfit.
SD/-K. Subrahmanian
Vice Chairman & managing Director

9
AFCONS INFRASTRUCTURE LIMITED
Annexure II to Boards’ ReportFORm No. mR-3
SECRETARIAL AuDIT REPORT FOR THE FINANCIAL YEAR ENDED 31ST mARCH, 2017(Pursuant to section 204 (1) of the Companies Act, 2013 and rule No. 9 of the Companies
(Appointment and Remuneration of Managerial Personnel) Rules, 2014)To,
The members,AFCONS INFRASTRuCTuRE LImITEDWe have conducted the secretarial audit of the compliance of applicable statutory provisions and the adherence to good corporate practices by Afcons Infrastructure Limited (hereinafter called the Company). Secretarial Audit was conducted in a manner that provided us a reasonable basis for evaluating the corporate conducts/statutory compliances and expressing our opinion thereon.
Basedonourverificationof theCompany’sbooks,papers,minutebooks,formsandreturnsfiledandotherrecordsmaintainedbytheCompany,theinformationprovidedbytheCompany,itsofficers,agentsandauthorizedrepresentativesduringtheconductofsecretarialaudit, theexplanationsandclarificationsgiven tousand the representationsmadeby theManagement,wehereby report that inouropinion, theCompanyhas,during theauditperiodcovering thefinancialyearendedon31st March, 2017, generally complied with the statutory provisions listed hereunder and also that the Company has proper Board processes and compliance mechanism in place to the extent, in the manner and subject to the reporting made hereinafter:
Wehaveexaminedthebooks,papers,minutebooks,formsandreturnsfiledandotherrecordsmadeavailabletousandmaintainedbytheCompanyforthefinancialyearendedon31st March, 2017 according to the provisions of:
(i) The Companies Act, 2013 (the Act) and the rules made thereunder;
(ii) The Securities Contract (Regulation) Act, 1956 (‘SCRA’) and the rules made thereunder;
(iii) The Depositories Act, 1996 and the Regulations and Bye-laws framed thereunder;
(iv) Foreign Exchange Management Act, 1999 and the rules and regulations made thereunder to the extent of Foreign Direct Investment, Overseas Direct Investment and External Commercial Borrowings;
(v) The following Regulations and Guidelines prescribed under the Securities and Exchange Board of India Act, 1992 (‘SEBI Act’):
(a) The Securities and Exchange Board of India (Substantial Acquisition of Shares and Takeovers) Regulations, 2011; (Not applicable to the Company during the audit period)
(b) The Securities and Exchange Board of India (Prohibition of Insider Trading) Regulations, 2015; (Not applicable to the Company during the audit period)
(c) The Securities and Exchange Board of India (Issue of Capital and Disclosure Requirements) Regulations, 2009; (Not applicable to the Company during the audit period)
(d) The Securities and Exchange Board of India (Employee Stock Option Scheme and Employee Stock Purchase Scheme) Guidelines, 1999 and The Securities and Exchange Board of India (Share Based Employee Benefits) Regulations, 2014; (Not applicable to the Company during the audit period)
(e) The Securities and Exchange Board of India (Issue and Listing of Debt Securities) Regulations, 2008; (Not applicable to the Company during the audit period)
(f) The Securities and Exchange Board of India (Registrars to an Issue and Share Transfer Agents) Regulations, 1993 regarding the Companies Act and dealing with client; (Not applicable to the Company during the audit period)
(g) The Securities and Exchange Board of India (Delisting of Equity Shares) Regulations, 2009; (Not applicable to the Company during the audit period) and
(h) The Securities and Exchange Board of India (Buyback of Securities) Regulations, 1998; (Not applicable to the Company during the audit period)
(vi) OtherlawsapplicablespecificallytotheCompanynamely:-
1. Contract Labour (Regulation and Abolition) Act, 1970
2. The Building and Other Construction Workers (Regulation of Employment and Conditions of Service) Act, 1996
3. Contract Labour (Regulation and Abolition).central rule, 1971
We have also examined compliance with the applicable clauses of the following:
Secretarial Standards issued by The Institute of Company Secretaries of India with respect to board and general meetings.
During the period under review, the Company has complied with the provisions of the Act, Rules, Regulations, Guidelines, standards etc. mentioned above.
We further report that:
The Board of Directors of the Company is duly constituted with proper balance of Executive Directors, Non-Executive Directors and Independent Directors. The changes in the composition of the Board of Directors that took place during the period under review were carried out in compliance with the provisions of the Act.
Adequate notice was given to all directors to schedule the Board Meetings. Agenda and detailed notes on agenda were sent at least sevendaysinadvance,andasystemexistsforseekingandobtainingfurtherinformationandclarificationsontheagendaitemsbeforethemeeting and for meaningful participation at the meeting.

10
AFCONS INFRASTRUCTURE LIMITED
Decisions at the Board Meetings were taken unanimously.
We further report that there are adequate systems and processes in the Company commensurate with the size and operations of the Company to monitor and ensure compliance with applicable laws, rules, regulations and guidelines.
We further report that during the audit period the following events occurred which had bearing on the Company’s affairs in pursuance of the above referred laws, rules, regulations, guidelines etc.:
a. Issuance of 8.60%, 1000, Unsecured Unlisted Rated Redeemable Non- Convertible Debentures of ` 10,00,000/- each aggregating to ` 100,00,00,000/-
b. Issuance of 8.65%, 1000, Unsecured Unlisted Rated Redeemable Non-Convertible Debentures of ` 10,00,000/- each aggregating to ` 100,00,00,000/-
For Parikh Parekh & Associates Company Secretaries
Sd/-Place: Mumbai Jigyasa N. VedDate: 22nd June, 2017 FCS No: 6488 CP No: 6018
This Report is to be read with our letter of even date which is annexed as Annexure A and Forms an integral part of this report.
‘Annexure A’To,
The Members
Afcons Infrastructure Limited
Our report of even date is to be read along with this letter.
1. Maintenance of secretarial record is the responsibility of the management of the Company. Our responsibility is to express an opinion on these secretarial records based on our audit.
2. We have followed the audit practices and process as were appropriate to obtain reasonable assurance about the correctness of the contentsofthesecretarialrecords.Theverificationwasdoneontestbasistoensurethatcorrectfactsarereflectedinsecretarialrecords. We believe that the process and practices, we followed provide a reasonable basis for our opinion.
3. WehavenotverifiedthecorrectnessandappropriatenessoffinancialrecordsandBooksofAccountsoftheCompany.
4. Where ever required, we have obtained the Management Representation about the Compliance of laws, rules and regulations and happening of events etc.
5. The Compliance of the provisions of Corporate and other applicable laws, rules, regulations, standards is the responsibility of management.Ourexaminationwaslimitedtotheverificationofprocedureontestbasis.
6. TheSecretarialAuditreportisneitheranassuranceastothefutureviabilityoftheCompanynoroftheefficacyoreffectivenesswithwhich the management has conducted the affairs of the Company.
For Parikh Parekh & Associates Company Secretaries
Sd/-Place: Mumbai Jigyasa N. VedDate: 22nd June, 2017 FCS No: 6488 CP No: 6018

11
AFCONS INFRASTRUCTURE LIMITED
Annexure III to Board’s ReportFORm NO. mGT-9
EXTRACT OF ANNuAL RETuRN AS ON THE FINANCIAL YEAR ENDED ON 31.03.2017[Pursuant to section 92(3) of the Companies Act, 2013 and Rule 12(1) of the Companies (Management and Administration) Rules, 2014]I. REGISTRATION AND OTHER DETAILS :
CIN U45200MH1976PLC019335Registration Date 21.11.1976Name of Company Afcons Infrastructure LimitedCategory/ Sub-Category of the Company Public Company limited by Share Capital / Indian Non-Government CompanyAddressoftheRegisteredofficeandcontactdetails Afcons House, 16, Shah Industrial Estate, Veera Desai Road, Azad Nagar,
P.O., Andheri West, Mumbai-400053Tel.:+912267191000Fax:+912226730027/1031/0047Email id: [email protected] Website : www.afcons.com
Whether Listed company NoName, Address and Contact details of Registrar and Transfer agent, if any
Cameo Corporate Service LimitedSubramanian Building, 1 Club House Road, Chennai-600002Tel.no.: 044-28460390Fax no.: 044-28460129Email id.: [email protected]
II. PRINCIPAL BuSINESS ACTIVITIES OF THE COmPANY : All the business activities contributing 10% or more of the total turnover of the company shall be stated :
Sr. No.
Name and Description of main products /services NIC Code of the product/service % of total turnover of the company
1. Construction Activities 41001, 42101, 42102, 42201, 100III PARTICuLARS OF HOLDING, SuBSIDIARY AND ASSOCIATE COmPANIES:
Sr.No.
Name and Address of the Company CIN /GLN Holding /Subsidiary /Associate
% of shares
held
Applicablesection
1 Shapoorji Pallonji and Company Private Limited70 Nagindas Master Road, Fort , Mumbai-400023
U45200MH1943PTC003812 Holding *51.75% 2(46)
2 Hazarat & Co. Private Limited Warden House, Sir P.M.Road, Mumbai-400023
U74999MH1982PTC028701 Subsidiary 100% 2(87)(ii)
3 Afcons Corrosion Protection Private LimitedAfcons House, 16,Shah Industrial Estate ,Veera Desai Road, Andheri West, Mumbai-400053
U28920MH1985PTC036876 Subsidiary 100% 2(87)(ii)
4 Afcons Offshore and Marine Services Private LimitedAfcons House, 16,Shah Industrial Estate, Veera Desai Road, Andheri West, Mumbai-400053
U11101MH1984PTC032807 Subsidiary 100% 2(87)(ii)
5 Afcons Construction Mideast LLCSuite #1203, Platinum Business Centre. Bagdad Street, Al Nadha, Dubai, UAE
- Subsidiary 49% 2(87)(i)
6 Afcons Gulf International Projects Services FZEP O Box 4835, Fujairah, UAE
- Subsidiary 100% 2(87)(ii)
7 Afcons Infrastructures Kuwait for Building, Roads and Marine Contracting WLL14th Floor, Unit A,Olympia Tower, Salmiya Gulf Road, Kuwait City,
- Subsidiary 49% 2(87)(i)
8 Afcons Overseas Construction LLCOfficeno.15,GroundFloor,AlEmadiBusinessCentre,Opp. Doha Cinema Signal, Najma, Doha ,Qatar
- Subsidiary 49% 2(87)(i)
9 Afcons Mauritius Infrastructure Limited4th Floor, C.A. Building,19, Poudriere Street, Port Louis, Mauritius
- Subsidiary 100% 2(87)(ii)
10 Afcons Overseas Singapore Pte Ltd.33, UBI Avenue 3, #08-68 Vertex, Singapore 408868
- Subsidiary 100% 2(87)(ii)
11 Afcons Infra Projects Kazakhstan LLPOffice#509-510,15SatpaevaAvenue,RepublicSquare,Almaty 050013, Republic of Kazakhstan
- Subsidiary 100% 2(87)(ii)
12 Afcons Sener LNG Construction Projects Pvt.Ltd. Afcons House, 16,Shah Industrial Estate, Veera Desai Road, Andheri West, Mumbai-400053
U45400MH2015PTC260889 Associate 49% 2(6)
13 Afcons Overseas Project Gabon SARLAncien Sobraga, Face entrée Clinique Union Medicale, Rez-de-Chaussee, Imeduble de Iimprimerie, BP20211, Libreville (Gabon)
- Subsidiary 100% 2(87)(ii)
14 Afcons Saudi Construction LLC.BO 16560, Riyadh 11474, Riyadh, KSA
- Subsidiary 95% 2(87)(i)
* Considered percentage of total share capital held along with subsidiary companies.

12
AFCONS INFRASTRUCTURE LIMITED
IV. SHAREHOLDING PATTERN (Equity Share Capital Breakup as percentage of Total Equity)(i) Category-wise Share Holding
Category of Shareholders No. of Shares held at the beginning of the year No. of Shares held at the end of the year % change during
the year
Demat Physical Total % of Total
Shares
Demat Physical Total % of Total
SharesA. Promoters(1) Indiana) Individual/ HUF - - - - - - - - -b) Central Govt. - - - - - - - - -c) State Govt.(s) - - - - - - - - -d) Bodies Corp. 49026389 21048429 70074818 97.37 49053819 21048429 70102248 97.40 0.03e) Banks /FI - - - - - - - - -f) Any Other - - - - - - - - -Sub-total (A) (1): 49026389 21048429 70074818 97.37 49053819 21048429 70102248 97.40 0.032) Foreigna) NRIs-Individuals - - - - - - - - -b) Other- Individuals - - - - - - - - -c) Bodies Corp. - - - - - - - - -d) Banks/FI - - - - - - - - -e) Any Other - - - - - - - - -Sub-total (A) (2) : - - - - - - - - -Total Shareholding of Promoter (A) = (A)(1) + (A)(2)
49026389 21048429 70074818 97.37 49053819 21048429 70102248 97.40 0.03
B. Public Shareholding(1) Institutionsa) Mutual Funds - - - - - - - - -b) Banks /FI - - - - - - - - -c) Central Govt. - - - - - - - - -d) State Govt(s) - - - - - - - - -e) Venture Capital Funds - - - - - - - - -f) Insurance Companies - - - - - - - - -g) FIIs - - - - - - - - -h) Foreign Venture Capital Funds
- - - - - - - - -
i) Others (specify) - - - - - - - - -Sub-total (B) (1) : - - - - - - - - -(2) Non- Institutionsa) Bodies Corp.i) Indian - 50000 50000 0.07 - 50000 50000 0.07 0.00ii) Overseas - - - - - - - - -b) Individualsi) Individual Shareholders holding nominal share capital upto ` 1 Lakh
95999 302101 398100 0.54 94901 273369 368270 0.51 -0.03
ii) Individual Shareholdersholding nominal sharecapital in excess of ` 1 Lakh
91145 57148 148293 0.21 91145 57148 148293 0.21 0.00
c) Others (specify)i) Director and their relatives 87798 19859 107657 0.15 107657 2400 110057 0.15 0.00ii) Trusts - 1191370 1191370 1.66 - 1191370 1191370 1.66 0.00Sub-total (B) (2) : 274942 1620478 1895420 2.63 293703 1574287 1867990 2.60 -0.03Total Public Shareholding (B) = (B)(1) +(B)(2)
274942 1620478 1895420 2.63 293703 1574287 1867990 2.60 -0.03
C. Shares held by Custodian for GDRs & ADRsPromoter and Promoter Group
- - - - - - - - -
Public - - - - - - - - -Total Custodian (C) - - - - - - - - -Grand Total(A) +(B) +(C)
49301331 22668907 71970238 100.00 49347522 22622716 71970238 100.00 -

13
AFCONS INFRASTRUCTURE LIMITED
(ii) Shareholding of Promoters
Sr.No.
Shareholder’s Name Shareholding at the beginning of the year Shareholding at the end of the year % change in share holding during
the year
No. of Shares
% of total Shares of the
Company
% of Shares Pledged/
encumbered to total shares
No. of Shares
% of total Shares of the
Company
% of Shares Pledged/
encumbered to total shares
1. SHAPOORJI PALLONJI & COMPANY PRIVATE LIMITED
49026389 68.13 - 49053819 68.16 - 0.03
2. FLOREAT INVESTMENTS PRIVATE LIMITED
13015929 18.08 - 13015929 18.08 - -
3. HERMES COMMERCE PRIVATE LIMITED
4016250 5.58 - 4016250 5.58 - -
4. RENAISSANCE COMMERCE PRIVATE LIMITED
4016250 5.58 - 4016250 5.58 - -
Total 70074818 97.37 - 70102248 97.40 - 0.03(iii) Change in Promoters’ Shareholding (please specify, if there is no change)
Sr. No.
Name of the Share holder Shareholding at the beginning of the year
Cumulative Shareholding during the year
No of shares
'% of total shares of the company
No of shares '% of total shares of the company
1. SHAPOORJI PALLONJI & CO PRIVATE LIMITEDAt the beginning of the year 01-Apr-2016 49026389 68.1203 49026389 68.1203Purchase 05-August-2016 2872 0.0039 49029261 68.1243Purchase 21-Oct -2016 120 0.0001 49029381 68.1245Purchase 9-Dec-2016 10480 0.0145 49039861 68.1390Purchase 23-Dec-2016 1578 0.0021 49041439 68.1412Purchase 24-Mar-2017 12380 0.0172 49053819 68.1584At the end of the Year 31-Mar-2017 49053819 68.1584 49053819 68.1584
2. FLOREAT INVESTMENTS PRIVATE LIMITEDAt the beginning of the year 01-Apr-2016 13015929 18.0851 13015929 18.0851At the end of the Year 31-Mar-2017 13015929 18.0851 13015929 18.0851
3. HERMES COMMERCE PRIVATE LIMITEDAt the beginning of the year 01-Apr-2016 4016250 5.5804 4016250 5.5804At the end of the Year 31-Mar-2017 4016250 5.5804 4016250 5.5804
4. RENAISSANCE COMMERCE PRIVATE LIMITEDAt the beginning of the year 01-Apr-2016 4016250 5.5804 4016250 5.5804At the end of the Year 31-Mar-2017 4016250 5.5804 4016250 5.5804
(iv) Shareholding Pattern of top ten Shareholders (other than Directors, Promoters and Holders of GDRs and ADRs)
Sr.No.
For Each of the Top 10 Shareholders Shareholding at beginning of the year
Cumulative Shareholding during the year
No. of Shares
% of total Shares of the company
No. of Shares
% of total Shares of the company
1. Afcons Shareholding (Holiday Assistance) Trust No.1Trustee: Homeyar Jal TavariaJT1 : Jimmy Jehangir ParakhJT2 : Firoze Kavash BathenaAt the beginning of the year 1-April-2016 50000 0.0694 50000 0.0694At the end of the year 31-March-2017 50000 0.0694 50000 0.0694
2. Afcons Shareholding (Holiday Assistance) Trust No.2Trustee: Homeyar Jal TavariaJT1 : Jimmy Jehangir ParakhJT2 : Firoze Kavash BathenaAt the beginning of the year 1-April-2016 50000 0.0694 50000 0.0694At the end of the year 31-March-2017 50000 0.0694 50000 0.0694

14
AFCONS INFRASTRUCTURE LIMITED
Sr.No.
For Each of the Top 10 Shareholders Shareholding at beginning of the year
Cumulative Shareholding during the year
No. of Shares
% of total Shares of the company
No. of Shares
% of total Shares of the company
3. Afcons Shareholding (Holiday Assistance) Trust No.3Trustee: Homeyar Jal TavariaJT1 : Jimmy Jehangir ParakhJT2 : Firoze Kavash BathenaAt the beginning of the year 1-April-2016 50000 0.0694 50000 0.0694At the end of the year 31-March-2017 50000 0.0694 50000 0.0694
4. Afcons Shareholding (Educational Assistance) TrustNo.1Trustee: Homeyar Jal TavariaJT1 : Jimmy Jehangir ParakhJT2 : Firoze Kavash BathenaAt the beginning of the year 1-April-2016 50000 0.0694 50000 0.0694At the end of the year 31-March-2017 50000 0.0694 50000 0.0694
5. Afcons Shareholding (Educational Assistance) TrustNo.2Trustee: Homeyar Jal TavariaJT1 : Jimmy Jehangir ParakhJT2 : Firoze Kavash BathenaAt the beginning of the year 1-April-2016 50000 0.0694 50000 0.0694At the end of the year 31-March-2017 50000 0.0694 50000 0.0694
6. Afcons Shareholding (Educational Assistance) TrustNo.3Trustee: Homeyar Jal TavariaJT1 : Jimmy Jehangir ParakhJT2 : Firoze Kavash BathenaAt the beginning of the year 1-April-2016 50000 0.0694 50000 0.0694At the end of the year 31-March-2017 50000 0.0694 50000 0.0694
7. Afcons Shareholding (Health Promotion) Trust No.1Trustee: Homeyar Jal TavariaJT1 : Jimmy Jehangir ParakhJT2 : Firoze Kavash BathenaAt the beginning of the year 1-April-2016 50000 0.0694 50000 0.0694At the end of the year 31-March-2017 50000 0.0694 50000 0.0694
8. Afcons Shareholding (Health Promotion) Trust No.2Trustee: Homeyar Jal TavariaJT1 : Jimmy Jehangir ParakhJT2 : Firoze Kavash BathenaAt the beginning of the year 1-April-2016 50000 0.0694 50000 0.0694At the end of the year 31-March-2017 50000 0.0694 50000 0.0694
9. Afcons Shareholding (Health Promotion) Trust No.3Trustee: Homeyar Jal TavariaJT1 : Jimmy Jehangir ParakhJT2 : Firoze Kavash BathenaAt the beginning of the year 1-April-2016 50000 0.0694 50000 0.0694At the end of the year 31-March-2017 50000 0.0694 50000 0.0694
10. Afcons Shareholding (General Assistance) Trust No.1Trustee: Homeyar Jal TavariaJT1 : Jimmy Jehangir ParakhJT2 : Firoze Kavash BathenaAt the beginning of the year 1-April-2016 50000 0.0694 50000 0.0694At the end of the year 31-March-2017 50000 0.0694 50000 0.0694

15
AFCONS INFRASTRUCTURE LIMITED
v) Shareholding of Directors and Key Managerial Personnel:
Sr. No.
Name of the Directors Shareholding at beginning of the year
Cumulative Shareholding during the year
No. of Shares
% of total Shares of the
company
No. of Shares
% of total Shares of the
company1. Mr. Shapoor P. Mistry
At the beginning of the year - - - -Date wise Increase/ Decrease in Shareholding during the year specifying the reasons for increase /decrease (e.g. allotment/ transfer/ bonus/sweat equity etc.,)
- - - -
At the end of the year - - - -2. Mr. Pallon S. Mistry
At the beginning of the year - - - -Date wise Increase / Decrease in Shareholding during the year specifying the reasons for increase/decrease (e.g. allotment/transfer/bonus/sweat equity etc.,)
- - - -
At the end of the year - - - -3. Mr. N. D. Khurody
At the beginning of the year - - - -Date wise Increase/ Decrease in Shareholding during the year specifying the reasons for increase /decrease (e.g. allotment/ transfer/ bonus/sweat equity etc.,)
- - - -
At the end of the year - - - -4. Ms. Roshen M Nentin
At the beginning of the year 3310 0.0045 3310 0.0045Date wise Increase/ Decrease in Shareholding during the year specifying the reasons for increase /decrease (e.g. allotment/ transfer/ bonus/sweat equity etc.,)
- - - -
At the end of the year 3310 0.0045 3310 0.00455. Mr. P. N. Kapadia
At the beginning of the year - - - -Date wise Increase/ Decrease in Shareholding during the year specifying the reasons for increase /decrease (e.g. allotment/ transfer/ bonus/sweat equity etc.,)
- - - -
At the end of the year - - - -6. Mr. R. M. Premkumar - - - -
At the beginning of the yearDate wise Increase/ Decrease in Shareholding during the year specifying the reasons for increase /decrease (e.g. allotment/ transfer/ bonus/sweat equity etc.,)
- - - -
At the end of the year - - - -7. Mr. U. N. Khanna
At the beginning of the year - - - -Date wise Increase/ Decrease in Shareholding during the year specifying the reasons for increase /decrease (e.g. allotment/ transfer/ bonus/sweat equity etc.,)
- - - -
At the end of the year - - - -8. Mr. K. Subrahmanian
At the beginning of the year 58208 0.0808 58208 0.0808Date wise Increase/ Decrease in Shareholding during the year specifying the reasons for increase /decrease (e.g. allotment/ transfer/ bonus/sweat equity etc.,)
- - - -
At the end of the year 58208 0.0808 58208 0.08089. Mr. S. Paramasivan
At the beginning of the year 26280 0.0365 26280 0.0365Date wise Increase/ Decrease in Shareholding during the year specifying the reasons for increase /decrease (e.g. allotment/ transfer/ bonus/sweat equity etc.,)
- - - -
At the end of the year 26280 0.0365 26280 0.036510. Mr. Giridhar Rajagopalan
At the beginning of the year 2400 0.0033 2400 0.0033Date wise Increase/ Decrease in Shareholding during the year specifying the reasons for increase /decrease (e.g. allotment/ transfer/ bonus/sweat equity etc.,)
- - - -
At the end of the year 2400 0.0033 2400 0.003311. Mr. Akhil Kumar Gupta
At the beginning of the year - - - -Date wise Increase/ Decrease in Shareholding during the year specifying the reasons for increase /decrease (e.g. allotment/ transfer/ bonus/sweat equity etc.,)
- - - -
At the end of the year - - - -

16
AFCONS INFRASTRUCTURE LIMITED
Sr. No.
For Each of the Directors and KmP Name of the Key managerial PersonnelShareholding at beginning
of the yearCumulative Shareholding
during the yearNo. of
Shares% of total Shares of the company
No. of Shares
% of total Shares of the company
1. Mr. P. R. RajendranAt the beginning of the year 3942 0.0054 3942 0.0054Date wise Increase/ Decrease in Shareholding during the year specifying the reasons for increase /decrease (e.g. allotment/ transfer/ bonus/sweat equity etc.,)
- - - -
At the end of the year 3942 0.0054 3942 0.00542. Mr. Ashok G. Darak 760 0.0010 760 0.0010
Date wise Increase/ Decrease in Shareholding during the year specifying the reasons for increase /decrease (e.g. allotment/ transfer/ bonus/sweat equity etc.,)
- - - -
At the end of the year 760 0.0010 760 0.0010V. INDEBTEDNESS Indebtedness of the Company including interest outstanding /accrued but not due for payment (` In Crores)
Secured Loan unsecured Loan Deposits Total IndebtednessIndebtednessatthebeginningofthefinancialyeari) Principal amount 1418.06 632.91 - 2050.97ii) Interest due but not paid - - - -iii) Interest accrued but not due - 8.98 - 8.98
Total (i + ii + iii) 1418.06 641.89 - 2059.95Changeinindebtednessduringthefinancialyear• Addition 743.24 2341.44 - 3084.68• Reduction 1008.72 2124.24 - 3132.96
Net Change -265.48 217.20 - -48.28Indebtednessattheendoffinancialyeari) Principal amount 1152.58 851.68 - 2004.26ii) Interest due but not paid - - - -iii) Interest accrued but not due - 7.41 - 7.41
Total (i + ii + iii) 1152.58 859.09 - 2011.67VI. REmuNERATION OF DIRECTORS AND KEY mANAGERIAL PERSONNELA. Remuneration to Managing Director, Whole-time Directors and /or Manager :A I. (` In Lacs)
Sr. No.
Particulars of Remuneration mr. K. Subrahmanian Vice Chairman &
managing Director
mr. S. Paramasivan Deputy managing
Director
Total Amount
1. Gross Salary(a) Salary as per provisions contained in section 17(1) of the
Income-tax Act, 1961252.78 202.10 454.88
(b) Value of perquisites u/s 17 (2) Income-tax Act, 1961 6.25 5.01 11.26(c) Profitsinlieuofsalaryundersection17(3)Income-taxAct,1961 - - -
2. Stock Option - - -3. Sweat Equity - - -4. Commission -
-as%ofprofit - - -- others, please specify - - -
5. Others, please specify - - -TOTAL (A I) 259.03 207.11 466.14
A II. (` In Lacs)
Sr. No.
Particulars of Remuneration mr. Giridhar Rajagopalan* - Executive Director
(Technical)
mr. Akhil Kumar Gupta* - Executive Director
(Operations)
Total Amount
1. Gross Salary(a) Salary as per provisions contained in section 17(1)
of the Income-tax Act, 196171.89 87.50 159.39
(b) Value of perquisites u/s 17 (2) Income-tax Act, 1961 0.16 0.16 0.32(c) Profitsinlieuofsalaryundersection17(3)Income-
tax Act, 1961- - -
2. Stock Option - - -3. Sweat Equity - - -4. Commission - - -5. -as%ofprofit - - -
- others, please specify - - -Others, please specify - - -
TOTAL (A II) 72.05 87.66 159.71TOTAL (A I + A II) 625.85
Ceiling as per the Act # # 775.01 # calculated@10%ofthenetprofitsoftheCompanyundersection198oftheCompaniesAct,2013. * from 1.10.2016 to 31.03.2017

17
AFCONS INFRASTRUCTURE LIMITED
B. Remuneration to other directors :
1. Independent Directors (` In Lacs)Sr. No.
Particulars of Remuneration Name of Directors Total Amountmr. N. D. Khurody mr. R. m.
Premkumarmr. P. N. Kapadia
a Fees for attending Board/ Committee meetings 4.00 4.25 6.50 14.75b Commission - - - -c Others, please specify - - - -
Total (1) 4.00 4.25 6.50 14.752. Other Non Executive Directors (` In Lacs)
Sr. No.
Particulars of Remuneration Name of Directors Total Amountmr. S. P. mistry mr. Pallon S.
mistryms. Roshen m
Nentinmr. umesh
Khannaa Fees for attending Board/
Committee meetings2.50 1.50 2.00 3.00 9.00
b Commission - - - - -c Others, please specify - - - - -
Total (2) 2.50 1.50 2.00 3.00 9.00TOTAL B =(1+2) 23.75
Total managerial Remuneration* 649.60Overall ceiling as per the Act^ 852.51
* Total Managerial Remuneration mean Total remuneration to Managing Director, Whole- time Director and Other Directors (being Total of A and B)
^Calculated@11%ofthenetprofitscalculatedundersection198oftheCompaniesAct,2013.
C. Remuneration to Key Managerial Personnel other than MD/Manager/WTD : (` In Lacs)Sr. No.
Particulars of Remuneration Key managerial Personnel Total amount mr. Ashok G. Darak,
Chief Financial Officer
mr. P. R. Rajendran, Company Secretary
1. Gross Salary(a) Salary as per provisions contained in section 17(1) of the
Income-tax Act, 196173.93 77.29 151.22
(b) Value of perquisites u/s 17 (2) Income-tax Act, 1961 0.32 0.21 0.53(c) Profitsinlieuofsalaryundersection17(3)Income-taxAct,
1961- - -
2. Stock Option - - -3. Sweat Equity - - -4. Commission
-as%ofprofit - - -- others, please specify - - -
5. Others, please specify - - -TOTAL C 74.25 77.50 151.75
VII. PENALTIES / PUNISHMENT / COMPOUNDING OF OFFENCES :
Type Section of Companies Act
Brief Description Details of Penalty / Punishment / Compounding
fees imposed
Authority [RD/NCLT /COuRT]
Appeal made, if any (give details)
A. COmPANYPenalty
NonePunishmentCompoundingB. DIRECTORSPenalty
NonePunishmentCompoundingC. OTHER OFFICERS IN DEFAuLTPenalty
NonePunishmentCompounding

18
AFCONS INFRASTRUCTURE LIMITED
Annexure IV to Boards’ Report
ANNuAL REPORT ON CORPORATE SOCIAL RESPONSIBILITY ACTIVITIES
1. A brief outline of the company's CSR policy, including overview of projects or programs proposed to be undertaken and a reference to the web-link to the CSR policy and projects or Programmes
: Afcons CSR Policy aims at implementing its CSR activities in accordance with section 135 of the Companies Act, 2013 and the Rules thereunder. The CSR Committee shall periodically review the implementation of the CSR. CSR Policy is available on the website of the Company www.afcons.com/ web link: http://www.afcons.com/afcons-csr-policy.html
2. The Composition of the CSR Committee : Mr. K. Subrahmanian – ChairmanMr. P. N. Kapadia – MemberMr. Umesh Khanna – Member
3. Average net profit of the Company for last threefinancialyears
: (` 0.71 crores)In terms of the definition of Net Profit provided in the Companies(CorporateSocialResponsibilityPolicy)Rules2014, theprofitsarisingoutofoverseasbrancheshavenotbeenconsidered,thereforetheprofitsfrom Indian operation of the company is showing a loss.
4. Prescribed expenditure (two per cent. of the amount as in item 3 above)
: Not ApplicableAs the Average Net Profit for the three preceding financial years isnegative
5. DetailsofCSRspentduringthefinancialyear2016-17.a) Totalamounttobespentforthefinancialyear;b) Amount unspent, if any;
::
Not ApplicableNot Applicable
c) Mannerinwhichtheamountspentduringthefinancialyearisdetailedbelow:
Sr.
No.
CSR project or activity identified
Sector in which the project is covered
Projects or Programs
(1) Local area or other
(2) Specify the state and district where projects or programs were undertaken
Amount outlay (budget) project or Programs wise
Amount spent on the project or Programs Sub Heads;
(1) Direct expenditure on projects or programs
(2) Overheads
Cumulative expenditure up to the reporting period
Amount Spent: direct or through implementing agency
1. Ashramshala School Project,
Education Schedule VII clause (ii)
1. Padsare, Raigad District
2. Maharashtra
` 12,85,613/- Direct Expenditure through corporate office
` 12,85,613/- through implementing agency
6. Incasethecompanyhasfailedtospendthetwopercentoftheaveragenetprofitofthelastthreefinancialyearsoranypartthereof,the company shall provide the reasons for not spending the amount in its Board Report – Not Applicable
7. The implementation and monitoring of Corporate Social Responsibility policy is in compliance with CSR Objectives of the Company.
Sd/-K. Subrahmanian
Vice Chairman & managing Director &
Chairman of the CSR Committee

19
AFCONS INFRASTRUCTURE LIMITED
mANAGEmENT DISCuSSION AND ANALYSISOVERVIEW OF THE GLOBAL ECONOmY
Globaleconomygrowthisfirmingaftertwoyearsofmarkedweaknessmainlyduetorecoveryinindustrialactivitywhichalsocoincidedwith a pickup in global trade. Global growth is projected to rise to 2.7% in 2017, as per World Bank. This projection is mainly supported by factorslikerisingglobaltradeandmanufacturingaswellasincreaseinconfidence.However,challengesforglobalgrowthincluderisingprotectionism,highpolicyuncertaintyandpossibilityoffinancialmarketdisruptions.
Advanced economies are expected to accelerate to 1.9% in 2017. In the United States, economic growth is expected to recover in 2017 after a slowdown in 2016 because of lower investments and exports. At the beginning of 2017, private investments have increased and labor market conditions have also improved but wage and productivity growth remain sluggish. It is expected that Infrastructure programs and tax cuts could lead to stronger growth in the short term. However, a rapid increase in policy interest rates and more restrictive immigration rulescouldreducethepotentialoutputgrowth.IntheEuroArea,accommodativemonetaryandfiscalpoliciesaswellasrecoveryinprivateinvestmentandexportgrowthwillelevatetheeconomicactivitybutpolicyuncertainties,Brexitnegotiationsandfinancialsectorfragilitiesmay dampen the prospects. In Japan, growth in economic activity has been picked up in the early 2017 mainly attributed to exports of IT related products and Capital goods as well as strengthening business investment. Further, it is expected that continued accommodative monetaryandfiscalpolicieswillimprovetheeconomicprospectsin2017.
In emerging markets and developing economies, growth is projected to accelerate to 4.1% in 2017 from 3.5% in 2016. Commodity importing economies–EastAsiaandPacific,andSouthAsiaareprojectedtoexperiencerobustgrowth,primarilydrivenbystrongdomesticdemand,Infrastructure construction, manufacturing sectors and services, and increasing global demand. In contrast, the growth outlook for countries with large numbers of commodity exporters is mixed. Growth in large commodity exporters such as Indonesia, Malaysia, Ukraine and Kazakhstanisfirmingsupportedbygradualmonetarypolicyeasingandhighercommoditypricesaswellasimprovedconfidence.Russiaand Brazil are recovering from recession as consumer demand has increased, recovery in industrial output and export growth. However, Brazilcontinuestostrugglewithrisingunemploymentandsizablefiscaladjustmentneeds.GrowthinEnergyexportingcountriesmainlyinthe Gulf Cooperation Council (GCC) lagged metal and agriculture exporters because of Oil production cuts, however the GCC will pick up modestly, as oil prices recover. In some countries in Sub Saharan Africa, Latin America and the Carribean, Europe and Central Asia, and EastAsiaandPacific,economicactivitieswereweakinearly2017duetodelayedpolicyadjustmenttolowcommodityprices.InChina,on account of robust domestic demand with moderate increase in imports, slower private investment and soft external demand, growth is projected to moderate to 6.5% in 2017. Overall, it is expected that emerging markets and developing economies is to strengthen in 2017 amidincreasingglobaltrade,strongdomesticdemand,risingcommoditypricesandimprovingconfidence.
OVERVIEW OF THE INDIAN ECONOmY
India’sGDPgrowthforFY2016-17achieved7.1%inlinewiththeofficialestimate.Further,itisexpectedtogoupto7.2%during2017-18 as per IMF’s World Economic Outlook. Series of stringent measures undertaken by Government in 2016-17 including demonetization, implementationofGSTwouldhelpinchangingthefaceofIndianeconomyandwillenhanceefficiencyoftheinternalgoodsandservicesmarket, increasing the tax base and improving tax compliance. Several initiatives like Make-in-India, Invest India, Start-Up India and e-biz Mission Mode Project under the national e-governance plan are facilitating investment and ease of doing business in the country. Government’s pro-investment attitude and forward movement on resolving various structural bottlenecks has helped improving the overall business environment. Union budget 2017 has opened up further new opportunities with a strong focus on economic growth supported by investments in critical infrastructure and innovation.
India continued its climb in World Economic Forum’s Global Competitive Rankings for second year in a row, with a jump to 39th position in 2016-17. Infrastructure, due to increased public spending by government and speeding up of approval processes, and Institutions were the main pillars for this improved ranking.
IndianeconomyhasstabilizedandnowboaststhehighestgrowthamongtheG20economiesonthebackofeffectivemonetaryandfiscalpolicies as well as lower oil prices. Recent reform efforts have concentrated on improving public institutions, opening up economy to foreign investorsandinternationaltrade,andincreasingtransparencyinthefinancialsystem.
INDuSTRY STRuCTuRE AND DEVELOPmENT
Indian Construction Industry is valued at around $126 billion and is the second largest employer providing employment to more than 40 million people. It is sixth-largest economic sector in India and accounts for approximately 8% of the country’s GDP. The construction industry ranks third in terms of direct, indirect and induced effects in all sectors of the economy and hence plays a pivotal role in the economic growth of the nation. About 50% of the demand in the construction comes from the Infrastructure sector. Number of programs werelaunchedthatwillguideindustryinvestmentsoverthenextfiveyears,suchasMakeinIndia,100SmartCities,SagarmalaProject,Industrial Corridors and the Atal Mission for Rejuvenation and Urban Transformation.
Union Budget 2017-18 has increased the allocation of funds for roads and highways, to National Highways Authority of India, from ` 57,676 crore in 2016-17 to ` 64,000 crore in 2017-18. A total of ` 3,96,135 crore will be invested for creating and upgrading infrastructure in FY 2017-18, out of which `2,41,387crorehasbeenallocatedforTransportationsector(Rail,Roads,Shipping).Thiswasfirsttimein92yearsthat a combined budget of both Railways & Union budget was presented.
SuRFACE TRANSPORT
ROAD
India has the second largest road network in the world, spanning a total of 5.23 million kms, comprising of National Highways, State Highways,DistrictandRuralroadsinIndia;andtransportover60%ofallgoodsand85%oftotalpassengertraffic.NationalHighways,withanetworkof1,00,087kms,accountsforonly1.7%oftotalroadnetworkbutcarries40%oftraffic.Roadsandinfrastructureindustryisexpected to be worth $ 19.2 Billion in FY 2016-17.

20
AFCONS INFRASTRUCTURE LIMITED
Business friendly initiatives and policy interventions led to record awards for building 15,948 kms of highways in 2016-17. A total of 8,241 km out of the 15,000 km of target set for national highways in 2016-17 has been constructed according to the Ministry of Road Transport and Highways. Although highest, this still fall below the government target of building roads of 41 kms per day. NHAI plans to build 50,000 km of roads worth ` 17 lakh crore by 2022 as a part of long-term goal of doubling the length of the national highways to 2,00,000 kms. Under the Pradhan Mantri Gram Sadak Yojana (PMGSY), 133 kms roads per day in 2016-17 were constructed against an average of 73 kms per day in the period of 2011-14. Government has planned to award contracts for building 25,000 km of national highways in FY 2017-18 and 30,000 km in FY 2018-19 to further augment road infrastructure.
In the Union Budget of 2017-18, ` 64,000 crore has been allocated for the development of national highways. ` 27,000 crore has been allocatedforruralroadsinFY2017-18.2000kmsofcoastalconnectivityroadshavebeenidentifiedforconstructionanddevelopmenttofacilitate better connectivity of ports and remote villages.
The Cabinet Committee on Economic Affairs (CCEA) has authorized the NHAI to monetize 75 publicly funded highway projects of value `35,600croreviatoll-operate-transfer(TOT)modewhichwill fetchadequatefundstofinanceroadconstructionof2,700kmlengthofroads. Under the TOT model, toll highways operated by the National Highways Authority of India (NHAI) will be leased out to entities for afixedperiod,whichwillcollecttollandoperatetheprojectforaspecifiedduration,inareturnforafee.TheMinistryofRoadTransportand Highways and NHAI plan to take up 82 highway development projects under the Bharatmala project, which would help in improving connectivity to both major as well as minor ports in the country. The Government of India plans to invest ` 3 lakh crore for developing 35,000kmofroadsacrossthecountryforeconomiccorridorsandfeederroutestoimprovefreightmovement,easetrafficbottlenecksandimprove inter-city connectivity. 100 % FDI is allowed under automatic route in Roads. Government has also received positive feedback from countries like Malaysia, Japan and foreign entities like JICA, ADB for funding the upcoming highway projects in India.
RAILWAYS
Indian Railways is the world’s fourth largest rail network, with a span of 119630 kms of tracks over a route of more than 67,000 kms. It is also the largest passenger carrier with over 23 million passengers per day and fourth largest freight carrier with more than 3 million tonne offreightperday,andthisfreighttrafficisexpectedtodoublebyFY2020.
Railways budget was merged with Union budget from FY 2017-18 to facilitate multi modal transport planning between railways, highways and inland waterways. In Union Budget 2017-18, the total capital and development expenditure of Railways has been pegged at ` 1.31 lakh crore, which includes ̀ 55,000 crore provided as budgetary support. Railways have taken up the target to commission 3,500 kms ofrailwaylinesthisfiscalyearandtoaward25stationsformodernizationandupgradation.Arailsafetyfundforpassengerswithacorpusof` 1lakhcrorewouldbecreatedoveraperiodoffiveyears.FinanceMinistrydeclaredtolistIRCON,IRCTC,IRFConthestockexchanges.Cabinet Ministry has also approved on formulating the Rail Development Authority (RDA), an independent railways regulator to facilitate more reforms in Indian Rail sector. An investment of more than ` 8 lakh crore has been planned for the railways sector during the period 2016-2020 to be deployed to facilitate high-speed rail connectivity, station redevelopment along with capacity expansion. The Indian Railways is making efforts to connect all the key metro cities with high speed trains under the Diamond Quadrilateral Project.
Government has allowed 100 % FDI in railway infrastructure segment which has opened up opportunities for participation in infrastructure projectssuchashigh-speedrailways,railwayconnectivitywithcoalminesandports,overheadelectrification,andsuburbancorridors.TwoDedicated Freight Corridors (DFC), one on the Western route (1504 km) and another on Eastern route (1840), have been fast-tracked, with ` 25,320 crore worth of contracts have been awarded in the last two years for the implementation of DFCs. Government has further proposedtotakeupNorth-South,East-WestandEastCoastcorridorthroughinnovativefinancingincludingPPP,EPC,etc.IndiaandJapanare collaborating on the Mumbai – Ahmedabad High Speed Rail project.
uRBAN INFRASTRuCTuRE
Mass Rapid Transit System has become a need of a day in many metro and tier -2 cities in India due to accelerating urbanization and growing concerns about pollution. India has been lagging behind other countries in terms of metro development for several decades. But recently there has been gradual shift in metro system space with government allowing 100 % FDI in metro rail, Make in India initiative, emphasis on MRTS/BRTS public transport. Government has approved the Union Urban Development Ministry’s proposal to build metro railsystemsin50cities,withPPPsandmunicipalbondsprovidingmuchofthefinancingandprivatecompaniesfillingconstructionandoperation roles. Currently in India, a metro rail system is operational in 8 cities – Delhi, Gurgaon, Kolkata, Mumbai, Jaipur, Bengaluru, Kochi and Chennai, and at various stages of development in many cities. In Union Budget 2017-18, Government has announced that a new Metro Rail policy would be announced in line to encourage greater private participation and investment in construction and operation of metro systems.Thispolicywouldfocusoninnovativemodelsofimplementationandfinancingaswellasstandardizationandindigenizationofhardware and software.
mARINE
India has 12 major ports, 6 each on eastern coast and western coast, and close to 200 non-major ports with about one-third of it being operational along the coastline of 7,517 km with potentially navigable waterways of 14,500 km. In India, close to 95 % trading by volume and almost 70 % by value is handled through maritime transport. Foreign Direct Investment (FDI) of up to 100 per cent allowed under the automatic route for port and harbor construction and maintenance projects.
Government has taken up several initiatives to develop the ports sector in India. National Waterways (NWs) Act 2016 came into effect from April 2016 to promote inland waterways trade. 37 NWs are planned to be taken up for development in next three years. New Berthing policy was introduced from August 2016 which aims to reduce berthing time and overall turn-around time of ships across major ports. The Cabinet also approved The Major Ports Bill, 2016 that advocates for greater autonomy to port boards. 6 new mega ports namely Vadhavan (Maharashtra), Enayam (Tamil Nadu), Cuddalore/ Sirkazhi (Tamil Nadu), Machllipatnam /Vodarevu (Andhra Pradesh), Paradip SouthSatellitePort(Odisha),Sagar(WestBengal)havebeenidentifiedtoadd400MTPAofcargohandlingcapacity.

21
AFCONS INFRASTRUCTURE LIMITED
Companies working in development, operation and maintenance of ports and inland waterways can claim income tax exemption and avail 10 year tax holiday. Sagarmala project envisages a port led economy through infrastructure development in ports and integration of ports with Special Economic Zones, port based Smart Cities, Industrial Parks, Warehouses, Logistics Parks and Transport Corridors. A total of 173projectsidentifiedundertheNationalPerspectivePlan(NPP)fortheSagarmalaProgramme,atanestimatedinvestmentof` 4 lakh crore, have been initiated during FY 2016 – 17.
HYDRO POWER
India has 44.5 GW of installed capacity in Hydro Power, roughly 13.5 % of total installed power capacity of India. In FY 2016 – 17, a total of1,659MWofHydropowergeneratingcapacitywasadded.Significanthydro-electriccapacityisunderconstructionandintheplanningstages, with developments in the Brahmaputra river basin in eastern India expected to result in several large power plants. India has also explored the possibility of developing joint hydro projects with neighboring countries like Nepal and Bhutan.
India has set-up an ambitious target of adding 175 GW of renewable energy capacity by 2022 and hydro power would play an important role in it. Currently 43 hydroelectric projects are under construction with a generating capacity of 11,928 MW. Government is planning to launch a new Hydro policy, which would club the under-construction and upcoming hydel projects under renewable energy category alongside solar and wind, and grant some tax soaps. Government has also fast-tracked hydropower projects worth $ 15 Billion in Kashmir, with Central Electric Authority (CEA) clearing three hydro projects at Sawalakot, Kiru and Kirthai.
OVERSEAS mARKET
The global infrastructure market is expected to grow from $ 3.1 trillion in 2016 to $ 4.2 trillion in 2020, with developing economies increasing their proportion in infrastructure spending from 62% in 2016 to 66% by 2020. The global infrastructure project pipeline stands at $ 14.1 trillion in 2017, with road, electricity, and powers sector collectively accounting for more than 50% of this pipeline.
Russian economy showed signs of recovery at the end of 2016 as global oil producers decided to lower output to support energy prices. LowoilpricesandtheeffectofWesternsanctionsimposedonRussiaover itsrole intheongoingconflict inUkrainehavesignificantlyhampered growth. Construction industry is set to recover with investments for 2018 FIFA World Cup and government plan to further strengthen power and rail sector.
South-East Asian countries such as Philippines, Myanmar, Malaysia, Indonesia has grown healthily in the past year at approximately 5 – 5.5%, driven primarily by a weak global commodity demand. The Duterte administration in Philippines plans to spend $17 billion for infrastructure construction projects in 2017. Indonesia’s construction industry continues to grow and the recent monetary policy easing willsupportthisexpansion,withbankfinancingbecomingmoreaffordable.InfrastructureconstructionhasbeenamajordriverforindustryexpansioninMalaysia,withCentralBankloweringitskeyinterestratesforthefirsttimeinsevenyearscitingvolatilityintheglobalfinancialmarkets. Myanmar economy growth slowed to 7% in 2016 against 8.5% in prior year due to subdued new investment in an election year as wellasheavyfloodingandlowercommoditypricesaffectingexports.Positiveinfrastructuregrowthprospectsstemfromthegovernment’sflagshipprograms,suchastheNationalTransportMasterPlan,NationalExportStrategy,andNationalElectrificationPlan.Thecountryisalso pushing the FDI, with revisions to law in 2012 allowing foreign investors to own up to 50% of joint ventures.
GrowthinMiddleEastandNorthAfricaregionisestimatedtohaveslowedto2.7%in2016,reflectingfiscalconsolidationinsomecountriesand oil production constraints in others. Overall economic activity has been hit by reductions in crude production in compliance with the November-December oil deal among major players. Growth slowed sharply in the Gulf Cooperation Council countries to 1.6% as oil sectorweaknessspread tonon-oil sectors.Despite loweroil prices,Qatareconomygrew in2016due to significant investment inmajor infrastructure projects related to 2022 World Cup and Qatar Nation Vision 2030 to offset the shortfall in oil revenues. However, sanctions imposed by Saudi Arabia led coalition may dampen the economic prospects, if not resolved. UAE’s economy should gain speed this year, with preparations for the Dubai 2020 World Expo giving domestic demand a shot in the arm. However, the oil sector will remain hampered by OPEC production cuts, which could extend beyond the original June deadline, while tighter monetary policy linked to monetary normalization in the U.S. will dampen economic activity.
Africa’s infrastructure gaps are the most prevalent in the world with less than 34% of rural population has access to roads and only 5% of agriculture is under irrigation. Nigeria’s GDP contracted by 1.5% in 2016. The country is heavily reliant on crude oil exports, and low global prices and militant attacks on the southern Delta have hindered export growth and slashed government revenues. Construction industry is in free fall with Central Bank of Nigeria banning foreign exchange of several materials required for construction. Ethiopia has experienced double digit growth since 2005 and would continue its growth trajectory in construction and development of industrial parks as it is the second largest African nation but the least urbanized one. However, with the current commodity prices, Africa will continue to be a funding driven growth.
Business Overview
Inthefinancialyear2016-17,theCompanybaggedordersworth` 13,939 crores. Increased level of competitive intensity continued in the sectors where the Company operates. The pending order book position of the company as on 31st March 2017 was ` 19,173 crores. Contribution of international orders to the order book has improved compared to the last year procurement. While our quality of orders is good and the order size is about 3 times of our turnover, we aim to further increase the order book size in coming years.
During the last decade, the Company has executed projects in Abu Dhabi, Dubai, Qatar, Mauritius, Madagascar, Oman, Yemen, Algeria, Jordan, Bahrain, Bangladesh, Kuwait and Liberia.
Thegrowthof theCompanyhasbeenwelldiversifiedacrossdifferentsegmentandgeographiesonthedesired lineandfocus.All thesegments are well balanced and there is no over dependence on any one sector or geography and we remain present in all segments with reasonable participation.

22
AFCONS INFRASTRUCTURE LIMITED
RISK AND CONCERNS
A. Global Events
• AfasterthanexpectedincreaseinUSinterestratesmayleadtocontractioningloballiquidity.
• ProtectioniststepsadoptedbyUSGovernmentandrisingprotectionismacrosseconomiesmayimpacttheglobaleconomy.
• Increaseincommoditypricesvolatilitymayhaveanadverseimpactontheglobalfinancialmarkets.
• DeteriorationofGeoPoliticalconditionsacrossglobe.
• Sustainedlowoilpricesforlongperiodcanresultinreducedearningforoilexportingcountriesandthisinturncouldlowerinfrastructurespending.
B. Domestic Events
• ImpactofimplementationofGST.
• Delaysinobtainingclearancesforexecutionandcommissioningofinfrastructureprojectscanresultinfinancialstress.
• Availabilityofskilledmanpowerandhighattritionlevelsofemployeesintheindustry.
• Increasingcompetitiveintensityacrosssegments,duetomushroomingofcompetitioninthelastfewyears,andslowdowninawardof projects.
OuTLOOK
The global capital investment climate continues to be on a slow revival path and will take some more time to pick up pace. Indian economy is one of the fastest growing economies among G20 and has achieved 7.1% GDP growth in FY 2016 – 17. This growth would further accelerate in FY 2017 – 18.
Your company will continue to follow a path of de-risking as a key component of its growth. We have been successful to build about 20% of turnover from the overseas market and would focus on to increase its share from overseas market.
Your company would continue to maintain its status as a prominent Transnational Infrastructure Company recognized for its business innovation, focused on Total Satisfaction and creating enhanced value for all its stakeholders.
INTERNAL CONTROL SYSTEmS AND THEIR ADEQuACIES
TheCompanyismaintaininganeffectivesystemofinternalcontrolforfacilitatingaccurate,reliableandspeedycompilationoffinancialinformation, safeguarding the assets and interests of the Company and ensuring compliance with all laws and regulations. The internal control system is managed through continuous internal audit by outside professionals who conduct audits of Project sites of the Company throughouttheyeartotesttheadequacyoftheinternalsystemsandsuggestcontinualimprovements.Allsignificantauditobservationsand follow up actions are reported to the Audit Committee along with Internal Audit reports and managements responses/replies thereon. The operational control exist through well laid out system of checks and balances and hierarchy of reporting from site level to central management groups to the senior management and the Directors.
HumAN RESOuRCES DEVELOPmENT
The Company HR Policy focuses on:
• TalentAcquisitionthroughadefinedtalentmanagementstrategyinalignmentwithbusinessgoalandtargets.
• ImpartingLearningandDevelopmenttoemployeesandpreparethemfortheircurrentandfutureroles.
• AdequateCompensationPackagecoupledwithIncentives,rewardsandrecognitions.
• Buildingacultureofinnovationandcreativityinconstructionprocess.
The Company continued to take numerous initiatives towards effective training and development for the employees at various levels. Some of the innovative initiatives includes Anugam-HR Induction program initiated through E-Learning platform, launching of web based knowledge management portals i.e. AFCONIANS and AFCONS GNOSIS, Classroom @ site and Classroom @ HO program as knowledge sharing platform, Whole Wellness Program, focused training sessions and workshops to continuously improve the skill sets of the employees. It is heartening to note that the Company has set new benchmark of training in the industry, in the globe.
The Company endeavour to provide its employees a professional, congenial, safe working environment coupled with opportunities for personal growth and development. In fact, this is one area where Company aspires to become a leader in the industry.
CAuTIONARY STATEmENT
The statement in Management Discussions and Analysis describing the Company’s operations and expectations are “forward looking statements”. Actual results may differ owing to environmental dynamics.

23
AFCONS INFRASTRUCTURE LIMITED
REPORT ON CORPORATE GOVERNANCEI. CORPORATE GOVERNANCE PHILOSOPHY TheCorporateGovernancephilosophystemsfromourbeliefthatcorporategovernanceisakeyelementinimprovingefficiencyand
growth. The Company is committed to sound corporate practices based on conscience, openness, fairness, professionalism and accountabilityinbuildingconfidenceofitsvariousstakeholdersinittherebypavingthewayforitslongtermsuccess.
II. BOARD OF DIRECTORSa. Composition As on 31st March, 2017 the Board of Directors of the Company comprised of 11 Directors out of which 4 are Executive Directors
and the remaining 7 are Non-Executive Directors. The Chairman of the Board is Non-Executive Director and the Board consists of3IndependentDirectors.AlltheDirectorspossesstherequisitequalification&experienceinIndustry,Management,Finance,LawandotheralliedfieldsenablingthemtocontributeeffectivelyintheircapacityasDirectorsoftheCompany.
b. Board meetings and Attendance During the year 2016-17, Four (4) Board Meetings were held on the following dates 27th June 2016, 29th September, 2016, 16th
December 2016 and 16th March 2017. The notice for the Board Meeting and the detailed agenda papers were circulated to all the Directors well in advance to enable them to attend and take an informed decision at the Meetings.
The minutes of the proceedings of each Board and committee meeting are properly recorded and entered into Minutes book. There is effective post meeting follow up, review and reporting process for decision taken by the Board.
NoneoftheDirectorsaremembersofmorethantenBoardlevelcommitteesnoraretheyChairmanofmorethanfivecommitteesin which they are members.
The name and category of the Directors on the Board, their attendance at the Board meetings during the year and at the last Annual General Meeting, as also the number of Directorship & Committee Memberships held by them in other Companies are given below:
Name of the Director Category Total no. of Board Meetings during the
year 2016-17
No. of other Directorship(s) in other Public co.1
No of Committee position held in other Public co.2
Whether attended last AGM
held on 29.09.2016
Held Attended Member Chairman Member
Mr. Shapoor P. Mistry Chairman, Non-Executive Director
4 4 4 - - Yes
Mr. N.D.Khurody Independent Director 4 3 1 - - NoMr. P.N.Kapadia Independent Director 4 4 4 1 5 YesMr. R.M.Premkumar Independent Director 4 4 4 - 2 YesMr. U.N. Khanna Non-Executive
Director4 3 1 - - Yes
Mr. Pallon S. Mistry Non-Executive Director
4 3 3 - - Yes
Ms. Roshen M. Nentin Non-Executive Director
4 4 - - - Yes
Mr. K.Subrahmanian Vice Chairman & Managing Director
4 4 - - - Yes
Mr. S.Paramasivan Dy. Managing Director 4 4 - - - YesMr. Giridhar Rajagopalan^^ Executive Director
(Technical)4 2 - - - No
Mr. Akhil Kumar Gupta^^ Executive Director (Operations)
4 2 - - - No
Note:^^ Mr. Giridhar Rajagopalan (DIN : 02391515) was appointed as an Additional Director and Whole-time Director designated
as Executive Director (Technical) with effect from 1st October 2016 for the period from 1st October 2016 to 30th June 2019 & Mr. Akhil Kumar Gupta (DIN : 03188873) was appointed as an Additional Director and Whole-time Director designated as Executive Director (Operations) with effect from 1st October 2016 for the period from 1st October 2016 to 30th June 2019 .
1. Excludes Directorship in association, Private Companies, Foreign Companies & Companies registered under section 8 of the Companies Act, 2013.
2. Chairmanships / Memberships of Audit Committee and Shareholders/ Investor’s Grievances Committee in other Public Companies have been considered.
III. AuDIT COmmITTEEa. The Audit Committee of the Company was constituted on 7th March, 2001.b. Terms of reference of the Audit Committee: In compliance with the provisions of Section 177 of the Companies Act, 2013 and the Rules made thereunder, the Board of
Directors of the Company at its meeting held on 24th June, 2014 amended the terms of reference of the Audit Committee which are as under:• OverseeingtheCompany’sfinancialreportingprocessandthedisclosureoffinancialinformation;• Recommendingtheappointmentandremovalofexternalauditorsandfixingofauditfees;• Reviewwithmanagementtheannualfinancialstatementsandauditor’sreportbeforesubmissiontotheBoard;• Reviewwithmanagement,externalandinternalauditors,theadequacyofinternalcontrols;

24
AFCONS INFRASTRUCTURE LIMITED
• Reviewandmonitortheauditor’sindependenceandperformance,andeffectivenessofauditprocess;• Approvaloranysubsequentmodificationoftransactionsofthecompanywithrelatedparties;• Scrutinyofinter-corporateloansandinvestments;• Valuationofundertakingsorassetsofthecompany,whereveritisnecessary;• Evaluationofinternalfinancialcontrolsandriskmanagementsystems;• Monitoringtheenduseoffundsraisedthroughpublicoffersandrelatedmatters;• Toobtainprofessionaladvicefromexternalsourcesandhavefullaccesstoinformationcontainedintherecordsofthecompany;• Tooverseethevigilmechanism;• InconsultationwiththeInternalAuditor,formulatethescope,functioning,periodicityandmethodologyforconductingthe
internal audit;• AllotherpowersanddutiesasperSection177oftheCompaniesAct2013andtheRulesmadethereunder.
C. Four Meetings were held during the year on the following dates: 27th June 2016, 29th September, 2016, 16th December 2016 and 16th March 2017.d. As on 31st March, 2017 composition of Audit Committee and particulars of meetings attended by the members of the Audit
Committee are given below:
Name of the Director Category Position No. of MeetingsHeld Attended
Mr. N.D.Khurody Independent Director Chairman 4 3Mr. P.N. Kapadia Independent Director Member 4 4Mr. R.M. Premkumar Independent Director Member 4 4
IV. NOmINATION AND REmuNERATION COmmITTEEa. The Committee was originally constituted as Remuneration Committee on 25th March, 2003. In compliance with the provisions of
Section 178 of the Companies Act, 2013 and the Rules made thereunder, the Board of Directors of the Company at its meeting held on 24th June, 2014 have renamed the said Committee as “Nomination and Remuneration Committee”.
b. Terms of Reference of the Nomination and Remuneration Committee, as amended by the Board of Directors of the Company at its meeting held on 24th June, 2014, are as under:• Toidentifypersonswhoarequalifiedtobecomedirectorsandwhomaybeappointedinseniormanagement.• TorecommendtotheBoardtheappointment/removaloftheDirectorsorseniormanagementpersonnel.• TocarryoutevaluationofeveryDirector’sperformance.• Toformulatethecriteriafordeterminingqualifications,positiveattributesandindependenceofaDirector.• TorecommendtotheBoardapolicy,relatingtotheremunerationforthedirectors,keymanagerialpersonnelandother
senior employees.• All otherpowersandauthoritiesasprovidedunder theprovisionsofScheduleVandotherapplicableprovisionof the
Companies Act, 2013 and the Rules made thereunder and any amendment thereof, if any, in granting the approval of remuneration to Whole Time Directors and the Managing Directors of the Company.
c. As on 31st March, 2017 the composition of Committee and particulars of meetings attended by the members of Nomination and Remuneration Committee are given below:
Name of the Director Category Position No. of MeetingsHeld Attended
Mr. N.D.Khurody Independent Director Chairman 2 1Mr. P.N. Kapadia Independent Director Member 2 2Mr. Shapoor P. Mistry Non-Executive Director Member 2 2
d. Two Meetings were held during the year on the following dates: 27th June, 2016 and 29th September, 2016e. Remuneration Policy Remuneration policy of the Company is designed to create a high performance culture. It enables the Company to attract, retain
and motivate employees to achieve results. Remuneration to Executive Directors has been decided based on the years of experience and contribution made by the respective
Executive Directors and is consistent with the industrial practice. As regards payment of sitting fees to non-executive directors, the same has been within the limit allowed in terms of the Companies Act, 2013.
f. DetailsofRemunerationpaidtoDirectorsduringthefinancialyear2016-17:i. Executive Directors (` in Lacs)
Name of Director Basic Salary PF/SA Perquisites Total RemunerationMr. K. Subrahmanian 49.50 13.36 203.68 266.55Mr. S. Paramasivan 41.25 11.14 161.25 213.64Mr. Giridhar Rajagopalan * 11.26 3.04 60.83 75.13Mr. Akhil Kumar Gupta * 11.25 3.04 76.45 90.74
113.26 30.58 502.21 646.06* For the period from 1.10.16 to 31.03.17

25
AFCONS INFRASTRUCTURE LIMITED
The number of stock options granted till date to the Executive Directors is as under:
Name of the Director Stock options granted till date
Mr. K.Subrahmanian 35,040
Mr. S.Paramasivan 26,280
ii. Non-Executive Directors The Non-Executive Directors were not paid any remuneration except sitting fees for attending the meetings of the Board of
Directors and / or Committees thereof. The details of the sitting fees paid to the Non-Executive directors are as under:
Name of the Director Sitting Fees (` in Lacs) Equity Shareholding in the CompanyNo. of Shares % holding
Mr. Shapoor P. Mistry 2.50 - -Mr. N.D.Khurody 4.00 - -Mr. P.N. Kapadia 6.50 - -Mr. U.N.Khanna 3.00 - -Mr. R.M.Premkumar 4.25 - -Mr. Pallon S. Mistry 1.50 - -Ms. R. M. Nentin 2.00 3,310 0.0046Total 23.75 3,310 0.0046
The Company does not have any material pecuniary relation or transactions with its Non-Executive Directors.
V. Corporate Social Responsibility Committeea. In accordance with the requirement of Section 135 of the Companies Act, 2013 and the Rules made thereunder, the Board of
Directors of the Company at its meeting held on 24th June, 2014 have constituted a Corporate Social Responsibility Committee.
b. The terms of reference of the Corporate Social Responsibility Committee are as under :
• FramingofCorporateSocialResponsibility(CSR)PolicyandrecommendingBoardforapproval.
• RecommendingspendingofCSRFund.
• Implementation&monitoringofCSRPolicy.
• RecommendamendmentsandimprovementsintheCSRPolicyanditsimplementation.
c. As on 31st March, 2017 the Composition and particulars of meetings attended by the members of Corporate Social Responsibility Committee is as under:
One Meeting was held during the year on 27th June, 2016.
Name of the Director Category Position No. of MeetingsHeld Attended
Mr. K.Subrahmanian Vice Chairman & Managing Director Chairman 1 1Mr. P.N.Kapadia Independent Director Member 1 1Mr. Umesh Khanna Non-Executive Director Member 1 -
VI. Stakeholders Relationship Committee:a. The Committee was constituted on 28th November 2006 as Shareholders / Investor’s Grievances Cum Share Transfer Committee.
The Board of Director at its meeting held on 24th September 2008 renamed the said Committee as Shareholders / Investor’s Grievance Cum Share Transfer cum ESOP Share Allotment Committee. Thereafter the Committee was again renamed at the meeting of the Board of Directors held on 12th March, 2014 as Shareholder/Investors’ Grievance cum Share Transfer cum Shares Allotment Committee (“STC”). The Board of Directors again at the meeting held on 22nd March, 2016 has renamed the committee as Stakeholders Relationship Committee (“SRC”).
b. The broad terms of reference of SRC is as under:
• ToallotequitysharestotheemployeesexercisingtheESOPoptionsgrantedundertheESOPScheme2006oftheCompany.
• ToissueandallotEquityShares,ConvertiblePreferenceshares(fully/party/optionallyconvertible).
• Toexercisesuchpowersandtodoallsuchact,deed,mattersandthingsinconnectionwiththeissueandallotmentoftheEquityShares,ConvertiblePreferenceshares(fully/party/optionallyconvertible)astheCommitteedeemsfitandproper.
• ToapprovetransferoftheEquityandPreferenceSharesoftheCompanyandfurtherdelegatesuchpowerstotheRegistrarfor the Transfer of Shares of the Company.
• ToallotDebenturestotheInvestor.
• Toapprove/recordTransfer,Dematerialisation/RematerialisationofDebentures,issueofduplicateDebentureCertificates,issueofnewDebenturecertificatesonsplit/Consolidation.
• Tolookintomatterspertainingtotheshareholdersandinvestorscomplaintsliketransferofshares,non-receiptofbalancesheet, non- receipt of declared dividends, redress complaints of Debentureholder pertaining to the issue including non-receipt of interests, etc.
• TodecideonallothermattersrelatedtoDebentures.

26
AFCONS INFRASTRUCTURE LIMITED
• Toinvestigateintoanymatter inrelationtoareasspecifiedaboveorreferredtoitbytheBoardofDirectorsandforthispurpose will have full access to information contained in the records of the Company.
• TodeterminetheconversionpriceoftheConvertiblePreferenceshares(fully/party/optionallyconvertible).
• Tosub-delegateanyofthesaidpowersandauthoritiestoanyoftheCommitteemembersand/ortoanyotherpersonastheCommitteedeemsfit.
• TopassanyresolutionbyCirculation.
c. Five meetings were held during the year on the following dates:
27th June, 2016, 6th September, 2016, 24th October, 2016, 27th January, 2017 & 23rd February, 2017.
d. As on 31st March, 2017 the Composition and attendance of members at the meetings of the Stakeholders Relationships Committee was as under:
Name of the Director Category Position No. of MeetingsHeld Attended
Mr. P.N.Kapadia Independent Director Chairman 5 4Mr. U. N. Khanna Non-Executive Director Member 5 4Mr. S.Paramasivan Deputy Managing Director Member 5 5
e. NameandDesignationoftheComplianceOfficer
Mr.P.R.Rajendran,CompanySecretaryistheComplianceofficeroftheCompany.
f. Status of Investor’s Complaints
Duringthefinancialyearalltheletters/complaintsreceivedbytheRegistrarandShareTransferAgenthavebeenredressedandthere were no complaints pending with the Company / Registrar and Share Transfer Agent. All the valid share transfers requests received during the year were duly attended to and processed in time. There was no valid request pending for share transfer as on 31st March 2017.
VII. Independent Directors meeting The meeting of the Independent Directors of the Company was held on 16th March, 2017. As per the provisions of Section 149 read
with Schedule IV of the Companies Act, 2013, at the said meeting, the Independent Directors discuss & review the performance of the chairman, Non-independent Directors, Non–Executive directors and executive directors & review the performance of the Board of Directors as a whole. All the independent Directors were present at the Meeting.
VIII. COmmITTEE OF DIRECTORS The Committee of Directors (“COD”) was reconstituted on 27th June, 2016 with revised powers for delegation of certain powers of the
Board of Directors to Committee of Directors which are of routine & urgent nature can be approved/ passed by the said Committee.
i. The broad terms of reference of COD is as under:
a. opening and closing of bank accounts of the company.
b. Issuance of Power of Attorneys for tax, administration, legal and project bidding, execution purposes.
c. Authorisation to representative of the Company for representation before statutory authorities.
d. Availing of credit facilities (including amendment thereof) from bank [s.179(3)].
e. Giving of loans and providing of guarantees [s.179(3)].
f. Incorporating Company in India or Overseas.
g. SettingupofBranchoffice,representativeofficeandlicensingoffice.
h. Availing corporate internet banking with online transaction rights from banks for our routine corporate transactions.
i. Other transactions of routine nature which cannot be referred to the next Board meeting.
ii. Two meetings were held during the year on the following dates:
22nd August, 2016 & 28th November, 2016
iii. As on 31st March, 2017 the Composition and attendance of members at the meetings of the Committee of Directors is as under:
Name of the Director Category Position No. of MeetingsHeld Attended
Mr.N.D. Khurody Independent Director Chairman 2 2Mr.P.N.Kapadia Independent Director Member 2 2Mr.Umesh Khanna Non-Executive Director Member 2 1Mr. S Paramasivan Deputy Managing Director Member 2 2
IX. GENERAL BODY mEETINGSa. The details of the Annual General Meetings (AGM) held in the last 3 years:
For Financial Year ended Location Date of AGM Time31.03.2016 registeredofficeoftheCompany 29.09.2016 4.30 p.m31.03.2015 registeredofficeoftheCompany 30.09.2015 4.30 p.m31.03.2014 registeredofficeoftheCompany 30.09.2014 4.30 p.m

27
AFCONS INFRASTRUCTURE LIMITED
b. Details of Extra Ordinary General Meeting (EGM) held in the last 3 years:
Date of EGM Location Time21.03.2014 registeredOfficeoftheCompany 11.30 a.m.
c. Details of the special resolutions passed at the Annual General Meeting in the previous 3 years:
40th AGM dated 29.09.2016
i. Consent of the company for raising ` 200 Crores (Rupees Two Hundred Crores only) through issue of Unsecured, Redeemable, Unlisted, Rated, Non-Convertible Debentures (“NCDs”) on private placement basis.
ii. Consent of the Company under section 180(1)(a) of the Companies Act, 2013 to create charges, mortgages or any other hypothecation on movable or non-movable assets of the Company not exceeding ` 20,000 Crores.
39th AGM dated 30.09.2015
i. Consent of the company for raising ` 200 Crores (Rupees Two Hundred Crores only) through issue of Unsecured, Redeemable, Unlisted, Rated, Non-Convertible Debentures (“NCDs”) on private placement basis.
ii. consent of the company to Increase in limits of investments in other bodies corporate under Section 186 and all other applicable provisions, if any, of the Companies Act, 2013 (“the Act”) to invest/acquire the securities of any body corporate by way of subscription/purchase or otherwise, upto a sum of ` 100 crores, exceeding 60% of its paid-up share capital, free reserves and securities premium account or 100% of its free reserves and securities premium account whichever is more.
38th AGM dated 30.09.2014
i. Consent of the Company for re-appointment of Mr. K. Subrahmanian as Vice Chairman & Managing Director for the period of 3 years 1.7.14 to 30.06.17.
ii. Consent of the Company for re-appointment of Mr. S. Paramasivan as Deputy Managing Director for the period of 3 years 1.7.14 to 30.06.17.
iii. Consent of the Company under section 180(1)(c) of the Companies Act, 2013 to borrow money from Company’sbankersoranyforeignbankorfromanyotherfinancialinstitutionnotexceeding` 3,000 Crores at any time.
iv. Consent of the Company under section 180(1)(a) of the Companies Act, 2013 to create charges, mortgages or any other hypothecation on movable or non-movable assets of the Company not exceeding ` 15,000 Crores.
d. Details of special resolutions passed at Extraordinary General Meeting (EGM)
EGM dated 21.03.2014
a) Consent to issue 10,00,00,000 0.01 % Fully and Compulsorily Convertible, Non-Cumulative, Non- Participatory Preference Shares having face value of ` 10/- each aggregating to ` 100,00,00,000/- to Shapoorji Pallonji and Company Limited.
b) (i) Consent of the Company to make/give loan(s) / guarantees/ advances / deposits and to make investments in excess of the limits under section 372A, to direct / indirect subsidiary of the Company set up / likely to be set up in Singapore and Kazakhstan subject to an aggregate limit of ` 1,500 Crores and
(ii) make investment in equity shares of Tata Consultancy Services Limited subject to the limit of ` 100 Crores.
X. DISCLOSuRESa. Therewerenomateriallysignificantrelatedpartytransactionsduringthefinancialyear2016-17thatmayhavepotentialconflict
with the interests of the Company at large. The detail of the related party transactions as per IND AS 24 are included in the notes to accounts forming part of the Annual Report.
b. Although the Company is not listed with any stock Exchange, it voluntarily complies with Corporate Governance requirement of the Listing Agreement.
XI mEANS OF COmmuNICATIONa. The Company has its own website and all the vital information relating to the Company is displayed on the website. Address of
the website is www.afcons.com.
b. Annual Report containing Inter alia, Audited Annual Report, Financial Statements, Directors Report, Auditors Report and other important information is circulated to the members and others entitled thereto.
XII. GENERAL SHAREHOLDERS INFORmATIONa. Annual General Meeting
Date : 27th September, 2017Time : 4.30 pmVenue : Afcons House, 16, Shah Industrial Estate,
Veera Desai Road, Azad Nagar, P.O.,Mumbai 400 053.
b. Financial Year : 1st April to 31st Marchc. Date of Book Closure : 20th September, 2017 to 27th September, 2017 (both days Inclusive)d. ISIN No. : INE101I01011

28
AFCONS INFRASTRUCTURE LIMITED
e. Registrar & Share Transfer Agent : Cameo Corporate Service LimitedSubramanian Building,1 Club House Road, Chennai-600002Tel. No.:044-28460390Fax No.:044-28460129Email id.: [email protected]
f. CIN : U45200MH1976PLC019335g. Tel : +912267191000h. Fax : +912226730027/1031/0047i. Email id : [email protected]. website : www.afcons.com
XIII SHAREHOLDING PATTERN AS ON 31st mARCH, 2017
Sr. No. Category No. of Shares % of total1. Promoter's holding
Indian Promoters -Bodies Corporate 70102248 97.40Sub total (1) 70102248 97.40
2. Non Promoters HoldingCompanies / Bodies Corporate 50000 0.07Employees Trust 1191370 1.66Directors & their Relatives 107657 0.15Employees / Retired Employees / General Public 518963 0.72
Subtotal (2) 1867990 2.60Total (1+2) 71970238 100.00
XIV DISTRIBuTION OF SHAREHOLDING AS ON 31st mARCH, 2017
Number of Shares ' Shareholders SharesNumber % of Total Number % of Total
1 to 100 68 14.2259 5551 0.0077101 to 500 270 56.4854 72691 0.1010501 to 1000 35 7.3222 27694 0.03851001 to 2000 21 4.3933 32064 0.04462001 to 3000 8 1.6736 19787 0.02753001 to 4000 10 2.0921 34893 0.04854001 to 5000 6 1.2552 27084 0.03765001 to 10000 22 4.6025 154216 0.214210001 & above 38 7.9498 71596258 99.4804Total 478 100.0000 71970238 100.0000
XV. Address for Correspondence: Afcons Infrastructure Limited
Afcons House,16, Shah Industrial Estate,
Veera Desai Road, Andheri (W), Mumbai – 400053
Tel.no.:67191000, Fax.no.:6730027/26731031
Website: www.afcons.com

29
AFCONS INFRASTRUCTURE LIMITED
INDEPENDENT AUDITOR’S REPORTTo The Members of AFCONS INFRASTRUCTURE LIMITEDReport on the Standalone Ind AS Financial StatementsWe have audited the accompanying standalone Ind AS financial statements of AFCONS INFRASTRUCTURE LIMITED (“the Company”), which comprise the Balance Sheet as at 31st March, 2017, and the Statement of Profit and Loss (including Other Comprehensive Income), the Cash Flow Statement and the Statement of Changes in Equity for the year then ended, and a summary of the significant accounting policies and other explanatory information, which includes ten Joint Operations.Management’s Responsibility for the Standalone Ind AS Financial StatementsThe Company’s Board of Directors is responsible for the matters stated in Section 134(5) of the Companies Act, 2013 (“the Act”) with respect to the preparation of these standalone Ind AS financial statements that give a true and fair view of the financial position, financial performance including other comprehensive income, cash flows and changes in equity of the Company in accordance with the accounting principles generally accepted in India, including the Indian Accounting Standards (Ind AS) prescribed under section 133 of the Act.This responsibility also includes maintenance of adequate accounting records in accordance with the provisions of the Act for safeguarding the assets of the Company and for preventing and detecting frauds and other irregularities; selection and application of appropriate accounting policies; making judgments and estimates that are reasonable and prudent; and design, implementation and maintenance of adequate internal financial controls, that were operating effectively for ensuring the accuracy and completeness of the accounting records, relevant to the preparation and presentation of the standalone Ind AS financial statements that give a true and fair view and are free from material misstatement, whether due to fraud or error.Auditor’s ResponsibilityOur responsibility is to express an opinion on these standalone Ind AS financial statements based on our audit.In conducting our audit, we have taken into account the provisions of the Act, the accounting and auditing standards and matters which are required to be included in the audit report under the provisions of the Act and the Rules made thereunder.We conducted our audit of the standalone Ind AS financial statements in accordance with the Standards on Auditing specified under Section 143(10) of the Act. Those Standards require that we comply with ethical requirements and plan and perform the audit to obtain reasonable assurance about whether the standalone Ind AS financial statements are free from material misstatement.An audit involves performing procedures to obtain audit evidence about the amounts and the disclosures in the standalone Ind AS financial statements. The procedures selected depend on the auditor’s judgment, including the assessment of the risks of material misstatement of the standalone Ind AS financial statements, whether due to fraud or error. In making those risk assessments, the auditor considers internal financial control relevant to the Company’s preparation of the standalone Ind AS financial statements that give a true and fair view in order to design audit procedures that are appropriate in the circumstances. An audit also includes evaluating the appropriateness of the accounting policies used and the reasonableness of the accounting estimates made by the Company’s Directors, as well as evaluating the overall presentation of the standalone Ind AS financial statements.We believe that the audit evidence obtained by us and the audit evidence obtained by other auditors in terms of their reports referred to in the Other Matters paragraph below, is sufficient and appropriate to provide a basis for our audit opinion on the standalone Ind AS financial statements.OpinionIn our opinion and to the best of our information and according to the explanations given to us, and based on the consideration of reports of other auditors on separate financial statements of the joint operations referred to in the Other Matters paragraph below, the aforesaid standalone Ind AS financial statements give the information required by the Act in the manner so required and give a true and fair view in conformity with the accounting principles generally accepted in India, of the state of affairs of the Company as at 31st March, 2017, and its profit, total comprehensive income, its cash flows and the changes in equity for the year ended on that date.Emphasis of MatterWe draw attention to Note 42 (a) of the financial statements regarding legal opinion received by the Company that the interest free advances made towards financing the unincorporated joint operations do not attract Section 186 of the Companies Act, 2013 for the reasons stated therein. The outstanding amount of such advances given by the Company (without giving effect of elimination) aggregates to ` 901.12 crores as on 31st March, 2017 (As at 31st March, 2016: ` 683.10 crores; As at 1st April, 2015 ` 333.60 crores).Our opinion is not modified in respect on this matter.Other Mattersa) We did not jointly audit the financial statements of 8 joint operations included in the standalone Ind AS financial statements of the
Company whose financial statements reflect total assets of ` 1666.57 crores as at 31st March, 2017 and total revenues of ` 876.58 crores for the year ended on that date, as considered in the standalone Ind AS financial statements. The financial statements of these joint operations have been audited by either of us in our individual capacity or jointly with other auditor or by other auditors whose reports have been furnished to us by the management and our opinion in so far as it relates to the amounts and disclosures included in respect of these joint operations and our report in terms of subsection (3) of Section 143 of the Act, in so far as it relates to the aforesaid joint operations, is based solely on the report of such other auditors.
b) The comparative financial information of the Company for the year ended 31st March, 2016 and the transition date opening balance sheet as at 1st April, 2015 included in these standalone Ind AS financial statements, are based on the statutory financial statements prepared in accordance with the Companies (Accounting Standards) Rules, 2006 audited by one of us jointly with the predecessor auditor whose report for the year ended 31st March, 2016 and 31st March, 2015 dated 27th June, 2016 and 20th August, 2015 respectively expressed an unqualified opinion on those standalone financial statements, and have been restated to comply with Ind AS. Adjustments made to the previously issued said financial information prepared in accordance with the Companies (Accounting Standards) Rules, 2006 to comply with Ind AS have been audited by us.
c) The comparative financial information for the year ended 31st March, 2016 and the transition date opening balance sheet as at 1st April, 2015 in respect of 8 joint operations included in this Standalone Ind AS financial statements prepared in accordance with the Ind AS have been audited by either of us in our individual capacity or jointly with other auditors or by other auditors.

30
AFCONS INFRASTRUCTURE LIMITED
d) We did not audit the financial statements of 2 joint operations whose financial statements for the year ended 31st March, 2017, reflects total assets of ` 137.74 crores as at 31st March, 2017 and total revenue of ` 3.79 crores, as considered in the standalone Ind AS financial statements. These financial statements are unaudited and have been furnished to us by the management and our opinion on the standalone Ind AS financial statements, in so far as it relates to the amounts and disclosures included in respect of these joint operations, is based solely on such unaudited financial statements. In our opinion and according to the information and explanations given to us by the Management, these financial statements are not material to the Company.
Our opinion on the Ind AS standalone financial statements and our report on Other Legal and Regulatory Requirements below is not qualified in respect of above matters.
Report on Other Legal and Regulatory Requirements1. As required by Section 143(3) of the Act, based on our audit and on the consideration of the reports of other auditors on the separate
financial statements of the joint operations, referred to in the Other Matters paragraph above we report, to the extent applicable that:a) We have sought and obtained all the information and explanations which to the best of our knowledge and belief were necessary
for the purposes of our audit.b) In our opinion, proper books of account as required by law have been kept by the Company so far as it appears from our
examination of those books and the reports of the other auditors.c) The Balance Sheet, the Statement of Profit and Loss including Other Comprehensive Income, the Cash Flow Statement and
Statement of Changes in Equity dealt with by this Report are in agreement with the relevant books of account.d) In our opinion, the aforesaid standalone Ind AS financial statements comply with the Indian Accounting Standards prescribed
under section 133 of the Act.e) On the basis of the written representations received from the directors as on 31st March, 2017 taken on record by the Board
of Directors, none of the directors is disqualified as on 31st March, 2017 from being appointed as a director in terms of Section 164(2) of the Act.
f) With respect to the adequacy of the internal financial controls over financial reporting of the Company, and its joint operations which is company incorporated in India and the operating effectiveness of such controls, refer to our separate Report in “Annexure A”. Our report expresses an unmodified opinion on the adequacy and operating effectiveness of the Company’s internal financial controls over financial reporting.
g) With respect to the other matters to be included in the Auditor’s Report in accordance with Rule 11 of the Companies (Audit and Auditors) Rules, 2014, as amended, in our opinion and to the best of our information and according to the explanations given to us:i. The Company has disclosed the impact of pending litigations on its financial position in its standalone Ind AS financial
statements; Refer note 30 to the financial statements.ii. The Company has made provision, as required under the applicable law or accounting standards, for material foreseeable
losses, if any, on long-term contracts including derivative contracts; Refer note 19 (b) to the financial statements.iii. There has been no delay in transferring amounts, required to be transferred, to the Investor Education and Protection Fund
by the Companyiv. The Company has provided requisite disclosures in the standalone financial statements as regards its holding and dealings
in Specified Bank Notes as defined in the Notification S.O. 3407(E) dated the 8th November, 2016 of the Ministry of Finance, during the period from 8th November, 2016 to 30th December, 2016. Based on audit procedures performed and the representations provided to us by the management we report that the disclosures are in accordance with the books of account maintained by the Company and as produced to us by the Management. Our comments are restricted to the activities carried out by the Company and exclude matters relating to the unincorporated joint operations in which the Company holds interest. The financial statements of the unincorporated joint operations are not subject to audit under the Companies Act, 2013, therefore their auditors have not reported on matters specified in Notification S.O. 3407(E) dated the 8th November, 2016 of the Ministry of Finance.
2. As required by the Companies (Auditor’s Report) Order, 2016 (“the Order” / “CARO 2016”) issued by the Central Government in terms of Section 143(11) of the Act, we give in “Annexure B” a statement on the matters specified in paragraphs 3 and 4 of the Order. Our comments are restricted to the activities carried out by the Company and exclude matters relating to the unincorporated joint operations in which the Company holds interest. The financial statements of the said unincorporated joint operations are not subject to audit under the Companies Act, 2013, and their auditors have not reported on matters specified in paragraphs 3 and 4 of the Order.
For DELOITTE HASKINS & SELLS For HDS & Associates LLPChartered Accountants Chartered Accountants(Firm Registration No. 117364W) (Firm Registration No. W100144)
Nilesh Shah Shridhar G.S.Partner Partner(Membership No. 49660) (Membership No. 126653)
MUMBAI, MUMBAI,Dated: June 22nd, 2017 Dated: June 22nd , 2017

31
AFCONS INFRASTRUCTURE LIMITED
ANNEXURE “A” TO THE INDEPENDENT AUDITOR’S REPORT(Referred to in paragraph 1(f) under ‘Report on Other Legal and Regulatory Requirements’ section of our report of even date)Report on the Internal Financial Controls Over Financial Reporting under Clause (i) of Sub-section 3 of Section 143 of the Companies Act, 2013 (“the Act”)We have audited the internal financial controls over financial reporting of AFCONS INFRASTRUCTURE LIMITED (“the Company”) as of 31st March, 2017 in conjunction with our audit of the standalone Ind AS financial statements of the Company for the year ended on that date which includes internal financial controls over financial reporting of a joint operation which is a company incorporated in India.Management’s Responsibility for Internal Financial ControlsThe Company’s management is responsible for establishing and maintaining internal financial controls based on the internal control over financial reporting criteria established by the Company considering the essential components of internal control stated in the Guidance Note on Audit of Internal Financial Controls Over Financial Reporting issued by the Institute of Chartered Accountants of India. These responsibilities include the design, implementation and maintenance of adequate internal financial controls that were operating effectively for ensuring the orderly and efficient conduct of its business, including adherence to respective company’s policies, the safeguarding of its assets, the prevention and detection of frauds and errors, the accuracy and completeness of the accounting records, and the timely preparation of reliable financial information, as required under the Companies Act, 2013.Auditor’s ResponsibilityOur responsibility is to express an opinion on the Company’s internal financial controls over financial reporting based on our audit. We conducted our audit in accordance with the Guidance Note on Audit of Internal Financial Controls Over Financial Reporting (the “Guidance Note”) issued by the Institute of Chartered Accountants of India and the Standards on Auditing prescribed under Section 143(10) of the Companies Act, 2013, to the extent applicable to an audit of internal financial controls. Those Standards and the Guidance Note require that we comply with ethical requirements and plan and perform the audit to obtain reasonable assurance about whether adequate internal financial controls over financial reporting was established and maintained and if such controls operated effectively in all material respects.Our audit involves performing procedures to obtain audit evidence about the adequacy of the internal financial controls system over financial reporting and their operating effectiveness. Our audit of internal financial controls over financial reporting included obtaining an understanding of internal financial controls over financial reporting, assessing the risk that a material weakness exists, and testing and evaluating the design and operating effectiveness of internal control based on the assessed risk. The procedures selected depend on the auditor’s judgement, including the assessment of the risks of material misstatement of the financial statements, whether due to fraud or error.We believe that the audit evidence we have obtained and the audit evidence obtained by the other auditors of the joint operations which are companies incorporated in India, in terms of their reports referred to in the Other Matters paragraph below, is sufficient and appropriate to provide a basis for our audit opinion on the Company’s internal financial controls system over financial reporting.Meaning of Internal Financial Controls Over Financial ReportingA company’s internal financial control over financial reporting is a process designed to provide reasonable assurance regarding the reliability of financial reporting and the preparation of financial statements for external purposes in accordance with generally accepted accounting principles. A company’s internal financial control over financial reporting includes those policies and procedures that (1) pertain to the maintenance of records that, in reasonable detail, accurately and fairly reflect the transactions and dispositions of the assets of the company; (2) provide reasonable assurance that transactions are recorded as necessary to permit preparation of financial statements in accordance with generally accepted accounting principles, and that receipts and expenditures of the company are being made only in accordance with authorisations of management and directors of the company; and (3) provide reasonable assurance regarding prevention or timely detection of unauthorised acquisition, use, or disposition of the company’s assets that could have a material effect on the financial statements.Inherent Limitations of Internal Financial Controls Over Financial ReportingBecause of the inherent limitations of internal financial controls over financial reporting, including the possibility of collusion or improper management override of controls, material misstatements due to error or fraud may occur and not be detected. Also, projections of any evaluation of the internal financial controls over financial reporting to future periods are subject to the risk that the internal financial control over financial reporting may become inadequate because of changes in conditions, or that the degree of compliance with the policies or procedures may deteriorate.OpinionIn our opinion, to the best of our information and according to the explanations given to us and based on the consideration of the reports of the other auditors on internal financial controls system over financial reporting of the joint operations referred to in the Other Matters paragraph below, the Company has, in all material respects, an adequate internal financial controls system over financial reporting and such internal financial controls over financial reporting were operating effectively as at 31st March, 2017, based on the internal control over financial reporting criteria established by the respective Company considering the essential components of internal control stated in the Guidance Note on Audit of Internal Financial Controls Over Financial Reporting issued by the Institute of Chartered Accountants of India.Other MattersOur aforesaid report under Section 143(3)(i) of the Act on the adequacy and operating effectiveness of the internal financial controls over financial reporting insofar as it relates to one joint operation which is a company incorporated in India, is based on the corresponding report of the other auditor of such company incorporated in India.Our opinion is not modified in respect of this matter.
For DELOITTE HASKINS & SELLS For HDS & Associates LLPChartered Accountants Chartered Accountants(Firm Registration No. 117364W) (Firm Registration No. W100144)
Nilesh Shah Shridhar G.S.Partner Partner(Membership No. 49660) (Membership No. 126653)
MUMBAI, MUMBAI,Dated: June 22nd, 2017 Dated: June 22nd , 2017

32
AFCONS INFRASTRUCTURE LIMITED
ANNEXURE B TO THE INDEPENDENT AUDITORS’ REPORT(Referred to in paragraph 2 under ‘Report on Other Legal and Regulatory Requirements’ section of our report of even date)(i) (a) The Company has maintained proper records showing full particulars, including quantitative details and situation of fixed assets.
(b) The fixed assets were physically verified during the year by the Management in accordance with a regular programme of verification which, in our opinion, provides for physical verification of all the fixed assets at reasonable intervals. According to the information and explanation given to us, no material discrepancies were noticed on such verification.
(c) With respect to immovable properties of land and buildings that are freehold, according to the information and explanations given to us and the records examined by us and based on the examination of the indenture deed, property card, bank confirmation and other relevant document which evidences title provided to us, we report that, the title deeds of such immovable properties are held in the name of the Company as at the balance sheet date. In respect of immovable properties of land that have been taken on lease and disclosed as prepaid asset in the financial statements, the lease agreements are in the name of the Company, where the Company is the lessee in the agreement.
(ii) As explained to us, the inventories were physically verified during the year by the Management at reasonable intervals and no material discrepancies were noticed on physical verification.
(iii) The Company has not granted any loans, secured or unsecured, to companies, firms, limited liability partnerships, or other parties covered in the register maintained under Section 189 of the Companies Act, 2013.
(iv) In our opinion and according to the information and explanations given to us, the Company has complied with the provisions of Section 185 of the Companies Act, 2013 in respect of grant of loans and providing guarantees and securities, as applicable. The Company has also complied with Section 186 of the Companies Act, 2013 in respect of making investments, as applicable. Attention is invited to note 42 (a) of the financial statements regarding reliance placed on the legal opinion obtained by the management in the matter of non-applicability of section 186 of the Companies Act, 2013 in relation to loan made, guarantee given or security provided as the company is in the business of constructing and delivering infrastructure facilities.
(v) According to the information and explanations given to us, the Company has not accepted any deposits during the year. Attention is invited to note 38 regarding the reliance placed on the legal opinion obtained by the management in the matter of non-applicability of section 73 of the Companies Act, 2013 and Companies (Acceptance of Deposit) Rules, 2014, to Unsecured Unlisted Redeemable Non-Convertible Debentures issued by the Company to banks on a private placement basis and its subsequent transfer to Mutual Funds by the Banks. In respect of unclaimed deposits, the company has complied with the provisions of sections 73 to 76 or any other relevant provisions of the Companies Act. According to the information and explanations given to us, no order has been passed by the Company Law Board or the National Company Law Tribunal or the Reserve Bank of India or any Court or any other Tribunal.
(vi) We have broadly reviewed the cost records maintained by the Company pursuant to the Companies (Cost Records and Audit) Rules, 2014, as amended prescribed by the Central Government under sub-section (1) of Section 148 of the Companies Act, 2013, and are of the opinion that, prima facie, the prescribed cost records have been made and maintained. We have, however, not made a detailed examination of the cost records with a view to determine whether they are accurate or complete.
(vii) According to the information and explanations given to us in respect of statutory dues:(a) The Company has generally been regular in depositing undisputed statutory dues, including Provident Fund, Employees’ State
Insurance, Income-tax, Sales Tax, Service Tax, Customs Duty, Excise Duty, Value Added Tax, cess and any other material statutory dues applicable to it with the appropriate authorities.
(b) There were no undisputed amounts payable in respect of Provident Fund, Employees’ State Insurance, Income-tax, Sales Tax, Service Tax, Customs Duty, Excise Duty, Value Added Tax, cess and other material statutory dues in arrears as at 31st March, 2017 for a period of more than six months from the date they became payable.
(c) Details of dues of Income-tax, Sales Tax, Service Tax, Customs Duty, Excise Duty, Value Added Tax and Cess which have not been deposited as on 31st March, 2017 on account of disputes by the aforesaid entities are given below:
Statute Nature of Dues
Forum where Dispute is pending
Period to which the amount relates
Amount (`. in
crores)
Amount Paid / Adjusted
(`. in crores)
Net Balance
(`. in crores)
Andhra Pradesh General Sales Tax Act 1957
Sales Tax Sales Tax appellate Tribunal, Hyderabad
1995-96, 1996-97, 1997-98
0.16 - 0.16
Andhra Pradesh General Sales Tax Act 1957
Sales Tax Appellate Dy. Commissioner of Commercial taxes, Hyderabad
1997-98 0.008 0.006 0.002
Delhi Value Added Tax Act, 2004
Sales Tax Addl. Commissioner (Appeals)
2007-08,
2008-09
0.40 0.40 0
Karnataka Sales Tax Act, 1957
Sales Tax Joint Commissioner, Mangalore
2008-09 1.20 0.62 0.58
Madhya Pradesh General Sales Tax Act 1958
Sales Tax Dy. Commissioner 1985-86 0.15 0.05 0.10
Madhya Pradesh General Sales Tax Act 1958
Sales TaxAddl. Commissioner
1987-88, 1988-89, 1989-90
0.15 0.02 0.13
Orissa Sales Tax Act, 1947 Sales Tax Appellate Tribunal of Sales Tax, Cuttack
1998-99 2.07 1.84 0.23
Orissa Sales Tax Act, 1947 Sales Tax High Court, Orissa 1999-00 1.84 1.53 0.31

33
AFCONS INFRASTRUCTURE LIMITED
Statute Nature of Dues
Forum where Dispute is pending
Period to which the amount relates
Amount (`. in
crores)
Amount Paid / Adjusted
(`. in crores)
Net Balance
(`. in crores)
Orissa Sales Tax Act, 1947 Sales Tax Addn. Commissioner of Sales Tax, Bhubaneshwar
2004-05 0.44 0.28 0.15
Tamilnadu General Sales Tax Act, 1959
Sales Tax Dy. Commissioner Of Commercial Taxes, Chennai
1992-93, 1994-95,1995-96, 1996-97
0.13 0.12 0.01
West Bengal Sales Tax Act, 1954
Sales Tax West Bengal Commercial Tax Tribunal, Kolkata
1987-88, 1988-89
0.11 0.05 0.06
West Bengal Sales Tax Act, 1954
Sales Tax Dy. Commissioner of Commercial Taxes, Durgapur
1994-95 0.20 0.09 0.11
West Bengal Sales Tax Act, 1954
Sales Tax Additional Commissioner of Sales Tax
2012-13 2.67 - 2.67
West Bengal Sales Tax Act, 1954
Sales Tax Deputy Commissioner of Sales Tax
2013-14 6.07 - 6.07
Chapter V, Finance Act,1994 Service Tax High Court, Mumbai 2007-08,2008-09,2009-10,2010-11
66.27 18.98 47.29
Chapter V, Finance Act,1994 Service Tax Commissioner of Central Excise & Service Tax (Appeals-IV), Mumbai
2009-10 0.18 - 0.18
Chapter V, Finance Act,1994 Service Tax CESTAT 2008-2010 2.30 - 2.30Chapter V, Finance Act,1994 Service Tax CESTAT 2008-09 1.23 - 1.23Chapter V, Finance Act,1994 Service Tax CESTAT 2008-09 1.01 - 1.01Chapter V, Finance Act,1994 Service Tax CESTAT 2010-14 60.30 - 60.30Chapter V, Finance Act,1994 Service Tax CESTAT 2010-11 0.06 - 0.06Chapter V, Finance Act,1994 Service Tax CESTAT 2007-10 26.60 - 26.60Chapter V, Finance Act,1994 Service Tax CESTAT 2009-14 6.74 0.25 6.49Chapter V, Finance Act,1994 Service Tax CESTAT 2014-15 2.33 0.12 2.21
(viii) In our opinion and according to the information and explanations given to us, the Company has not defaulted in the repayment of loans or borrowings to financial institutions, banks and dues to debenture holders. The company has not taken any loans or borrowings from Government.
(ix) In our opinion and according to the information and explanations given to us, money raised by way of term loan has been applied by the Company during the year for the purposes for which it was raised, other than temporary deployment pending application of proceeds.
(x) To the best of our knowledge and according to the information and explanations given to us, no fraud by the Company and no material fraud on the Company by its officers or employees has been noticed or reported during the year.
(xi) In our opinion and according to the information and explanations given to us, the Company has paid/provided managerial remuneration in accordance with the requisite approvals mandated by provisions of section 197 read with schedule V to the Companies Act, 2013.
(xii) The Company is not a Nidhi Company and hence reporting under clause (xii) of CARO 2016 is not applicable.(xiii) In our opinion and according to the information and explanations given to us the Company is in compliance with Section 188 and 177
of the Companies Act, 2013, where applicable, for all transactions with the related parties and the details of related party transactions have been disclosed in the financial statements etc. as required by the applicable accounting standards.
(xiv) During the year the Company has not made any preferential allotment or private placement of shares or fully or partly convertible debentures and hence reporting under clause (xiv) of CARO 2016 is not applicable to the Company.
(xv) In our opinion and according to the information and explanations given to us, during the year the Company has not entered into any non-cash transactions with its directors or director of its holding, subsidiary or associate Company or persons connected with them and hence provisions of section 192 of the Companies Act, 2013 are not applicable.
(xvi) The Company is not required to be registered under section 45-I of the Reserve Bank of India Act, 1934.
For DELOITTE HASKINS & SELLS For HDS & Associates LLPChartered Accountants Chartered Accountants(Firm Registration No. 117364W) (Firm Registration No. W100144)
Nilesh Shah Shridhar G.S.Partner Partner(Membership No. 49660) (Membership No. 126653)
MUMBAI, MUMBAI,Dated: June 22nd, 2017 Dated: June 22nd , 2017

34
AFCONS INFRASTRUCTURE LIMITED
Balance Sheet as at 31st March, 2017 ` in CroresParticulars Note
No.As at
31st March, 2017As at
31st March, 2016As at
1st April, 2015A ASSETS
1 Non-current assets(a) Property Plant and Equipment 3.A 1,609.18 1,476.03 1,353.45(b) Other Intangible assets 3.B 2.18 2.72 1.78(c) Capital work-in-progress 3.C 20.80 124.28 174.48(d) Financial assets (i) Investments 4 109.24 112.93 113.69
(ii) Trade receivables 5 129.65 115.76 138.78(iii) Other financial assets 7 121.48 136.40 138.07
(e) Non current Tax assets (net) 11 74.63 59.48 74.67(f) Other non-current assets 8 577.92 319.35 325.13
Total Non-current Assets 2,645.08 2,346.95 2,320.052 Current assets
(a) Inventories 9 515.30 493.92 287.83(b) Financial assets
(i) Trade receivables 5 711.78 484.92 409.46(ii) Cash and cash equivalents 10 21.63 26.72 31.68(iii) Bank balances other than (ii) above 10.1 19.62 4.63 2.02(iv) Loans 6 102.52 52.44 50.04(v) Other financial assets 7 157.61 171.04 148.55
(c) Other current assets 8 2,662.77 2,977.90 2,565.59Total Current Assets 4,191.23 4,211.57 3,495.17
Total Assets (1+2) 6,836.31 6,558.52 5,815.22B EQUITY AND LIABILITIES
1 Equitya) Equity attributable to owner of the company
(a) Equity share capital 12 521.97 521.97 521.97(b) Other equity 13 981.87 939.41 882.62
Total Equity 1,503.84 1,461.38 1,404.592 Liabilities
A) Non-current liabilities(a) Financial liabilities
(i) Borrowings 14 831.20 857.65 624.42(ii) Trade payables 15 147.85 100.61 65.12(iii) Other financial liabilities 16 0.01 0.01 0.01
(b) Deferred tax liabilities (net) 17 124.99 115.56 93.57(c) Other non-current liabilities 18 523.01 193.88 373.14(d) Provisions 19 8.99 5.11 1.92
Total Non-current Liabilities 1,636.05 1,272.82 1,158.18B) Current liabilities(a) Financial liabilities
(i) Borrowings 21 1,064.17 1,020.02 915.24(ii) Trade payables 15 1,340.63 1,157.91 948.77(iii) Other financial liabilities 16 254.23 302.90 374.90
(b) Current tax liabilities (net) 20 13.29 25.20 9.90(c) Other current liabilities 18 999.63 1,299.74 984.34(d) Provisions 19 24.47 18.55 19.30
Total Current Liabilities 3,696.42 3,824.32 3,252.45Total Liabilities (A+B) 5,332.47 5,097.14 4,410.63
Total Equity and Liabilities (1+2) 6,836.31 6,558.52 5,815.22See accompanying notes 1 to 45 forming part of the financial statements
In terms of our report attached For and on behalf of the Board of Directors
For DELOITTE HASKINS & SELLS CHARTERED ACCOUNTANTS
For HDS & ASSOCIATES LLP CHARTERED ACCOUNTANTS
S.P.MISTRY Chairman
K.SUBRAHMANIAN Vice Chairman &
Managing Director
NILESH SHAHPartner
SHRIDHAR G.S.Partner
S.PARAMASIVAN Deputy Managing Director
P.N. KAPADIADirector
N.D.KHURODY Director
R.M.PREMKUMAR Director
Place: MumbaiDate: 22nd June, 2017
P.R. RAJENDRANCompany Secretary
ASHOK G.DARAKChief Financial Officer

35
AFCONS INFRASTRUCTURE LIMITED
Statement of Profit and Loss for the year ended 31st March, 2017 ` in CroresSr. No. Particulars Note
No.For the year ended
31st March, 2017For the year ended
31st March, 20161 Revenue from operations 22 5,739.66 4,174.702 Other income 23 102.93 134.773 Total revenue ( 1 + 2 ) 5,842.59 4,309.474 Expenses
(a) Cost of construction 24 4,087.73 2,738.19 (b) Cost of traded goods 25 29.99 34.49 (c) Employee benefits expense 26 585.14 509.15 (d) Finance costs 27 299.06 269.48 (e) Depreciation and amortisation expense 28 166.22 155.05 (f) Other expenses 29 560.59 445.50Total expenses 5,728.73 4,151.86
5 Profit before tax ( 3 - 4 ) 113.86 157.616 Tax expense:
(a) Tax expense for current year 17 27.01 46.69 (b) Deferred tax 17 11.37 22.98 (c) Tax expense relating to prior period 17 0.36 0.21
38.74 69.887 Profit for the year from continuing operations ( 5 - 6 ) 75.12 87.738 Other Comprehensive Income
A) Items that will not be reclassified to profit or loss(a) Changes in Fair value of Equity investments designated as FVTOCI (3.37) (1.38)
(b) Remeasurement of defined benefit liabilities / (assets) (5.60) (2.87) (c) Deferred tax on remeasurement of defined benefit plans 1.94 0.99B) Items that may be reclassified to profit or loss (a) Exchange differences on translating the financial statements of a foreign operation
0.41 (1.64)
(6.62) (4.90)9 Total Comprehensive income for the year (7 + 8) 68.50 82.83
10 Total comprehensive income for the year attributable to: - Owners of the Company 68.50 82.83 - Non-controlling interest - -
68.50 82.8311 Earnings per share (Face value of ` 10/- each): 32
(a) Basic 2.20 2.57 (b) Diluted 2.20 2.57See accompanying notes 1 to 45 forming part of the financial statements
In terms of our report attached For and on behalf of the Board of Directors
For DELOITTE HASKINS & SELLS CHARTERED ACCOUNTANTS
For HDS & ASSOCIATES LLP CHARTERED ACCOUNTANTS
S.P.MISTRY Chairman
K.SUBRAHMANIAN Vice Chairman &
Managing Director
NILESH SHAHPartner
SHRIDHAR G.S.Partner
S.PARAMASIVAN Deputy Managing Director
P.N. KAPADIADirector
N.D.KHURODY Director
R.M.PREMKUMAR Director
Place: MumbaiDate: 22nd June, 2017
P.R. RAJENDRANCompany Secretary
ASHOK G.DARAKChief Financial Officer

36
AFCONS INFRASTRUCTURE LIMITED
Statement of changes in equity for the year ended 31st March, 2017
a) Equity Share Capital ` in CroresBalance as at 31st March, 2016 Changes in equity share
capital during the yearBalance as at 31st March, 2017
71.97 - 71.97
Balance as at 1st April, 2015 Changes in equity share capital during the year
Balance as at 31st March, 2016
71.97 - 71.97
Equity Share Capital Number of Shares Equity share capitalIssued and Paid up Capital at 1st April, 2016 7,19,70,238 71.97Less: Treasury Shares - -Balance at 1st April, 2016 7,19,70,238 71.97Balance at 31st March, 2017 7,19,70,238 71.97
b) Preference Share Capital ` in Crores
Balance as at 31st March, 2016 Changes in preference share capital during the year
Balance as at 31st March, 2017
450.00 - 450.00
Balance as at 1st April, 2015 Changes in preference share capital during the year
Balance as at 31st March, 2016
450.00 - 450.00
Preference Share Capital Number of Shares Preference share capitalIssued and Paid up Capital at 1st April, 2016 45,00,00,000 450.00Less: Treasury Shares - -Balance at 1st April, 2016 45,00,00,000 450.00Balance at 31st March, 2017 45,00,00,000 450.00
c) Other Equity ` in CroresParticulars Reserve and Surplus Other comprehensive
incomeTotal
Capital Reserve
Capital Redemption
Reserve
Securities Premium Reserve
Contin-gencies Reserve
Debenture Redemption
Reserve
General Reserve
Retained Earnings
Exchange differences
on translating the financial
statements of a foreign operation
Equity Instruments
through other
comprehen-sive income
Balance as at 31st March, 2016 0.19 0.13 10.28 8.00 44.57 65.70 797.24 (1.64) 14.94 939.41Profit for the year 75.12 75.12Other Comprehensive income for the year (3.66) 0.41 (3.37) (6.62)Dividends / Dividend Tax (26.04) (26.04)Transfer to / (from) surplus in Statement of Profit & Loss (2.07) 2.07 -Balance as at 31st March, 2017 0.19 0.13 10.28 8.00 42.50 65.70 844.73 (1.23) 11.57 981.87
Balance as at 1st April, 2015 0.19 0.13 10.28 8.00 25.40 65.70 756.60 - 16.32 882.62Profit for the year 87.73 87.73Other Comprehensive income for the year (1.88) (1.64) (1.38) (4.90)Dividends / Dividend Tax (26.04) (26.04)Transfer to / (from) surplus in Statement of Profit & Loss 19.17 (19.17) -Balance as at 31st March, 2016 0.19 0.13 10.28 8.00 44.57 65.70 797.24 (1.64) 14.94 939.41

37
AFCONS INFRASTRUCTURE LIMITED
Cash Flow Statement for the year ended 31st March, 2017 ` in Crores
Particulars For the year ended31st March, 2017
For the year ended31st March, 2016
Cash flow from operating activities Profit after tax 75.12 87.73
adjustments for :Income tax expense recognised in Profit or loss 38.74 69.88Depreciation and amortisation 166.22 155.05Loss on sale of fixed assets (net) 2.59 4.29Dividend income recognised in profit or loss (1.86) (1.62)Interest income recognised in profit or loss (60.96) (97.52)Finance cost recognised in profit or loss 271.25 247.09Remeasurement of defined benefit liabilities / (assets) through OCI (3.66) (1.88)Bad/irrecoverable Debtors /Unbilled Revenue /Advances /Duty Scrip w/off 0.80 8.87Provision for doubtful debtors / advances no longer required written back (0.44) (3.20)Creditors / Excess Provision written back (1.96) (7.17)Provision for Doubtful Investment 0.36 0.15Reversal of expected credit loss on financial assets (0.14) (1.78)Provision for expected credit loss 0.13 (4.98)Net (gain) / Loss arising on financials assets measured at fair value through profit or loss (0.03) 0.01Provision for Projected Losses on contract (net) (4.46) (0.51)
Operating profit before working capital changes 481.70 454.41(Increase) in Inventories (21.38) (206.09)(Increase) in Trade receivables (240.74) (45.68)(Increase) in Loans and Advances and Other Assets (0.14) (405.74)Increase in Trade, Other payables and Provisions 289.39 401.68
Cash from Operations 508.83 198.58Direct taxes - (paid) (including interest) (48.64) (15.94)
Net Cash flow from operating activities 460.19 182.64Cash flow from investing activities
Payment for property, plant and equipment (198.59) (233.92)Proceeds from disposal of property, plant and equipment 6.76 4.25Purchase of Investments - (0.80)Dividend received 1.86 1.62Investment in Other bank balance (made) / redeemed (14.99) (2.61)Interest received 66.37 54.09
Net Cash flow (used in) investing activities (138.59) (177.37)Cash flow from financing activities
Proceeds from long-term borrowings 189.95 552.19Repayment of long-term borrowings (266.62) (397.02)(Repayment) / Proceeds from short term borrowings - net 44.15 104.78Interest paid (268.13) (244.14)Dividend paid on Equity Shares (including tax for previous year) (Interim) (25.98) (25.98)Dividend paid on Preference Shares (including tax) (0.06) (0.06)
Net Cash flow (used in) financing activities (326.69) (10.23)Net (decrease) in cash and cash equivalents (5.09) (4.96)Cash and cash equivalents at the beginning of the year 26.72 31.68Cash and cash equivalents at the end of the year 21.63 26.72Note1. The above Cash Flow Statement has been prepared under the "Indirect Method" set out in Ind As 7 'Cash Flow Statements'.In terms of our report attached For and on behalf of the Board of Directors
For DELOITTE HASKINS & SELLS CHARTERED ACCOUNTANTS
For HDS & ASSOCIATES LLP CHARTERED ACCOUNTANTS
S.P.MISTRY Chairman
K.SUBRAHMANIAN Vice Chairman &
Managing Director
NILESH SHAHPartner
SHRIDHAR G.S.Partner
S.PARAMASIVAN Deputy Managing Director
P.N. KAPADIADirector
N.D.KHURODY Director
R.M.PREMKUMAR Director
Place: MumbaiDate: 22nd June, 2017
P.R. RAJENDRANCompany Secretary
ASHOK G.DARAKChief Financial Officer

38
AFCONS INFRASTRUCTURE LIMITED
Notes forming part of the financial statements for the year ended 31st March, 2017Note 1. Significant Accounting Policies1. General information Afcons Infrastructure Limited (the Company) is a limited company incorporated in India. Its parent and ultimate holding company is
Shapoorji Pallonji Company Private Limited. The address of its registered office is "Afcons House" ,16 Shah Industrial Estate, Veera Desai Road, Andheri (West), Mumbai 400 053 and
principal place of business is Mumbai, India. The principal activity of the Company is Infrastructure activities. Afcons has a presence in almost the entire spectrum of infrastructure activities in India and Overseas. The Company is engaged in Marine Works, Highways, Bridges, Metro Works, Power Houses, Tunnels, Oil & Gas, LNG Tanks and other general Civil Engineering Projects both in India and Overseas.
2. Standards issued but not yet effective In March 2017, the Ministry of Corporate Affairs issued the Companies (Indian Accounting Standards) (Amendments) Rules, 2017,
notifying amendments to Ind AS 7, ‘Statement of cash flows’. These amendments are in accordance with the recent amendments made by International Accounting Standards Board (IASB) to IAS 7, ‘Statement of cash flows’. The amendments are applicable to the Company from 1st April, 2017.
3. Amendment to Ind AS 7: The amendment to Ind AS 7 requires the entities to provide disclosures that enable users of financial statements to evaluate changes
in liabilities arising from financing activities, including both changes arising from cash flows and non-cash changes, suggesting inclusion of a reconciliation between the opening and closing balances in the balance sheet for liabilities arising from financing activities, to meet the disclosure requirement.
The Company is evaluating the requirements of the amendment and the effect on the financial statements is being evaluated.3.1 Statement of compliance The financial statements have been prepared in accordance with Ind ASs notified under the Companies (Indian Accounting
Standards) Rules, 2015. Upto the year ended 31st March, 2016, the Company prepared its financial statements in accordance with the requirements of
previous GAAP, which includes Standards notified under the Companies (Accounting Standards) Rules, 2006. These are Company’s first Ind AS financial statement. The date of transition to Ind AS is 1st April, 2015. Refer Note 3.22 for the details of first-time adoption exemptions availed by the Company.
3.2 Basis of preparation and presentation The financial statements have been prepared on the historical cost basis except for certain financial instruments that are measured
at fair values at the end of each reporting period, as explained in the accounting policies below. Historical cost is generally based on the fair value of the consideration given in exchange for goods and services. Fair value is the price that would be received to sell an asset or paid to transfer a liability in an orderly transaction between market
participants at the measurement date, regardless of whether that price is directly observable or estimated using another valuation technique. In estimating the fair value of an asset or a liability, the Company takes into account the characteristics of the asset or liability if market participants would take those characteristics into account when pricing the asset or liability at the measurement date. Fair value for measurement and/or disclosure purposes in these financial statements is determined on such a basis, except for leasing transactions that are within the scope of Ind AS 17, and measurements that have some similarities to fair value but are not fair value, such as net realisable value in Ind AS 2 or value in use in Ind AS 36.
In addition, for financial reporting purposes, fair value measurements are categorised into Level 1, 2 or 3 based on the degree to which the inputs to the fair value measurements are observable and the significance of the inputs to the fair value measurement in its entirety, which are described as follows:• Level 1 inputs are quoted prices (unadjusted) in active markets for identical assets or liabilities that the entity can access at the
measurement date;• Level 2 inputs are inputs, other than quoted prices included within Level 1, that are observable for the asset or liability, either
directly or indirectly; and• Level 3 inputs are unobservable inputs for the asset or liability.
The balance sheet presents current and non-current assets, and current and non-current liabilities, as separate classifications. For this purpose, an asset is classified as current if:
• It is expected to be realised, or is intended to be sold or consumed, in the normal operating cycle; or• It is held primarily for the purpose of trading; or• It is expected to realise the asset within 12 months after the reporting period; or• The asset is a cash or equivalent unless it is restricted from being exchanged or used to settle a liability for at least
12 months after the reporting period.All other assets are classified as non-current.Similarly, a liability is classified as current if:
• It is expected to be settled in the normal operating cycle; or• It is held primarily for the purpose of trading; or• It is due to be settled within 12 months after the reporting period; or• The Company does not have an unconditional right to defer the settlement of the liability for at least 12 months after the
reporting period. Terms of a liability that could result in its settlement by the issue of equity instruments at the option of the counterparty does not affect this classification.
All other liabilities are classified as non-current.The principal accounting policies are set out below.

39
AFCONS INFRASTRUCTURE LIMITED
Notes forming part of the financial statements for the year ended 31st March, 20173.3 Goodwill Goodwill represents the cost of acquired business as established at the date of acquisition of the business in excess of the acquirer’s
interest in the net fair value of the identifiable assets, liabilities and contingent liabilities less accumulated impairment losses, if any. Goodwill is tested for impairment annually or when events or circumstances indicate that the implied fair value of goodwill is less than its carrying amount.
For the purposes of impairment testing, goodwill is allocated to each of the Company's cash-generating units (or groups of cash-generating units) that is expected to benefit from the synergies of the combination.
A cash-generating unit to which goodwill has been allocated is tested for impairment annually, or more frequently when there is an indication that the unit may be impaired. If the recoverable amount of the cash-generating unit is less than its carrying amount, the impairment loss is allocated first to reduce the carrying amount of any goodwill allocated to the unit and then to the other assets of the unit pro rata based on the carrying amount of each asset in the unit. Any impairment loss for goodwill is recognised directly in profit or loss. An impairment loss recognised for goodwill is not reversed in subsequent periods.
On disposal of the relevant cash-generating unit, the attributable amount of goodwill is included in the determination of the profit or loss on disposal.
3.4 Interests in joint ventures and joint operations A joint venture is a joint arrangement whereby the parties that have joint control of the arrangement have rights to the net assets
of the joint arrangement. Joint control is the contractually agreed sharing of control of an arrangement, which exists only when decisions about the relevant activities require unanimous consent of the parties sharing control.
A joint operation is a joint arrangement whereby the parties that have joint control of the arrangement have rights to the assets and obligations for the liabilities, relating to the arrangements. Interest in joint operations is recognised as below.a) Its assets, including its share of any assets held jointly;b) Its liabilities, including its share of any liabilities incurred jointly;c) Its revenue from the sale of the output arising from the joint operation;d) Its share of the revenue from the sale of the output by the joint operation ande) Its expenses, including its share of any expenses incurred jointly.
3.5 Revenue recognition Sale of goods Revenue from the sale of goods is recognised when the goods are delivered and titles have passed, at which time all the following
conditions are satisfied:• the Company has transferred to the buyer the significant risks and rewards of ownership of the goods;• the Company retains neither continuing managerial involvement to the degree usually associated with ownership nor effective
control over the goods sold;• the amount of revenue can be measured reliably;• it is probable that the economic benefits associated with the transaction will flow to the Company; and• the costs incurred or to be incurred in respect of the transaction can be measured reliably.
Revenue from sale of goods is measured at fair value of the consideration received or receivable, net of returns and trade discounts and includes excise duty but excludes sales tax and value added tax.
Revenue from construction contracts When the outcome of a construction contract can be estimated reliably, contract revenue and contract costs associated with the
construction contract are recognised as revenue and expenses respectively by reference to the percentage of completion of the contract activity at the reporting date. The percentage of completion of a contract is determined considering the proportion that contract costs incurred for work performed upto the reporting date bear to the estimated total contract costs. Contract revenue is measured at the fair value of the consideration received or receivable.
For the purposes of recognising revenue, contract revenue comprises the initial amount of revenue agreed in the contract, the variations in contract work, claims and incentive payments to the extent that its receipt is considered probable and the amounts are capable of being reliably measured.
The percentage of completion method is applied on a cumulative basis in each accounting period to the current estimates of contract revenue and contract costs. The effect of a change in the estimate of contract revenue or contract costs, or the effect of a change in the estimate of the outcome of a contract, is accounted for as a change in accounting estimate and the effect of which are recognised in the Statement of Profit and Loss in the period in which the change is made and in subsequent periods.
Revenue in excess of billings is recognised as amounts due from customer under construction contracts in the balance sheet. Contract revenue in case of ‘Cost Plus’ contracts is determined by adding the aggregate cost plus proportionate margin as agreed
with the customer. Subsequent to the close of the contract, expenditure if any, incurred on completed jobs during the Defects Liability period is accounted
for in the year of such expenses. Contract cost include cost that relate directly to the specific contract, cost that are attributable to contract activity in general and can
be allocated to the contract and such other costs as are specifically chargeable to the customer under the terms of the contract. When the outcome of a construction contract cannot be estimated reliably, revenue is recognised only to the extent of contract costs
incurred of which recovery is probable and the related contract costs are recognised as an expense in the period in which they are incurred. When it is probable that total contract costs will exceed total contract revenue, the expected loss is recognised as an expense in the
Statement of Profit and Loss in the period in which such probability occurs. Claims and amounts in respect thereof are recognized only when negotiations have advanced to a stage where it is probable that
the customer(s) will accept them and amounts can be reliably measured. In the case of Arbitration Awards (the “Awards”) which are granted in favor of the Company, the award amount (including interest thereon), are accounted when they are granted and where it is reasonable to expect ultimate collection of such awards.

40
AFCONS INFRASTRUCTURE LIMITED
Notes forming part of the financial statements for the year ended 31st March, 2017 The Company evaluates whether it is acting as a principal or agent by considering a number of factors, including, among other things,
whether the Company is the primary obligor under the arrangement, has inventory risk, has customer's credit risk and has latitude in establishing prices. Where the Company is the principal in the transaction, revenue and related costs are recorded at their gross values. Where the Company is effectively the agent in the transaction, revenue and related costs are recorded at their net values.
Dividend and interest income Dividend income from investments is recognised when the shareholder's right to receive payment has been established (provided
that it is probable that the economic benefits will flow to the Company and the amount of income can be measured reliably). Interest income from a financial asset is recognised when it is probable that the economic benefits will flow to the Company and the
amount of income can be measured reliably. Interest income is accrued on a time basis, by reference to the principal outstanding and at the effective interest rate applicable, which is the rate that exactly discounts estimated future cash receipts through the expected life of the financial asset to that asset's net carrying amount on initial recognition.
Rendering of Services Revenue from rendering of services is measured at fair value of consideration received or receivable. Revenue is recognised over
of the life of the contract using percentage completion method and when the outcome of the transaction is estimated reliably. The outcome of a transaction is estimated reliably when all the following conditions are satisfied:
(a) the amount of revenue can be measured reliably;(b) it is probable that the economic benefits associated with the transaction will flow to the entity;(c) the stage of completion of the transaction at the end of the reporting period can be measured reliably; and(d) the costs incurred for the transaction and the costs to complete the transaction can be measured reliably
When the outcome of the transaction involving the rendering of services cannot be estimated reliably, revenue shall be recognised only to the extent of the expenses recognised that are recoverable.
Revenues from maintenance contracts are recognised pro-rata over the period of the contract.3.6 Leasing Leases are classified as finance leases whenever the terms of the lease transfer substantially all the risks and rewards of ownership
to the lessee. All other leases are classified as operating leases. Rental income from operating leases is generally recognised on a straight-line basis over the term of the relevant lease. Where the
rentals are structured solely to increase in line with expected general inflation to compensate for the Company’s expected inflationary cost increases, such increases are recognised in the year in which such benefits accrue. Initial direct costs incurred in negotiating and arranging an operating lease are added to the carrying amount of the leased asset and recognised on a straight-line basis over the lease term.
Rental expense from operating leases is generally recognised on a straight-line basis over the term of the relevant lease. Where the rentals are structured solely to increase in line with expected general inflation to compensate for the lessor's expected inflationary cost increases, such increases are recognised in the year in which such benefits accrue. Contingent rentals arising under operating leases are recognised as an expense in the period in which they are incurred.
3.7 Foreign currencies(i) Functional and presentation currency Items included in the financial statements are measured using the currency of the primary economic environment in which the
entity operates (‘the functional currency’). The financial statements are presented in Indian rupee (INR), which is Company`s functional and presentation currency.
(ii) Transactions and balances In preparing the financial statements of the entity, transactions in currencies other than the entity's functional currency (foreign
currencies) are recognised at the rates of exchange prevailing at the dates of the transactions. At the end of each reporting period, monetary items denominated in foreign currencies are retranslated at the rates prevailing at that date. Non-monetary items carried at fair value that are denominated in foreign currencies are retranslated at the rates prevailing at the date when the fair value was determined. Non-monetary items that are measured in terms of historical cost in a foreign currency are not retranslated.
Any exchange difference arising on settlement / restatement of long-term foreign currency monetary items recognized in the financial statements until the year ended 31st March, 2016, are capitalized as a part of the depreciable fixed assets to which the monetary item relates and depreciated over the remaining useful life of such assets.
For the purposes of presenting these financial statements, the assets and liabilities of the Company's foreign operations are translated into Indian Rupees using exchange rates prevailing at the end of each reporting period. Income and expense items are translated at the average exchange rates for the period, unless exchange rates fluctuate significantly during that period, in which case the exchange rates at the dates of the transactions are used. Exchange differences arising, if any, are recognised in other comprehensive income and accumulated in equity (and attributed to non-controlling interests as appropriate).
Goodwill and fair value adjustments to identifiable assets acquired and liabilities assumed through acquisition of a foreign operation are treated as assets and liabilities of the foreign operation and translated at the rate of exchange prevailing at the end of each reporting period. Exchange differences arising are recognised in other comprehensive income.
3.8 Borrowing costs Borrowing costs directly attributable to the acquisition, construction or production of qualifying assets, which are assets that
necessarily take a substantial period of time to get ready for their intended use or sale, are added to the cost of those assets, until such time as the assets are substantially ready for their intended use or sale.
Interest income earned on the temporary investment of specific borrowings pending their expenditure on qualifying assets is deducted from the borrowing costs eligible for capitalisation.
All other borrowing costs are recognised in profit or loss in the period in which they are incurred.

41
AFCONS INFRASTRUCTURE LIMITED
3.9 Employee benefits3.9.1 Retirement benefit costs and termination benefits Employee benefits include provident fund, superannuation fund, employee state insurance scheme, gratuity fund, compensated
absences and leave encashment. Payments to defined contribution retirement benefit plans are recognised as an expense when employees have rendered service
entitling them to the contributions. For defined retirement benefit plans, the cost of providing benefits is determined using the projected unit credit method, with actuarial
valuations being carried out at the end of each annual reporting period. Re-measurement, comprising actuarial gains and losses, the effect of the changes to the asset ceiling (if applicable) and the return on plan assets (excluding net interest), is reflected immediately in the balance sheet with a charge or credit recognised in other comprehensive income in the period in which they occur. Remeasurement recognised in other comprehensive income is reflected immediately in retained earnings and is not reclassified to profit or loss. Past service cost is recognised in profit or loss in the period of a plan amendment. Net interest is calculated by applying the discount rate at the beginning of the period to the net defined benefit liability or asset. Defined benefit costs are categorised as follows:• service cost (including current service cost, past service cost, as well as gains and losses on curtailments and settlements);• net interest expense or income; and• re-measurement
The Company presents the first two components of defined benefit costs in profit or loss in the line item 'Employee benefits expense'. Curtailment gains and losses are accounted for as past service costs.
The present value of the defined benefit plan liability is calculated using a discount rate which is determined by reference to market yields at the end of the reporting period on government bonds.
The retirement benefit obligation recognised in the balance sheet represents the actual deficit or surplus in the Company's defined benefit plans. Any surplus resulting from this calculation is limited to the present value of any economic benefits available in the form of refunds from the plans or reductions in future contributions to the plans.
A liability for a termination benefit is recognised at the earlier of when the entity can no longer withdraw the offer of the termination benefit and when the entity recognises any related restructuring costs.
3.9.2 Short-term and other long-term employee benefits A liability is recognised for benefits accruing to employees in respect of salaries, wages and other short term employee benefits in the
period the related service is rendered at the undiscounted amount of the benefits expected to be paid in exchange for that service. Provision for leave benefits to employees is based on actuarial valuation done by projected accrued benefit method at the reporting date3.10 Taxation Income tax expense represents the sum of the tax currently payable and deferred tax.3.10.1 Current tax The tax currently payable is based on taxable profit for the year. Taxable profit differs from 'profit before tax' as reported in the
statement of profit and loss because of items of income or expense that are taxable or deductible in other years and items that are never taxable or deductible. The Company's current tax is calculated using tax rates that have been enacted or substantively enacted by the end of the reporting period.
3.10.2 Deferred tax Deferred tax is recognised on temporary differences between the carrying amounts of assets and liabilities in the financial statements
and the corresponding tax bases used in the computation of taxable profit. Deferred tax liabilities are generally recognised for all taxable temporary differences. Deferred tax assets are generally recognised for all deductible temporary differences to the extent that it is probable that taxable profits will be available against which those deductible temporary differences can be utilised. Such deferred tax assets and liabilities are not recognised if the temporary difference arises from the initial recognition (other than in a business combination) of assets and liabilities in a transaction that affects neither the taxable profit nor the accounting profit. In addition, deferred tax liabilities are not recognised if the temporary difference arises from the initial recognition of goodwill.
Deferred tax liabilities are recognised for taxable temporary differences associated with investments in subsidiaries except where the Company is able to control the reversal of the temporary difference and it is probable that the temporary difference will not reverse in the foreseeable future. Deferred tax assets arising from deductible temporary differences associated with such investments and interests are only recognised to the extent that it is probable that there will be sufficient taxable profits against which to utilise the benefits of the temporary differences and they are expected to reverse in the foreseeable future.
The carrying amount of deferred tax assets is reviewed at the end of each reporting period and reduced to the extent that it is no longer probable that sufficient taxable profits will be available to allow all or part of the asset to be recovered.
Deferred tax liabilities and assets are measured at the tax rates that are expected to apply in the period in which the liability is settled or the asset realised, based on tax rates (and tax laws) that have been enacted or substantively enacted by the end of the reporting period.
The measurement of deferred tax liabilities and assets reflects the tax consequences that would follow from the manner in which the Company expects, at the end of the reporting period, to recover or settle the carrying amount of its assets and liabilities.
3.10.3 Current and deferred tax for the year Current and deferred tax are recognised in profit or loss, except when they relate to items that are recognised in other comprehensive
income or directly in equity, in which case, the current and deferred tax are also recognised in other comprehensive income or directly in equity respectively. Where current tax or deferred tax arises from the initial accounting for a business combination, the tax effect is included in the accounting for the business combination.
3.11 Property, plant and equipment Property, Plant and Equipment are carried at cost less accumulated depreciation and impairment losses, if any. The cost of Property,
Plant and Equipment comprises its purchase price net of any trade discounts and rebates, any import duties and other taxes (other than those subsequently recoverable from the tax authorities), any directly attributable expenditure on making the asset ready for its intended use, other incidental expenses and interest on borrowings attributable to acquisition of qualifying fixed assets up to the date
Notes forming part of the financial statements for the year ended 31st March, 2017

42
AFCONS INFRASTRUCTURE LIMITED
the asset is ready for its intended use. It also includes initial estimate of the costs of dismantling and removing the item and restoring the site on which it is located. Replacement cost of an item of property, plant and equipment is capitalised if replacement meets the recognition criteria.
Carrying amount of items replaced is derecognised. Cost of major inspections is recognised in the carrying amount of property, plant and equipment as a replacement, if recognition criteria are satisfied and any remaining carrying amount of the cost of previous inspection is derecognised. Machinery spares which can be used only in connection with an item of fixed asset and whose use is expected to be irregular are capitalised (if they meet the asset recognition criteria) and depreciated over the useful life of the principal item of the relevant assets. Subsequent expenditure on property, plant and equipment after its purchase / completion is capitalised only if such expenditure results in an increase in the future benefits from such asset beyond its previously assessed standard of performance.
Estimated useful lives of the assets are as follows: Buildings - 60 years Furniture and Fixtures - 10 years Vehicles - 10 years Office equipments - 5 years Freehold land is not depreciated. For following assets estimated useful life is different than the useful life prescribed in schedule II to the Companies Act, 2013 and
has been assessed on technical advice, taking into account the nature of the asset, the estimated usage of the asset, the operating conditions of the asset, past history of replacement, anticipated technological changes, manufacturers warranties and maintenance support, etc.
Plant & Equipment (except Tunnel Boring Machines) which includes Cranes < 100 mt., Concreting, Crushing, Piling, Road making, Laboratory & Welding Equipments, Floating Equipments - 20 Years.
Tunnel Boring Machines - Length of the tunnel bored over life of the construction project for where it is used. Cost of shuttering materials, issued to jobs, is charged off equally over a period of four years. An item of property, plant and equipment is derecognised upon disposal or when no future economic benefits are expected to arise
from the continued use of the asset. Any gain or loss arising on the disposal or retirement of an item of property, plant and equipment is determined as the difference between the sales proceeds and the carrying amount of the asset and is recognised in profit or loss.
3.11.1 Capital work-in-progress: Projects under Property, plant and equipment that are not yet ready for their intended use are carried at cost, comprising direct cost,
related incidental expenses and attributable interest.3.12 Intangible assets Intangible assets with finite useful lives that are acquired separately are carried at cost less accumulated amortisation and
accumulated impairment losses. Amortisation is recognised on a straight-line basis over their estimated useful lives. The estimated useful life and amortisation method are reviewed at the end of each reporting period, with the effect of any changes in estimate being accounted for on a prospective basis. Intangible assets with indefinite useful lives that are acquired separately are carried at cost less accumulated impairment losses. Useful life is as below:
Computer Software - 5 years An intangible asset is derecognised on disposal, or when no future economic benefits are expected from use or disposal. Gains or
losses from derecognition of an intangible assets, measured at the difference between the net disposal proceeds and the carrying amount of the assets, are recognised in profit or loss when the asset is derecognised.
3.13 Impairment of tangible and intangible assets other than goodwill At the end of each reporting period, the Company reviews the carrying amounts of its tangible and intangible assets to determine
whether there is any indication that those assets have suffered an impairment loss. If any such indication exists, the recoverable amount of the asset is estimated in order to determine the extent of the impairment loss (if any). When it is not possible to estimate the recoverable amount of an individual asset, the Company estimates the recoverable amount of the cash-generating unit to which the asset belongs. When a reasonable and consistent basis of allocation can be identified, corporate assets are also allocated to individual cash-generating units, or otherwise they are allocated to the smallest group of cash-generating units for which a reasonable and consistent allocation basis can be identified.
Recoverable amount is the higher of fair value less costs of disposal and value in use. In assessing value in use, the estimated future cash flows are discounted to their present value using a pre-tax discount rate that reflects current market assessments of the time value of money and the risks specific to the asset for which the estimates of future cash flows have not been adjusted.
If the recoverable amount of an asset (or cash-generating unit) is estimated to be less than its carrying amount, the carrying amount of the asset (or cash-generating unit) is reduced to its recoverable amount. An impairment loss is recognised immediately in profit or loss, unless the relevant asset is carried at a revalued amount, in which case the impairment loss is treated as a revaluation decrease.
When an impairment loss subsequently reverses, the carrying amount of the asset (or a cash-generating unit) is increased to the revised estimate of its recoverable amount, but so that the increased carrying amount does not exceed the carrying amount that would have been determined had no impairment loss been recognised for the asset (or cash-generating unit) in prior years. A reversal of an impairment loss is recognised immediately in profit or loss.
3.14 Inventories Inventories are stated at the lower of cost and net realisable value. Net realisable value represents the estimated selling price for
inventories less all estimated costs of completion and costs necessary to make the sale. Cost is determined on the basis of weighted average method.
3.15 Provisions and contingent liabilities Provisions are recognised when the Company has a present obligation (legal or constructive) as a result of a past event, it is probable
that the Company will be required to settle the obligation, and a reliable estimate can be made of the amount of the obligation.
Notes forming part of the financial statements for the year ended 31st March, 2017

43
AFCONS INFRASTRUCTURE LIMITED
The amount recognised as a provision is the best estimate of the consideration required to settle the present obligation at the end of the reporting period, taking into account the risks and uncertainties surrounding the obligation. When a provision is measured using the cash flows estimated to settle the present obligation, its carrying amount is the present value of those cash flows (when the effect of the time value of money is material).
A Contingent Liability is disclosed where there is a possible obligation or a present obligation that may, but probably will not, require an outflow of resources. Contingent Assets are not recognised. Information on contingent liabilities is disclosed in the notes to financial statements unless the possibility of an outflow of resources embodying economic benefits is remote.
3.16 Financial Instruments: Financial assets and financial liabilities are recognised when a Company becomes a party to the contractual provisions of the
instruments. Initial Recognition: Financial assets and financial liabilities are initially measured at fair value. Transaction costs that are directly attributable to the
acquisition or issue of financial assets and financial liabilities (other than financial assets and financial liabilities at fair value through profit or loss). Transaction costs directly attributable to the acquisition of financial assets or financial liabilities at fair value through profit or loss are recognised immediately in Statement of Profit and Loss.
3.17 Financial assets Classification and subsequent measurement of financial assets:3.17.1 Classification of financial assets: The Company classifies its financial assets in the following measurement categories: - those to be measured subsequently at fair value (either through other comprehensive income, or through profit or loss), and - those measured at amortised cost. The classification is done depending upon the Company’s business model for managing the financial assets and the contractual
terms of the cash flows. For assets measured at fair value, gains and losses will either be recorded in profit or loss or other comprehensive income, as
elected. For investments in debt instruments, this will depend on the business model in which the investment is held. The Company reclassifies debt investments when and only when its business model for managing those assets changes.3.17.2 Subsequent Measurement Debt instruments Subsequent measurement of debt instruments depends on the Company’s business model for managing the asset and the cash flow
characteristics of the asset. There are two measurement categories into which the Company classifies its debt instruments: Amortised cost: Assets that are held for collection of contractual cash flows where those cash flows represent solely payments
of principal and interest are measured at amortised cost e.g. Debentures, Bonds etc. A gain or loss on a debt investment that is subsequently measured at amortised cost is recognised in profit or loss when the asset is derecognised or impaired. Interest income from these financial assets is included in investment income using the effective interest rate method.
Fair value through other comprehensive income: Debt instruments that meet the following conditions are subsequently measured at fair value through other comprehensive income
(except for debt instruments that are designated as at fair value through profit or loss on initial recognition):• the asset is held within a business model whose objective is achieved both by collecting contractual cash flows and selling
financial assets; and• the contractual terms of the instrument give rise on specified dates to cash flows that are solely payments of principal and interest
on the principal amount outstanding. Fair value through profit or loss: Assets that do not meet the criteria for amortised cost or fair value through OCI, are measured at
fair value through profit or loss e.g. investments in mutual funds. A gain or loss on a debt investment that is subsequently measured at fair value through profit or loss is recognised in profit or loss and presented net in the Statement of Profit and Loss within other gains/(losses) in the period in which it arises.
Equity instruments Investments in equity instruments at FVTPL Investments in equity instruments are classified as at FVTPL, unless the Company irrevocably elects on initial recognition to present
subsequent changes in fair value in other comprehensive income for equity instruments which are not held for trading. Investments in equity instruments at FVTOCI On initial recognition, the Company can make an irrevocable election (on an instrument-by-instrument basis) to present the
subsequent changes in fair value in other comprehensive income. This election is not permitted if the equity investment is held for trading. These elected investments are initially measured at fair value plus transaction costs. Subsequently, they are measured at fair value with gains and losses arising from changes in fair value recognised in other comprehensive income and accumulated in the reserve for ‘equity instruments through other comprehensive income’. The cumulative gain or loss is not reclassified to profit or loss on disposal of the investments.
3.17.3 Impairment of financial assets: The Company applies the expected credit loss model for recognising impairment loss on financial assets measured at amortised
cost, lease receivables, trade receivables, other contractual rights to receive cash or other financial asset. For trade receivables, the Company measures the loss allowance at an amount equal to lifetime expected credit losses. Further, for the purpose of measuring lifetime expected credit loss allowance for trade receivables, the Company has used a
practical expedient as permitted under Ind AS 109. This expected credit loss allowance is computed based on a provision matrix which takes into account historical credit loss experience and adjusted for forward-looking information.
Notes forming part of the financial statements for the year ended 31st March, 2017

44
AFCONS INFRASTRUCTURE LIMITED
3.17.4 Derecognition of financial assets: A financial asset is derecognised only when Company has transferred the rights to receive cash flows from the financial asset.
Where the entity has transferred an asset, the Company evaluates whether it has transferred substantially all risks and rewards of ownership of the financial asset. In such cases, the financial asset is derecognised.
On derecognition of a financial asset in its entirety, the difference between the asset's carrying amount and the sum of the consideration received and receivable and the cumulative gain or loss that had been recognised in other comprehensive income and accumulated in equity is recognised in profit or loss if such gain or loss would have otherwise been recognised in profit or loss on disposal of that financial asset.
3.17.5 Foreign exchange gains and losses The fair value of financial assets denominated in a foreign currency is determined in that foreign currency and translated at the spot
rate at the end of each reporting period. For foreign currency denominated financial assets measured at amortised cost and FVTPL, the exchange differences are recognised
in profit or loss except for those which are designated as hedging instruments in a hedging relationship.3.17.6 Income recognition Interest income Interest income from debt instruments is recognised using the effective interest rate method. The effective interest rate is the rate
that exactly discounts estimated future cash receipts through the expected life of the financial asset to the gross carrying amount of a financial asset. When calculating the effective interest rate, the Company estimates the expected cash flows by considering all the contractual terms of the financial instrument but does not consider the expected credit losses.
Dividends Dividends on all equity instruments whether measured at FVTOCI or FVTPL, are recognised in the Statement of Profit and Loss only
when the right to receive payment is established, it is probable that the economic benefits associated with the dividend will flow to the Company and the amount of the dividend can be measured reliably.
3.18 Financial liabilities and equity instruments Classification as debt or equity: Debt and equity instruments issued by the Company are classified as either financial liabilities or as equity in accordance with the
substance of the contractual arrangements and the definitions of a financial liability and an equity instrument. Equity instruments: An equity instrument is any contract that evidences a residual interest in the assets of an entity after deducting all of its liabilities.
Equity instruments issued by a Company are recognised at the proceeds received, net of direct issue costs. Repurchase of the Company's own equity instruments is recognised and deducted directly in equity. No gain or loss is recognised in
profit or loss on the purchase, sale, issue or cancellation of the Company's own equity instruments. Treasury shares: In the financial statements, when any entity within the Group purchases the Company's ordinary shares, the consideration paid,
including any directly attributable incremental cost, is presented as a deduction from total equity, until they are cancelled, sold or reissued. When treasury shares are sold or reissued subsequently, the amount received is recognised as an increase in equity and the resulting surplus or deficit on the transaction is transferred to/ from share premium.
3.18.1 Classification and Subsequent Measurement: Financial liabilities: Financial liabilities are classified as either financial liabilities at FVTPL or ‘Amortised cost’. Financial Liabilities at FVTPL: Financial liabilities are classified as at FVTPL when the financial liability is held for trading or are designated upon initial recognition
as FVTPL. Gains or Losses on liabilities held for trading are recognised in the Statement of Profit and Loss. Financial Liabilities at Amortised cost: Other financial liabilities (including borrowings and trade and other payables) are subsequently measured at amortised cost using
the effective interest method. The effective interest method is a method of calculating the amortised cost of a financial liability and of allocating interest expense over the relevant period. The effective interest rate is the rate that exactly discounts estimated future cash payments (including all fees and points paid or received that form an integral part of the effective interest rate, transaction costs and other premiums or discounts) through the expected life of the financial liability, or (where appropriate) a shorter period, to the net carrying amount on initial recognition.
3.18.2 Derecognition of financial liabilities: The Company derecognises financial liabilities when, and only when, the Company's obligations are discharged, cancelled or have
expired. An exchange with a lender of debt instruments with substantially different terms is accounted for as an extinguishment of the original financial liability and the recognition of a new financial liability. Similarly, a substantial modification of the terms of an existing financial liability (whether or not attributable to the financial difficulty of the debtor) is accounted for as an extinguishment of the original financial liability and the recognition of a new financial liability. The difference between the carrying amount of the financial liability derecognised and the consideration paid and payable is recognised in profit or loss.
3.18.3 Foreign exchange gains and losses For financial liabilities that are denominated in a foreign currency and are measured at amortised cost at the end of each reporting
period, the foreign exchange gains and losses are determined based on the amortised cost of the instruments and are recognised in 'Other income' as 'Net foreign exchange gains/(losses)'.
Notes forming part of the financial statements for the year ended 31st March, 2017

45
AFCONS INFRASTRUCTURE LIMITED
3.19 Derivative financial instruments: The Company enters into derivative financial instruments viz. foreign exchange forward contracts, interest rate swaps and cross
currency swaps to manage its exposure to interest rate, foreign exchange rate risks and commodity prices. The Company does not hold derivative financial instruments for speculative purposes.
Derivatives are initially recognised at fair value at the date the derivative contracts are entered into and are subsequently remeasured to their fair value at the end of each reporting period. The resulting gain or loss is recognised in profit or loss immediately.
3.19.1 Embedded derivatives: Derivatives embedded in non-derivative host contracts that are not financial assets within the scope of Ind AS 109 are treated as
separate derivatives when their risks and characteristics are not closely related to those of the host contracts and the host contracts are not measured at FVTPL.
3.20 Government grants, subsidies and export incentives Government grants are not recognised until there is reasonable assurance that the Company will comply with the conditions attaching
to them and that the grants will be received. Government grants are recognised in profit or loss on a systematic basis over the periods in which the Company recognises as
expenses the related costs for which the grants are intended to compensate.3.21 Earnings per share Basic earnings per share is computed by dividing the profit / (loss) for the year by the weighted average number of equity shares
outstanding during the year. Ordinary shares to be issued upon conversion of a mandatorily convertible instrument are included in the calculation of basic
earnings per share from the date the contract is entered into. Diluted earnings per share is computed by dividing the profit / (loss) for the year as adjusted for dividend, interest and other charges to expense or income (net of any attributable taxes) relating to the dilutive potential equity shares, by the weighted average number of equity shares considered for deriving basic earnings per share and the weighted average number of equity shares which could have been issued on the conversion of all dilutive potential equity shares. Potential equity shares are deemed to be dilutive only if their conversion to equity shares would decrease the net profit per share from continuing ordinary operations. Potential dilutive equity shares are deemed to be converted as at the beginning of the period, unless they have been issued at a later date.
3.22 First-time adoption optional exemptions and mandatory exceptions3.22.1 Overall principle The Company has prepared the opening balance sheet as per Ind AS as of 1st April, 2015 (the transition date) by recognising all
assets and liabilities whose recognition is required by Ind AS, not recognising items of assets or liabilities which are not permitted by Ind AS, by reclassifying items from previous GAAP to Ind AS as required under Ind AS, and applying Ind AS in measurement of recognised assets and liabilities. However, this principle is subject to the certain exception and certain optional exemptions availed by the Company as detailed below.
3.22.2 Accounting Estimates An entity’s estimates in accordance with Ind AS at the date of transition to Ind AS shall be consistent with estimates made for the
same date in accordance with previous GAAP (after adjustments to reflect any difference in accounting policies), unless there is objective evidence that those estimates were in error.
Ind AS estimates as at 1st April, 2015 are consistent with the estimates as at the same date made in conformity with previous GAAP. The Company made estimates for following items in accordance with Ind AS at the date of transition as these were not required under previous GAAP:• Investment in equity instruments carried at FVTPL or FVTOCI;• Impairment of financial assets based on expected credit loss model.
3.22.3 Derecognition of financial assets and financial liabilities The Company has applied the derecognition requirements of financial assets and financial liabilities prospectively for transactions
occurring on or after 1st April, 2015 (the transition date).3.22.4 Classification and measurement of financial assets Ind AS 101 requires an entity to assess classification and measurement of financial assets on the basis of the facts and circumstances
that exist at the date of transition to Ind AS.3.22.5 Classification of debt instruments The Company has determined the classification of debt instruments in terms of whether they meet the amortised cost criteria or the
FVTOCI criteria based on the facts and circumstances that existed as of the transition date.3.22.6 Past business combinations The Company has elected to apply Ind AS 103 Business Combinations prospectively to past business combinations that occurred
before the transition date of 1st April, 2015.3.22.7 Deemed cost for property, plant and equipment and intangible assets The company has elected to consider the fair value of freehold land and floating equipments in its opening balance sheet as the
deemed cost and remaining assets are measured as per Ind AS 16.3.22.8 Leases The Company has applied Appendix C of Ind AS 17 determining whether an arrangement contains a lease to determine whether an
arrangement existing at the transition date contains a lease on the basis of facts and circumstances existing at that date.
Notes forming part of the financial statements for the year ended 31st March, 2017

46
AFCONS INFRASTRUCTURE LIMITED
3.22.9 Long term foreign currency monetary items: The Company has opted to continue the policy adopted for accounting for exchange differences arising from translation of long term
foreign currency monetary items as per previous GAAP for loans taken before 31st March, 2016.3.22.10 Equity investments at FVTOCI The Company has designated certain investments in equity shares as at FVTOCI on the basis of facts and circumstances that
existed at the transition date.3.22.11 Cumulative translation differences on foreign operations The Company has elected the option to reset the cumulative translation differences on foreign operations that exist as of the
transition date to zero.4. Critical accounting judgements and key sources of estimation uncertainty In the application of the Company’s accounting policies, which are described in note 1, the management is required to make
judgements, estimates and assumptions about the carrying amounts of assets and liabilities that are not readily apparent from other sources. The estimates and associated assumptions are based on historical experience and other factors that are considered to be relevant. Actual results may differ from these estimates.
The estimates and underlying assumptions are reviewed on an ongoing basis. Revisions to accounting estimates are recognized in the period in which the estimate is revised if the revision affects only the period of the revision and future periods if the revision affects both current and future periods.
The following are the critical judgements and estimations that have been made by the management in the process of applying the Company’s accounting policies and that have the most significant effect on the amount recognised in the financial statements and/or key sources of estimation uncertainty that may have a significant risk of causing a material adjustment to the carrying amounts of assets and liabilities within the next financial year.
4.1 Critical accounting judgements Classification of Joint Arrangement as a Joint Operation A Joint Operation is a joint arrangement whereby the parties that have joint control of the arrangement have rights to the assets
and obligations for the liabilities, relating to the arrangements. Joint control is the contractually agreed sharing of control of an arrangement, which exist only when decisions about the relevant activities require unanimous consent of the parties sharing control.
When an entity undertakes its activities under joint operations, the Company as a joint operator recognises in relation to its interest in a joint operation:a) Its assets, including its share of any assets held jointly;b) Its liabilities, including its share of any liabilities incurred jointly;c) Its revenue from the sale of the output arising from the joint operation;d) Its share of the revenue from the sale of the output by the joint operation ande) Its expenses, including its share of any expenses incurred jointly.
A joint venture is a joint arrangement whereby the parties that have joint control of the arrangement have rights to the net assets of the joint arrangement. Joint control is the contractually agreed sharing of control of an arrangement, which exists only when decisions about the relevant activities require unanimous consent of the parties sharing control.
Accordingly, the Company has evaluated all its joint arrangements on the basis of the internal arrangements (contractual arrangements) entered into between the parties to the joint arrangements for execution of the project irrespective of the legal form.
4.2 Key sources of estimation uncertaintya) Revenue recognition The Company’s revenue recognition policy, which is set out in Note 3.5, is central to how the Company values the work it has
carried out in each financial year. These policies require forecasts to be made of the outcomes of long-term construction services, which require assessments and
judgements to be made on changes in scope of work and claims and variations. Across construction services there are several long-term and complex projects where the Company has incorporated significant
judgements over contractual entitlements. The range of potential outcomes could result in a materially positive or negative change to underlying profitability and cash flow.
Estimates are also required with respect to the below mentioned aspects of the contract.1) Determination of stage of completion;2) Estimation of project completion date; and3) Estimated total revenues and estimated total costs to completion, including claims and variations.
b) Taxation The Company is subject to tax in a number of jurisdictions and judgement is required in determining the worldwide provision for
income taxes. The Company provides for future liabilities in respect of uncertain tax positions where additional tax may become payable in future periods and such provisions are based on management’s assessment of exposures.
The uncertain tax positions are measured at the amount expected to be paid to taxation authorities when the Company determines that the probable outflow of economic resources will occur. Where the final tax outcome of these matters is different from the amounts that were initially recorded, such differences will impact the current and deferred income tax assets and liabilities in the period in which such determination is made.
Notes forming part of the financial statements for the year ended 31st March, 2017

47
AFCONS INFRASTRUCTURE LIMITED
c) Contingencies: In the normal course of business, contingent liabilities may arise from litigation and other claims against the Company. There
are certain obligations which managements have concluded based on all available facts and circumstances are not probable of payment or difficult to quantify reliably and such obligations are treated as contingent liabilities and disclosed in the notes but are not provided for in the financial statements. Although there can be no assurance of the final outcome of the legal proceedings in which the Company is involved it is not expected that such contingencies will have material effect on its financial position or profitability.
d) Useful lives of property, plant and equipment As described at note 3.11 above, the Company reviews the estimated useful lives of property, plant and equipment and residual
values at the end of each reporting period. There was no change in the useful life and residual values of property, plant and equipment as compared to previous year.
e) Recoverable value of recognised receivables The Company has recognised trade receivables with a carrying value of ` 841.43 Crores (as at 31st March, 2016: ` 600.68
Crores, as at 1st April, 2015 ` 548.24 Crores). The recoverability of trade receivables is regularly reviewed in the light of the available economic information specific to each receivable and specific provisions are recognised for balances considered to be irrecoverable.
f) Fair value measurements and valuation processes Some of the Company’s assets and liabilities are measured at fair value for financial reporting purposes. In estimating the fair
value of an asset or a liability, the Company uses market-observable data to the extent it is available. Where Level 1 inputs are not available, the Company engages third party qualified valuers to perform the valuation. The management works closely with the qualified external valuers to establish the appropriate valuation techniques and inputs to the model.
g) Retirement benefit obligations Details of the Company’s defined benefit pension schemes are set out in Note 3.9, including tables showing the sensitivity of the
pension scheme obligations and assets to different actuarial assumptions. At 31st March, 2017, the retirement benefit liability recognised on the Company’s balance sheet was ` 15.47 Crores
(as at 31st March, 2016 ̀ 10.18 Crores and as at 1st April, 2015 ̀ 6.69 Crores). The effects of changes in the actuarial assumptions underlying the benefit obligation and discount rates and the differences between expected and actual returns on the schemes’ assets are classified as actuarial gains and losses. For the year ended the Company recognised net actuarial losses of ` 5.60 Crores in Other Comprehensive Income (2015-16: ` 2.87 Crores loss), including its share of the actuarial gains and losses arising in joint operations and associates.
h) Arbitration claims The forecast profit on contracts includes key judgements over the expected recovery of costs arising from the following: variations
to the contract requested by the customer, compensation events, and claims made by the Company for delays or other additional costs for which the customer is liable. These claims could result in disputes that get settled through an arbitration process wherein the outcome of these awards including the timing and the amount (including interest thereon) requires a reasonable degree of estimation. The inclusion of these amounts requires estimation of their recoverability and could impact the level of profit or loss recognised by the Company.
i) Expected credit loss The Company has a policy of assessing the creditworthiness of potential customers before entering into transactions by
performing a credit evaluation on the financial condition of accounts receivable using independent ratings where available or by assessment of the customer’s credit quality based on its financial position, past experience and other factors. The recoverability of trade receivables is regularly reviewed in the light of the available economic information specific to each receivable and specific provisions are recognised for balances considered to be irrecoverable. The expected credit loss allowance for trade receivables is made based on a provision matrix. The provision matrix takes into account historical credit loss experience and adjusted for forward-looking information. Where the actual cash shortfalls vary from those estimated, these could impact the level of profit or loss recognised by the Company.
Note 2. Details of Joint Operations at the end of the reporting period are as follows.
Name of Joint Operations Country of Incorporation
Percentage Holding - Share
Transtonnelstroy Afcons Joint Venture India 99%
Dahej Standby Jetty Project Undertaking India 100%
Afcons Gunanusa Joint Venture India 80%
Afcons Pauling Joint Venture India 100%
Strabag AG Afcons Joint Venture India 40%
Saipem Afcons Joint Venture Oman 50%
Ircon Afcons Joint Venture India 47%
Afcons Sener LNG Construction Projects Pvt. Ltd. India 49%
Afcons Sibmost Joint Venture (w.e.f. 3rd August, 2016) India 100%
Afcons Vijeta PES Joint Venture (w.e.f. 25th May, 2016) India 100%
Notes forming part of the financial statements for the year ended 31st March, 2017

48
AFC
ON
S IN
FRA
STR
UC
TUR
E LI
MIT
EDN
otes
form
ing
part
of t
he fi
nanc
ial s
tate
men
ts fo
r the
yea
r end
ed 3
1st M
arch
, 201
7N
ote
3. P
rope
rty,
Pla
nt a
nd E
quip
men
ts
A.
Tang
ible
ass
ets
`
in C
rore
s
Part
icul
ars
Gro
ss b
lock
Dep
reci
atio
n / A
mor
tisat
ion
Net
Blo
ckB
alan
ce a
s at
1st A
pril,
201
6A
dditi
ons
Dis
posa
lsB
alan
ce a
s at
31
st M
arch
, 201
7B
alan
ce a
s at
1st A
pril,
201
6D
epre
ciat
ion
/ am
ortis
atio
n ex
pens
e fo
r the
yea
r
Elim
inat
ed o
n di
spos
al o
f as
sets
Bal
ance
as
at31
st M
arch
, 201
7B
alan
ce a
s at
31
st M
arch
, 201
7
(a) F
reeh
old
Land
203
.00
- -
203
.00
- -
- -
203
.00
(b) B
uild
ings
32.
59 2
.04
- 3
4.63
14.
98 0
.72
- 1
5.70
18.
93(c
) Pla
nt a
nd E
quip
men
t 1
,535
.45
261
.12
(14.
98)
1,7
81.5
9 6
10.7
5 1
15.7
6 (1
0.98
) 7
15.5
3 1
,066
.06
(d) F
urni
ture
and
Fix
ture
s 3
3.34
3.6
6 (0
.34)
36.
66 9
.56
3.2
0 (0
.10)
12.
66 2
4.00
(e) V
ehic
les
18.
36 1
.65
(0.5
1) 1
9.50
6.2
3 1
.95
(0.3
1) 7
.87
11.
63(f)
Offi
ce e
quip
men
ts 3
4.35
5.2
8 (0
.23)
39.
40 2
3.36
3.9
3 (0
.18)
27.
11 1
2.29
(g) L
ease
hold
impr
ovem
ents
2.7
9 -
- 2
.79
2.7
9 -
- 2
.79
-(h
) Flo
atin
g E
quip
men
ts 2
20.2
6 0
.36
(0.4
4) 2
20.1
8 1
6.31
14.
54 (0
.43)
30.
42 1
89.7
6(i)
Lab
orat
ory
Equ
ipm
ents
0.8
5 1
.15
- 2
.00
0.4
9 0
.04
- 0
.53
1.4
7(j)
Shu
tterin
g M
ater
ials
72.
65 2
2.67
(4.4
9) 9
0.83
18.
44 1
6.49
- 3
4.93
55.
90(k
) Acc
esso
ries
& A
ttach
men
ts 3
4.00
9.5
4 (0
.36)
43.
18 8
.70
8.3
4 -
17.
04 2
6.14
Tot
al 2
,187
.64
307
.47
(21.
35)
2,4
73.7
6 7
11.6
1 1
64.9
7 (1
2.00
) 8
64.5
8 1
,609
.18
Prev
ious
Yea
r `
in C
rore
s
Part
icul
ars
Gro
ss b
lock
Dep
reci
atio
n / A
mor
tisat
ion
Net
Blo
ckB
alan
ce a
s at
1st A
pril,
201
5A
dditi
ons
Dis
posa
lsB
alan
ce a
s at
31
st M
arch
, 201
6B
alan
ce a
s at
1st
Apr
il, 2
015
Dep
reci
atio
n / a
mor
tisat
ion
expe
nse
for t
he
year
Elim
inat
ed
on d
ispo
sal
of a
sset
s
Bal
ance
as
at31
st M
arch
, 201
6B
alan
ce a
s at
31st M
arch
, 201
6B
alan
ce a
s at
1st A
pril,
201
5
(a) F
reeh
old
Land
203
.00
- -
203
.00
- -
- -
203
.00
203
.00
(b) B
uild
ings
18.
55 1
4.04
- 3
2.59
14.
40 0
.58
- 1
4.98
17.
61 4
.15
(c) P
lant
and
Equ
ipm
ent
1,3
33.0
7 2
16.4
4 (1
4.06
) 1
,535
.45
517
.65
99.
66 (6
.56)
610
.75
924
.70
815
.42
(d) F
urni
ture
and
Fix
ture
s 2
9.21
4.7
9 (0
.66)
33.
34 6
.53
3.2
0 (0
.17)
9.5
6 2
3.78
22.
68(e
) Veh
icle
s 1
6.21
3.5
2 (1
.37)
18.
36 5
.20
1.9
9 (0
.96)
6.2
3 1
2.13
11.
01(f)
Offi
ce e
quip
men
ts 2
8.01
6.9
1 (0
.57)
34.
35 1
9.71
4.0
8 (0
.43)
23.
36 1
0.99
8.3
0(g
) Lea
seho
ld im
prov
emen
ts 2
.79
- -
2.7
9 2
.79
- -
2.7
9 -
-(h
) Flo
atin
g E
quip
men
ts 2
17.6
0 2
.66
- 2
20.2
6 -
16.
31 -
16.
31 2
03.9
5 2
17.6
0(i)
Lab
orat
ory
Equ
ipm
ents
0.8
5 -
- 0
.85
0.4
8 0
.01
- 0
.49
0.3
6 0
.37
(j) S
hutte
ring
Mat
eria
ls 4
6.53
26.
12 -
72.
65 -
18.
44 -
18.
44 5
4.21
46.
53(k
) Acc
esso
ries
& A
ttach
men
ts 2
4.39
9.6
1 -
34.
00 -
8.7
0 -
8.7
0 2
5.30
24.
39 T
otal
1,9
20.2
1 2
84.0
9 (1
6.66
) 2
,187
.64
566
.76
152
.97
(8.1
2) 7
11.6
1 1
,476
.03
1,3
53.4
5

49
AFC
ON
S IN
FRA
STR
UC
TUR
E LI
MIT
EDN
otes
form
ing
part
of t
he fi
nanc
ial s
tate
men
ts fo
r the
yea
r end
ed 3
1st M
arch
, 201
7
Not
e 3.
Pro
pert
y, P
lant
and
Equ
ipm
ents
(Con
td.)
Not
es:
(1)
Add
ition
s fo
r the
yea
r inc
lude
s fo
reig
n ex
chan
ge c
apita
lised
dur
ing
the
year
am
ount
ing
to `
10.
69 C
rore
s (P
revi
ous
Year
` 0
.29
Cro
res)
. The
bal
ance
am
ount
of F
orei
gn e
xcha
nge
fluct
uatio
n,
capi
talis
ed a
s a
part
of c
ost o
f Tan
gibl
e A
sset
s, re
mai
ning
to b
e am
ortis
ed is
` 1
6.28
Cro
res
(Pre
viou
s ye
ar `
9.5
7 C
rore
s).
(2)
Free
hold
Lan
d w
ith a
car
ryin
g am
ount
of `
203
.00
Cro
res
(as
at 3
1st M
arch
, 201
6 `
203.
00 C
rore
s) h
as b
een
secu
red
by e
quita
ble
mor
tgag
e w
ith c
onso
rtium
ban
ks. R
efer
Not
e N
o. 1
4.
B
uild
ings
car
ryin
g am
ount
of `
18.
93 C
rore
s (a
s at
31st
Mar
ch, 2
016
` 17
.61
Cro
res)
has
bee
n se
cure
d by
equ
itabl
e m
ortg
age
with
con
sorti
um b
anks
. Ref
er N
ote
No.
14.
P
lant
and
Equ
ipm
ent i
nclu
ding
Flo
atin
g E
quip
men
ts w
ith a
car
ryin
g am
ount
of `
1,2
09.0
8 C
rore
s (a
s at
31st
Mar
ch, 2
016
` 1,
077.
16 C
rore
s) h
as b
een
secu
red
by w
ay o
f hyp
othe
catio
n in
favo
ur
of te
rm le
nder
s an
d co
nsor
tium
ban
ks h
ave
been
sec
ured
thro
ugh
Inde
ntur
e of
Mor
tgag
e. R
efer
Not
e N
o. 1
4.
(3)
Ther
e is
no
impa
irmen
t los
s on
any
of t
he a
sset
s in
clud
ed a
bove
, as
the
valu
e in
use
is m
ore
than
car
ryin
g am
ount
.
B.
Oth
er In
tang
ible
ass
ets
` in
Cro
res
Part
icul
ars
Gro
ss b
lock
(At c
ost)
Am
ortis
atio
nN
et B
lock
Bal
ance
as
at1st
Apr
il, 2
016
Add
ition
sD
ispo
sals
Bal
ance
as
at31
st M
arch
, 201
7B
alan
ce a
s at
1st A
pril,
201
6A
mor
tisat
ion
for t
he y
ear
Elim
inat
ed o
n di
spos
al o
f as
sets
Bal
ance
as
at31
st M
arch
, 201
7B
alan
ce a
s at
31st M
arch
, 201
7
Com
pute
r sof
twar
e - A
cqui
red
10.
99 0
.71
- 1
1.70
8.2
7 1
.25
- 9
.52
2.1
8
Prev
ious
Yea
r `
in C
rore
s
Part
icul
ars
Gro
ss b
lock
(At c
ost)
Am
ortis
atio
nN
et B
lock
Bal
ance
as
at1st
Apr
il, 2
015
Add
ition
sD
ispo
sals
Bal
ance
as
at31
st M
arch
, 201
6B
alan
ce a
s at
1st A
pril,
201
5A
mor
tisat
ion
for t
he y
ear
Elim
inat
ed o
n di
spos
al o
f as
sets
Bal
ance
as
at31
st M
arch
, 201
6B
alan
ce a
s at
31st M
arch
, 201
6B
alan
ce a
s at
1st A
pril,
201
5
Com
pute
r sof
twar
e -
Acq
uire
d 7
.99
3.0
0 -
10.
99 6
.21
2.0
6 -
8.2
7 2
.72
1.7
8
C.
Cap
ital W
ork
in P
rogr
ess:
` 2
0.80
Cro
res
(As
at 3
1st M
arch
, 201
6 `
124.
28 C
rore
s; A
s at
1st A
pril,
201
5 `
174.
48 C
rore
s).

50
AFCONS INFRASTRUCTURE LIMITED
Note 4. Non-current investments ` in Crores
Particulars Face Value
As at 31st March, 2017 As at 31st March, 2016 As at 1st April, 2015Quantity Amount Quantity Amount Quantity Amount
A. Investments at CostUnquoted Investments (Fully paid)
(a) Investment in equity instruments :(i) of subsidiaries Hazarat & Co.Pvt.Ltd. ` 10 2,02,610 0.20 2,02,610 0.20 2,02,610 0.20 Afcons Offshore & Marine Services Pvt. Ltd. ` 10 1,00,000 0.26 1,00,000 0.26 1,00,000 0.26 Afcons Corrosion Protection Pvt. Ltd. ` 10 80,000 0.06 80,000 0.06 80,000 0.06 Afcons Construction Mideast LLC.* AED 1000 147 0.18 147 0.18 147 0.18 Afcons Infrastructures Kuwait for
Building, Road & Marine Contracting WLL.* KD 1200 49 0.96 49 0.96 49 0.96
Afcons Overseas Construction LLC, Qatar.* QAR 1000 - - 98 0.15 98 0.15 Afcons Mauritius Infrastructure Ltd. Euro 1 11,00,000 9.17 11,00,000 9.17 11,00,000 9.17 Acons Overseas Singapore Pte. Ltd. SGD 1 50,000 0.24 50,000 0.24 50,000 0.24 Afcons Saudi Constructions Co. LLC SAR 100 4,750 0.80 4,750 0.80 - -(ii) of associates - - - Afcons (Mideast) Constructions &
Investments Pvt. Ltd.# ` 100 1 - 1 - 1 - 11.87 12.02 11.22
Less: Provision for Diminution in value of Investment ^ ^ 0.36 @ 0.15 -
11.51 11.87 11.22^ Provision is for Afcons Saudi Constructions Co. LLC* Subsidiary on the basis of control on the composition of the Board of Directors. # denotes value less than rupees ten thousand.
Investments carried at Cost (A) 11.51 11.87 11.22B. Investment in equity instruments at FVTOCI
Quoted Investments (Fully paid)(a) Investment in equity instruments :
Hindustan Oil Exploration Co. Ltd. ` 10 40,072 0.31 40,072 0.29 40,072 0.15 Hindustan Construction Co. Ltd. ` 1 2,000 0.01 2,000 - 2,000 0.01 Simplex Infrastructures Ltd. ` 2 500 0.02 500 - 500 0.02 ITD Cementation India Ltd. ` 1 1,000 0.02 1,000 - 1,000 0.01 Gammon India Ltd. ` 2 250 - 250 - 250 - Tata Consultancy Services Ltd. ` 1 4,00,000 97.24 4,00,000 100.67 4,00,000 102.16
Total Aggregate Quoted Investments 97.60 100.96 102.35Unquoted Investments (Fully paid)
(a) Investment in equity instruments : Simar Port Ltd. ` 10 1,000 - 1,000 - 1,000 - Afcons Overseas Construction LLC, Qatar. QAR 1000 98 0.15 - - - -
0.15 - -Less: Provision for Diminution in value of Investment @ 0.15 - -
Total Aggregate Unquoted Investments - - -@ Provision is for Afcons Overseas Construction LLC, Qatar which is under Liquidation.
C. Investment at FVTPL(a) Investment in mutual funds :
Quoted: SBI Infrastructure Fund ` 10 50,000 0.07 50,000 0.05 50,000 0.06 UTI Infrastructure Fund - Growth Plan ` 10 12,731 0.06 12,731 0.05 12,731 0.06
Total Aggregate Mutual Fund Investment 0.13 0.10 0.12Total Investments Carrying Value (A+B+C) 109.24 112.93 113.69
Notes:(i) Aggregate amount of quoted investments 86.13 86.13 86.13(ii) Aggregate market value of quoted investments 97.73 101.06 102.47(iii) Aggregate carrying value of unquoted investments 11.51 11.87 11.22
Category-wise Other Investments - As per IND-AS 109 classification: ` in CroresParticulars As at 31st March, 2017 As at 31st March, 2016 As at 1st April, 2015
Financial Assets carried at FVTPL - Mutual fund 0.13 0.10 0.12Financial Assets measured at FVTOCI - Equity instruments 97.60 100.96 102.35
97.73 101.06 102.47
Notes forming part of the financial statements for the year ended 31st March, 2017

51
AFCONS INFRASTRUCTURE LIMITED
Note 5. Trade Receivables ` in Crores
ParticularsAs at 31st March, 2017 As at 31st March, 2016 As at 1st April, 2015Current Non Current Current Non Current Current Non Current
i) Unsecured, considered good 711.78 129.65 484.92 115.76 409.46 138.78ii) Doubtful - 20.63 - 20.50 - 25.48
711.78 150.28 484.92 136.26 409.46 164.26Less: Allowance for expected credit losses - 20.63 - 20.50 - 25.48
711.78 129.65 484.92 115.76 409.46 138.78Total 711.78 129.65 484.92 115.76 409.46 138.78
Note 5.1 - Trade ReceivablesThe average realization period on Construction contracts is considered as 180 days. The company has computed the expected credit loss allowance for trade receivables based on a provision matrix. The provision matrix takes into account historical credit loss experience and accordingly provided for. The expected credit loss allowance is calculated based on credit loss experienced under different ageing category. The ageing of receivables at the year end is as below:
` in CroresAge of Receivables As at 31st March, 2017 As at 31st March, 2016 As at 1st April, 2015Within the credit period 502.97 250.04 210.781-180 days past due 2.54 54.59 1.65180-365 days past due 17.91 5.75 33.661-2 years past due 3.46 2.41 4.20More than 2 years past due 46.32 47.41 65.20
Note 5.2 - Movement in the Expected Credit Loss Allowance ` in CroresParticulars As at 31st March, 2017 As at 31st March, 2016 As at 1st April, 2015
Current Non Current Current Non Current Current Non CurrentBalance at beginning of the year - 20.50 - 25.48 - 19.96Add :Provisions made during the year for credit loss - 0.70 - - - 5.52Less :Provision for doubtful debtors / advances no longer required written back
- 0.44 - 3.20 - -
Impairment losses reversed (Provisions written back) - 0.13 - 1.78 - -Balance at end of the year - 20.63 - 20.50 - 25.48
Note 6. Loans ` in CroresParticulars As at 31st March, 2017 As at 31st March, 2016 As at 1st April, 2015
Current Non Current Current Non Current Current Non Current(a) Loans to related parties (Unsecured,
considered good) To Subsidiaries 56.03 - 9.44 - 9.37 - To Joint Operations 46.49 - 43.21 - 40.67 -
102.52 - 52.65 - 50.04 -Less: Provision for doubtful loans and advances - - 0.21 - - -
102.52 - 52.44 - 50.04 -Total 102.52 - 52.44 - 50.04 -
These financial assets are carried at amortised cost
Notes forming part of the financial statements for the year ended 31st March, 2017

52
AFCONS INFRASTRUCTURE LIMITED
Note 7. Other financial assets ` in CroresParticulars As at 31st March, 2017 As at 31st March, 2016 As at 1st April, 2015
Current Non Current Current Non Current Current Non Current(a) Interest on trade receivables as per
arbitration awards 136.58 111.60 137.98 123.33 105.46 113.89
(b) Accruals (i) Interest accrued on bank deposits 0.03 - 0.05 - 0.04 -(c) Others (i) Insurance claims 1.37 - 6.73 - 9.11 - (ii) Other Receivables from Joint Operations 10.12 - 3.79 - 16.08 -
11.49 - 10.52 - 25.19 -(d) Deposits (Unsecured, considered good) (i) Security deposits 9.48 9.03 6.70 12.40 5.31 12.69 (ii) Other Deposits 0.03 0.85 0.03 0.67 0.03 0.57
9.51 9.88 6.73 13.07 5.34 13.26(e) Derivative Assets - - 15.76 - 12.52 10.92(f) Other Loans and Advances (Doubtful) - 0.64 - 0.64 - 0.64 Less: Provision for other doubtful loans and
advances - 0.64 - 0.64 - 0.64 - - - - - -
(g) Other Bank Balances - - - 0.19 - 0.19 Less : Provision for doubtful balances - - - 0.19 - 0.19
- - - - - -Total 157.61 121.48 171.04 136.40 148.55 138.07
Note 8. Other non-current & current assets ` in CroresParticulars As at 31st March, 2017 As at 31st March, 2016 As at 1st April, 2015
Current Non Current Current Non Current Current Non Current(a) Amounts due from customer under construction
contracts Unsecured, considered good 2,459.34 484.69 2,818.01 212.38 2,409.60 246.69 Doubtful - 1.22 - 0.07 - 0.07
2,459.34 485.91 2,818.01 212.45 2,409.60 246.76 Less: Doubtful Provision - 1.22 - 0.07 - 0.07
2,459.34 484.69 2,818.01 212.38 2,409.60 246.69(b) Capital advances - 0.60 - 6.71 - 9.68(c) Prepayments 59.14 3.96 23.79 3.09 17.26 1.84(d) Advances to employees 1.95 - 2.01 - 2.76 -(e) Balances with government authorities (i) VAT credit receivable 24.14 66.48 9.51 75.18 26.00 43.84 (ii) Service Tax credit receivable 17.47 22.19 7.91 21.99 2.82 23.08 (iii) Income tax refund receivable 4.00 - - - - - (iv) Duty credit receivables 0.48 - 19.06 - 14.26 -
46.09 88.67 36.48 97.17 43.08 66.92(f) Others - Advance to vendors and others 96.25 - 97.61 - 92.89 -
Total 2,662.77 577.92 2,977.90 319.35 2,565.59 325.13
Note 8.1 Amounts due from / (to) Customers under Construction contracts ` in CroresParticulars As at 31st March, 2017 As at 31st March, 2016 As at 1st April, 2015
Contracts in progress at the end of the reporting period:Construction cost incurred plus recognised profits less recognised loss to date
17,895.43 14,994.43 14,198.71
Less : Progress Billings 15,079.47 11,974.99 11,543.93 2,815.96 3,019.44 2,654.78
Recognised and included in the financial statements as amounts due : - from customers under construction contracts 2,944.03 3,030.39 2,656.29 - to customers under construction contracts (128.07) (10.95) (1.51)
2,815.96 3,019.44 2,654.78As at 31st March, 2017, retentions held by customers for contract work amounted to ` 188.88 Crores (As at 31st March, 2016 ` 162.24 Crores; As at 1st April, 2015 ` 152.08 Crores). Advances received from customers for contract work amounted to ` 1,354.93 Crores (As at 31st March, 2016 ` 1,188.14 Crores, As at 1st April, 2015 ` 1,308.38 Crores)
Notes forming part of the financial statements for the year ended 31st March, 2017

53
AFCONS INFRASTRUCTURE LIMITED
Note 9. Inventories ` in CroresParticulars As at 31st March, 2017 As at 31st March, 2016 As at 1st April, 2015
(a) Construction Materials - at lower of cost and net realisable value
Steel 211.30 112.25 108.61 Cement 9.82 15.96 8.28 Aggregate 47.28 98.91 12.23 Bitumen 3.02 4.44 0.02 Sand 4.16 8.36 2.41 Other Construction Material 38.96 53.52 20.80
314.54 293.44 152.35(b) Stores and spares - at lower of cost and net
realisable value 200.76 200.48 135.48200.76 200.48 135.48
Total 515.30 493.92 287.83The cost of inventories recognised as an expenses during the year in respect of continuing operation was ` 2,002.31 Crores (for the year ended 31st March, 2016 ` 1,174.13 Crores)
Note 10. Cash and cash equivalents ` in CroresParticulars As at 31st March, 2017 As at 31st March, 2016 As at 1st April, 2015
(a) Balances with banks 20.89 25.43 30.70(b) Cash on hand 0.74 1.29 0.98
Total cash and cash equivalents 21.63 26.72 31.68
Note 10.1. Bank Balance other than Cash and cash equivalents ` in CroresParticulars As at 31st March, 2017 As at 31st March, 2016 As at 1st April, 2015
Earmarked balance with banks- Unpaid dividend accounts 0.54 0.52 0.27- Balances held as margin money or security
against borrowings, guarantees and other commitments 0.09 0.09 0.08
- Other earmarked accounts / escrow account Investment in term deposit 18.68 0.48 1.52
- Original maturity more than 3 months 0.31 3.54 0.15Total 19.62 4.63 2.02
Note 11. Non current tax assets (Net) ` in CroresParticulars As at 31st March, 2017 As at 31st March, 2016 As at1st April, 2015
(a) Advance income tax (net of provisions ` 74.74 Crores)
74.63 59.48 74.67
(As at 31st March, 2016 ` 73.47.Crores; As at 1st April, 2015 ` 65.75 Crores)
Total 74.63 59.48 74.67
Note 12. Share Capital ` in Crores
ParticularsAs at 31st March, 2017 As at 31st March, 2016 As at 1st April, 2015 Number of
shares` in
Crores Number of
shares` in
Crores Number of
shares` in
Crores(a) Authorised Equity shares of ` 10 each. 35,00,00,000 350.00 35,00,00,000 350.00 35,00,00,000 350.00 Preference shares of ` 10 each. 65,00,00,000 650.00 65,00,00,000 650.00 65,00,00,000 650.00
Total 1,00,00,00,000 1,000.00 1,00,00,00,000 1,000.00 1,00,00,00,000 1,000.00(b) Issued, Subscribed and Fully Paid up Equity shares of ` 10 each. (Refer Note (i) below) 7,19,70,238 71.97 7,19,70,238 71.97 7,19,70,238 71.97 0.01% Non Cumulative and Non Profit
Participatory Convertible Preference Shares of ` 10 each. (Refer Note (ii) below) 10,00,00,000 100.00 10,00,00,000 100.00 10,00,00,000 100.00
0.01% Fully and Compulsorily Convertible Non-Cumulative, Non Participatory Preference shares of ` 10 each. (Refer Note (iii) below) 25,00,00,000 250.00 25,00,00,000 250.00 25,00,00,000 250.00
0.01% Fully and Compulsorily Convertible Non-Cumulative, Non Participatory Preference shares of ` 10 each. (Refer Note (iv) below) 10,00,00,000 100.00 10,00,00,000 100.00 10,00,00,000 100.00
Total 52,19,70,238 521.97 52,19,70,238 521.97 52,19,70,238 521.97
Notes forming part of the financial statements for the year ended 31st March, 2017

54
AFCONS INFRASTRUCTURE LIMITED
Note 12. Share Capital (Contd.)
Notes:
(i) Rights, preferences and restrictions attached to Equity Shares:
(a) Rights to receive dividend as may be approved by the Board / Annual General Meeting.(b) The Equity shares are not repayable except in the case of a buy back, reduction of capital or winding up in terms of the provisions
of the Companies Act, 2013.(c) Every member of the company holding equity shares has a right to attend the General Meeting of the company and has a right
to speak and on a show of hands, has one vote if he is present in person and on a poll shall have the right to vote in proportion to his share of the paid-up capital of the company.
(ii) Rights, preferences and restrictions attached to 0.01% Non Cumulative and Non Profit Participatory Convertible Preference Shares:
(a) The Preference Shares shall be non cumulative and non profit participating convertible Preference Shares carrying a fixed rate of dividend of 0.01% per annum to be paid in priority to the holders of any other class of shares.
(b) The Preference Shares shall be deemed to be converted into common equity shares of the Company at a price of ` 68.25 per equity share (consisting of par of ` 10 and a premium of ` 58.25) immediately, automatically and without any further act of the parties in the event of conversion of the Preference Shares mentioned in note iii(a) below.
(c) Every member of the Company holding preference shares has a right to vote in the General Meeting of the Company on resolutions placed before the Company which directly affect the rights attached to his preference shares.
(iii) Rights, preferences and restrictions attached to 0.01% Fully and Compulsorily Convertible Non-Cumulative, Non Participatory Preference shares:
(a) The Preference Shares shall be automatically and mandatorily converted into equity shares on 13th January, 2019 (“Mandatory Conversion Date”) i.e. on the Eleventh year from the Issue date. The mandatory conversion date of the 0.01% Fully and Compulsorily Convertible Non-Cumulative, Non Participatory Preference shares has been revised from 13th January, 2013 (5th year from the date of issue) to 13th January, 2019 (11th year from the date of issue) in terms of the consent letter obtained from the preference shareholder and the special resolution passed by the members of the Company at the Extra Ordinary General Meeting of the Company held on 10th January,2013.
(b) On Mandatory Conversion Date, the Preference Shares shall be converted into such number of equity shares of the Company constituting 74% of the outstanding equity share capital and Convertible Preference Shares of the Company calculated on a fully diluted basis on the date of issue (i.e. 13th January, 2008) resulting into 24,65,40,258 equity shares.
(c) The Preference Shares shall be entitled to fixed non-cumulative preferential dividend at the fixed rate of 0.01% per annum which shall be paid in priority to the holder of any other class of shares.
(d) On return of capital on a liquidation or otherwise of the assets of the Company, the holder of Preference Shares shall be entitled, in priority to any payment to the holders of any other class of shares, to be repaid a sum equal to the capital paid up or credited as paid up on the Preference Shares held by it.
(e) Every member of the Company holding preference shares has a right to vote in the General Meeting of the Company on resolutions placed before the Company which directly affect the rights attached to his preference shares.
(iv) Rights, preferences and restrictions attached to 0.01% Fully and Compulsorily Convertible Non-Cumulative, Non Participatory Preference shares:
(a) The Preference Shares shall be automatically and mandatorily converted into equity shares on 21st March, 2019 (“Mandatory Conversion Date”) i.e. on the expiry of Five year from the Issue date.
(b) On Mandatory Conversion Date, the Preference Shares shall be converted into such number of equity shares of the Company at the price of ` 132 per Equity shares (consisting of par of ` 10 and a premium of ` 122).
(c) The Preference Shares shall be entitled to fixed non-cumulative preferential dividend at the fixed rate of 0.01% per annum which shall be paid in priority to the holder of any other class of shares.
(d) On return of capital on a liquidation or otherwise of the assets of the Company, the holder of Preference Shares shall be entitled, in priority to any payment to the holders of any other class of shares, to be repaid a sum equal to the capital paid up or credited as paid up on the Preference Shares held by it.
(e) Every member of the Company holding preference shares has a right to vote in the General Meeting of the Company on resolutions placed before the Company which directly affect the rights attached to his preference shares.
Notes forming part of the financial statements for the year ended 31st March, 2017

55
AFCONS INFRASTRUCTURE LIMITED
Note 12. Share Capital (Contd.)
(v) Details of shares held by the holding company, the ultimate holding company, their subsidiaries and associates:Particulars As at 31st March, 2017 As at 31st March, 2016 As at 1st April, 2015
Equity Shares
0.01% Non Cumulative
and Non Profit
Participatory Convertible Preference
Shares
0.01% Fully and
Compulsorily Convertible
Non-Cumulative
Non Participatory Preference
shares
Equity Shares
0.01% Non Cumulative
and Non Profit
Participatory Convertible Preference
Shares
0.01% Fully and
Compulsorily Convertible
Non-Cumulative
Non Participatory Preference
shares
Equity Shares
0.01% Non Cumulative
and Non Profit
Participatory Convertible Preference
Shares
0.01% Fully and
Compulsorily Convertible
Non-Cumulative
Non Participatory Preference
sharesNumber of shares Number of shares Number of shares
Shapoorji Pallonji & Co.Pvt.Ltd., the holding company 4,90,53,819 - 10,00,00,000 4,90,26,389 - 10,00,00,000 4,90,09,022 - 10,00,00,000Subsidiaries of the holding company:Floreat Investments Limited (FIL) 1,30,15,929 10,00,00,000 - 1,30,15,929 10,00,00,000 - 1,30,15,929 10,00,00,000 -Renaissance Commerce Pvt. Limited 40,16,250 - - 40,16,250 - - 40,16,250 - -Hermes Commerce Ltd 40,16,250 - - 40,16,250 - - 40,16,250 - -
(vi) Details of shares held by each shareholder holding more than 5% of shares of the Company:Class of shares / Name of shareholder As at 31st March, 2017 As at 31st March, 2016 As at 1st April, 2015
Number of shares held
% holding Number of shares held
% holding Number of shares held
% holding
Equity sharesShapoorji Pallonji & Co. Pvt. Ltd 4,90,53,819 68.16 4,90,26,389 68.12 4,90,09,022 68.10Floreat Investments Limited 1,30,15,929 18.09 1,30,15,929 18.09 1,30,15,929 18.09Renaissance Commerce Pvt. Ltd 40,16,250 5.58 40,16,250 5.58 40,16,250 5.58Hermes Commerce Ltd. 40,16,250 5.58 40,16,250 5.58 40,16,250 5.580.01% Non Cumulative and Non Profit Participatory Convertible Preference SharesFloreat Investments Limited 10,00,00,000 100.00 10,00,00,000 100.00 10,00,00,000 100.000.01% Fully and Compulsorily Convertible Non-Cumulative Non Participatory Preference sharesGoswami Infratech Private Ltd. 25,00,00,000 100.00 25,00,00,000 100.00 25,00,00,000 100.000.01% Fully and Compulsorily Convertible Non-Cumulative Non Participatory Preference sharesShapoorji Pallonji & Co.Pvt.Ltd. 10,00,00,000 100.00 10,00,00,000 100.00 10,00,00,000 100.00
Notes forming part of the financial statements for the year ended 31st March, 2017

56
AFCONS INFRASTRUCTURE LIMITED
Note 13. Other Equity ` in CroresParticulars As at
31st March, 2017As at
31st March, 2016As at
1st April, 2015Capital Reserve 0.19 0.19 0.19Capital Redemption Reserve 0.13 0.13 0.13Securities Premium Account 10.28 10.28 10.28Contingencies Reserve 8.00 8.00 8.00Debenture Redemption Reserve 42.50 44.57 25.40General Reserve 65.70 65.70 65.70Foreign Currency Translation Reserve (1.23) (1.64) -Retained Earnings 844.73 797.24 756.60Reserve for Equity Instruments through other comprehensive income 11.57 14.94 16.32
Total 981.87 939.41 882.62
(i) Movement in other equity: ` in CroresParticulars As at
31st March, 2017As at
31st March, 2016(a) Capital reserve Opening balance 0.19 0.19 Closing balance 0.19 0.19
(b) Capital redemption reserve Opening balance 0.13 0.13 Closing balance 0.13 0.13
(c) Securities premium account Opening balance 10.28 10.28 Closing balance 10.28 10.28
(d) Contingencies reserve Opening balance 8.00 8.00 Closing balance 8.00 8.00
(e) Debenture redemption reserve Opening balance 44.57 25.40 Add : Transferred from surplus in Statement of Profit and Loss (2.07) 19.17 Closing balance 42.50 44.57
(f) General reserve Opening balance 65.70 65.70 Closing balance 65.70 65.70
(g) Foreign Currency translation Reserve Opening balance (1.64) - Add : Transferred from surplus in Statement of Profit and Loss 0.41 (1.64) Closing balance (1.23) (1.64)
(h) Surplus in Statement of Profit and Loss Opening balance 797.24 756.60 Add: Profit for the year 75.12 87.73 Add: Other items classified to other comprehensive income (3.66) (1.88) Less: Appropriations
Interim Dividend on Equity Shares(` 3.00 per share) (Previous Year ` 3.00 per share)
21.59 21.59
Dividend on Preference Shares(` 0.001 per Share) (Previous Year ` 0.001 per share)
0.05 0.05
Tax on Dividend 4.40 4.40Transferred (from) / to Debenture redemption reserve (2.07) 19.17
Closing balance 844.73 797.24
(i) Reserve for Equity Instruments through other comprehensive income Opening balance 14.94 16.32 Net fair value gain on investments in equity instruments at FVTOCI (3.37) (1.38) Closing balance 11.57 14.94
Total 981.87 939.41
Notes forming part of the financial statements for the year ended 31st March, 2017

57
AFCONS INFRASTRUCTURE LIMITED
Note 13. Other Equity (Contd.)
(ii) Nature and purpose of each reserve within Other equityCapital ReserveThe capital reserve is on account of acquisition of subsidiary companiesCapital Redemption ReserveAs per the provisions of Companies Act, Capital Redemption Reserve is created out of the general reserve for the amount equivalent to the paid up capital of shares bought back by the Company.Securities premium accountWhere company issued shares at a premium, a sum equal to the aggregate amount of the premium received on those shares shall be transferred to a “securities premium account” as per the provisions of applicable Companies Act. This reserve is utilized as per the provisions of the Companies Act.Contingencies reserveThe Contingency Reserve was created to protect against loss for amounts due from a Partnership firm.Debenture redemption reserveThe Companies Act requires that where a company issues debentures, it shall create a debenture redemption reserve out of profits of the company available for payment of dividend. The amounts credited to the debenture redemption reserve may not be utilized by the company except to redeem debenturesGeneral reserveThe general reserve is used from time to time to transfer profits from retained earnings for appropriation purposes. There is no policy of regular transfer. As the general reserve is created by a transfer from one component of equity to another and is not an item of other comprehensive income, items included in the general reserve will not be reclassified subsequently to profit or loss.Foreign currency translation reserveExchange differences relating to the translation of the results and net assets of the foreign operations from their functional currencies to the presentation currency (i.e. `) are recognised directly in other comprehensive income and accumulated in the foreign currency translation reserve. The cumulative amount is reclassified to profit or loss when the net investment is disposed-off.Retained earning and dividend on equity sharesThis represent the surplus/ (deficit) of the profit or loss. The amount that can be distributed by the Company to its equity shareholders is determined considering the requirements of the Companies Act, 2013. Thus, the amount reported above are not distributable in entirety.On 22nd March, 2017, an interim dividend of ` 3.00 per share (total dividend ` 21.59 Crores) was paid to holders of fully paid equity shares.Reserve for equity instrument through other comprehensive incomeThis reserve represents the cumulative gains and losses arising on the revaluation of equity instruments measured at fair value through other comprehensive income. The group transfers amounts from this reserve to retained earnings when the relevant equity securities are derecognized.
Note 14. Non Current Borrowings ` in CroresParticulars As at 31st March, 2017 As at 31st March, 2016 As at 1st April, 2015
Measured at amortised cost(a) Debentures (Unsecured) (Refer Note A) 400.00 300.00 200.00(b) Working Capital loans (Refer note (i) of B) From banks Secured 50.00 200.00 150.00(c) Equipment Loan (Secured) (Refer vote (ii) of B) From banks Rupee Loan 307.00 280.00 105.15 Foreign Currency Loan 58.37 72.88 154.36(d) Other loans and advances (Refer note (iii) of B) Foreign Currency Loan (Secured) Buyers Credit from Banks 15.83 4.77 14.91
Total 831.20 857.65 624.42Notes:(A) Details of Debentures ` in Crores
Particulars Terms of repayment As at 31st March, 2017 As at 31st March, 2016 As at 1st April, 2015Secured Unsecured Secured Unsecured Secured Unsecured
Unsecured, Redeemable, Unlisted, Non-Convertible Debentures (NCDs)i) 10.45% NCDs Refer Note (i) below - - - 100.00 - 100.00ii) 9.99% NCDs Refer Note (ii) below - 50.00 - 50.00 - 50.00iii) 9.87% NCDs Refer Note (iii) below - 50.00 - 50.00 - 50.00iv) 9.05% NCDs Refer Note (iv) below - 100.00 - 100.00 - -v) 8.60% NCDs Refer Note (v) below - 100.00 - - - -vi) 8.65% NCDs Refer Note (vi) below - 100.00 - - - -Total Non-Convertible Debentures - 400.00 - 300.00 - 200.00
Notes forming part of the financial statements for the year ended 31st March, 2017

58
AFCONS INFRASTRUCTURE LIMITED
Note 14. Non Current Borrowings (Contd.)
Notes:(i) The NCDs carry interest @ 10.45% per annum payable quarterly and are redeemable in full at the end of 5 years from the date of issue
i.e. on 12th February, 2018. The NCDs carry a Put option to the holders and a Call option to the Company to get the NCDs redeemed at any time after 31/2 years from the date of allotment i.e. 12th August, 2016, by giving a 30 days notice to the other party.
(ii) The NCDs carry interest @ 9.99% per annum payable annually and are redeemable in full at the end of 3 years and 40 days from the date of allotment i.e. on 26th April, 2018.
(iii) The NCDs carry interest @ 9.87% per annum payable semi annually and are redeemable in full at the end of 5 years and 20 days from the date of allotment i.e. on 6th April, 2020.
(iv) The NCDs carry interest @ 9.05% per annum payable semi annually and are redeemable in full at the end of 5 years from the date of allotment i.e. 15th January, 2021. The NCDs carry a Put option to the holders and Call option to the Company to get the NCDs redeemed at any time after 3 years 3 months and 16 days from the date of allotment i.e. on 30th April, 2019, by giving 30 days notice to the other party.
(v) The NCDs carry interest @ 8.60% per annum payable annually and are redeemable in full at the end of 5 years from the date of issue i.e. on 6th September, 2021.
(vi) The NCDs carry interest @ 8.65% per annum payable annually and are redeemable in full at the end of 5 years from the date of issue i.e. on 23rd February, 2022.
(B) Details of terms of repayment of long-term borrowings from Banks and security provided in respect thereof: ` in CroresParticulars Terms of
repayment and security
As at 31st March, 2017 As at 31st March, 2016 As at 1st April, 2015Secured Unsecured Secured Unsecured Secured Unsecured
(i) Working Capital loans from banksAxis Bank Ltd. Refer
Note (ii) below
- - 100.00 - - -State Bank of India (Refer Note (i) below)
50.00 - 100.00 - 150.00 -
Total - Term Loan 50.00 - 200.00 - 150.00 -(ii) Equipment Loan from banksRupee Loan:
Refer Note (iii) below
Indian Overseas Bank - - - - 5.15 -Axis Bank 100.00 - - - - -State Bank of India 207.00 - 280.00 - 100.00 -Foreign Currency Loan (ECB):DBS Bank Ltd - - - - 37.42 -HSBC Bank - - - - 37.42 -Societe Generale 58.37 - 72.88 - 79.52 -Total - Equipment Loan 365.37 - 352.88 - 259.51 -(iii) Other Loans and Advances from banks - Buyer's Credit Foreign Currency LoansState Bank of India
Refer Note (iv)
below
- - - - 14.91 -Yes Bank 7.36 - 4.77 - - -Axis Bank 5.65 - - - - -Kotak Mahindra Bank 2.82 - - - - -
Total - Other loans and advances 15.83 - 4.77 - 14.91 -Total Long-term Borrowings from Banks 431.20 - 557.65 - 424.42 -
(i) Working Capital loan from State Bank of India is secured by second charge on Plant and Machinery.(ii) Working Capital loans from Banks carry interest ranging from 9.75% to 9.95% per annum. The repayment schedule of the loans are
as follows.
As at 31st March, 2017 ` in CroresBank Name Loan Amount Repayment in 2018-19 Repayment in 2019-20State Bank of India 50.00 1 installment of 25.00 1 installment of 25.00
As at 31st March, 2016 ` in CroresBank Name Loan Amount Repayment in 2017-18 Repayment in 2018-19 Repayment in 2019-20Axis Bank Ltd. 100.00 - 1 installment of 100.00 -State Bank of India 100.00 2 installments of 25.00
each 1 installment of 25.00 1 installment of 25.00
As at 1st April, 2015 ` in CroresBank Name Loan Amount Repayment
in 2016-17Repayment in 2017-18
Repayment in 2018-19
Repayment in 2019-20
State Bank of India 150.00 2 installments of 25.00 each
2 installments of 25.00 each
1 installment of 25.00
1 installment of 25.00
Notes forming part of the financial statements for the year ended 31st March, 2017

59
AFCONS INFRASTRUCTURE LIMITED
(iii) Secured by first pari passu charge on Plant & Machinery. The Rupee loan of Axis Bank Ltd. carry interest @ 8.75% per annum and State Bank of India carry interest ranging from 9.90% to 9.95% per annum. Foreign currency loans carry interest @ 3.95% per annum. The repayment schedule of the loans are as follows.
As at 31st March, 2017 ` in CroresBank Name Loan
AmountRepayment in 2018-19
Repayment in 2019-20
Repayment in 2020-21
Repayment in 2021-22
Repayment in 2022-23
Repayment in 2023-24
Rupee Loan:Axis Bank Ltd. 100.00 - 1 installment
of 20.00 1 installment
of 20.00 1 installment
of 20.00 1 installment
of 20.00 1 installment
of 20.00State Bank of India 207.00 1 Installment
of 20.00 and2 installments of 16.67 each
1 Installment of 20.00 and
2 installments of 16.67 each
1 Installment of 0.33 and
2 installments of 16.66 each
Installments of 16.66 and
16.67
2 Installments of 16.67 each
Foreign Currency Loan:Societe Generale 58.37 2 Installments
of9.73 each
2 Installments of
9.73 each
Installments of
9.73 and 9.72As at 31st March, 2016 ` in Crores
Bank Name Loan Amount
Repayment in 2017-18
Repayment in 2018-19
Repayment in 2019-20
Repayment in 2020-21
Repayment in 2021-22
Repayment in 2022-23
Rupee Loan:State Bank of India 280.00 Installments
of 20.00 and 33.33
Installments of 20.00 and
33.33
Installments of 20.00 and
33.33
Installments of 20.00 and
33.33
1 installment of 33.33
1 installment of 33.35
Foreign Currency Loan:Societe Generale 72.88 2 installments
of 6.63 each 2 installments
of 9.94 each 2 installments
of 9.94 each 2 installments
of 9.93 eachAs at 1st April, 2015 ` in Crores
Bank Name Loan Amount Repayment in 2016-17
Repayment in 2017-18
Repayment in 2018-19
Repayment in 2019-20
Repayment in 2020-21
Rupee Loan:Indian Overseas Bank 5.15 1 installment
of 5.15 - - - -
State Bank of India 100.00 1 installment of 20.00
1 installment of 20.00
1 installment of 20.00
1 installment of 20.00
1 installment of 20.00
Foreign Currency Loan:DBS Bank Ltd 37.42 Installments of
12.47,12.47 &12.48
- - - -
HSBC Bank 37.42 2 installments of 18.71 each
- - - -
Societe Generale 79.52 Installments of4.68 and 6.24
2 installments of 6.24 each
2 installments of 9.35 each
2 installments of 9.35 each
2 installments of 9.36 each
(iv) The Loans carry interest ranging from 1.88% to 1.99% per annum. Secured by first charge by way of equitable mortgage on the Immovable properties of the company situated at Andheri, Mumbai on a
pari passu basis. Company’s stock of construction material, stores, WIP, Book Debt is further secured under Indenture of Mortgage and first charge on movable plant & machinery of the company upto 50% of the Fund based limits with other term lenders on pari passu basis and also by goods covered under Letters of Credit.
The repayment schedule of the loans are as follows:
As at 31st March, 2017 ` in CroresBank Name Loan Amount Repayment in 2018-19 Repayment in 2019-20Yes Bank 7.36 4.67 2.69Axis Bank 5.65 2.84 2.81Kotak Mahindra Bank 2.82 - 2.82
As at 31st March, 2016 ` in CroresBank Name Loan Amount Repayment in 2018-19Yes Bank 4.77 4.77
As at 1st April, 2015 ` in CroresBank Name Loan Amount Repayment in 2016-17State Bank of India 14.91 Installments of 1.57,1.57,1.99,4.20 and 5.58
Notes forming part of the financial statements for the year ended 31st March, 2017Note 14. Non Current Borrowings (Contd.)

60
AFCONS INFRASTRUCTURE LIMITED
Note 15. Trade Payables ` in CroresParticulars As at 31st March, 2017 As at 31st March, 2016 As at 1st April, 2015
Current Non Current Current Non Current Current Non CurrentTrade Payables for goods and services 1,340.63 147.85 1,157.91 100.61 948.77 65.12
Total 1,340.63 147.85 1,157.91 100.61 948.77 65.12
Disclosures as required under the Micro, Small and Medium Enterprises Development Act, 2006 (MSMED Act) ` in CroresParticulars As at 31st March, 2017 As at 31st March, 2016 As at 1st April, 2015
Principal amount due to suppliers registered under the MSMED Act and remaining unpaid as at period end 3.32 1.46 0.66Interest due to suppliers registered under the MSMED Act and remaining unpaid as at period end 0.18 0.05 0.03Principal amounts paid to suppliers registered under the MSMED Act, beyond the appointed day during the period - - -Interest paid, other than under Section 16 of MSMED Act, to suppliers registered under the MSMED Act, beyond the appointed day during the period - - -Interest paid, under Section 16 of MSMED Act, to suppliers registered under the MSMED Act,beyond the appointed day during the period - - -Interest due and payable towards suppliers registered under MSMED Act, for payments already made - - -Further interest remaining due and payable for earlier periods 0.18 0.05 0.03
Note 16. Other Financial Liabilities ` in Crores
Particulars As at 31st March, 2017 As at 31st March, 2016 As at 1st April, 2015Current Non Current Current Non Current Current Non Current
(a) Current maturities of long-term debt (Refer Note below) 116.30 - 182.28 - 268.02 -
(b) Interest accrued but not due on borrowings 8.97 - 5.85 - 2.90 -(c) Unclaimed / unpaid dividends 0.54 - 0.53 - 0.27 -(d) Unpaid matured deposits and interest
accrued thereon - - - - 0.01 -(e) Interest accrued on advance from customers 10.90 - 11.32 - 5.51 -(f) Other payables
(i) Trade / security deposits received 36.73 - 22.80 - 4.20 -(ii) Amount received on invocation of Bank
Guarantees 63.65 - 68.32 - 68.73 -(iii) Distribution of profit payable to member
of JV - 0.01 - 0.01 - 0.01(iv) Others 17.14 - 11.80 - 25.26 -
117.52 0.01 102.92 0.01 98.19 0.01Total 254.23 0.01 302.90 0.01 374.90 0.01
Note:
Particulars As at 31st March, 2017 As at 31st March, 2016 As at 1st April, 2015Current Non Current Current Non Current Current Non Current
(a) Working Capital Loans from Banks (Secured) 50.00 - 50.00 - 125.00 -(b) Equipment Loans from Banks (Secured) 53.33 - 116.24 - 134.08 -(c) Foreign Currency Loans (Secured) 12.97 - 16.04 - 8.94 -
Total 116.30 - 182.28 - 268.02 -
Note 17. Current Tax and Deferred Tax(a) Income Tax Expense ` in Crores
Particulars As at 31st March, 2017 As at 31st March, 2016Current Tax:Current Income Tax Charge 27.01 46.69Adjustments in respect of prior years 0.36 0.21Deferred TaxIn respect of current year origination and reversal of temporary differences 11.37 21.51Adjustments in respect prior years - 1.47Total Tax Expense recognised in profit and loss account 38.74 69.88
Notes forming part of the financial statements for the year ended 31st March, 2017

61
AFCONS INFRASTRUCTURE LIMITED
Note 17. Current Tax and Deferred Tax (Contd.)
(b) Numerical Reconciliation between average effective tax rate and applicable tax rate : ` in CroresParticulars As at 31st March, 2017 As at 31st March, 2016
Amount Tax Rate Amount Tax RateProfit Before tax from Continuing Operations 113.86 157.61Income Tax using the Company's domestic Tax rate # 39.40 34.60% 54.55 34.61%Non taxable income (0.64) -0.56% (0.56) -0.36%Loss in respect of which deferred tax assets not recognised due to uncertainty (3.39) -2.98% - -Disallowable expenses 1.59 1.40% 2.02 1.28%Utilisation of tax losses - - (2.90) -1.84%Effects of tax rates differences of entities operating in other jurisdictions / having different tax rates 0.82 0.72% 16.29 10.34%Charge / (credit) in respect of previous years 0.36 0.32% 1.68 1.07%Others 0.60 0.53% (1.20) -0.76%Income Tax recognised In P&L from Continuing Operations(Effective Tax Rate) 38.74 34.02% 69.88 44.34%
# The tax rate used for the reconciliation above is the corporate tax rate of 30%, surcharge of 12% on corporate tax, education cess 2% and secondary and higher education cess of 1% on corporate tax.
(c) Movement of Deferred Tax ` in Crores
ParticularsFor the Year ended 31st March, 2017
Opening Balance
Recognised in profit and Loss
Recognised in OCI
Closing Balance
Tax effect of items constituting deferred tax liabilities Property, Plant and Equipment 88.30 8.69 - 96.99 Arbitration awards 109.67 16.07 - 125.74 FVTPL financial asset 0.01 - - 0.01
197.98 24.76 - 222.74Tax effect of items constituting deferred tax assets Employee Benefits (6.64) (3.00) (1.94) (11.58) Expected Credit Loss (1.30) 0.05 - (1.25) Provisions (7.59) 1.12 - (6.47) Other Items (1.73) (1.17) - (2.90) Minimum Alternate Tax Credit (65.16) (10.39) - (75.55)
(82.42) (13.39) (1.94) (97.75)Net Tax (Asset) / Liabilities 115.56 11.37 (1.94) 124.99
ParticularsFor the Year ended 31st March, 2016
Opening Balance
Recognised in profit and Loss
Recognised in OCI
Closing Balance
Tax effect of items constituting deferred tax liabilities Property, Plant and Equipment 85.50 2.80 - 88.30 Arbitration awards 97.55 12.12 - 109.67 FVTPL financial asset 0.01 - - 0.01
183.06 14.92 - 197.98
Tax effect of items constituting deferred tax assets Employee Benefits (4.87) (0.78) (0.99) (6.64) Expected Credit Loss (1.88) 0.58 - (1.30) Provisions (7.15) (0.44) - (7.59) Carryforward Tax Loss (8.59) 8.59 - - Others (0.08) (1.65) - (1.73) Minimum Alternate Tax Credit (66.92) 1.76 - (65.16)
(89.49) 8.06 (0.99) (82.42)Net Tax (Asset) / Liabilities 93.57 22.98 (0.99) 115.56
Note 18. Other non-current & current liabilities ` in Crores
Particulars As at 31st March, 2017 As at 31st March, 2016 As at 1st April, 2015Current Non Current Current Non Current Current Non Current
(a) Advances from customers 954.68 523.01 1,275.84 193.88 953.48 372.91(b) Advance against sale of scrap 1.05 - 1.27 - 1.66 -(c) Other payables (i) Statutory remittances
(VAT, Service Tax, etc.) 43.90 - 22.63 - 29.20 0.23
Total 999.63 523.01 1,299.74 193.88 984.34 373.14
Notes forming part of the financial statements for the year ended 31st March, 2017

62
AFCONS INFRASTRUCTURE LIMITED
Note 19. Provisions ` in CroresParticulars As at 31st March, 2017 As at 31st March, 2016 As at 1st April, 2015
Current Non Current Current Non Current Current Non Current(a) Provision for employee benefits: (i) Provision for compensated absences 17.99 - 9.02 - 7.40 - (ii) Provision for gratuity (net) 6.48 8.99 5.07 5.11 4.77 1.92
24.47 8.99 14.09 5.11 12.17 1.92(b) Provision - Others: (i) Provision for projected loss on contract - - 4.46 - 4.97 - (ii) Tax on dividend on Equity Shares - - - - 2.16 -
- - 4.46 - 7.13 -Total 24.47 8.99 18.55 5.11 19.30 1.92
(i) The provision for employee benefits includes annual leave and vested long service leave entitlements accrued, gratuity and ex-gratia.(ii) The Provision for projected loss created for Projects - 1) Package CC-15 - Design and Construction of Elevated Viaduct and
construction of six Elevated Stations of phase-III for Delhi MRTS, 2) Package CC-29 - Part Design and Construction of Elevated Viaduct and Construction of 2 Elevated Stations of line - 8 of phase-III for Delhi MRTS.
Note 20. Current tax liabilities (net) ` in CroresParticulars As at 31st March, 2017 As at 31st March, 2016 As at 1st April, 2015
Provision for tax (net of advance tax ` 12.37 Crores) 13.29 25.20 9.90(As at 31st March, 2016 ` 19.15 Crores; As at 1st April, 2015 ` 20.13 Crores)
Total 13.29 25.20 9.90
Note 21. Current Borrowings ` in CroresParticulars As at 31st March, 2017 As at 31st March, 2016 As at 1st April, 2015
(a) Working Capital Demand Loans from banks Secured (Refer note below) 100.00 249.00 168.30 Unsecured 75.00 - 49.50
175.00 249.00 217.80(b) Short term Loans from Bank Foreign Currency Loan: Buyers Credit (Secured) (Refer note below) - 16.70 - Packing Credit Finance: Secured (Refer note below) - 66.25 - Unsecured - - 9.36
- 82.95 9.36(c) Cash Credit Facility from Banks Secured (Refer note below) 505.08 346.19 295.05 Unsecured 0.01 - -(d) Commercial Papers (Unsecured) From Banks 49.49 18.70 46.29 From Other parties 273.11 292.61 295.83
(e) Acceptances 60.58 30.57 50.91(f) From Related Parties (Unsecured) From Subsidiaries (Interest free) 0.90 - -
Total 1,064.17 1,020.02 915.24Note:Details of security for the secured short-term borrowings:
Particulars Terms of security As at31st March, 2017
As at31st March, 2016
As at1st April, 2015
Working Capital Demand Loans (WCDL) From banks: ING Vysya Bank - - 118.80 IDBI Bank Ltd. Refer Note below - 50.00 49.50 Export Import Bank of India 100.00 199.00 -
100.00 249.00 168.30Short Term Loans from Bank Foreign Currency Loan: Buyers Credit
Yes Bank Ltd. (US$) Refer Note below - 16.70 - Packing Credit Finance:
State Bank of India Refer Note below - 66.25 -Cash Credit Facility Refer Note below 505.08 346.19 295.05
Notes forming part of the financial statements for the year ended 31st March, 2017

63
AFCONS INFRASTRUCTURE LIMITED
Note 21. Current Borrowings (Contd.)Note: Secured by first charge by way of equitable mortgage on the Immovable properties of the company situated at Andheri, Mumbai on a pari passu basis. Company’s stock of construction material, stores, WIP, Book Debt is further secured under IOM and first charge on movable plant & machinery of the company upto 50% of the Fund based limits with other term lenders on pari passu basis. Cash credit facility / Working Capital Demand Loan is further secured by the Company’s proportionate share of Current Assets in all the Joint Ventures both present and future. Cash Credit Facility and Working Capital Demand Loan from Banks carry interest ranging from 7.50% to 11.00% per annum (as on 31st March, 2016 interest ranging from 9.00% to 12.25% per annum and as on 1st April, 2015 interest ranging from 10.15% to 13.65% per annum) Commercial Paper carry interest ranging from 6.50% to 8.21% per annum (as on 31st March, 2016 interest ranging from 8.95% to 9.30% per annum and as on 1st April,2015 interest ranging from 9.00% to 10.13% per annum). Acceptances carry interest @ 10.20% per annum (as on 31st March, 2016 @ 10.35% per annum and as on 1st April, 2015 @ 11.65% per annum). Buyers Credit Interest ranges from 1.29% to 1.35% per annum as on 31st March, 2016. PCFC carry interest @ 0.97% per annum as on 31st March, 2016 and 1.06% per annum as on 1st April, 2015.
Note 22. Revenue from operations ` in CroresParticulars For the year ended
31st March, 2017For the year ended
31st March, 2016(a) Revenue from sale of goods (Including excise duty, if any)
(Refer Note (i) below) 14.15 8.55
(b) Construction contract revenue (Refer Note (ii) below) 5,658.82 4,097.04(c) Other operating income (Refer Note (iii) below) 66.69 69.11
Total 5,739.66 4,174.70
Note Particulars For the year ended31st March, 2017
For the year ended31st March, 2016
(i) Revenue from sale of goods comprises:Construction Materials 14.15 8.55
Total - Sale of products 14.15 8.55(ii) Construction contract revenue comprises:
Construction Revenue 5,895.93 4,244.01Less : Value added tax 237.11 146.97
Total - Sale of services 5,658.82 4,097.04(iii) Other operating income comprises:
Sale of scrap 9.86 13.16Duty Scrip credit - 26.33Equipment Hire Charges 40.06 8.93Consultancy Service Charges 11.62 9.76Others 5.15 10.93
Total - Other operating revenues 66.69 69.11
Note 23. Other income ` in CroresParticulars For the year ended
31st March, 2017For the year ended
31st March, 2016(a) Interest income on financial assets at amortised cost (Refer Note (i) below) 60.96 97.52(b) Dividend income:
From non trade, on current investments ** 1.86 1.62(c) Other non operating income (Refer Note (ii) below) 40.08 35.63(d) Fair value gain on financial assets designated at FVTPL 0.03 -
Total 102.93 134.77** all dividends from equity instruments designated as FVTOCI for both years, relate to investments held at the end of each reporting period.Note Particulars For the year ended
31st March, 2017For the year ended
31st March, 2016(i) Interest income comprises:
Interest from banks deposits 0.06 1.84Interest on loans and advances 9.23 4.63Interest on Arbitration awards 43.36 89.58Interest income from non current investments 0.01 0.01Interest on income tax refund 7.74 1.46Other Interest 0.56 -
Total - Interest income 60.96 97.52(ii) Other non operating income comprises:
Provision for doubtful debtors / advances no longer required written back 0.44 3.20Creditors / Excess provision written back 1.96 7.17Insurance Claim received 15.87 15.05Provision for Projected Loss written back 4.46 4.97Net Gain on foreign currency transactions and translation 11.78 -Reversal of expected credit loss on financial assets 0.14 1.78Miscellaneous income 5.43 3.46
Total - Other non-operating income 40.08 35.63
Notes forming part of the financial statements for the year ended 31st March, 2017

64
AFCONS INFRASTRUCTURE LIMITED
Note 24. Cost of construction ` in CroresParticulars For the year ended
31st March, 2017For the year ended
31st March, 2016Cost of Construction Materials consumed (Including Bought out Items) 2,002.31 1,174.13Other Construction Expenses: Stores and spare consumed 489.92 361.00 Subcontracting expenses (Including lease payment for equipments hired)
1,119.34 914.76
Site Installation 51.46 32.19 Technical Consultancy 76.70 54.41 Power and fuel consumed 277.77 167.79 Freight and handling charges 70.23 33.91
2,085.42 1,564.06Total 4,087.73 2,738.19
Note 25. Cost of traded goods ` in CroresParticulars For the year ended
31st March, 2017For the year ended
31st March, 2016Construction Materials 29.99 34.49
Total 29.99 34.49
Note 26. Employee benefits expense ` in CroresParticulars For the year ended
31st March, 2017For the year ended
31st March, 2016Salaries and wages, including bonus 522.90 461.10Contributions to provident and other funds 39.82 27.82Staff welfare expenses 22.42 20.23
Total 585.14 509.15
Note 27. Finance costs ` in CroresParticulars For the year ended
31st March, 2017For the year ended
31st March, 2016Interest expense on: (Refer note below)
Bank overdrafts and loans 220.38 206.96Advances from related parties 0.23 0.29Advance from clients 46.75 34.21Others 3.13 4.14
270.49 245.60Less: Amounts included in the cost of qualifying assets - -
270.49 245.60Interest on delayed / deferred payment of income tax 0.76 1.49Other borrowing costs: Bank Guarantee Commission including Bank Charges 26.10 20.64 L/c charges & Processing Fees 1.71 1.75
Total 299.06 269.48Note:
Particulars For the year ended31st March, 2017
For the year ended31st March, 2016
Interest expense: On financial liability at amortised cost 270.49 245.60 On financial liability at FVTPL - -
Total 270.49 245.60
Note 28. Depreciation and amortisation expenses ` in CroresParticulars For the year ended
31st March, 2017For the year ended
31st March, 2016
Depreciation and amortisation for the current year on tangible assets 164.97 152.99Depreciation and amortisation for the current year on intangible assets 1.25 2.06
Total 166.22 155.05
Notes forming part of the financial statements for the year ended 31st March, 2017

65
AFCONS INFRASTRUCTURE LIMITED
Note 29. Other expenses ` in CroresParticulars For the year ended
31st March, 2017For the year ended
31st March, 2016Water and Electricity 8.11 6.38Rent 56.25 53.55Repairs and maintenance - Buildings 0.01 0.02Repairs and maintenance - Machinery 14.07 18.94Repairs and maintenance - Others 6.16 7.16Insurance charges 45.83 32.38Rates and taxes 149.27 126.14Communication 5.38 4.96Travelling and conveyance 64.71 50.49Security Charges 25.82 24.06Donations and contributions 0.96 1.20Expenditure on Corporate Social Responsibility (CSR) 0.13 0.19Legal and professional 126.51 48.57Auditors remuneration (refer note below) 1.10 1.15Advances written off 0.55 0.21Duty Scrip Written off - 0.25Bad/Irrecoverable Debtors/Unbilled Revenue written off 0.80 8.87Net loss on foreign currency transactions and translation - 16.85Directors Fees 0.24 0.17Expected credit loss on financial assets 1.86 0.15Provision for projected loss on contract - 4.46Loss on sale of fixed assets 2.59 4.29Fair value Loss on financial assets measured at FVTPL - 0.01Hedging expenses 1.38 5.60Miscellaneous expenses 48.86 29.45
Total 560.59 445.50Note: ` in Crores
Particulars For the year ended31st March, 2017
For the year ended31st March, 2016
Auditors remuneration comprises *(a) To statutory auditors
As auditors - statutory audit 0.77 0.70 For taxation matters 0.03 0.10 For other services 0.16 0.18 Reimbursement of expenses 0.01 0.01 For Service tax 0.11 0.14
1.08 1.13(b) To cost auditors for cost audit
As auditors 0.02 0.02 0.02 0.02
Total (a + b) 1.10 1.15* Excludes payment of ` 0.80 Crores (Previous Year ` 0.25 Crores) for taxation matters to an affiliated firm / company of one of the joint auditors covered by a networking arrangement which is registered with The Institute of Chartered Accountants of India.
Notes forming part of the financial statements for the year ended 31st March, 2017

66
AFCONS INFRASTRUCTURE LIMITED
Note 30. Contingent liabilities and commitments (to the extent not provided for) ` in CroresParticulars As at 31st March, 2017 As at 31st March, 2016
(i) Contingent liabilities(a) Claims against the Company not acknowledged as debts
i) Differences with sub-contractors in regard to rates and quantity of materials. 72.73 71.89(b) Claims against the Joint Operations not acknowledged as debts
i) Differences with sub-contractors / clients in regard to scope of work. 97.24 99.45 The above claim is not accepted by the Joint Venture and is contested by the
Subcontractor / client. The Management is confident that the claim will be successfully contested.
(c) Guaranteesi) Bank Guarantees given on behalf of Subsidiaries and Joint Ventures and
counter guaranteed by the Company. 1,545.10 1,379.93
(d) Sales Tax and Entry Tax 20.95 5.87 Represents demands raised by Sales Tax Authorities in matters of a) disallowance
of labour and service charges, consumables etc. b) Tax on AS7 Turnover c) Entry tax and d) Interest and Penalty etc. for which appeal is pending before various appellate authorities.The Company is confident that the cases will be successfully contested.
(e) Excise Duty 0.07 2.06 Represents demands raised by Central Excise Department for Excisability of
girders. The Company is confident that the cases will be successfully contested.(f) Service Tax 167.03 125.16 Represents demand confirmed by the CESTAT / Asst. Commissioner of Service Tax
for a) disallowance of Cenvat Credit, since abatement claimed by the Company, b) disallowance of general exemption of private Transport terminals and c) taxability under "Commercial or Industrial Construction Service", etc. The Company has appealed / in the process of appeal against the said order with Commissioner of Service Tax Mumbai,CESTAT / High Court and is confident that the cases will be successfully contested. The company has received the stay order for some case from the CESTAT.Amount disclosed does not include penalties in certain matters for which amount is unascertainable.
Note:- In respect of items mentioned under Paragraphs (a), (b), (d), (e) and (f) above, till the matters are finally decided, the financial effect cannot be ascertained and future cashflows in respect of above matters are determinable only on receipts of judgements / decisions pending at various Forums / Authorities
(ii) Commitments Estimated amount of contracts remaining to be executed on capital account and
not provided for 15.01 25.13
Note 31. Employee benefit plansDefined Contribution PlanThe total expense recognised in profit or loss of ̀ 36.25 Crores (for the year ended 31st March, 2016: ̀ 22.79 Crores) represents contributions payable to these plans by the Company at rates specified in the rules of the plans. As at 31st March, 2017, contributions of ` 3.71 Crores (as at 31st March, 2016: ` 3.13 Crores) due in respect of 2016-2017 (2015-2016) reporting period had not been paid over to the plans. The amounts were paid subsequent to the end of the respective reporting periods.Defined benefit plansThese plans typically expose the Company to actuarial risks such as, investment risk, interest rate risk, longevity risk and salary risk.Investment riskThe present value of the defined benefit plan liability is calculated using a discount rate which is determined by reference to market yields at the end of the reporting period on government bonds.Interest riskA decrease in the bond interest rate will increase the plan liability.Longevity riskThe present value of the defined benefit plan liability is calculated by reference to the best estimate of the mortality of plan participants both during and after their employment. An increase in the life expectancy of the plan participants will increase the plan’s liability.Salary riskThe present value of the defined benefit plan liability is calculated by reference to the future salaries of plan participants. As such, an increase in the salary of the plan participants will increase the plan’s liability.No other post-retirement benefits are provided to these employees.In respect of the plan, the most recent actuarial valuation of the present value of the defined benefit obligation were carried out as at 31st March, 2017 by M/s. K.A.Pandit, Fellow of the Institute of Actuaries of India. The present value of the defined benefit obligation, and the related current service cost and past service cost, were measured using the projected unit credit method.
Notes forming part of the financial statements for the year ended 31st March, 2017

67
AFCONS INFRASTRUCTURE LIMITED
Note 31. Employee benefit plans (Contd.)The principle assumptions used for the purpose of actuarial valuation were as follows.
Particulars Valuation as at31st March, 2017 31st March, 2016 1st April, 2015
Discount rate 7.20% 8.04% 7.96%Expected rate(s) of salary increase (refer note 1) 6.00% 6.00% 4.50%
*Based on India’s standard mortality table with modification to reflect expected changes in mortality.Note 1: The Estimate of rate of escalation in salary considered in actuarial valuation takes into account inflation, seniority, promotion and other relevant factors including supply and demand in the employment market.
Amount recognized in statement of profit and loss in respect of these defined benefit plans are as follows. ` in CroresParticulars Gratuity (Funded)
Year ended 31st March, 2017 Year ended 31st March, 2016Service cost: Current service cost 1.94 1.60 Past service cost and (gain)/loss from settlements 0.69 -Net Interest cost 0.82 0.53Benefits Paid - -Components of defined benefit costs recognised in profit or loss 3.45 2.13
Remeasurement on the net defined benefit liability: ` in CroresParticulars Gratuity (Funded)
Year ended 31st March, 2017 Year ended 31st March, 2016Return on plan assets (excluding amounts included in net interest expense) 0.06 0.05Actuarial (gains) / losses arising from changes in demographic assumptions - (0.11)Actuarial (gains) / losses arising from changes in financial assumptions 2.42 2.13Actuarial (gains) / losses arising from experience adjustments 3.12 0.80
Components of defined benefit costs recognised in other comprehensive income 5.60 2.87
The current service cost and the net interest expense for the year are included in the ‘Employee benefits expense’ line item in the statement of profit and loss.The remeasurement of the net defined benefit liability is included in other comprehensive income.Movements in the present value of the defined benefit obligation are as follows. ` in Crores
Particulars Gratuity (Funded) Year ended 31st March, 2017 Year ended 31st March, 2016
Opening defined benefit obligation 20.77 17.40Current service cost 1.94 1.60Interest Cost 1.67 1.38Remeasurement (gains)/losses:Actuarial (gains) / losses arising from changes in demographic assumptions - (0.11)Actuarial (gains) / losses arising from changes in financial assumptions 2.42 2.13Actuarial (gains) / losses arising from experience adjustments 3.12 0.80Past service cost, including losses/(gains) on curtailments 0.69 -Liabilities extinguished on settlements - -Benefits paid (5.06) (2.43)Closing defined benefit obligation 25.55 20.77
Movements in the fair value of plan assets are as follows. ` in CroresParticulars Year ended 31st March, 2017 Year ended 31st March, 2016
Opening fair value of plan assets 10.58 10.71Interest income 0.85 0.85Remeasurement gain (loss):Return on plan assets (excluding amounts included in net interest expense) (0.06) (0.05)Others - -Contributions from the employer 3.76 1.50Contributions from plan participants - -Assets distributed on settlements - -Benefits paid (5.06) (2.43)Closing fair value of plan assets 10.07 10.58
Notes forming part of the financial statements for the year ended 31st March, 2017

68
AFCONS INFRASTRUCTURE LIMITED
Note 31. Employee benefit plans (Contd.)The Company pays premium to the group gratuity scheme of LICSignificant actuarial assumptions for the determination of the defined obligation are discount rate, expected salary increase and mortality. The sensitivity analyses below have been determined based on reasonably possible changes of the respective assumptions occurring at the end of the reporting period, while holding all other assumptions constant.1) If the discount rate is 100 basis points higher (lower), the defined benefit obligation would decrease by ` 2.05 Crores (increase by
` 2.41 Crores) (as at 31st March, 2016: decrease by ` 0.78 Crores (increase by ` 0.84 Crores)).2) If the expected salary growth increases (decreases) by 1%, the defined benefit obligation would increase by ` 2.41 Crores (decrease
by ` 2.09 Crores) (as at 31st March, 2016: increase by ` 0.85 Crores (decrease by ` 0.80 Crores)).3) If the life expectancy increases (decreases) by one year for both men and women, the defined benefit obligation would increase by
` 0.18 Crores (decrease by ` 0.21 Crores) (as at 31st March, 2016: increase by ` 0.13 Crores (decrease by ` 0.14 Crores).The sensitivity analysis presented above may not be representative of the actual change in the defined benefit obligation as it is unlikely that the change in assumptions would occur in isolation of one another as some of the assumptions may be correlated.Furthermore, in presenting the above sensitivity analysis, the present value of the defined benefit obligation has been calculated using the projected unit credit method at the end of the reporting period, which is the same as that applied in calculating the defined benefit obligation liability recognised in the balance sheet.There was no change in the methods and assumptions used in preparing the sensitivity analysis from prior years.The average duration of the benefit obligation at 31st March, 2017 is 16 years (as at 31st March, 2016: 15 years).The Company expects to make a contribution of ` 6.48 Crores (as at 31st March, 2016: ` 5.07 Crores) to the defined benefit plans during the next financial year.Maturity profile of defined benefit obligation:Projected Benefits Payable in Future Years From the Date of Reporting
` in Crores1st Following Year 2.582nd Following Year 1.953rd Following Year 1.794th Following Year 1.835th Following Year 1.64Sum of Years 6 To 10 10.73
Note 32. Earnings per share (EPS)EPS is calculated by dividing the profit attributable to the equity shareholders by the weighted average number of equity shares outstanding during the year, as under :
Particulars Year ended31st March, 2017
(`)
Year ended31st March, 2016
(`)Basic earnings per shareFrom continuing operations 2.20 2.57Total basic earnings per share 2.20 2.57
Particulars Year ended31st March, 2017
(`)
Year ended31st March, 2016
(`)Diluted earnings per shareFrom continuing operations 2.20 2.57Total diluted earnings per share 2.20 2.57
Basic earnings per shareThe earnings and weighted average number of ordinary shares used in the calculation of basic earnings per share are as follows:
Particulars Year ended31st March, 2017
Year ended31st March, 2016
Profit / (loss) for the year attributable to owners of the Company - earnings used in calculation of basic earning per share (` in Crores) 75.12 87.73
Dividends paid on convertible non-participating preference shares (` in Crores) (0.05) (0.05)Earnings used in the calculation of basic earnings per share 75.07 87.68Profits used in the calculation of basic earnings per share from continuing operations (` in Crores) 75.07 87.68
Weighted average number of equity shares 340,738,268 340,738,268
Notes forming part of the financial statements for the year ended 31st March, 2017

69
AFCONS INFRASTRUCTURE LIMITED
Note 32. Earnings per share (EPS) (Contd.)The weighted average number of equity shares for the purpose of basic earnings per share is as follows:
Particulars Year ended31st March, 2017
Year ended31st March, 2016
Number NumberWeighted average number of shares used in calculation of basic earnings per share 71,970,238 71,970,238Shares deemed to be issued for no consideration in respect of:- Convertible preference shares 268,768,030 268,768,030Weighted average number of shares used in calculation of basic earnings per share 340,738,268 340,738,268
Diluted earnings per shareThe earnings and weighted average number of ordinary shares used in the calculation of diluted earnings per share are as follows:
Particulars Year ended31st March, 2017
Year ended31st March, 2016
Profit / (loss) for the year attributable to owners of the Company - earnings used in calculation of basic earning per share (` in Crores) 75.07 87.68Earnings used in the calculation of diluted earnings per share (` in Crores) 75.07 87.68Profits used in the calculation of diluted earnings per share from continuing operations (` in Crores) 75.07 87.68
The weighted average number of equity shares for the purpose of diluted earnings per share reconciles to the weighted average number of equity shares used in the calculation of basic earnings per share as follows:
Particulars Year ended31st March, 2017
Year ended31st March, 2016
Number NumberWeighted average number of shares used in calculation of basic earnings per share 71,970,238 71,970,238Shares deemed to be issued for no consideration in respect of:- Convertible preference shares 268,768,030 268,768,030Weighted average number of shares used in calculation of diluted earnings per share 340,738,268 340,738,268
Note 33. Operating Lease ArrangementsThe Company as lesseeLeasing arrangementsThe company has taken various offices, residential & godown premises, land and equipments under operating lease or leave and licence agreements. These are generally cancellable and range between 11 months and 3 years under leave and licence agreement and are renewable by mutual consent on mutually agreeable terms. The group does not have an option to purchase the leased assets at the expiry of the lease periods.Payments recognised as an expense ` in Crores
Particulars For the year ended31st March, 2017
For the year ended31st March, 2016
(i) Lease payments recognised for residential and other properties in the Statement of Profit and Loss under ‘Rent’ in Note 29. 56.25 53.55(ii) Lease payments for equipments are recognised in the Statement of Profit and Loss under 'Subcontracting Expenses' in Note 24. 200.00 167.86
The Company as lessorParticulars For the year ended
31st March, 2017For the year ended
31st March, 2016Rental income earned by the Company from lease receipts for equipments are recognised in the Statement of Profit and Loss Under 'Revenue from Operations' in Note 22.
40.06 8.93
Notes forming part of the financial statements for the year ended 31st March, 2017

70
AFCONS INFRASTRUCTURE LIMITED
Note 34. Disclosure on Specified Bank NotesDuring the year, the Company had Specified Bank Notes (SBN’s) or other denomination notes as defined in the MCA notification, G.S.R. 308 (E), dated 31st March, 2017. The details of SBN’s held and transacted during the period from 8th November, 2016 to 30th December, 2016, the denomination-wise SBN’s and other notes as per the notification are as follows: ` in Crores
Particulars SBNs Other denomination notes
Total
Closing Cash in hand as on 8th November, 2016(includes imprest cash SBN ` 0.21 Crores and other denomination ` 0.46 Crores)
1.37 0.73 2.10
Add: Cash withdrawal from Bank - 1.08 1.08Less: Permitted payments 0.43 1.56 1.99Less: Amount deposited in Banks 0.94 0.01 0.95Closing cash in hand as on 30th December, 2016 - 0.24 0.24
For the purpose of this clause, the term ‘Specified Bank Notes’ shall have the same meaning provided in the notification of the Government of India, in the Ministry of Finance, Department of Economic Affairs number S.O. 3407(E), dated 8th November, 2016.
Note 35. Corporate Social Responsibility:Gross amount required to be spent by the Holding Company during the year: ` Nil
Amount spent during the year: ` in CroresCSR activities Paid To be paid TotalPromoting education 0.13 - 0.13Total 0.13 - 0.13
Note 36. Segment information :a) Segment information for Primary reporting (by business segment) Information reported to the Chief Operating Decision Maker (CODM) for the purposes of resource allocation and assessment of
segment performance focuses on the geographic perspective. Accordingly, the company has only one reportable business segment of construction business relating to infrastructure, hence information for primary business segment is not given.
b) Segment information for Secondary segment reporting (by geographical segment). The Company has two reportable geographical segments based on location of customers.
(i) Revenue from customers within India - Local projects(ii) Revenue from customers outside India - Foreign projects
Secondary : Geographical (Location of customers) ` in CroresParticulars Local Projects Foreign Projects TotalIncome from operation 5,079.25 660.41 5,739.66
(3,665.05) (509.65) (4,174.70)Carrying amount of asset 2,200.20 9.90 2,210.10
(1,891.48) (30.91) (1,922.39)Figures in parenthesis are those of previous year.Revenue from Major products and services: The Major activity of the Company is Infrastructure activities.Information about major customers: Revenue from external customers contributing to more than 10% of the Group’s Revenue amounts to ` 2,988.80 Crores (for the year 2015-16 ` 2,133.26 Crores). These customers pertains to Roads and Metro Rail Projects.
Notes forming part of the financial statements for the year ended 31st March, 2017

71
AFCONS INFRASTRUCTURE LIMITED
Note 37. Related party disclosures(a) Details of related parties: Related Party where Control exists
Holding CompanyShapoorji Pallonji & Co. Pvt. Ltd.
Subsidiaries of the Company Hazarat & Company Private Limited Afcons Corrosion Protection Private Limited Afcons Offshore and Marine Services Private Limited Afcons Construction Mideast LLC Afcons Infrastructures Kuwait for Building, Road and Marine Contracting WLL Afcons Overseas Construction LLC Afcons Gulf International Project Services FZE Afcons Mauritius Infrastructure Ltd. Afcons Overseas Singapore Pte Ltd. Afcons Infra Projects Kazakhstan LLP Afcons Saudi Constructions LLC Afcons Overseas Project Gabon SARL
Associate of the Company Afcons (Mideast) Constructions and Investments Private Limited
Fellow Subsidiary(s) Floreat Investments Limited
Hermes Commerce Limited Renaissance Commerce Private Limited SP Jammu Udhampur Highway Private Limited Forvol International Services Limited Armada C-7 Pte Ltd. Shapoorji AECOS Construction Pvt. Ltd. Forbes & Company Ltd. Shapoorji Pallonji Qatar, WLL Eureka Forbes Ltd. Armada Madura EPC Limited Stertling & Wilson Pvt.Ltd. Shapoorji Pallonji Rural Solutions Pvt.Ltd. Forbes Facility Services Pvt.Ltd.
Joint Operations Transtonnelstroy Afcons Joint Venture Dahej Standby Jetty Project Undertaking Afcons Gunanusa Joint Venture Afcons Pauling Joint Venture Strabag AG Afcons Joint Venture Saipem Afcons Joint Venture Ircon Afcons Joint Venture Afcons Sener LNG Construction Projects Pvt.Ltd. Afcons Sibmost Joint Venture (w.e.f. 3rd August, 2016) Afcons Vijeta PES Joint Venture (w.e.f. 25th May, 2016)
Key Management Personnel Mr. S. P. Mistry – Chairman Mr. K. Subrahmanian – Vice Chairman & Managing Director Mr. S. Paramasivan – Deputy Managing Director Mr. Giridhar Rajagopalan (w.e.f. 1st October, 2016) Mr. Akhil Kumar Gupta (w.e.f.1st October, 2016)
Notes forming part of the financial statements for the year ended 31st March, 2017

72
AFCONS INFRASTRUCTURE LIMITED
Note 37. Related party disclosures (Contd.)(b) Details of transactions with related parties for the period 01/04/2016 to 31/03/2017 ` in Crores
Nature of Transaction Holding Company(s)
Subsidiaries Fellow subsidiary(s)
Jointly Controlled Operations
Associate Company
Key Management Personnel
Total
CY PY 15-16 CY PY 15-16 CY PY 15-16 CY PY 15-16 CY PY 15-16 CY PY 15-16 CY PY 15-16Managerial Remuneration paid a) Short Term Employee Benefit 6.46 3.25 6.46 3.25 b) Post Employment Benefits 0.78 0.24 0.78 0.24 c) Other Long Term Benefits 0.63 0.35 0.63 0.35Sitting Fees paidS.P.Mistry 0.03 0.01 0.03 0.01Dividend on Preference SharesFloreat Investments Limited - 0.01 - 0.01Shapoorji Pallonji & Co. Pvt. Ltd. - 0.01 - 0.01Interim Dividend on Equity SharesShapoorji Pallonji & Co. Pvt. Ltd. 14.72 14.71 14.72 14.71Floreat Investments Limited 3.90 3.90 3.90 3.90Hermes Commerce Limited 1.20 1.20 1.20 1.20Renaissance Commerce Private Ltd. 1.20 1.20 1.20 1.20K.Subrahmanian 0.02 0.02 0.02 0.02S.Paramasivan 0.01 0.01 0.01 0.01Giridhar Rajagopalan @ 0.00 - 0.00 -Income from Consultancy ServicesShapoorji Pallonji & Co. Pvt. Ltd. 0.36 1.50 0.36 1.50Overhead Charges RecoveredStrabag-AG Afcons Joint Venture 3.30 2.82 3.30 2.82Interest IncomeAfcons Construction Mideast, LLC 2.30 - 2.30 -Afcons Overseas Construction LLC, Qatar - 0.04 - 0.04Afcons Infrastructures Kuwait for Building,Road & Marine Contracting WLL.
- 0.12 - 0.12
Afcons Sener LNG Construction Projects Pvt. Ltd. 0.13 0.05 0.13 0.05Ircon-Afcons Joint Venture 0.07 0.24 0.07 0.24Income from Services chargesAfcons Overseas Singapore Pte Ltd. 0.06 - 0.06 -Strabag-AG Afcons Joint Venture - 5.02 - 5.02Afcons Construction Mideast, LLC 0.74 0.29 0.74 0.29Afcons Overseas Project Gabon SARL 10.46 2.96 10.46 2.96Subcontract IncomeTranstonnelstroy-Afcons Joint Venture 0.76 0.68 0.76 0.68SP Jammu Udhampur Highway Pvt. Ltd - 11.97 - 11.97Income from Equipment HireIrcon-Afcons Joint Venture 0.27 1.81 0.27 1.81Strabag-AG Afcons Joint Venture 0.95 0.66 0.95 0.66Afcons Overseas Project Gabon SARL 38.84 6.38 38.84 6.38Sale of Spares/Materials/AssetsTranstonnelstroy-Afcons Joint Venture 0.14 0.26 0.14 0.26Afcons Construction Mideast, LLC 0.83 - 0.83 -Afcons Overseas Project Gabon SARL 13.19 6.87 13.19 6.87Shapoorji Pallonji & Co. Pvt. Ltd. - 1.42 - 1.42Advance GivenAfcons Construction Mideast, LLC 54.04 33.07 54.04 33.07Afcons Infrastructures Kuwait for Building,Road & Marine Contracting WLL.
0.42 1.16 0.42 1.16
Transtonnelstroy-Afcons Joint Venture 6.32 11.89 6.32 11.89Afcons Gunanusa Joint Venture 1.04 0.18 1.04 0.18Ircon-Afcons Joint Venture 4.01 9.69 4.01 9.69Afcons (Mideast) Constructions and Investments Private Limited
0.03 0.02 0.03 0.02
Afcons Offshore & Marine Services Pvt. Ltd.@ 0.00 0.02 0.00 0.02Afcons Overseas Construction LLC, Qatar 0.03 0.49 0.03 0.49Hazarat & Company Private Limited @ 0.01 0.00 0.01 0.00Afcons Saudi Constructions LLC 0.23 0.14 0.23 0.14Afcons Sener LNG Construction Projects Pvt. Ltd. @ 0.00 1.02 0.00 1.02Shapoorji Pallonji Qatar WLL 4.10 - 4.10 -
Notes forming part of the financial statements for the year ended 31st March, 2017

73
AFCONS INFRASTRUCTURE LIMITED
Nature of Transaction Holding Company(s)
Subsidiaries Fellow subsidiary(s)
Jointly Controlled Operations
Associate Company
Key Management Personnel
Total
CY PY 15-16 CY PY 15-16 CY PY 15-16 CY PY 15-16 CY PY 15-16 CY PY 15-16 CY PY 15-16Advance Received backIrcon-Afcons Joint Venture (4.33) (12.17) (4.33) (12.17)Afcons Construction Mideast, LLC (8.11) (31.69) (8.11) (31.69)Afcons Infrastructures Kuwait for Building,Road & Marine Contracting WLL.
(0.17) (2.02) (0.17) (2.02)
Transtonnelstroy-Afcons Joint Venture (4.30) (9.25) (4.30) (9.25)Afcons Gunanusa Joint Venture (0.23) (0.27) (0.23) (0.27)Afcons (Mideast) Constructions and Investments Private Limited
(0.03) (0.02) (0.03) (0.02)
Afcons Offshore & Marine Services Pvt. Ltd. @ (0.00) (0.02) (0.00) (0.02)Afcons Corrosion Protection Private Limited - (0.00) - (0.00)Afcons Overseas Construction LLC, Qatar (0.21) (0.50) (0.21) (0.50)Hazarat & Company Private Limited @ (0.01) (0.00) (0.01) (0.00)Afcons Sener LNG Construction Projects Pvt. Ltd. (0.04) - (0.04) -Shapoorji Pallonji Qatar WLL - (17.93) - (17.93)Service Charges paidAfcons Infrastructures Kuwait for Building,Road & Marine Contracting WLL.
1.20 1.10 1.20 1.10
Afcons Overseas Construction LLC, Qatar - 0.43 - 0.43Shapoorji Pallonji & Co. Pvt. Ltd. - 0.24 - 0.24Housekeeping services paidForbes Facility Services Pvt Ltd 3.80 0.95 3.80 0.95Rent ExpenseHazarat & Company Private Limited 0.02 0.02 0.02 0.02Forbes & Company Limited 0.60 0.59 0.60 0.59Expenses incurred by /(on behalf of) AfconsAfcons Construction Mideast, LLC 0.01 0.01 0.01 0.01Transtonnelstroy-Afcons Joint Venture 0.01 0.01 0.01 0.01Strabag-AG Afcons Joint Venture 3.11 2.72 3.11 2.72Afcons Gunanusa Joint Venture 0.51 0.51 0.51 0.51Afcons Sener LNG Construction Projects Pvt. Ltd. - 0.01 - 0.01Afcons Overseas Project Gabon SARL - 0.10 - 0.10Armada Madura EPC Limited 0.04 0.19 0.04 0.19Civil and Interior worksShapoorji Pallonji & Co. Pvt. Ltd. - 2.88 - 2.88Legal & Professional Fees (Strategic Support Services)Shapoorji Pallonji & Co. Pvt. Ltd. 16.16 12.34 16.16 12.34Travelling ExpensesForvol International Service Ltd 11.70 6.12 11.70 6.12Equipment Hire Charges PaidAfcons Infrastructures Kuwait for Building,Road & Marine Contracting WLL.
2.98 3.08 2.98 3.08
Purchase of Assets / MaterialsTranstonnelstroy-Afcons Joint Venture 0.04 0.05 0.04 0.05Sterling & Wilson Pvt.Ltd . 4.58 0.62 4.58 0.62Shapoorji Pallonji Rural Solutions Pvt Ltd 0.23 0.20 0.23 0.20Eureka Forbes Ltd. 0.34 0.21 0.34 0.21Guarantees Given for/ (Released)Afcons Corrosion Protection Private Limited - (0.25) - (0.25)Afcons Gunanusa Joint Venture 22.50 - 22.50 -Strabag-AG Afcons Joint Venture (25.75) - (25.75) -Transtonnelstroy-Afcons Joint Venture (24.86) (89.42) (24.86) (89.42)Ircon-Afcons Joint Venture - (10.46) - (10.46)Afcons Overseas Project Gabon SARL (44.28) 182.36 (44.28) 182.36Afcons Infrastructures Kuwait for Building,Road & Marine Contracting WLL.
(1.33) (11.36) (1.33) (11.36)
Afcons Sener LNG Construction Projects Pvt. Ltd. - (15.28) - (15.28)Afcons - Vijeta - PES Joint Venture 30.24 - 30.24 -Afcons – Sibmost Joint Venture 234.75 - 234.75 -
Notes forming part of the financial statements for the year ended 31st March, 2017Note 37. Related party disclosures (Contd.)(b) Details of transactions with related parties for the period 01/04/2016 to 31/03/2017 ` in Crores

74
AFCONS INFRASTRUCTURE LIMITED
Nature of Transaction Holding Company(s)
Subsidiaries Fellow subsidiary(s)
Jointly Controlled Operations
Associate Company
Key Management Personnel
Total
CY PY 15-16 CY PY 15-16 CY PY 15-16 CY PY 15-16 CY PY 15-16 CY PY 15-16 CY PY 15-16SBLC Given forAfcons Overseas Singapore Pte Ltd 32.55 34.40 32.55 34.40Outstanding amount of guarantee given/ (taken)Afcons Corrosion Protection Private Limited - 0.08 - 0.08Afcons Gunanusa Joint Venture 346.78 333.43 346.78 333.43Strabag-AG Afcons Joint Venture 133.90 165.73 133.90 165.73Transtonnelstroy-Afcons Joint Venture 480.71 505.57 480.71 505.57Dahej Standby Jetty Project Undertaking 112.17 112.44 112.17 112.44Afcons Infrastructures Kuwait for Building,Road & Marine Contracting WLL.
6.33 7.91 6.33 7.91
Afcons Overseas Project Gabon SARL 122.96 182.36 122.96 182.36Afcons - Vijeta - PES Joint Venture 30.24 - 30.24 -Afcons – Sibmost Joint Venture 234.75 - 234.75 -Outstanding amount of SBLC given/ (taken)Afcons Overseas Singapore Pte Ltd 66.14 34.40 66.14 34.40Outstanding Amount Loans & Advances Dr/ (Cr)Afcons Construction Mideast, LLC 55.31 8.99 55.31 8.99Afcons Gunanusa Joint Venture 33.51 32.20 33.51 32.20Strabag-AG Afcons Joint Venture 2.63 2.63 2.63 2.63Transtonnelstroy-Afcons Joint Venture 7.15 5.00 7.15 5.00Saipem Afcons Joint Venture 0.29 0.30 0.29 0.30Afcons Overseas Construction LLC, Qatar 0.03 0.21 0.03 0.21Afcons Infrastructures Kuwait for Building,Road & Marine Contracting WLL.
(0.90) - (0.90) -
Ircon-Afcons Joint Venture 0.01 0.27 0.01 0.27Afcons Saudi Constructions LLC 0.36 0.14 0.36 0.14Afcons Sener LNG Construction Projects Pvt. Ltd. 1.16 1.07 1.16 1.07Afcons Overseas Project Gabon SARL - 0.10 - 0.10Afcons Overseas Singapore Pte Ltd. (Guinea Br) 0.34 - 0.34 -Other ReceivablesStrabag-AG Afcons Joint Venture 11.87 5.45 11.87 5.45Outstanding Amount - DebtorsAfcons Construction Mideast, LLC 2.34 - 2.34 -Transtonnelstroy-Afcons Joint Venture 3.97 3.23 3.97 3.23Shapoorji Pallonji & Co. Pvt. Ltd. 0.51 1.83 0.51 1.83Ircon-Afcons Joint Venture 0.02 0.04 0.02 0.04Afcons Overseas Singapore Pte Ltd. (Guinea Br) 0.10 - 0.10 -Afcons Overseas Project Gabon SARL 4.20 8.16 4.20 8.16Armada Madura EPC Limited 0.04 0.04 0.04 0.04Strabag-AG Afcons Joint Venture 1.66 0.71 1.66 0.71Outstanding Amount - CreditorsForvol International Service Ltd 1.39 1.80 1.39 1.80Forbes Facility Services Pvt Ltd 0.87 0.40 0.87 0.40Eureka Forbes Ltd. 0.22 0.07 0.22 0.07Forbes & Company Limited 0.12 0.04 0.12 0.04Sterling & Wilson Pvt.Ltd . 0.83 0.12 0.83 0.12Shapoorji Pallonji Rural Solutions Pvt Ltd - 0.14 - 0.14Shapoorji Pallonji & Co. Pvt. Ltd. 12.76 11.58 12.76 11.58Afcons Infrastructures Kuwait for Building,Road & Marine Contracting WLL.
2.15 1.07 2.15 1.07
Afcons Construction Mideast, LLC 4.25 4.34 4.25 4.34Hazarat & Company Private Limited @ - 0.00 - 0.00
Note: (1) Provisions are made for doubtful advances amounting to ` Nil Crore (previous year ` 2.08 Crore) from Afcons Overseas Construction LLC., Qatar (Subsidiary company.) @ Denotes amount less then ` Ten Thousand.
Notes forming part of the financial statements for the year ended 31st March, 2017Note 37. Related party disclosures (Contd.)(b) Details of transactions with related parties for the period 01/04/2016 to 31/03/2017 ` in Crores

75
AFCONS INFRASTRUCTURE LIMITED
Notes forming part of the financial statements for the year ended 31st March, 2017Note 38. The Company had issued ` 100 crores Unsecured Unlisted Non- Convertible Debentures (NCDs) to a Bank on a private
placement basis in each of the financial year 2012-13, 2014-15 and 2015-16 respectively. Out the above NCDs aggregating to ` 200 crores are outstanding as on 31st March, 2017. The said NCDs issued to the Banks have subsequently been transferred in favour of Mutual Funds which are in accordance with the provisions of Section 111A of the Companies Act, 1956 / Section 58 (2) of the Companies Act, 2013. The Company has obtained and placed reliance on legal opinion to the effect that the provisions of Section 58A of the Companies Act, 1956/ Section 73 of the Companies Act, 2013 read together with the Companies Acceptance of Deposit Rules, 1975 / Companies (Acceptance of Deposit Rules), 2014 are not attracted to the NCDs, for aforesaid amount.
Note 39. Afcons Gunanusa Joint Venture (AGJV) had submitted claims for Change orders aggregating to ` 847.41 crore to ONGC. The AGJV has invoked arbitration in respect of the aforesaid change orders, as the same were not approved by Outside Expert Committee (OEC). Claims against change orders and counter claims by ONGC aggregating to ` 30.45 crore will be discussed in arbitration.
Note 40. The Design and Construction of the underground section from Howrah Maidan Station to the west end of the Central Station, to be carried out by the Transtonnelstroy Afcons Joint Venture (TAJV) at Kolkata in the state of West Bengal, had been at a stand still since the last 3 years following issues over the alignment of the railway tracks between the aforesaid 2 stations and the state not handing over land to TAJV. Kolkata Metro Rail Corporation Limited (KMRCL) vide its letter dated 20th March, 2014 issued to TAJV has granted an extension of time up to September 2016, for completion of the above project. Also, additional variation claims have been submitted to KMRCL, by TAJV.
Further to the above, vide its interim order dated 25th September, 2014 ,the High Court of Kolkata, had ordered KMRCL to issue directions to TAJV to commence work and to release payment within 7 days, and the notice of termination to TAJV stood quashed. Additionally, the High Court vide its order dated 12th February, 2015, has reiterated that the final decision with regard to the realignment to be taken within 6 months i.e. by 1st August, 2015, and further the TAJV had also filed an interim civil application with the High Court on 8th June, 2015.
Subsequently, on receipt of a communication dated 21st August, 2015 from KMRCL advising them of the approval of the realignment and requesting them to restart the work, the construction activity has been resumed by the TAJV. In view of the above, the Supervisory Board does not anticipate any further loss to be recognised at this stage
Note 41. Chennai Metro Rail Limited (Client) awarded two contracts (UAA 01 and UAA 05) to Transtonnelstroy Afcons Joint Venture (TAJV) in February 2011 for designing and construction of underground stations and associated tunnels. The original scheduled completion was April 2015 for UAA 01 and January 2015 for UAA 05. Due to unforeseen geological conditions and delays in handing over of land etc., these projects got delayed. Based on actual ground conditions and physical progress as of date, UAA 05 is substantially complete and UAA 01 substantial completion is now foreseen around March 2018. The TAJV had submitted variations to the Client and also invoked arbitration proceedings for speedy recovery of the same. The TAJV has received arbitration awards on 7th March, 2017. The Client can file appeal upto 120 days from the date of award. The Supervisory Board of the TAJV does not anticipate any loss to be recognised at this stage.
Note 42. a) The company has been legally advised that outstanding interest free advances aggregating to ` 901.12 Crores (As at 31st March, 2016: ` 683.10 Crores; As at 1st April, 2015 ` 333.60 Crores). made towards financing the unincorporated joint operations do not come under the purview of Section 186 of Companies Act, 2013 as the Company is in the business of constructing and developing infrastructure facilities.
b) In view of non-applicability of section 186 of the Companies Act, 2013, the details of particulars required to be made thereunder in the financial statements are not applicable in relation to loan made, guarantee given or security provided. For investments made refer to Note no. 4.
Note 43. During the earlier year, company had invoked bank guarantee amounting to ` 56.14 Crores against the sub-contractor for lack of performance in respect of an overseas project. The sub-contractor had submitted to Company, revised claims aggregating to ` 449.44 Crores for delay and cost overrun for the work performed by them in relation to the said project. The company has filed counter claims against the sub-contractor for an amount of ` 585.71 Crores on account of delays and incomplete work done by the sub-contractor. An amount aggregating to ` 108.12 Crores (including ` 56.14 Crores received on invocation of bank guarantee) is outstanding (net of receivables) as on 31st March, 2017 in the books of the Company. Based on the review of back-up documents submitted by the sub-contractor and counter claim filed by the company, no further provision is envisaged at this stage
Note 44. Financial instruments44.1 Capital management The Company manages its capital to ensure that entities in the Group will be able to continue as going concerns while maximising
the return to stakeholders through the optimisation of the debt and equity balance. The capital structure of the Company consists of net debt (borrowings as detailed in notes 14 ,16 and 21 offset by cash and bank
balances) and total equity of the Company. The Company reviews the capital structure on a regular basis. As part of this review, the company considers the cost of capital
and the risks associated with each class of capital. The gearing ratio at 31st March, 2017 of 1.31 (net debt/equity).

76
AFCONS INFRASTRUCTURE LIMITED
Note 44. Financial instruments (Contd.)44.1.1 Gearing ratio The gearing ratio at end of the reporting period was as follows. ` in CroresParticulars As at 31st March, 2017 As at 31st March, 2016 As at 1st April, 2015Debt (i) 2,011.67 2,059.95 1,807.68Cash and bank balances 41.25 31.35 33.71Net debt 1,970.42 2,028.60 1,773.97Total Equity (ii) 1,503.84 1,461.38 1,404.59Net debt to equity ratio 1.31 1.39 1.26
(i) Debt is defined as long-term and short-term borrowings (excluding derivative, financial guarantee contracts and contingent consideration)(ii) Equity includes all capital and reserves of the Company that are managed as capital.
44.2 Categories of financial instrumentsThe following table provides categorisation of all financial instruments at carrying value except non current investments in un-quoted equity instruments of subsidiaries and other entities which are carried at cost. ` in CroresParticulars As at 31st March, 2017 As at 31st March, 2016 As at 1st April, 2015Financial assetsMeasured at fair value through profit or loss (FVTPL)Mandatorily measured: (a) Mutual Fund Investments 0.13 0.10 0.12 (b) Derivative Assets - 15.76 23.44Measured at amortised cost (a) Cash and bank balances 21.63 26.72 31.69 (b) Bank balance other than (a) above 19.62 4.63 2.02 (c) Trade receivables 841.43 600.67 548.23 (d) Loans 102.52 52.44 50.04 (e) Other financial assets 279.09 291.68 263.18Measured at FVTOCI (a) Investments in equity instruments 97.60 100.97 102.35Total Financial Assets 1,362.02 1,092.97 1,021.07Financial liabilitiesMeasured at amortised cost (a) Borrowings 2,011.67 2,059.95 1,807.68 (b) Trade payables 1,488.48 1,258.52 1,013.89 (c) Other financial liabilities 137.94 120.63 106.89Total Financial Liabilities 3,638.09 3,439.10 2,928.46
44.3 Financial risk management objectivesThe Company’s Corporate Treasury function provides services to the business, co-ordinates access to domestic and international financial markets, monitors and manages the financial risks relating to the operations of the Company through internal risk assessment and analyses forex exposures by degree and magnitude of risks. These risks include market risk (including currency risk, interest rate risk and other price risk), credit risk and liquidity risk.The Company seeks to minimise the effects of these risks by using derivative financial instruments to hedge risk exposures. The use of financial derivatives is governed by the Company’s - Risk Management Policy approved by the board of directors, which provide written principles on foreign exchange risk, interest rate risk, the use of financial derivatives and non-derivative financial instruments. Compliance with policies and exposure limits is reviewed on a continuous basis. The Company does not enter into or trade financial instruments, including derivative financial instruments, for speculative purposes.
44.4 Market riskMarket risk is the risk that the fair value of future cash flows of a financial instrument will fluctuate because of changes in market prices. Market risk comprises of Interest rate risk, Currency risk and other price risk. The Company enters into a board approved list of derivative financial instruments to manage its exposure to foreign currency risk and interest rate risk, including but not limited to:• forward foreign exchange contracts to hedge the exchange rate risk arising on the repayment of foreign currency debt;• interest rate swaps to mitigate the risk of rising interest rates on foreign currency debt.
44.5 Foreign currency risk managementThe Company undertakes transactions denominated in foreign currencies; consequently, exposures to exchange rate fluctuations arises. Exchange rate exposures are managed within approved policy parameters utilising appropriate derivative instruments.
Notes forming part of the financial statements for the year ended 31st March, 2017

77
AFCONS INFRASTRUCTURE LIMITED
Note 44. Financial instruments (Contd.)The carrying amounts of the Company’s foreign currency denominated monetary assets and monetary liabilities at the end of the reporting period are as follows:
(` in Crores)
ParticularsLiabilities as at Assets as at
As at 31st March, 2017
As at 31st March, 2016
As at 1st April, 2015
As at 31st March, 2017
As at 31st March, 2016
As at 1st April, 2015
USD Currency 298.33 703.82 897.31 27.44 345.88 328.38Euro Currency 4.64 74.86 74.40 10.92 0.47 19.38QAR Currency 65.31 82.14 20.32 70.77 83.16 17.16OMR Currency 0.08 0.12 0.04 0.60 0.61 0.80Mur Currency 0.13 0.19 0.18 0.01 0.10 0.05UAE Currency 0.36 0.36 0.75 56.20 9.09 35.71JOD Currency 86.54 91.57 97.28 64.42 54.37 55.01BHD Currency 3.03 12.09 15.39 26.64 48.55 45.75KWD Currency 29.41 106.99 80.44 43.88 101.99 80.65GBP Currency 0.08 0.25 0.24 0.02 - -JPY Currency 9.02 5.13 8.00 - - 3.06BDT Currency 0.01 0.04 0.41 0.12 0.59 4.53SAR Currency 0.02 0.01 0.46 0.36 0.14 0.06GHS Currency 258.40 - - 3.11 - -SGD Currency - 0.08 0.34 - - -CHF Currency - - - 0.01 - -CAD Currency - 0.08 - - - -IQD Currency - 0.06 0.04 - - -MYR Currency 0.06 0.07 0.07 - - -
44.5.1 Foreign currency sensitivity analysisThe Company is mainly exposed to the currency of USD, Euro and KWD currency.The following table details the Company’s sensitivity to a 5% increase and decrease in the Indian Rupee against the relevant foreign currencies. 5% is the sensitivity rate used when reporting foreign currency risk internally to key management personnel and represents management’s assessment of the reasonably possible change in foreign exchange rates. This is mainly attributable to the exposure outstanding on receivable and payables in the company at the end of the reporting period. The sensitivity analysis includes only outstanding foreign currency denominated monetary items and adjusts their translation at the period end for a 5% change in foreign currency rates. A positive number below indicates an increase in the profit or equity where the Indian Rupee strengthens 5% against the relevant currency. For a 5% weakening of the Rupee against the relevant currency, there would be a comparable impact on the profit or equity, and the balances below would be negative. The impact of 5 % is also applicable on outstanding foreign currency loans as on the reporting date.
` in Crores
ParticularsUSD Currency Impact Euro Currency Impact KWD Currency Impact
2016- 2017 2015-2016 2016- 2017 2015-2016 2016- 2017 2015-2016Impact on profit or loss for the yearIncrease in exchange rate by 5% (13.54) (17.90) 0.31 (3.72) 0.72 (0.25)Decrease in exchange rate by 5% 13.54 17.90 (0.31) 3.72 (0.72) 0.25
In management’s opinion, the sensitivity analysis is unrepresentative of the inherent foreign exchange risk because the exposure at the end of the reporting period does not reflect the exposure during the year.
44.5.2 Derivative Financial InstrumentsThe Company has entered into foreign currency options and Interest rate swaps to cover its exchange rate and interest rate risks pertaining to its foreign currency borrowings.The following table details the significant derivative financial instruments outstanding at the end of the reporting period:
As at 31st March, 2017 As at 31st March, 2016 As at 1st April, 2015
Foreign Currency Options
Notional Value (US$) Notional Value (US$) Notional Value (US$) - 1,38,88,120 2,78,88,120
Fair Value (` in Crores) Fair Value (` in Crores) Fair Value (` in Crores) - 15.76 23.44
In respect of the Company’s foreign currency option contracts, a 5% appreciation/depreciation of the foreign currency underlying such contracts, would have resulted in an approximate gain / (loss) in the Company’s statement of profit and loss for the years ended as below:
As at 31st March, 2017 As at 31st March, 2016Gain / (Loss) - 0.79 / (0.79)
Notes forming part of the financial statements for the year ended 31st March, 2017

78
AFCONS INFRASTRUCTURE LIMITED
Note 44. Financial instruments (Contd.)
44.6 Interest rate risk management
The Company is exposed to interest rate risk because entities in the Company borrows foreign currency funds at floating interest rates. The risk is managed by the use of interest rate swap contracts and other similar products. Hedging activities are evaluated regularly to align with interest rate views and defined risk appetite, ensuring the most cost-effective hedging strategies are applied.
44.6.1 Interest rate sensitivity analysis
The sensitivity analysis below have been determined based on the exposure to interest rates for both derivatives and non-derivative instruments at the end of the reporting period. For floating rate liabilities, the analysis is prepared assuming the amount of the liability outstanding at the end of the reporting period was outstanding for the whole year. A 50 basis point increase or decrease is used when reporting interest rate risk internally to key management personnel and represents management’s assessment of the reasonably possible change in interest rates.
If interest rates had been 50 basis points higher/lower and all other variables were held constant, the Company’s profit for the year ended 31st March, 2017 would decrease/increase by ` 2.74 crores (2016: decrease/increase by ` 3.70 crores). This is mainly attributable to the Company’s exposure to interest rates on its variable rate borrowings.
44.6.2 Interest rate swap contracts
Under interest rate swap contracts, the Company agrees to exchange the difference between fixed and floating rate interest amounts calculated on agreed notional principal amounts. Such contracts enable the Company to mitigate the risk of changing interest rates and the cash flow exposures on the issued variable rate debt.
44.7 Other price risks
The Company is exposed to equity price risks arising from mutual funds and equity investments. Certain of the Company’s equity investments are held for strategic rather than trading purposes.
Mutual fund investments are susceptible to market price risk, mainly arising from changes in the interest rates or market yields which may impact the return and value of such investments. However, due to the very short tenor of the underlying portfolio in the liquid schemes, these do not hold any significant price risks.
44.7.1 Equity price sensitivity analysis
The sensitivity analyses below have been determined based on the exposure to equity price risks at the end of the reporting period.
If equity prices had been 5% higher/lower:
i) other comprehensive income for the year ended 31st March, 2017 would increase/decrease by ` 4.88 Crores (2015-2016: increase/decrease by ` 5.05 Crores) as a result of the changes in fair value of equity investments measured at FVTOCI.
44.8 Credit risk managementCredit risk is the risk that a counterparty will default on its contractual obligations, resulting in financial loss. Credit risk arises from cash and deposits, derivative financial instruments and credit exposures to customers, including outstanding receivables and committed transactions. The Company has a policy of assessing the creditworthiness of potential customers before entering into transactions by performing a credit evaluation on the financial condition of accounts receivable using independent ratings where available or by assessment of the customer’s credit quality based on its financial position, past experience and other factors.For trade and other receivables, credit evaluation is performed on the financial condition of accounts receivable using independent ratings where available or by assessment of the customer’s credit quality based on its financial position, past experience and other factors. The Company’s most significant customers are public or regulated industry entities which generally have high credit ratings or are of a high credit quality due to the nature of the customer.The maximum exposure to credit risk in respect of the above at the reporting date is the carrying value of financial assets recorded in the financial statements, net of any allowance for losses.
44.9 Liquidity risk managementUltimate responsibility for liquidity risk management rests with the management, which has established an appropriate liquidity risk management framework for the management of the Company’s short-term, medium-term, and long-term funding and liquidity management requirements. The Company manages liquidity risk by maintaining adequate reserves, banking facilities and reserve borrowing facilities, by continuously monitoring forecast and actual cash flows, and by matching the maturity profiles of financial assets and liabilities.
Notes forming part of the financial statements for the year ended 31st March, 2017

79
AFCONS INFRASTRUCTURE LIMITED
Note 44. Financial instruments (Contd.)Liquidity risk tableThe following table details the Group’s remaining contractual maturity for its non-derivative financial liabilities with agreed repayment periods. The tables have been drawn up based on the undiscounted cash flows of financial liabilities based on the earliest date on which the Group can be required to pay. The tables include principal cash flows along with interest. To the extent that interest flows are floating rate, the undiscounted amount is derived from interest rate curves at the end of the reporting period. The contractual maturity is based on the earliest date on which the Group may be required to pay.
` in Crores Weighted average effective
interest rate (%) Upto 1 year 1-5 years 5+years Total
31st March, 2017Borrowings 8.76% 1,258.03 941.39 78.88 2,278.30Trade Payables 1,340.63 147.85 - 1,488.48Other Financial Liabilities 128.96 0.01 - 128.97
2,727.62 1,089.25 78.88 3,895.7531st March, 2016Borrowings 8.80% 1,287.99 961.46 70.54 2,319.99Trade Payables 1,157.91 100.61 - 1,258.52Other Financial Liabilities 114.77 0.01 - 114.78
2,560.67 1,062.08 70.54 3,693.291st April, 2015Borrowings 9.25% 1,250.14 655.82 94.76 2,000.72Trade Payables 948.77 65.12 - 1,013.89Other Financial Liabilities 103.98 0.01 - 103.99
2,302.89 720.95 94.76 3,118.60
The Company is exposed to credit risk in relation to guarantees given. The Company’s maximum exposure in this respect is the maximum amount the Company could have to pay if the guarantee is called on (see Note 30). Based on expectations at the end of the reporting period, the Company considers that it is more likely that such an amount will not be payable under the arrangement. However, this estimate is subject to change depending on the probability of the counterparty claiming under the guarantee which is a function of the likelihood that the beneficiary under the guarantee may default.The following table details the Company’s liquidity analysis for its significant derivative financial instruments. The table has been drawn up based on the undiscounted contractual net cash inflows and outflows on derivative instruments that settle on a net basis, and the undiscounted gross inflows and outflows on those derivatives that require gross settlement. When the amount payable or receivable is not fixed, the amount disclosed has been determined by reference to the projected interest rates as illustrated by the yield curves at the end of the reporting period.
Particulars Less than 1 year 1-5 years 5+years31st March, 2017Gross settled:- Currency Options - - -
- - -31st March, 2016Gross settled:- Currency Options 15.76 - -
15.76 - -1st April, 2015Gross settled:- Currency Options 12.62 10.82 -
12.62 10.82 -
44.10 Fair value measurementsThis note provides information about how the Company determines fair values of various financial assets and financial liabilities.
Notes forming part of the financial statements for the year ended 31st March, 2017

80
AFCONS INFRASTRUCTURE LIMITED
Note 44. Financial instruments (Contd.)44.10.1 Fair value of the Company’s financial assets and financial liabilities that are measured at fair value on a recurring basisSome of the Company’s financial assets and financial liabilities are measured at fair value at the end of each reporting period. The following table gives information about how the fair values of these financial assets and financial liabilities are determined (in particular, the valuation technique(s) and inputs used). ` in Crores
Financial Assets/ Financial Liabilities
Fair value as atFair value hierarchy Valuation technique(s) and key input(s)31st March,
2017 31st March,
20161st April,
20151) Foreign currency Options None Assets –
15.76Assets -23.44
Level 2 Discounted cash flow.Future cash flows are estimated based on forward exchange rates (from observable forward exchange rates at the end of the reporting period) and contract forward rates, discounted at a rate that reflects the credit risk of various counterparties.
2) Investments in Mutual funds at FVTPL (quoted)
0.13 0.10 0.12 Level 1 Fair value of quoted current investments in Mutual Funds is based on price quotations at the reporting date.
3) Investments in equity instruments at FVTOCI (quoted) (see note 1)
97.60 100.96 102.35 Level 1 Quoted bid prices in an active market
Footnote 1: These investments in equity instruments are not held for trading. Instead, they are held for medium or long-term strategic purpose. Upon the application of Ind AS 109, the Group has chosen to designate these investments in equity instruments as at FVTOCI as the directors believe that this provides a more meaningful presentation for medium or long-term strategic investments, than reflecting changes in fair value immediately in profit or loss.There were no transfers between Level 1 and 2 in the period.44.10.2 Fair value of financial assets and financial liabilities that are not measured at fair value (but fair value disclosures are required)The carrying amounts of the following financial assets and financial liabilities (other than Long Term Borrowings) are a reasonable approximation of their fair values. Accordingly, the fair values of such financial assets and financial liabilities have not been disclosed separately.a) Financial Assets
Cash and bank balancesBank balance other than aboveTrade receivablesLoansOther financial assets
b) Financial LiabilitiesShort Term BorrowingsTrade payablesOther financial liabilities
The carrying amount and fair value of Long Term Borrowings, which are measured at amortised cost is disclosed in table below :` in Crores
As at 31st March, 2017 As at 31st March, 2016 As at 1st April, 2015Carrying amount
Fair value Carrying amount
Fair value Carrying amount
Fair value
Financial liabilitiesFinancial liabilities held at amortised cost: 947.49 962.89 1,039.92 1,050.81 892.44 901.54 - Borrowings 947.49 962.89 1,039.92 1,050.81 892.44 901.54
Note 45. First time Ind AS adoption reconciliations:(i) Reconciliation of equity as previously reported under Indian GAAP to Ind AS ` in Crores
Particulars As at 31st March, 2016
As at 1st April, 2015
Notes
Equity as reported under previous GAAP 1,205.02 1,106.09Ind AS: Adjustments increase (decrease):Reversal of Provision for dividend on Preference Shares (including tax) 0.05 0.05 (a)Fair valuation gain on investments accounted at FVTOCI / FVTPL 14.94 16.33 (d)Reserves from proportionate consolidation of Joint Operations (25.19) 13.98 (c)PPE accounted at Fair Value as deemed cost (net of tax) 269.01 271.79 (l)Provision for expected credit loss on trade receivables (net of tax) (2.45) (3.65) (m)Equity as reported under Ind AS 1,461.38 1,404.59
Notes forming part of the financial statements for the year ended 31st March, 2017

81
AFCONS INFRASTRUCTURE LIMITED
Note 45. First time Ind AS adoption reconciliations (Contd.)(ii) Reconciliation of P&L as previously reported under Indian GAAP to Ind AS ` in Crores
Particulars Profit for the year ended 31st March, 2016
Notes
Previous GAAP 124.98Ind AS: Adjustments increase (decrease):Fair value adjustment on Mutual fund investment through FVTPL (0.01) (d)Loss from proportionate consolidation of Joint Operations (37.54) (c)Remeasurement of defined benefit obligation recognised in other comprehensive income under Ind AS (net of tax) 1.88 (b)Depreciation on PPE accounted at Fair Value as deemed cost (net of tax) (2.78) (l)Reversal of expected credit loss on trade receivables (net of tax) 1.20 (m)Total effect of transition to Ind AS (37.25)Profit for the year as per Ind AS 87.73Other comprehensive income :Remeasurement of defined benefit obligation recognised in other comprehensive income under Ind AS (1.88) (b)Fair value adjustment of Investment in equity shares (1.38) (d)Exchange differences on translating the financial statements of a foreign operation (1.64) (p)Other comprehensive income for the year (4.90)Total comprehensive income under Ind AS 82.83
(iii) Effect of Ind AS adoption on the statement of cash flows for the year ended 31st March, 2016 ` in Crores
Particulars
Year ended 31st March, 2016 Previous
GAAP Effect of transition to Ind AS
Ind AS Notes
Net cash flows from operating activities (187.64) 370.28 182.64Net cash flows from investing activities (90.30) (87.07) (177.37)Net cash flows from financing activities 272.68 (282.91) (10.23)Net increase (decrease) in cash and cash equivalents (5.26) 0.30 (4.96)Cash and cash equivalents at beginning of period 15.91 15.77 31.68Effects of exchange rate changes on the balance of cash held in foreign currencies - - -Cash and cash equivalents at end of period 10.65 16.07 26.72 (o)
(iv) Analysis of cash and cash equivalents as at 31st March, 2016 and as at 1st April, 2015 for the purpose of statement of cash flows under Ind AS ` in Crores
Particulars As at 31st March, 2016
As at 1st April, 2015
Cash and cash equivalents for the purpose of statement of cash flows as per previous GAAP 10.65 15.91Cash and cash equivalents not considered under previous GAAP 16.07 15.77Cash and cash equivalents for the purpose of statement of cash flows under Ind AS 26.72 31.68
Notes to the reconciliations :a) In the financial statements prepared under Previous GAAP, dividend on equity shares recommended by the board of directors after
the end of reporting period but before the financial statements were approved for issue, was recognised as a liability in the financial statements in the reporting period relating to which dividend was proposed. Under Ind AS, such dividend is recognised in the reporting period in which the same is approved by the members in a general meeting.
b) Under previous GAAP, actuarial gains and losses were recognised in profit or loss. Under Ind AS, the actuarial gains and losses form part of remeasurement of the net defined benefit liability / asset which is recognised in other comprehensive income. Consequently, the tax effect of the same has also been recognised in other comprehensive income under Ind AS instead of profit or loss. This change does not affect total equity.
c) Under previous GAAP, following Joint Ventures were classified as subsidiaries and accordingly accounted for using the line by line method at the time of consolidation. Based on an assessment under Ind AS 111 Joint Arrangements, these have been accounted as jointly controlled operations using the proportionate consolidation method. The assessment is based on the fact that there is a contractual arrangement that indicate that the parties to the joint arrangements have rights to the assets and obligations for the liabilities of the joint arrangement.
Name of Joint Ventures Afcons Pauling Joint Venture Afcons Gunanusa Joint Venture Transtonnelstroy Afcons Joint Venture Dahej Standby Jetty Project Undertaking Strabag AG Afcons Joint Venture, India Saipem Afcons Joint Venture, Oman Ircon Afcons Joint Venture, India Afcons Sener LNG Construction Projects Pvt.Ltd.,India Afcons Sibmost Joint Venture Afcons Vijeta PES Joint Venture
Notes forming part of the financial statements for the year ended 31st March, 2017

82
AFCONS INFRASTRUCTURE LIMITED
Note 45. First time Ind AS adoption reconciliations (Contd.)d) Under previous GAAP, long term investments were measured at cost less diminution in value which is other than temporary. Under
Ind AS, these investment in equity instruments have been classified as FVTOCI. On the date of transition to Ind AS, these investment in equity instruments have been measured at their fair value which is higher than the cost as per previous GAAP, resulting in an increase in the carrying amount by ̀ 14.94 Crores as at 31st March, 2016 and by ̀ 16.32 Crores as at 1st April, 2015. These changes do not affect profit before tax or total profit for the year ended 31st March, 2016 because the investments have been classified as FVTOCI.
Investment in mutual fund have been classified as FVTPL. On the date of transition to Ind AS, these investment in mutual fund have been measured at their fair value which is higher than the cost as per previous GAAP, resulting in an increase in the carrying amount by ` 0.0008 Crores as at 31st March, 2016 and by ` 0.01 Crores as at 1st April, 2015.
e) Under previous GAAP, there was no concept of other comprehensive income. Under IND AS, specified items of income, expense, gains, or losses are required to be presented in other comprehensive income.
f) Under previous GAAP, Advance from Clients was netted against Construction Work in Progress. As per Ind AS a financial asset and a financial liability shall be offset only when an entity has a legally enforceable right to set off the amount or intends to realise the asset and settle the liability on a net basis. Consequently, there is a increase in Other Asset and Other Liabilities to that extent.
g) Under previous GAAP, MAT credit entitlement was disclosed separately under non-current assets. As per Ind AS, MAT credit entitlement is netted off against Deferred Tax Liability. The net effect of this change is an decrease in non-current assets and deferred tax liability as at 31st March, 2016 of ` 65.16 Crores (` 66.92 Crores as at 1st April, 2015)
h) Under previous GAAP, Acceptances was disclosed separately under Trade payables. As per Ind AS, acceptances is classified as borrowings. The net effect of this change is a decrease in trade payables and increase in current borrowings as at 31st March, 2016 of ` 30.57 Crores (` 50.91 Crores as at 1st April, 2015)
i) Certain sales contracts were accounted under the previous GAAP on a gross basis. However, under Ind AS, based on an evaluation carried out, the group has determined that it is acting as an agent after considering a number of factors, including, among other things, whether the Group is the primary obligor under the arrangement, has inventory risk, has customer’s credit risk and has latitude in establishing prices.Thus, under Ind AS, revenue has been recorded on a net basis. The change does not affect the total equity as at 1st April, 2015 and 31st March, 2016, profit before tax or total profit for the year ended 31st March, 2016.
j) Shuttering Material and Accessories & Attachments: If an item of inventories meets the definition of ‘property, plant and equipment’ and satisfies the recognition criteria as per Ind AS 16,
such an item of inventories has to be recognised as property, plant and equipment. Accordingly shuttering material and accessories & attachments are classified as property, plant and equipment. The net effect of this change is a decrease in inventories and increase in property, plant and equipments as at 31st March, 2016 of ` 79.51 Crores (` 70.92 Crores as at 1st April, 2015), similarly depreciation expenses has increased and Cost of Construction expenses has decreased by ` 27.14 Crores for the year ended 31st March, 2016.
k) Leasehold land: As per the classification criteria given in Ind AS 17, the leasehold land has been evaluated as an operating lease, hence has been
reclassified from PPE to prepayments. The net effect of this change is a decrease in property, plant and equipment and increase in other non current asset as at 31st March, 2016 of ` 0.15 Crores (` 0.15 Crores as at 1st April, 2015)
l) Fair value impact of property, plant and equipment: The company has elected to consider the fair value of freehold land and floating equipments in its opening balance sheet as the
deemed cost, as a result the carrying value of property, plant and equipments has increased by ` 309.81 Crores and depreciation impact of the same for year ended 31st March, 2016 is ` 5.80 Crores.
m) Provision for expected credit loss: Under the previous GAAP, the Company has created provision for doubtful debts on receivables on the basis of incurred loss. Under
Ind AS, impairment allowance on trade receivables has been determined based on lifetime Expected Credit Loss at each reporting date. As a practical expedient, the Company uses a provision matrix to determine impairment loss allowance on portfolio of its trade receivables. The provision matrix is based on its historically observed default rates over the expected life of the trade receivables and is adjusted for forward-looking estimates. At every reporting date, the historical observed default rates are updated and changes in the forward-looking estimates are analysed. Provision for expected credit loss on trade receivables is made based on provisions of Ind AS 109 ‘Financial Instruments’ amounting to ` 3.74 Crores as at 31st March, 2016 (as at 1st April, 2015 ` 5.53 Crores)
n) Under previous GAAP, deferred tax was accounted using the statement of profit and loss approach, which focuses on differences between taxable profits and accounting profits for the period. Ind AS 12 requires entities to account for deferred taxes using the balance sheet approach, which focuses on temporary differences between the carrying amount of an asset or liability in the balance sheet and its tax base. The application of Ind AS 12 approach has resulted in recognition of deferred tax on new temporary differences which was not required under previous GAAP. Deferred tax effect of Ind AS adjustments have been recognised on transition date and during the year ended 31st March, 2016.
o) The material adjustments to the Statement of Cash flows primarily arise from the accounting based on assessment of control / joint control under Ind AS.
p) Ind AS 21 requires the assessment of functional currency basis the conditions specified therein. Based on such reassessment, the functional currency of certain entities within the group were reassessed to be different from those considered under previous GAAP. Under Ind AS, exchange differences arising on translation of foreign operations, if any, are recognised in other comprehensive income and accumulated in equity. This has resulted in an adjustment to the profit or loss and other comprehensive income.
Approval of financial statementThe financial statements were approved for issue by the board of directors on 22nd June, 2017.
For and on behalf of the Board of Directors
S.P.MISTRY Chairman
K.SUBRAHMANIAN Vice Chairman &
Managing Director
S.PARAMASIVAN Deputy Managing Director
P.N. KAPADIADirector
N.D.KHURODY Director
R.M.PREMKUMAR Director
Place: MumbaiDate: 22nd June, 2017
P.R. RAJENDRANCompany Secretary
ASHOK G.DARAKChief Financial Officer
Notes forming part of the financial statements for the year ended 31st March, 2017

83
Consolidated finanCial statement of afCons infrastruCture limited and its subsidiaries, assoCiates and joint ventures (afCons group)
INDEPENDENT AUDITOR'S REPORTTO THE MEMBERS OF AFCONS INFRASTRUCTURE COMPANY LIMITEDReport on the Consolidated Ind AS Financial StatementsWe have audited the accompanying consolidated Ind AS financial statements of AFCONS INFRASTRUCTURE COMPANY LIMITED (hereinafter referred to as “the Parent”) and its subsidiaries (the Parent and its subsidiaries together referred to as “the Group”), comprising the Consolidated Balance Sheet as at 31st March, 2017, the Consolidated Statement of Profit and Loss (including other comprehensive income), the Consolidated Cash Flow Statement, the Consolidated Statement of Changes in Equity, for the year then ended, and a summary of the significant accounting policies and other explanatory information (hereinafter referred to as “the consolidated Ind AS financial statements”) and which includes 10 Joint Operations of the Group.Management’s Responsibility for the Consolidated Ind AS Financial StatementsThe Parent’s Board of Directors is responsible for the preparation of these consolidated Ind AS financial statements in terms of the requirements of the Companies Act, 2013 (hereinafter referred to as “the Act”) that give a true and fair view of the consolidated financial position, consolidated financial performance including other comprehensive income, consolidated cash flows and statement of changes in equity of the Group in accordance with the accounting principles generally accepted in India, including the Indian Accounting Standards (Ind AS) prescribed under Section 133 of the Act. The respective Board of Directors/Supervisory Board of the companies/ joint operations included in the Group are responsible for maintenance of adequate accounting records in accordance with the provisions of the Act for safeguarding the assets of the Group and for preventing and detecting frauds and other irregularities; the selection and application of appropriate accounting policies; making judgments and estimates that are reasonable and prudent; and the design, implementation and maintenance of adequate internal financial controls, that were operating effectively for ensuring the accuracy and completeness of the accounting records, relevant to the preparation and presentation of the financial statements that give a true and fair view and are free from material misstatement, whether due to fraud or error, which have been used for the purpose of preparation of the consolidated Ind AS financial statements by the Directors of the Parent, as aforesaid.Auditor’s ResponsibilityOur responsibility is to express an opinion on these consolidated Ind AS financial statements based on our audit. In conducting our audit, we have taken into account the provisions of the Act, the accounting and auditing standards and matters which are required to be included in the audit report under the provisions of the Act and the Rules made thereunder.We conducted our audit in accordance with the Standards on Auditing specified under Section 143(10) of the Act. Those Standards require that we comply with ethical requirements and plan and perform the audit to obtain reasonable assurance about whether the consolidated Ind AS financial statements are free from material misstatement.An audit involves performing procedures to obtain audit evidence about the amounts and the disclosures in the consolidated Ind AS financial statements. The procedures selected depend on the auditor’s judgment, including the assessment of the risks of material misstatement of the consolidated Ind AS financial statements, whether due to fraud or error. In making those risk assessments, the auditor considers internal financial control relevant to the Parent’s preparation of the consolidated Ind AS financial statements that give a true and fair view in order to design audit procedures that are appropriate in the circumstances. An audit also includes evaluating the appropriateness of the accounting policies used and the reasonableness of the accounting estimates made by the Parent’s Board of Directors, as well as evaluating the overall presentation of the consolidated Ind AS financial statements.We believe that the audit evidence obtained by us and the audit evidence obtained by the other auditors in terms of their reports referred to in the Other Matters paragraph below, is sufficient and appropriate to provide a basis for our audit opinion on the consolidated Ind AS financial statements.OpinionIn our opinion and to the best of our information and according to the explanations given to us and based on the consideration of reports of the other auditors on separate financial statements of the joint operations and the subsidiaries referred to below in the Other Matters paragraph, the aforesaid consolidated Ind AS financial statements give the information required by the Act in the manner so required and give a true and fair view in conformity with the accounting principles generally accepted in India, of the consolidated state of affairs of the Group and its joint operations as at 31st March, 2017, and their consolidated profit, consolidated total comprehensive income, their consolidated cash flows and consolidated statement of changes in equity for the year ended on that date.Emphasis of MatterWe draw attention to Note 43 (a) of the consolidated financial statements regarding legal opinion received by the Company that the interest free advances made towards financing the unincorporated joint operations do not attract Section 186 of the Companies Act, 2013 for the reasons stated therein. The outstanding amount of such advances given by the Company (without giving effect of elimination) aggregates to ` 901.12 crores as on 31st March, 2017 (As at 31st March, 2016: ` 683.10 crores; As at 1st April, 2015 ` 333.60 crores).Our opinion is not qualified in respect on this matter.Other Mattersa) We did not jointly audit the financial statements of 33 subsidiaries and 8 joint operations included in the consolidated Ind AS financial
statements of the Group whose financial statements reflect total assets of ` 1683.11 crores as at 31st March, 2017 and total revenues of ` 877.47 crores for the year ended on that date, as considered in the consolidated Ind AS financial statements. The financial statements of these subsidiaries and joint operations have been audited by either of us in our individual capacity or jointly with other auditor or by other auditors whose reports have been furnished to us by the management and our opinion in so far as it relates to the amounts and disclosures included in respect of these subsidiaries and joint operations and our report in terms of subsection (3) of Section 143 of the Act, in so far as it relates to the aforesaid subsidiaries and joint operations, is based solely on the report of such other auditors.
b) The comparative financial information of the Group for the year ended 31st March, 2016 and the transition date opening balance sheet as at 1st April, 2015 included in these consolidated Ind AS financial statements, are based on the previously issued consolidated financial statements prepared in accordance with the Companies (Accounting Standards) Rules, 2006 audited by one of us jointly with the predecessor auditor whose report for the year ended 31st March, 2016 and 31st March, 2015 dated 27th June, 2016 and 20th August, 2015 respectively expressed a modified opinion on those consolidated financial statements, and have been restated to comply with Ind AS. Adjustments made to the said consolidated financial information prepared in accordance with the Companies (Accounting Standards) Rules, 2006 to comply with Ind AS have been audited by us.

84
Consolidated finanCial statement of afCons infrastruCture limited and its subsidiaries, assoCiates and joint ventures (afCons group)
c) The comparative financial information for the year ended 31st March, 2016 and the transition date opening balance sheet as at 1st April, 2015 in respect of 33 subsidiaries and 8 joint operations included in this consolidated Ind AS financial statements prepared in accordance with the Ind AS have been audited by either of us in our individual capacity or jointly with other auditors or by other auditors.
d) We did not audit the financial statements of 7 subsidiaries and 2 joint operations whose financial statements for the year ended 31st March, 2017, reflects total assets of ` 651.42 crores and total revenue of ` 710.51 crores and net cash inflows amounting to ` 23.79 crores, as considered in the consolidated Ind AS financial statements. These financial statements are unaudited and have been furnished to us by the management and our opinion on the consolidated Ind AS financial statements, in so far as it relates to the amounts and disclosures included in respect of these subsidiaries and joint operations, is based solely on such unaudited financial statements. In our opinion and according to the information and explanation given to us by the management, these financial statements are not material to the group.
Our opinion on the consolidated Ind AS financial statements above, and our report on Other Legal and Regulatory Requirements below, is not modified in respect of the above matters with respect to our reliance on the work done and the reports of the other auditors and the financial statement certified by the management.Report on Other Legal and Regulatory RequirementsAs required by Section 143(3) of the Act, based on our audit and on the consideration of the report of the other auditors on separate financial statements of subsidiary companies and joint operation company incorporated in India, referred in the Other Matters paragraph above, we report, to the extent applicable, that:a) We have sought and obtained all the information and explanations which to the best of our knowledge and belief were necessary for
the purposes of our audit of the aforesaid consolidated Ind AS financial statements.b) In our opinion, proper books of account as required by law relating to preparation of the aforesaid consolidated Ind AS financial
statements have been kept so far as it appears from our examination of those books, returns and the reports of the other auditors.c) The Consolidated Balance Sheet, the Consolidated Statement of Profit and Loss (including Other Comprehensive Income), the
Consolidated Cash Flow Statement and Consolidated Statement of Changes in Equity dealt with by this Report are in agreement with the relevant books of account maintained for the purpose of preparation of the consolidated Ind AS financial statements
d) In our opinion, the aforesaid consolidated Ind AS financial statements comply with the Indian Accounting Standards prescribed under Section 133 of the Act.
e) On the basis of the written representations received from the directors of the Parent as on 31st March, 2017 taken on record by the Board of Directors of the Parent and the reports of the statutory auditors of its subsidiary companies and joint operation company incorporated in India, none of the directors of the Group’s companies and its joint operation company incorporated in India is disqualified as on 31st March 2017 from being appointed as a director in terms of Section 164(2) of the Act.
f) With respect to the adequacy of the internal financial controls over financial reporting and the operating effectiveness of such controls, refer to our separate Report in “Annexure A”, which is based on the auditors’ reports of the Parent company, subsidiary companies and joint operation company incorporated in India. Our report expresses an unmodified opinion on the adequacy and operating effectiveness of the Parent Company’s/Subsidiary Company’s/Joint Operation Company incorporated in India internal financial controls over financial reporting.
g) With respect to the other matters to be included in the Auditor’s Report in accordance with Rule 11 of the Companies (Audit and Auditor’s) Rules, 2014, as amended, in our opinion and to the best of our information and according to the explanations given to us:i) The consolidated Ind AS financial statements disclose the impact of pending litigations on the consolidated financial position of
the Group; Refer note 29 to the consolidated financial statements.ii) Provision has been made in the consolidated Ind AS financial statements, as required under the applicable law or accounting
standards, for material foreseeable losses, if any, on long-term contracts including derivative contracts.iii) There has been no delay in transferring amounts, required to be transferred, to the Investor Education and Protection Fund by
the Parent and its subsidiary companies and joint operation company incorporated in India; Refer note 19(b) to the consolidated financial statements.
iv) The Parent has provided requisite disclosures in the consolidated Ind AS financial statements as regards the holding and dealings in Specified Bank Notes as defined in the Notification S.O. 3407(E) dated the 8th November, 2016 of the Ministry of Finance, during the period from 8th November, 2016 to 30th December, 2016 of the Group entities as applicable. Based on audit procedures performed and the representations provided to us by the management we report that the disclosures are in accordance with the relevant books of accounts maintained by those entities for the purpose of preparation of the consolidated Ind AS financial statements and as produced to us by the Management of the respective Group entities. Our comments are restricted to the activities carried out by the Companies and exclude matters relating to the unincorporated joint operations in which the Group holds interest. The financial statements of the unincorporated joint operations are not subject to audit under the Companies Act, 2013, therefore their auditors have not reported on matters specified in Notification S.O. 3407(E) dated the 8th November, 2016 of the Ministry of Finance.
For DELOITTE HASKINS & SELLS For HDS & Associates LLPChartered Accountants Chartered Accountants(Firm Registration No. 117364W) (Firm Registration No. W100144)
Nilesh Shah Shridhar G.S. Partner Partner(Membership No. 49660) (Membership No. 126653)
MUMBAI, MUMBAI,Dated: June 22nd, 2017 Dated: June 22nd , 2017

85
Consolidated finanCial statement of afCons infrastruCture limited and its subsidiaries, assoCiates and joint ventures (afCons group)
ANNEXURE “A” TO THE INDEPENDENT AUDITOR’S REPORT(Referred to in paragraph 1 (g) under ‘Report on Other Legal and Regulatory Requirements’ of our report of even date)Report on the Internal Financial Controls Over Financial Reporting under Clause (i) of Sub-section 3 of Section 143 of the Companies Act, 2013 (“the Act”)In conjunction with our audit of the consolidated Ind AS financial statements of the Company as of and for the year ended 31st March, 2017, we have audited the internal financial controls over financial reporting of Afcons Infrastructure Limited (hereinafter referred to as “the Parent Company”) and its subsidiary companies which includes internal financial controls over financial reporting of the Company’s joint operations which are companies incorporated in India, as of that date.Management’s Responsibility for Internal Financial ControlsThe respective Board of Directors of the Parent Company and its subsidiary companies which are companies incorporated in India, are responsible for establishing and maintaining internal financial controls based on the criteria established by the respective Companies considering the essential components of internal control stated in the Guidance Note on Audit of Internal Financial Controls Over Financial Reporting (“the Guidance Note”) issued by the Institute of Chartered Accountants of India (ICAI). These responsibilities include the design, implementation and maintenance of adequate internal financial controls that were operating effectively for ensuring the orderly and efficient conduct of its business, including adherence to the respective company’s policies, the safeguarding of its assets, the prevention and detection of frauds and errors, the accuracy and completeness of the accounting records, and the timely preparation of reliable financial information, as required under the Companies Act, 2013.Auditor’s ResponsibilityOur responsibility is to express an opinion on the internal financial controls over financial reporting of the Parent Company and its subsidiary companies, which are incorporated in India, based on our audit. We conducted our audit in accordance with the Guidance Note on Audit of Internal Financial Controls Over Financial Reporting (the “Guidance Note”) issued by the Institute of Chartered Accountants of India and the Standards on Auditing, prescribed under Section 143(10) of the Companies Act, 2013, to the extent applicable to an audit of internal financial controls. Those Standards and the Guidance Note require that we comply with ethical requirements and plan and perform the audit to obtain reasonable assurance about whether adequate internal financial controls over financial reporting was established and maintained and if such controls operated effectively in all material respects.Our audit involves performing procedures to obtain audit evidence about the adequacy of the internal financial controls system over financial reporting and their operating effectiveness. Our audit of internal financial controls over financial reporting included obtaining an understanding of internal financial controls over financial reporting, assessing the risk that a material weakness exists, and testing and evaluating the design and operating effectiveness of internal control based on the assessed risk. The procedures selected depend on the auditor’s judgement, including the assessment of the risks of material misstatement of the financial statements, whether due to fraud or error.We believe that the audit evidence we have obtained and the audit evidence obtained by the other auditors of the subsidiary companies, which are companies incorporated in India, in terms of their reports referred to in the Other Matters paragraph below, is sufficient and appropriate to provide a basis for our audit opinion on the Company’s internal financial controls system over financial reporting of the aforesaid entities.Meaning of Internal Financial Controls Over Financial ReportingA company’s internal financial control over financial reporting is a process designed to provide reasonable assurance regarding the reliability of financial reporting and the preparation of financial statements for external purposes in accordance with generally accepted accounting principles. A company’s internal financial control over financial reporting includes those policies and procedures that (1) pertain to the maintenance of records that, in reasonable detail, accurately and fairly reflect the transactions and dispositions of the assets of the company; (2) provide reasonable assurance that transactions are recorded as necessary to permit preparation of financial statements in accordance with generally accepted accounting principles, and that receipts and expenditures of the company are being made only in accordance with authorisations of management and directors of the company; and (3) provide reasonable assurance regarding prevention or timely detection of unauthorised acquisition, use, or disposition of the company’s assets that could have a material effect on the financial statements.Inherent Limitations of Internal Financial Controls Over Financial ReportingBecause of the inherent limitations of internal financial controls over financial reporting, including the possibility of collusion or improper management override of controls, material misstatements due to error or fraud may occur and not be detected. Also, projections of any evaluation of the internal financial controls over financial reporting to future periods are subject to the risk that the internal financial control over financial reporting may become inadequate because of changes in conditions, or that the degree of compliance with the policies or procedures may deteriorate.OpinionIn our opinion to the best of our information and according to the explanations given to us and taking into consideration the reports of the other auditors referred to in Other Matters paragraph below, the Parent Company and its subsidiary companies, which are companies incorporated in India, have, in all material respects, an adequate internal financial controls system over financial reporting and such internal financial controls over financial reporting were operating effectively as at 31st March, 2017, based on the internal control over financial reporting criteria established by the respective companies considering the essential components of internal control stated in the Guidance Note on “Audit of Internal Financial Controls Over Financial Reporting issued by the Institute of Chartered Accountants of India”.Other MattersOur aforesaid report under Section 143(3)(i) of the Act on the adequacy and operating effectiveness of the internal financial controls over financial reporting insofar as it relates to 4 subsidiary companies which are companies incorporated in India, is based on the corresponding reports of the auditors of such companies incorporated in India.Our opinion is not modified in respect of this matter.For DELOITTE HASKINS & SELLS For HDS & Associates LLPChartered Accountants Chartered Accountants(Firm Registration No. 117364W) (Firm Registration No. W100144)
Nilesh Shah Shridhar G.S.Partner Partner(Membership No. 49660) (Membership No. 126653)
MUMBAI, MUMBAI,Dated: June 22nd, 2017 Dated: June 22nd, 2017

86
Consolidated finanCial statement of afCons infrastruCture limited and its subsidiaries, assoCiates and joint ventures (afCons group)
Consolidated Balance Sheet as at 31st March, 2017 ` in CroresParticulars Note
No.As at
31st March, 2017As at
31st March, 2016As at
1st April, 2015A ASSETS
1 Non-current assets(a) Property, Plant and Equipment 3.A 1,624.60 1,482.10 1,358.36(b) Other Intangible assets 3.B 2.25 2.92 2.02(c) Capital work-in-progress 3.C 20.80 124.28 174.48(d) Goodwill 3.D 4.83 5.20 4.37(e) Financial assets
(i) Investments 4 100.04 103.23 102.47(ii) Trade receivables 5 129.65 115.76 138.78(iii) Other financial assets 7 124.34 137.23 138.12
(f) Non current Tax assets (net) 11 74.65 59.56 74.84(g) Other non-current assets 8 577.92 319.62 325.42
Total Non-current Assets 2,659.08 2,349.90 2,318.862 Current assets
(a) Inventories 9 558.52 528.68 300.59(b) Financial assets
(i) Trade receivables 5 764.68 510.57 415.19(ii) Cash and cash equivalents 10 160.38 142.46 143.03(iii) Bank balances other than (ii) above 10.1 28.98 13.65 11.97(iv) Loans 6 46.49 43.21 40.67(v) Other financial assets 7 158.78 171.84 157.25
(c) Other current assets 8 2,853.31 3,120.74 2,610.71Total Current Assets 4,571.14 4,531.15 3,679.41
Total Assets (1+2) 7,230.22 6,881.05 5,998.27B EQUITY AND LIABILITIES
1 EquityA) Equity attributable to owner of the company
(a) Equity share capital 12 520.78 520.78 520.78(b) Other equity 13 1,101.97 986.46 936.80
1,622.75 1,507.24 1,457.58B) Non controlling interest (0.24) 1.33 1.97
Total Equity (A+B) 1,622.51 1,508.57 1,459.552 Liabilities
A) Non-current liabilities(a) Financial liabilities
(i) Borrowings 14 831.20 857.65 624.42(ii) Trade payables 15 147.85 100.61 65.13(iii) Other financial liabilities 16 0.01 0.01 0.01
(b) Deferred tax liabilities (net) 17 140.36 115.55 93.54(c) Other non-current liabilities 18 523.01 193.88 373.14(d) Provisions 19 8.99 5.11 1.92
Total Non-Current Liabilities 1,651.42 1,272.81 1,158.16B) Current liabilities(a) Financial liabilities
(i) Borrowings 21 1,067.98 1,020.02 915.24(ii) Trade payables 15 1,487.15 1,276.61 1,022.90(iii) Other financial liabilities 16 254.23 302.90 374.92
(b) Current tax liabilities (net) 20 13.34 25.40 10.11(c) Other current liabilities 18 1,109.12 1,456.19 1,038.09(d) Provisions 19 24.47 18.55 19.30
Total Current Liabilities 3,956.29 4,099.67 3,380.56Total Liabilities (A+B) 5,607.71 5,372.48 4,538.72
Total Equity and Liabilities (1+2) 7,230.22 6,881.05 5,998.27See accompanying notes 1 to 46 forming part of the financial statements
In terms of our report attached For and on behalf of the Board of Directors
For DELOITTE HASKINS & SELLS CHARTERED ACCOUNTANTS
For HDS & ASSOCIATES LLP CHARTERED ACCOUNTANTS
S.P.MISTRY Chairman
K.SUBRAHMANIAN Vice Chairman &
Managing Director
NILESH SHAH Partner
SHRIDHAR G.S.Partner
S.PARAMASIVAN Deputy Managing Director
P.N. KAPADIADirector
N.D.KHURODY Director
R.M.PREMKUMAR Director
Place: MumbaiDate: 22nd June, 2017
P.R. RAJENDRANCompany Secretary
ASHOK G.DARAKChief Financial Officer

87
Consolidated finanCial statement of afCons infrastruCture limited and its subsidiaries, assoCiates and joint ventures (afCons group)
Consolidated Statement of Profit and Loss for the year ended 31st March, 2017 ` in CroresParticulars Note
No.For the year ended
31st March, 2017For the year ended
31st March, 20161 Revenue from operations 22 6,304.82 4,336.812 Other income 23 100.90 137.373 Total revenue ( 1 + 2 ) 6,405.72 4,474.184 Expenses
(a) Cost of construction 24 4,450.17 2,907.91(b) Employee benefits expense 25 673.79 523.14(c) Finance costs 26 302.23 270.28(d) Depreciation and amortisation expense 27 168.62 155.75(e) Other expenses 28 604.06 469.28Total expenses 6,198.87 4,326.36
5 Profit before tax ( 3 - 4 ) 206.85 147.826 Tax expense:
(a) Tax expenses for current year 17 27.08 46.72(b) Deferred tax 17 26.75 23.00(c) Tax expense relating to prior period (net) 17 0.32 0.23
54.15 69.957 Profit after tax and before Minority interest ( 5 - 6 ) 152.70 77.878 Non Controlling Interest 1.53 0.729 Profit for the year from continuing operations ( 7 + 8 ) 154.23 78.5910 Other Comprehensive Income
A) Items that will not be reclassified to profit or loss(a) Changes in Fair value of Equity investments designated as FVTOCI (3.37) (1.38)(b) Remeasurements of defined benefit liabilities / (assets) (5.60) (2.87)(c) Deferred tax on remeasurement of defined benefit plans 1.94 0.99
B) Items that may be reclassified to profit or loss(a) Exchange differences on translating the financial statements of a
foreign operation(5.65) 0.37
(12.68) (2.89)11 Total Comprehensive income for the year (9 + 10) 141.55 75.70
Profit for the year attributable to: - Owners of the Company 152.70 77.87 - Non-controlling interest 1.53 0.72
154.23 78.59Other comprehensive income for the year attributable to: - Owners of the Company (12.68) (2.89) - Non-controlling interest - -
(12.68) (2.89)Total comprehensive income for the year attributable to: - Owners of the Company 140.02 74.98 - Non-controlling interest 1.53 0.72
141.55 75.7012 Earnings per share (Face value of ` 10/- each): 31
(a) Basic 4.50 2.29(b) Diluted 4.50 2.29
See accompanying notes 1 to 46 forming part of the financial statementsIn terms of our report attached For and on behalf of the Board of Directors
For DELOITTE HASKINS & SELLS CHARTERED ACCOUNTANTS
For HDS & ASSOCIATES LLP CHARTERED ACCOUNTANTS
S.P.MISTRY Chairman
K.SUBRAHMANIAN Vice Chairman &
Managing Director
NILESH SHAH Partner
SHRIDHAR G.S.Partner
S.PARAMASIVAN Deputy Managing Director
P.N. KAPADIADirector
N.D.KHURODY Director
R.M.PREMKUMAR Director
Place: MumbaiDate: 22nd June, 2017
P.R. RAJENDRANCompany Secretary
ASHOK G.DARAKChief Financial Officer

88
Consolidated finanCial statement of afCons infrastruCture limited and its subsidiaries, assoCiates and joint ventures (afCons group)
Statement of changes in equity for the year ended 31st March, 2017
a) Equity Share Capital ` in CroresBalance as at 31st March, 2016 Changes in equity share
capital during the yearBalance as at 31st March, 2017
70.78 - 70.78
Balance as at 1st April, 2015 Changes in equity share capital during the year
Balance as at 31st March, 2016
70.78 - 70.78
Equity Share Capital Number of Shares Equity share capitalIssued and Paid up Capital at 1st April, 2016 7,19,70,238 71.97Less: Treasury Shares 11,91,370 1.19Balance at 1st April, 2016 7,07,78,868 70.78Balance at 31st March, 2017 7,07,78,868 70.78
b) Preference Share Capital ` in Crores
Balance as at 31st March, 2016 Changes in preference share capital during the year
Balance as at 31st March, 2017
450.00 - 450.00
Balance as at 1st April, 2015 Changes in preference share capital during the year
Balance as at 31st March, 2016
450.00 - 450.00
Preference Share Capital Number of Shares Preference share capitalIssued and Paid up Capital at 1st April, 2016 45,00,00,000 450.00Less: Treasury Shares - -Balance at 1st April, 2016 45,00,00,000 450.00Balance at 31st March, 2017 45,00,00,000 450.00
c) Other Equity ` in CroresParticulars Reserve and Surplus Other comprehensive income Total
Capital Reserve
Capital Redemption
Reserve
Securities Premium Reserve
Contin-gencies Reserve
Debenture Redemption
Reserve
General Reserve
Retained Earnings
Exchange differences
on translating the financial
statements of a foreign operation
Equity Instruments
through other comprehen-sive income
Balance as at 31st March, 2016 0.84 0.13 10.28 8.00 44.57 66.04 841.29 0.37 14.94 986.46Profit for the year 154.23 154.23Other Comprehensive Income for the year (3.66) (5.65) (3.37) (12.68)Dividends / Dividend Tax (26.04) (26.04)Transfer to / (from) surplus in Statement of Profit & Loss (2.07) 2.07 -Balance as at 31st March, 2017 0.84 0.13 10.28 8.00 42.50 66.04 967.89 (5.28) 11.57 1,101.97
Balance as at 1st April, 2015 0.84 0.13 10.28 8.00 25.40 66.04 809.79 - 16.32 936.80Profit for the year 78.59 78.59Other Comprehensive Income for the year (1.88) 0.37 (1.38) (2.89)Dividends / Dividend Tax (26.04) (26.04)Transfer to / (from) surplus in Statement of Profit & Loss 19.17 (19.17) -Balance as at 31st March, 2016 0.84 0.13 10.28 8.00 44.57 66.04 841.29 0.37 14.94 986.46

89
Consolidated finanCial statement of afCons infrastruCture limited and its subsidiaries, assoCiates and joint ventures (afCons group)
Consolidated Cash Flow Statement for the year ended 31st March, 2017 ` in CroresParticulars For the year ended
31st March, 2017For the year ended
31st March, 2016Cash flow from operating activities
Profit after tax 152.70 77.87Adjustments for :
Income tax expense recognised in Profit or loss 54.15 69.95Depreciation and amortisation 168.62 155.75Loss on sale of fixed assets (net) 2.59 4.29Dividend income recognised in profit or loss (2.22) (1.80)Interest income recognised in profit or loss (58.98) (97.75)Finance cost recognised in profit or loss 271.24 247.09Remeasurement of defined benefit liabilities / (assets) through OCI (3.66) (1.88)Bad/irrecoverable Debtors /Unbilled Revenue /Advances /Duty Scrip w/off 1.38 8.89Provision for doubtful advances no longer required written back (0.44) (3.20)Reversal of expected credit loss on financial assets (0.13) (1.78)Provision for expected credit loss 0.13 (4.98)Creditors / Excess Provision written back (1.97) (7.75)Net (gain) / Loss arising on financials assets measured at fair value through profit or loss (0.17) (0.06)Provision for Projected Losses on contract (net) (4.46) (0.51)
Operating profit before working capital changes 578.78 444.13(Increase) in Inventories (29.84) (228.09)(Increase) in Trade receivables (268.00) (65.60)(Increase) in Loans and Other Assets (9.17) (495.26)Increase in Trade, Other payables and Provisions 270.26 549.50
Cash from Operations 542.03 204.68Direct taxes - (paid) (including interest) (48.76) (15.89)
Net Cash flow from operating activities 493.27 188.79Cash flow from investing activities
Payment for property, plant and equipment (210.46) (236.07)Proceeds from disposal of property, plant and equipment 7.01 4.56Purchase of Investments - (2.10)Dividend received 2.22 1.80Investment in Other bank balance (made) / redeemed (15.33) (1.68)Interest received 64.08 54.36
Net Cash flow (used in) investing activities (152.48) (179.13)Cash flow from financing activities
Proceeds from long-term borrowings 189.95 552.19Repayment of long-term borrowings (266.62) (397.02)(Repayment) / Proceeds from short term borrowings - net 47.96 104.78Interest paid (268.12) (244.14)Dividend paid on Equity Shares (including tax for previous year) (Interim) (25.98) (25.98)Dividend paid on Preference Shares (including tax) (0.06) (0.06)
Net Cash flow (used in) financing activities (322.87) (10.23)Net increase / (decrease) in cash and cash equivalents 17.92 (0.57)Cash and cash equivalents at the beginning of the year 142.46 143.03Cash and cash equivalents at the end of the year 160.38 142.46
Note1. The above Cash Flow Statement has been prepared under the "Indirect Method" set out in Ind As 7 'Cash Flow Statements'.
In terms of our report attached For and on behalf of the Board of Directors
For DELOITTE HASKINS & SELLS CHARTERED ACCOUNTANTS
For HDS & ASSOCIATES LLP CHARTERED ACCOUNTANTS
S.P.MISTRY Chairman
K.SUBRAHMANIAN Vice Chairman &
Managing Director
NILESH SHAH Partner
SHRIDHAR G.S.Partner
S.PARAMASIVAN Deputy Managing Director
P.N. KAPADIADirector
N.D.KHURODY Director
R.M.PREMKUMAR Director
Place: MumbaiDate: 22nd June, 2017
P.R. RAJENDRANCompany Secretary
ASHOK G.DARAKChief Financial Officer

90
Consolidated finanCial statement of afCons infrastruCture limited and its subsidiaries, assoCiates and joint ventures (afCons group)
Notes forming part of the consolidated financial statements for the year ended 31st March, 2017Note 1. Significant Accounting Policies1. General information Afcons Infrastructure Limited (the Company) is a limited company incorporated in India. Its parent and ultimate holding company is
Shapoorji Pallonji Company Private Limited. The address of its registered office is "Afcons House" ,16 Shah Industrial Estate, Veera Desai Road, Andheri (West), Mumbai
400 053 and principal place of business is Mumbai, India. The principal activity of the Group and its subsidiaries (the Group) are Infrastructure activities. Afcons has a presence in almost the entire spectrum of infrastructure activities in India and Overseas. The Group is engaged in Marine Works, Highways, Bridges, Metro Works, Power Houses, Tunnels, Oil & Gas, LNG Tanks and other general Civil Engineering Projects both in India and Overseas.
2. Standards issued but not yet effective In March 2017, the Ministry of Corporate Affairs issued the Companies (Indian Accounting Standards) (Amendments) Rules, 2017,
notifying amendments to Ind AS 7, ‘Statement of cash flows’. These amendments are in accordance with the recent amendments made by International Accounting Standards Board (IASB) to IAS 7, ‘Statement of cash flows’. The amendments are applicable to the Company from 1st April, 2017.
3. Amendment to Ind AS 7: The amendment to Ind AS 7 requires the entities to provide disclosures that enable users of financial statements to evaluate changes
in liabilities arising from financing activities, including both changes arising from cash flows and non-cash changes, suggesting inclusion of a reconciliation between the opening and closing balances in the balance sheet for liabilities arising from financing activities, to meet the disclosure requirement.
The Group is evaluating the requirements of the amendment and the effect on the financial statements is being evaluated.3.1 Statement of compliance The consolidated financial statements have been prepared in accordance with Ind ASs notified under the Companies (Indian
Accounting Standards) Rules, 2015.
Upto the year ended 31st March, 2016, the Group prepared its financial statements in accordance with the requirements of previous GAAP, which includes Standards notified under the Companies (Accounting Standards) Rules, 2006. These are Group’s first Ind AS financial statements. The date of transition to Ind AS is 1st April, 2015. Refer Note 3.23 for the details of first-time adoption exemptions availed by the Company.
3.2 Basis of preparation and presentation The consolidated financial statements have been prepared on the historical cost basis except for certain financial instruments that
are measured at fair values at the end of each reporting period, as explained in the accounting policies below. Historical cost is generally based on the fair value of the consideration given in exchange for goods and services. Fair value is the price that would be received to sell an asset or paid to transfer a liability in an orderly transaction between market
participants at the measurement date, regardless of whether that price is directly observable or estimated using another valuation technique. In estimating the fair value of an asset or a liability, the Group takes into account the characteristics of the asset or liability if market participants would take those characteristics into account when pricing the asset or liability at the measurement date. Fair value for measurement and/or disclosure purposes in these financial statements is determined on such a basis, except for leasing transactions that are within the scope of Ind AS 17, and measurements that have some similarities to fair value but are not fair value, such as net realisable value in Ind AS 2 or value in use in Ind AS 36.
In addition, for financial reporting purposes, fair value measurements are categorised into Level 1, 2 or 3 based on the degree to which the inputs to the fair value measurements are observable and the significance of the inputs to the fair value measurement in its entirety, which are described as follows:• Level 1 inputs are quoted prices (unadjusted) in active markets for identical assets or liabilities that the entity can access at the
measurement date;• Level 2 inputs are inputs, other than quoted prices included within Level 1, that are observable for the asset or liability, either
directly or indirectly; and• Level 3 inputs are unobservable inputs for the asset or liability. The balance sheet presents current and non-current assets, and current and non-current liabilities, as separate classifications.
For this purpose, an asset is classified as current if:• It is expected to be realised, or is intended to be sold or consumed, in the normal operating cycle; or• It is held primarily for the purpose of trading; or• It is expected to realise the asset within 12 months after the reporting period; or• The asset is a cash or equivalent unless it is restricted from being exchanged or used to settle a liability for at least
12 months after the reporting period. All other assets are classified as non-current. Similarly, a liability is classified as current if:
• It is expected to be settled in the normal operating cycle; or• It is held primarily for the purpose of trading; or• It is due to be settled within 12 months after the reporting period; or• The Company does not have an unconditional right to defer the settlement of the liability for at least 12 months after the
reporting period. Terms of a liability that could result in its settlement by the issue of equity instruments at the option of the counterparty does not affect this classification.
All other liabilities are classified as non-current. The principal accounting policies are set out below.

91
Consolidated finanCial statement of afCons infrastruCture limited and its subsidiaries, assoCiates and joint ventures (afCons group)
Notes forming part of the consolidated financial statements for the year ended 31st March, 20173.3 Basis of consolidation The consolidated financial statements incorporate the financial statements of the Company and entities (including structured entities)
controlled by the Company and its subsidiaries. Control is achieved when the Company:• has power over the investee;• is exposed, or has rights, to variable returns from its involvement with the investee; and• has the ability to use its power to affect its returns.
The Company reassesses whether or not it controls an investee if facts and circumstances indicate that there are changes to one or more of the three elements of control listed above.
When the Company has less than a majority of the voting rights of an investee, it has power over the investee when the voting rights are sufficient to give it the practical ability to direct the relevant activities of the investee unilaterally. The Company considers all relevant facts and circumstances in assessing whether or not the Company’s voting rights in an investee are sufficient to give it power, including:• the size of the Company's holding of voting rights relative to the size and dispersion of holdings of the other vote holders;• potential voting rights held by the Company, other vote holders or other parties;• rights arising from other contractual arrangements; and• any additional facts and circumstances that indicate that the Company has, or does not have, the current ability to direct the
relevant activities at the time that decisions need to be made, including voting patterns at previous shareholders' meetings. Consolidation of a subsidiary begins when the Company obtains control over the subsidiary and ceases when the Company loses
control of the subsidiary. Specifically, income and expenses of a subsidiary acquired or disposed of during the year are included in the consolidated statement of profit and loss from the date the Company gains control until the date when the Company ceases to control the subsidiary.
Profit or loss and each component of other comprehensive income are attributed to the owners of the Company and to the non-controlling interests. Total comprehensive income of subsidiaries is attributed to the owners of the Company and to the non-controlling interests even if this results in the non-controlling interests having a deficit balance.
When necessary, adjustments are made to the financial statements of subsidiaries to bring their accounting policies into line with the Group's accounting policies.
All intra Group assets and liabilities, equity, income, expenses and cash flows relating to transactions between members of the Group are eliminated in full on consolidation.
The Group’s share of the results, assets and liabilities of contracts carried out in conjunction with another party are included under each relevant heading in the income statement and balance sheet.
3.4 Goodwill Goodwill represents the cost of acquired business as established at the date of acquisition of the business in excess of the acquirer’s
interest in the net fair value of the identifiable assets, liabilities and contingent liabilities less accumulated impairment losses, if any. Goodwill is tested for impairment annually or when events or circumstances indicate that the implied fair value of goodwill is less than its carrying amount.
For the purposes of impairment testing, goodwill is allocated to each of the Group's cash-generating units (or Groups of cash-generating units) that is expected to benefit from the synergies of the combination.
A cash-generating unit to which goodwill has been allocated is tested for impairment annually, or more frequently when there is an indication that the unit may be impaired. If the recoverable amount of the cash-generating unit is less than its carrying amount, the impairment loss is allocated first to reduce the carrying amount of any goodwill allocated to the unit and then to the other assets of the unit pro rata based on the carrying amount of each asset in the unit. Any impairment loss for goodwill is recognised directly in profit or loss. An impairment loss recognised for goodwill is not reversed in subsequent periods.
On disposal of the relevant cash-generating unit, the attributable amount of goodwill is included in the determination of the profit or loss on disposal.
3.5 Interests in joint operations A Joint Operation is a joint arrangement whereby the parties that have joint control of the arrangement have rights to the assets
and obligations for the liabilities, relating to the arrangements. Joint control is the contractually agreed sharing of control of an arrangement, which exist only when decisions about the relevant activities require unanimous consent of the parties sharing control.
When a Group entity undertakes its activities under joint operations, the Group as a joint operator recognises in relation to its interest in a joint operation:a) Its assets, including its share of any assets held jointly;b) Its liabilities, including its share of any liabilities incurred jointly;c) Its revenue from the sale of the output arising from the joint operation;d) Its share of the revenue from the sale of the output by the joint operation ande) Its expenses, including its share of any expenses incurred jointly.
The Group accounts for the assets, liabilities, revenues and expenses relating to its interest in a joint operation in accordance with the Ind AS applicable to the particular assets, liabilities, revenues and expenses.
When a Group entity transacts with a joint operation in which a Group entity is a joint operator (such as a sale or contribution of assets), the Group is considered to be conducting the transaction with the other parties to the joint operation, and gains and losses resulting from the transactions are recognised in the Group's consolidated financial statements only to the extent of the other parties' interests in the joint operation.
When a Group entity transacts with a joint operation in which a Group entity is a joint operator (such as a purchase of assets), the Group does not recognise its share of the gains and losses until it resells those assets to a third party.

92
Consolidated finanCial statement of afCons infrastruCture limited and its subsidiaries, assoCiates and joint ventures (afCons group)
Notes forming part of the consolidated financial statements for the year ended 31st March, 20173.6 Revenue recognition Sale of goods Revenue from the sale of goods is recognised when the goods are delivered and titles have passed, at which time all the following
conditions are satisfied:• the Group has transferred to the buyer the significant risks and rewards of ownership of the goods;• the Group retains neither continuing managerial involvement to the degree usually associated with ownership nor effective
control over the goods sold;• the amount of revenue can be measured reliably;• it is probable that the economic benefits associated with the transaction will flow to the Group; and• the costs incurred or to be incurred in respect of the transaction can be measured reliably. Revenue from sale of goods is measured at fair value of the consideration received or receivable, net of returns and trade
discounts and includes excise duty but excludes sales tax and value added tax. Revenue from construction contracts When the outcome of a construction contract can be estimated reliably, contract revenue and contract costs associated with the
construction contract are recognised as revenue and expenses respectively by reference to the percentage of completion of the contract activity at the reporting date. The percentage of completion of a contract is determined considering the proportion that contract costs incurred for work performed upto the reporting date bear to the estimated total contract costs. Contract revenue is measured at the fair value of the consideration received or receivable.
For the purposes of recognising revenue, contract revenue comprises the initial amount of revenue agreed in the contract, the variations in contract work, claims and incentive payments to the extent that its receipt is considered probable and the amounts are capable of being reliably measured.
The percentage of completion method is applied on a cumulative basis in each accounting period to the current estimates of contract revenue and contract costs. The effect of a change in the estimate of contract revenue or contract costs, or the effect of a change in the estimate of the outcome of a contract, is accounted for as a change in accounting estimate and the effect of which are recognised in the Statement of Profit and Loss in the period in which the change is made and in subsequent periods.
Revenue in excess of billings is recognised as amounts due from customer under construction contracts in the balance sheet. Contract revenue in case of ‘Cost Plus’ contracts is determined by adding the aggregate cost plus proportionate margin as agreed with the
customer. Subsequent to the close of the contract, expenditure if any, incurred on completed jobs during the Defects Liability period is accounted
for in the year of such expenses. Contract cost include cost that relate directly to the specific contract, cost that are attributable to contract activity in general and can
be allocated to the contract and such other costs as are specifically chargeable to the customer under the terms of the contract. When the outcome of a construction contract cannot be estimated reliably, revenue is recognised only to the extent of contract costs
incurred of which recovery is probable and the related contract costs are recognised as an expense in the period in which they are incurred. When it is probable that total contract costs will exceed total contract revenue, the expected loss is recognised as an expense in the
Statement of Profit and Loss in the period in which such probability occurs. Claims and amounts in respect thereof are recognized only when negotiations have advanced to a stage where it is probable that
the customer(s) will accept them and amounts can be reliably measured. In the case of Arbitration Awards (the “Awards”) which are granted in favor of the Company, the award amount (including interest thereon), are accounted when they are granted and where it is reasonable to expect ultimate collection of such awards.
The Group evaluates whether it is acting as a principal or agent by considering a number of factors, including, among other things, whether the Group is the primary obligor under the arrangement, has inventory risk, has customer's credit risk and has latitude in establishing prices. Where the Group is the principal in the transaction, revenue and related costs are recorded at their gross values. Where the Group is effectively the agent in the transaction, revenue and related costs are recorded at their net values.
Dividend and interest income Dividend income from investments is recognised when the shareholder's right to receive payment has been established (provided
that it is probable that the economic benefits will flow to the Group and the amount of income can be measured reliably). Interest income from a financial asset is recognised when it is probable that the economic benefits will flow to the Group and the
amount of income can be measured reliably. Interest income is accrued on a time basis, by reference to the principal outstanding and at the effective interest rate applicable, which is the rate that exactly discounts estimated future cash receipts through the expected life of the financial asset to that asset's net carrying amount on initial recognition.
Rendering of Services Revenue from rendering of services is measured at fair value of consideration received or receivable. Revenue is recognised over
of the life of the contract using percentage completion method and when the outcome of the transaction is estimated reliably. The outcome of a transaction is estimated reliably when all the following conditions are satisfied:
(a) the amount of revenue can be measured reliably;(b) it is probable that the economic benefits associated with the transaction will flow to the entity;(c) the stage of completion of the transaction at the end of the reporting period can be measured reliably; and(d) the costs incurred for the transaction and the costs to complete the transaction can be measured reliably
When the outcome of the transaction involving the rendering of services cannot be estimated reliably, revenue shall be recognised only to the extent of the expenses recognised that are recoverable.
Revenues from maintenance contracts are recognised pro-rata over the period of the contract.

93
Consolidated finanCial statement of afCons infrastruCture limited and its subsidiaries, assoCiates and joint ventures (afCons group)
Notes forming part of the consolidated financial statements for the year ended 31st March, 20173.7 Leasing Leases are classified as finance leases whenever the terms of the lease transfer substantially all the risks and rewards of ownership
to the lessee. All other leases are classified as operating leases. Rental income from operating leases is generally recognised on a straight-line basis over the term of the relevant lease. Where the
rentals are structured solely to increase in line with expected general inflation to compensate for the Group’s expected inflationary cost increases, such increases are recognised in the year in which such benefits accrue. Initial direct costs incurred in negotiating and arranging an operating lease are added to the carrying amount of the leased asset and recognised on a straight-line basis over the lease term.
Rental expense from operating leases is generally recognised on a straight-line basis over the term of the relevant lease. Where the rentals are structured solely to increase in line with expected general inflation to compensate for the lessor's expected inflationary cost increases, such increases are recognised in the year in which such benefits accrue. Contingent rentals arising under operating leases are recognised as an expense in the period in which they are incurred.
3.8 Foreign currencies(i) Functional and presentation currency Items included in the financial statements of each of the Group’s entities are measured using the currency of the primary economic
environment in which the entity operates (‘the functional currency’). The consolidated financial statements are presented in Indian rupee (INR), which is Company`s functional and presentation currency.
(ii) Transactions and balances In preparing the financial statements of each individual Group entity, transactions in currencies other than the entity's functional
currency (foreign currencies) are recognised at the rates of exchange prevailing at the dates of the transactions. At the end of each reporting period, monetary items denominated in foreign currencies are retranslated at the rates prevailing at that date. Non-monetary items carried at fair value that are denominated in foreign currencies are retranslated at the rates prevailing at the date when the fair value was determined. Non-monetary items that are measured in terms of historical cost in a foreign currency are not retranslated.
Any exchange difference arising on settlement / restatement of long-term foreign currency monetary items recognized in the financial statements until the year ended 31st March, 2016, are capitalized as a part of the depreciable fixed assets to which the monetary item relates and depreciated over the remaining useful life of such assets.
For the purposes of presenting these financial statements, the assets and liabilities of the Group's foreign operations are translated into Indian Rupees using exchange rates prevailing at the end of each reporting period. Income and expense items are translated at the average exchange rates for the period, unless exchange rates fluctuate significantly during that period, in which case the exchange rates at the dates of the transactions are used. Exchange differences arising, if any, are recognised in other comprehensive income and accumulated in equity (and attributed to non-controlling interests as appropriate).
On the disposal of a foreign operation (i.e. a disposal of the Group's entire interest in a foreign operation, a disposal involving loss of control over a subsidiary that includes a foreign operation, or a partial disposal of an interest in a joint arrangement or an associate that includes a foreign operation of which the retained interest becomes a financial asset), all of the exchange differences accumulated in equity in respect of that operation attributable to the owners of the Company are reclassified to profit or loss.
In addition, in relation to a partial disposal of a subsidiary that includes a foreign operation that does not result in the Group losing control over the subsidiary, the proportionate share of accumulated exchange differences are re-attributed to non-controlling interests and are not recognised in profit or loss. For all other partial disposals (i.e. partial disposals of associates or joint arrangements that do not result in the Group losing significant influence or joint control), the proportionate share of the accumulated exchange differences is reclassified to profit or loss.
Goodwill and fair value adjustments to identifiable assets acquired and liabilities assumed through acquisition of a foreign operation are treated as assets and liabilities of the foreign operation and translated at the rate of exchange prevailing at the end of each reporting period. Exchange differences arising are recognised in other comprehensive income.
3.9 Borrowing costs Borrowing costs directly attributable to the acquisition, construction or production of qualifying assets, which are assets that
necessarily take a substantial period of time to get ready for their intended use or sale, are added to the cost of those assets, until such time as the assets are substantially ready for their intended use or sale.
Interest income earned on the temporary investment of specific borrowings pending their expenditure on qualifying assets is deducted from the borrowing costs eligible for capitalisation.
All other borrowing costs are recognised in profit or loss in the period in which they are incurred.3.10 Employee benefits3.10.1 Retirement benefit costs and termination benefits Employee benefits include provident fund, superannuation fund, employee state insurance scheme, gratuity fund, compensated
absences and leave encashment. Payments to defined contribution retirement benefit plans are recognised as an expense when employees have rendered service
entitling them to the contributions. For defined retirement benefit plans, the cost of providing benefits is determined using the projected unit credit method, with actuarial
valuations being carried out at the end of each annual reporting period. Re-measurement, comprising actuarial gains and losses, the effect of the changes to the asset ceiling (if applicable) and the return on plan assets (excluding net interest), is reflected immediately in the balance sheet with a charge or credit recognised in other comprehensive income in the period in which they occur. Remeasurement recognised in other comprehensive income is reflected immediately in retained earnings and is not reclassified to profit or loss. Past service cost is recognised in profit or loss in the period of a plan amendment. Net interest is calculated by applying the discount rate at the beginning of the period to the net defined benefit liability or asset. Defined benefit costs are categorised as follows:

94
Consolidated finanCial statement of afCons infrastruCture limited and its subsidiaries, assoCiates and joint ventures (afCons group)
Notes forming part of the consolidated financial statements for the year ended 31st March, 2017• service cost (including current service cost, past service cost, as well as gains and losses on curtailments and settlements);• net interest expense or income; and• re-measurement
The Group presents the first two components of defined benefit costs in profit or loss in the line item 'Employee benefits expense'. Curtailment gains and losses are accounted for as past service costs.
The present value of the defined benefit plan liability is calculated using a discount rate which is determined by reference to market yields at the end of the reporting period on government bonds.
The retirement benefit obligation recognised in the consolidated balance sheet represents the actual deficit or surplus in the Group's defined benefit plans. Any surplus resulting from this calculation is limited to the present value of any economic benefits available in the form of refunds from the plans or reductions in future contributions to the plans.
A liability for a termination benefit is recognised at the earlier of when the entity can no longer withdraw the offer of the termination benefit and when the entity recognises any related restructuring costs.
3.10.2 Short-term and other long-term employee benefits A liability is recognised for benefits accruing to employees in respect of salaries, wages and other short term employee benefits in the
period the related service is rendered at the undiscounted amount of the benefits expected to be paid in exchange for that service. Provision for leave benefits to employees is based on actuarial valuation done by projected accrued benefit method at the reporting date3.11 Taxation Income tax expense represents the sum of the tax currently payable and deferred tax.3.11.1 Current tax The tax currently payable is based on taxable profit for the year. Taxable profit differs from 'profit before tax' as reported in the
statement of profit and loss because of items of income or expense that are taxable or deductible in other years and items that are never taxable or deductible. The Company's current tax is calculated using tax rates that have been enacted or substantively enacted by the end of the reporting period.
3.11.2 Deferred tax Deferred tax is recognised on temporary differences between the carrying amounts of assets and liabilities in the financial statements
and the corresponding tax bases used in the computation of taxable profit. Deferred tax liabilities are generally recognised for all taxable temporary differences. Deferred tax assets are generally recognised for all deductible temporary differences to the extent that it is probable that taxable profits will be available against which those deductible temporary differences can be utilised. Such deferred tax assets and liabilities are not recognised if the temporary difference arises from the initial recognition (other than in a business combination) of assets and liabilities in a transaction that affects neither the taxable profit nor the accounting profit. In addition, deferred tax liabilities are not recognised if the temporary difference arises from the initial recognition of goodwill.
Deferred tax liabilities are recognised for taxable temporary differences associated with investments in subsidiaries except where the Company is able to control the reversal of the temporary difference and it is probable that the temporary difference will not reverse in the foreseeable future. Deferred tax assets arising from deductible temporary differences associated with such investments and interests are only recognised to the extent that it is probable that there will be sufficient taxable profits against which to utilise the benefits of the temporary differences and they are expected to reverse in the foreseeable future.
The carrying amount of deferred tax assets is reviewed at the end of each reporting period and reduced to the extent that it is no longer probable that sufficient taxable profits will be available to allow all or part of the asset to be recovered.
Deferred tax liabilities and assets are measured at the tax rates that are expected to apply in the period in which the liability is settled or the asset realised, based on tax rates (and tax laws) that have been enacted or substantively enacted by the end of the reporting period.
The measurement of deferred tax liabilities and assets reflects the tax consequences that would follow from the manner in which the Company expects, at the end of the reporting period, to recover or settle the carrying amount of its assets and liabilities.
3.11.3 Current and deferred tax for the year Current and deferred tax are recognised in profit or loss, except when they relate to items that are recognised in other comprehensive
income or directly in equity, in which case, the current and deferred tax are also recognised in other comprehensive income or directly in equity respectively. Where current tax or deferred tax arises from the initial accounting for a business combination, the tax effect is included in the accounting for the business combination.
3.12 Property, plant and equipment Property, Plant and Equipment are carried at cost less accumulated depreciation and impairment losses, if any. The cost of property, plant
and Equipment comprises its purchase price net of any trade discounts and rebates, any import duties and other taxes (other than those subsequently recoverable from the tax authorities), any directly attributable expenditure on making the asset ready for its intended use, other incidental expenses and interest on borrowings attributable to acquisition of qualifying fixed assets up to the date the asset is ready for its intended use. It also includes initial estimate of the costs of dismantling and removing the item and restoring the site on which it is located. Replacement cost of an item of property, plant and equipment is capitalised if replacement meets the recognition criteria.
Carrying amount of items replaced is derecognised. Cost of major inspections is recognised in the carrying amount of property, plant and equipment as a replacement, if recognition criteria are satisfied and any remaining carrying amount of the cost of previous inspection is derecognised. Machinery spares which can be used only in connection with an item of fixed asset and whose use is expected to be irregular are capitalised (if they meet the asset recognition criteria) and depreciated over the useful life of the principal item of the relevant assets. Subsequent expenditure on property, plant and equipment after its purchase / completion is capitalised only if such expenditure results in an increase in the future benefits from such asset beyond its previously assessed standard of performance.

95
Consolidated finanCial statement of afCons infrastruCture limited and its subsidiaries, assoCiates and joint ventures (afCons group)
Notes forming part of the consolidated financial statements for the year ended 31st March, 2017 Estimated useful lives of the assets are as follows: Buildings - 60 years Furniture and Fixtures - 10 years Vehicles - 10 years Office equipments - 5 years Freehold land is not depreciated. For following assets estimated useful life is different than the useful life prescribed in schedule II to the Companies Act, 2013 and
has been assessed on technical advice, taking into account the nature of the asset, the estimated usage of the asset, the operating conditions of the asset, past history of replacement, anticipated technological changes, manufacturers warranties and maintenance support, etc.
Plant & Equipment (except Tunnel Boring Machines) which includes Cranes < 100 mt., Concreting, Crushing, Piling, Road making, Laboratory & Welding Equipments, Floating Equipments - 20 Years.
Tunnel Boring Machines - Length of the tunnel bored over life of the construction project for where it is used. Cost of shuttering materials, issued to jobs, is charged off equally over a period of four years. An item of property, plant and equipment is derecognised upon disposal or when no future economic benefits are expected to arise
from the continued use of the asset. Any gain or loss arising on the disposal or retirement of an item of property, plant and equipment is determined as the difference between the sales proceeds and the carrying amount of the asset and is recognised in profit or loss.
3.12.1 Capital work-in-progress: Projects under Property, plant and equipment that are not yet ready for their intended use are carried at cost, comprising direct cost,
related incidental expenses and attributable interest.3.13 Intangible assets Intangible assets with finite useful lives that are acquired separately are carried at cost less accumulated amortisation and
accumulated impairment losses. Amortisation is recognised on a straight-line basis over their estimated useful lives. The estimated useful life and amortisation method are reviewed at the end of each reporting period, with the effect of any changes in estimate being accounted for on a prospective basis. Intangible assets with indefinite useful lives that are acquired separately are carried at cost less accumulated impairment losses. Useful life is as below:
Computer Software - 5 years An intangible asset is derecognised on disposal, or when no future economic benefits are expected from use or disposal. Gains or
losses from derecognition of an intangible assets, measured at the difference between the net disposal proceeds and the carrying amount of the assets, are recognised in profit or loss when the asset is derecognised.
3.14 Impairment of tangible and intangible assets other than goodwill At the end of each reporting period, the Group reviews the carrying amounts of its tangible and intangible assets to determine
whether there is any indication that those assets have suffered an impairment loss. If any such indication exists, the recoverable amount of the asset is estimated in order to determine the extent of the impairment loss (if any). When it is not possible to estimate the recoverable amount of an individual asset, the Group estimates the recoverable amount of the cash-generating unit to which the asset belongs. When a reasonable and consistent basis of allocation can be identified, corporate assets are also allocated to individual cash-generating units, or otherwise they are allocated to the smallest Group of cash-generating units for which a reasonable and consistent allocation basis can be identified.
Recoverable amount is the higher of fair value less costs of disposal and value in use. In assessing value in use, the estimated future cash flows are discounted to their present value using a pre-tax discount rate that reflects current market assessments of the time value of money and the risks specific to the asset for which the estimates of future cash flows have not been adjusted.
If the recoverable amount of an asset (or cash-generating unit) is estimated to be less than its carrying amount, the carrying amount of the asset (or cash-generating unit) is reduced to its recoverable amount. An impairment loss is recognised immediately in profit or loss, unless the relevant asset is carried at a revalued amount, in which case the impairment loss is treated as a revaluation decrease.
When an impairment loss subsequently reverses, the carrying amount of the asset (or a cash-generating unit) is increased to the revised estimate of its recoverable amount, but so that the increased carrying amount does not exceed the carrying amount that would have been determined had no impairment loss been recognised for the asset (or cash-generating unit) in prior years. A reversal of an impairment loss is recognised immediately in profit or loss.
3.15 Inventories Inventories are stated at the lower of cost and net realisable value. Net realisable value represents the estimated selling price for
inventories less all estimated costs of completion and costs necessary to make the sale. Cost is determined on the basis of weighted average method.
3.16 Provisions and contingent liabilities Provisions are recognised when the Group has a present obligation (legal or constructive) as a result of a past event, it is probable
that the Group will be required to settle the obligation, and a reliable estimate can be made of the amount of the obligation. The amount recognised as a provision is the best estimate of the consideration required to settle the present obligation at the end of
the reporting period, taking into account the risks and uncertainties surrounding the obligation. When a provision is measured using the cash flows estimated to settle the present obligation, its carrying amount is the present value of those cash flows (when the effect of the time value of money is material).

96
Consolidated finanCial statement of afCons infrastruCture limited and its subsidiaries, assoCiates and joint ventures (afCons group)
A Contingent Liability is disclosed where there is a possible obligation or a present obligation that may, but probably will not, require an outflow of resources. Contingent Assets are not recognised. Information on contingent liabilities is disclosed in the notes to consolidated financial statements unless the possibility of an outflow of resources embodying economic benefits is remote.
3.17 Financial Instruments: Financial assets and financial liabilities are recognised when a Group becomes a party to the contractual provisions of the instruments. Initial Recognition: Financial assets and financial liabilities are initially measured at fair value. Transaction costs that are directly attributable to the
acquisition or issue of financial assets and financial liabilities (other than financial assets and financial liabilities at fair value through profit or loss). Transaction costs directly attributable to the acquisition of financial assets or financial liabilities at fair value through profit or loss are recognised immediately in Statement of Profit and Loss.
3.18 Financial assets Classification and subsequent measurement of financial assets:3.18.1 Classification of financial assets: The Group classifies its financial assets in the following measurement categories:
• those to be measured subsequently at fair value (either through other comprehensive income, or through profit or loss), and• those measured at amortised cost.
The classification is done depending upon the Group’s business model for managing the financial assets and the contractual terms of the cash flows.
For assets measured at fair value, gains and losses will either be recorded in profit or loss or other comprehensive income, as elected.
For investments in debt instruments, this will depend on the business model in which the investment is held. The Group reclassifies debt investments when and only when its business model for managing those assets changes.3.18.2 Subsequent Measurement Debt instruments Subsequent measurement of debt instruments depends on the Group’s business model for managing the asset and the cash flow
characteristics of the asset. There are two measurement categories into which the Group classifies its debt instruments: Amortised cost Assets that are held for collection of contractual cash flows where those cash flows represent solely payments of principal and
interest are measured at amortised cost e.g. Debentures, Bonds etc. A gain or loss on a debt investment that is subsequently measured at amortised cost is recognised in profit or loss when the asset is derecognised or impaired. Interest income from these financial assets is included in investment income using the effective interest rate method.
Fair value through other comprehensive income Debt instruments that meet the following conditions are subsequently measured at fair value through other comprehensive income
(except for debt instruments that are designated as at fair value through profit or loss on initial recognition):• the asset is held within a business model whose objective is achieved both by collecting contractual cash flows and selling
financial assets; and• the contractual terms of the instrument give rise on specified dates to cash flows that are solely payments of principal and interest
on the principal amount outstanding. Fair value through profit or loss Assets that do not meet the criteria for amortised cost or fair value through OCI, are measured at fair value through profit or loss e.g.
investments in mutual funds. A gain or loss on a debt investment that is subsequently measured at fair value through profit or loss is recognised in profit or loss and presented net in the Statement of Profit and Loss within other gains/(losses) in the period in which it arises.
Equity instruments Investments in equity instruments at FVTPL Investments in equity instruments are classified as at FVTPL, unless the Group irrevocably elects on initial recognition to present
subsequent changes in fair value in other comprehensive income for equity instruments which are not held for trading. Investments in equity instruments at FVTOCI On initial recognition, the Group can make an irrevocable election (on an instrument-by-instrument basis) to present the subsequent
changes in fair value in other comprehensive income. This election is not permitted if the equity investment is held for trading. These elected investments are initially measured at fair value plus transaction costs. Subsequently, they are measured at fair value with gains and losses arising from changes in fair value recognised in other comprehensive income and accumulated in the reserve for equity instruments through other comprehensive income'. The cumulative gain or loss is not reclassified to profit or loss on disposal of the investments.
3.18.3 Impairment of financial assets The Group applies the expected credit loss model for recognising impairment loss on financial assets measured at amortised cost,
lease receivables, trade receivables, other contractual rights to receive cash or other financial asset. For trade receivables, the Group measures the loss allowance at an amount equal to lifetime expected credit losses. Further, for the purpose of measuring lifetime expected credit loss allowance for trade receivables, the Group has used a practical
expedient as permitted under Ind AS 109. This expected credit loss allowance is computed based on a provision matrix which takes into account historical credit loss experience and adjusted for forward-looking information.
Notes forming part of the consolidated financial statements for the year ended 31st March, 2017

97
Consolidated finanCial statement of afCons infrastruCture limited and its subsidiaries, assoCiates and joint ventures (afCons group)
Notes forming part of the consolidated financial statements for the year ended 31st March, 20173.18.4 Derecognition of financial assets A financial asset is derecognised only when Group has transferred the rights to receive cash flows from the financial asset. Where
the entity has transferred an asset, the Group evaluates whether it has transferred substantially all risks and rewards of ownership of the financial asset. In such cases, the financial asset is derecognised.
On derecognition of a financial asset in its entirety, the difference between the asset's carrying amount and the sum of the consideration received and receivable and the cumulative gain or loss that had been recognised in other comprehensive income and accumulated in equity is recognised in profit or loss if such gain or loss would have otherwise been recognised in profit or loss on disposal of that financial asset.
3.18.5 Foreign exchange gains and losses The fair value of financial assets denominated in a foreign currency is determined in that foreign currency and translated at the spot
rate at the end of each reporting period. For foreign currency denominated financial assets measured at amortised cost and FVTPL, the exchange differences are recognised
in profit or loss except for those which are designated as hedging instruments in a hedging relationship.3.18.6 Income recognition Interest income Interest income from debt instruments is recognised using the effective interest rate method. The effective interest rate is the rate
that exactly discounts estimated future cash receipts through the expected life of the financial asset to the gross carrying amount of a financial asset. When calculating the effective interest rate, the Group estimates the expected cash flows by considering all the contractual terms of the financial instrument but does not consider the expected credit losses.
Dividends Dividends on all equity instruments whether measured at FVTOCI or FVTPL, are recognised in the Statement of Profit and Loss only
when the right to receive payment is established, it is probable that the economic benefits associated with the dividend will flow to the Group and the amount of the dividend can be measured reliably.
3.19 Financial liabilities and equity instruments Classification as debt or equity Debt and equity instruments issued by the Group are classified as either financial liabilities or as equity in accordance with the
substance of the contractual arrangements and the definitions of a financial liability and an equity instrument. Equity instruments An equity instrument is any contract that evidences a residual interest in the assets of an entity after deducting all of its liabilities.
Equity instruments issued by a Group are recognised at the proceeds received, net of direct issue costs. Repurchase of the Group's own equity instruments is recognised and deducted directly in equity. No gain or loss is recognised in
profit or loss on the purchase, sale, issue or cancellation of the Group's own equity instruments. Treasury shares In the consolidated financial statements, when any entity within the Group purchases the Company's ordinary shares, the
consideration paid, including any directly attributable incremental cost, is presented as a deduction from total equity, until they are cancelled, sold or reissued. When treasury shares are sold or reissued subsequently, the amount received is recognised as an increase in equity and the resulting surplus or deficit on the transaction is transferred to/ from share premium.
3.19.1 Classification and Subsequent Measurement: Financial liabilities Financial liabilities are classified as either financial liabilities at FVTPL or ‘Amortised cost’. Financial Liabilities at FVTPL Financial liabilities are classified as at FVTPL when the financial liability is held for trading or are designated upon initial recognition
as FVTPL. Gains or Losses on liabilities held for trading are recognised in the Statement of Profit and Loss. Financial Liabilities at Amortised cost Other financial liabilities (including borrowings and trade and other payables) are subsequently measured at amortised cost using
the effective interest method. The effective interest method is a method of calculating the amortised cost of a financial liability and of allocating interest expense over the relevant period. The effective interest rate is the rate that exactly discounts estimated future cash payments (including all fees and points paid or received that form an integral part of the effective interest rate, transaction costs and other premiums or discounts) through the expected life of the financial liability, or (where appropriate) a shorter period, to the net carrying amount on initial recognition.
3.19.2 Derecognition of financial liabilities The Group derecognises financial liabilities when, and only when, the Group's obligations are discharged, cancelled or have expired.
An exchange with a lender of debt instruments with substantially different terms is accounted for as an extinguishment of the original financial liability and the recognition of a new financial liability. Similarly, a substantial modification of the terms of an existing financial liability (whether or not attributable to the financial difficulty of the debtor) is accounted for as an extinguishment of the original financial liability and the recognition of a new financial liability. The difference between the carrying amount of the financial liability derecognised and the consideration paid and payable is recognised in profit or loss.

98
Consolidated finanCial statement of afCons infrastruCture limited and its subsidiaries, assoCiates and joint ventures (afCons group)
3.19.3 Foreign exchange gains and losses For financial liabilities that are denominated in a foreign currency and are measured at amortised cost at the end of each reporting
period, the foreign exchange gains and losses are determined based on the amortised cost of the instruments and are recognised in 'Other income' as 'Net foreign exchange gains/(losses)'.
3.20 Derivative financial instruments: The Group enters into derivative financial instruments viz. foreign exchange forward contracts, interest rate swaps and cross
currency swaps to manage its exposure to interest rate, foreign exchange rate risks and commodity prices. The Group does not hold derivative financial instruments for speculative purposes.
Derivatives are initially recognised at fair value at the date the derivative contracts are entered into and are subsequently remeasured to their fair value at the end of each reporting period. The resulting gain or loss is recognised in profit or loss immediately.
3.20.1 Embedded derivatives Derivatives embedded in non-derivative host contracts that are not financial assets within the scope of Ind AS 109 are treated as
separate derivatives when their risks and characteristics are not closely related to those of the host contracts and the host contracts are not measured at FVTPL.
3.21 Government grants, subsidies and export incentives Government grants are not recognised until there is reasonable assurance that the Group will comply with the conditions attaching
to them and that the grants will be received. Government grants are recognised in profit or loss on a systematic basis over the periods in which the Group recognises as
expenses the related costs for which the grants are intended to compensate.3.22 Earnings per share Basic earnings per share is computed by dividing the profit / (loss) for the year by the weighted average number of equity shares
outstanding during the year. Ordinary shares to be issued upon conversion of a mandatorily convertible instrument are included in the calculation of basic
earnings per share from the date the contract is entered into. Diluted earnings per share is computed by dividing the profit / (loss) for the year as adjusted for dividend, interest and other charges to expense or income (net of any attributable taxes) relating to the dilutive potential equity shares, by the weighted average number of equity shares considered for deriving basic earnings per share and the weighted average number of equity shares which could have been issued on the conversion of all dilutive potential equity shares. Potential equity shares are deemed to be dilutive only if their conversion to equity shares would decrease the net profit per share from continuing ordinary operations. Potential dilutive equity shares are deemed to be converted as at the beginning of the period, unless they have been issued at a later date.
3.23 First-time adoption optional exemptions and mandatory exceptions3.23.1 Overall principle The Group has prepared the opening consolidated balance sheet as per Ind AS as of 1st April, 2015 (the transition date) by recognising
all assets and liabilities whose recognition is required by Ind AS, not recognising items of assets or liabilities which are not permitted by Ind AS, by reclassifying items from previous GAAP to Ind AS as required under Ind AS, and applying Ind AS in measurement of recognised assets and liabilities. However, this principle is subject to the certain exception and certain optional exemptions availed by the Group as detailed below.
3.23.2 Accounting Estimates An entity’s estimates in accordance with Ind AS at the date of transition to Ind AS shall be consistent with estimates made for the
same date in accordance with previous GAAP (after adjustments to reflect any difference in accounting policies), unless there is objective evidence that those estimates were in error.
Ind AS estimates as at 1st April, 2015 are consistent with the estimates as at the same date made in conformity with previous GAAP. The Group made estimates for following items in accordance with Ind AS at the date of transition as these were not required under previous GAAP:• Investment in equity instruments carried at FVTPL or FVTOCI;• Impairment of financial assets based on expected credit loss model.
3.23.3 Derecognition of financial assets and financial liabilities The Group has applied the derecognition requirements of financial assets and financial liabilities prospectively for transactions
occurring on or after 1st April, 2015 (the transition date).3.23.4 Classification and measurement of financial assets Ind AS 101 requires an entity to assess classification and measurement of financial assets on the basis of the facts and circumstances
that exist at the date of transition to Ind AS.3.23.5 Past business combinations The Group has elected to apply Ind AS 103 Business Combinations prospectively to past business combinations that occurred
before the transition date of 1st April, 2015.3.23.6 Deemed cost for property, plant and equipment and intangible assets The Group has elected to consider the fair value of freehold land and floating equipments in its opening balance sheet as the
deemed cost and remaining assets are measured as per Ind AS 16.
Notes forming part of the consolidated financial statements for the year ended 31st March, 2017

99
Consolidated finanCial statement of afCons infrastruCture limited and its subsidiaries, assoCiates and joint ventures (afCons group)
Notes forming part of the consolidated financial statements for the year ended 31st March, 2017
3.23.7 Leases The Group has applied Appendix C of Ind AS 17 determining whether an arrangement contains a lease to determine whether an
arrangement existing at the transition date contains a lease on the basis of facts and circumstances existing at that date.3.23.8 Long term foreign currency monetary items The Group has opted to continue the policy adopted for accounting for exchange differences arising from translation of long term
foreign currency monetary items as per previous GAAP for loans taken before 31st March, 2016.3.23.9 Equity investments at FVTOCI The Group has designated certain investments in equity shares as at FVTOCI on the basis of facts and circumstances that existed
at the transition date.3.23.10 Cumulative translation differences on foreign operations The Group has elected the option to reset the cumulative translation differences on foreign operations that exist as of the transition
date to zero.4. Critical accounting judgements and key sources of estimation uncertainty In the application of the Company’s accounting policies, which are described in note 1, the management is required to make
judgements, estimates and assumptions about the carrying amounts of assets and liabilities that are not readily apparent from other sources. The estimates and associated assumptions are based on historical experience and other factors that are considered to be relevant. Actual results may differ from these estimates.
The estimates and underlying assumptions are reviewed on an ongoing basis. Revisions to accounting estimates are recognized in the period in which the estimate is revised if the revision affects only the period of the revision and future periods if the revision affects both current and future periods.
The following are the critical judgements and estimations that have been made by the management in the process of applying the Company’s accounting policies and that have the most significant effect on the amount recognised in the financial statements and/or key sources of estimation uncertainty that may have a significant risk of causing a material adjustment to the carrying amounts of assets and liabilities within the next financial year.
4.1 Critical accounting judgements Classification of Joint Arrangement as a Joint Operation A Joint Operation is a joint arrangement whereby the parties that have joint control of the arrangement have rights to the assets
and obligations for the liabilities, relating to the arrangements. Joint control is the contractually agreed sharing of control of an arrangement, which exist only when decisions about the relevant activities require unanimous consent of the parties sharing control.
When a Group entity undertakes its activities under joint operations, the Group as a joint operator recognises in relation to its interest in a joint operation:a) Its assets, including its share of any assets held jointly;b) Its liabilities, including its share of any liabilities incurred jointly;c) Its revenue from the sale of the output arising from the joint operation;d) Its share of the revenue from the sale of the output by the joint operation ande) Its expenses, including its share of any expenses incurred jointly.
A Joint Venture is a joint arrangement whereby the parties that have joint control of the arrangement have rights to the net assets of the joint arrangement. Joint control is the contractually agreed sharing of control of an arrangement, which exists only when decisions about the relevant activities require unanimous consent of the parties sharing control.
Accordingly, the Company has evaluated all its joint arrangements on the basis of the internal arrangements (contractual arrangements) entered into between the parties to the joint arrangements for execution of the project irrespective of the legal form.
4.2 Key sources of estimation uncertaintya) Revenue recognition The Group’s revenue recognition policy, which is set out in Note 3.6, is central to how the Group values the work it has carried
out in each financial year. These policies require forecasts to be made of the outcomes of long-term construction services, which require assessments and
judgements to be made on changes in scope of work and claims and variations. Across Construction Services there are several long-term and complex projects where the Group has incorporated significant
judgements over contractual entitlements. The range of potential outcomes could result in a materially positive or negative change to underlying profitability and cash flow.
Estimates are also required with respect to the below mentioned aspects of the contract.1) Determination of stage of completion;2) Estimation of project completion date; and3) Estimated total revenues and estimated total costs to completion, including claims and variations.

100
Consolidated finanCial statement of afCons infrastruCture limited and its subsidiaries, assoCiates and joint ventures (afCons group)
b) Taxation The Group is subject to tax in a number of jurisdictions and judgement is required in determining the worldwide provision for
income taxes. The Group provides for future liabilities in respect of uncertain tax positions where additional tax may become payable in future periods and such provisions are based on management’s assessment of exposures.
The uncertain tax positions are measured at the amount expected to be paid to taxation authorities when the Group determines that the probable outflow of economic resources will occur. Where the final tax outcome of these matters is different from the amounts that were initially recorded, such differences will impact the current and deferred income tax assets and liabilities in the period in which such determination is made.
c) Contingencies: In the normal course of business, contingent liabilities may arise from litigation and other claims against the Group. There are
certain obligations which managements have concluded based on all available facts and circumstances are not probable of payment or difficult to quantify reliably and such obligations are treated as contingent liabilities and disclosed in the notes but are not provided for in the financial statements. Although there can be no assurance of the final outcome of the legal proceedings in which the Group is involved it is not expected that such contingencies will have material effect on its financial position or profitability.
d) Useful lives of property, plant and equipment As described at note 3.12 above, the Group reviews the estimated useful lives of property, plant and equipment and residual values
at the end of each reporting period. There was no change in the useful life and residual values of property, plant and equipment as compared to previous year.
e) Fair value measurements and valuation processes Some of the Group’s assets and liabilities are measured at fair value for financial reporting purposes. In estimating the fair
value of an asset or a liability, the Group uses market-observable data to the extent it is available. Where Level 1 inputs are not available, the Group engages third party qualified valuers to perform the valuation. The management works closely with the qualified external valuers to establish the appropriate valuation techniques and inputs to the model.
f) Retirement benefit obligations Details of the Group’s defined benefit pension schemes are set out in Note 3.10, including tables showing the sensitivity of the
pension scheme obligations and assets to different actuarial assumptions. At 31st March, 2017, the retirement benefit liability recognised on the Company’s balance sheet was ` 15.47 Crores (as at
31st March, 2016 ` 10.18 Crores and as at 1st April, 2015 ` 6.69 Crores). The effects of changes in the actuarial assumptions underlying the benefit obligation and discount rates and the differences between expected and actual returns on the schemes’ assets are classified as actuarial gains and losses. For the year ended the Company recognised net actuarial losses of ` 5.60 Crores in Other Comprehensive Income (2015-16: ` 2.87 Crores loss), including its share of the actuarial gains and losses arising in joint operations and associates.
g) Arbitration claims The forecast profit on contracts includes key judgements over the expected recovery of costs arising from the following: variations
to the contract requested by the customer, compensation events, and claims made by the Company for delays or other additional costs for which the customer is liable. These claims could result in disputes that get settled through an arbitration process wherein the outcome of these awards including the timing and the amount (including interest thereon) requires a reasonable degree of estimation. The inclusion of these amounts requires estimation of their recoverability and could impact the level of profit or loss recognised by the Company.
h) Expected credit loss The Company has a policy of assessing the creditworthiness of potential customers before entering into transactions by
performing a credit evaluation on the financial condition of accounts receivable using independent ratings where available or by assessment of the customer’s credit quality based on its financial position, past experience and other factors. The recoverability of trade receivables is regularly reviewed in the light of the available economic information specific to each receivable and specific provisions are recognised for balances considered to be irrecoverable. The expected credit loss allowance for trade receivables is made based on a provision matrix. The provision matrix takes into account historical credit loss experience and adjusted for forward-looking information. Where the actual cash shortfalls vary from those estimated, these could impact the level of profit or loss recognised by the Company.
Notes forming part of the consolidated financial statements for the year ended 31st March, 2017

101
Consolidated finanCial statement of afCons infrastruCture limited and its subsidiaries, assoCiates and joint ventures (afCons group)
Notes forming part of the consolidated financial statements for the year ended 31st March, 2017
Note 2. (A) Details of Group subsidiaries at the end of the reporting period are as follows.Name of Subsidiaries Country of
IncorporationPercentage
Holding - ShareHazarat and Company Private Limited. India 100%
Afcons Corrosion Protection Pvt. Ltd. India 100%
Afcons Offshore and Marine Services Pvt. Ltd. India 100%
Afcons (Mideast) Constructions and Investments Private Limited $ India 100%
Afcons Infrastructures Kuwait for Building, Road and Marine Contracting WLL * Kuwait 49%
Afcons Construction Mideast LLC * U.A.E 49%
Afcons Gulf International Projects Services FZE # U.A.E. 100%
Afcons Mauritius Infrastructure Limited Mauritius 100%
Afcons Overseas Singapore Pte Ltd. Singapore 100%
Afcons Infra Projects Kazakhstan, LLP % Kazakhstan 100%
Afcons Saudi Constructions LLC (w.e.f. 2nd June, 2015) Saudi Arabia 100%
Afcons Overseas Project Gabon SARL (w.e.f. 27th October, 2015) % Gabon 100%
Afcons Shareholding (Educational Assistance) Trust nos.1, 2 and 3 India ^
Afcons Shareholding (General assistance) Trust nos.1, 2 and 3 India ^
Afcons Shareholding (Health promotion) Trust nos.1, 2 and 3 India ^
Afcons Shareholding (Hobbies & Craft Training) Trust nos.1, 2 and 3 India ^
Afcons Shareholding (Holiday Assistance) Trust nos.1, 2 and 3 India ^
Afcons Shareholding (Medical Benefit) Trust nos.1, 2 and 3 India ^
Afcons Shareholding (Personnel Development) Trust nos.1, 2 and 3 India ^
Afcons Shareholding (Training & Development) Trust nos.1, 2 and 3 India ^
Afcons Employees Welfare Trust nos.1, 2, 3 and 4 India ^
* Although, the Parent Company has less than a majority of the voting rights of the investee, it has power over the investee as the voting rights are sufficient to give it the practical ability to direct the relevant activities of the investee unilaterally.
# Subsidiary of AMIL$ Accounted based on control exercised through its employee welfare trusts% Subsidiary of Afcons Overseas Singapore Pte Ltd.^ Controlled trusts wherein control is not by way of equity interest, but through its practical ability to direct the relevant activities of the
investee unilaterally.Afcons Overseas Construction LLC has not been considered as a subsidiary for the year ended 31st March 2017 since the company is under liquidation during the year ended 31st March, 2017.The principal activities of the Company including its Joint Operations and its subsidiaries (the Group) are Infrastructure activities.
(B) Details of Joint Operations at the end of the reporting period are as follows.Name of Joint Operations Country of
IncorporationPercentage
Holding - ShareTranstonnelstroy Afcons Joint Venture India 99%
Dahej Standby Jetty Project Undertaking India 100%
Afcons Gunanusa Joint Venture India 80%
Afcons Pauling Joint Venture India 100%
Strabag AG Afcons Joint Venture India 40%
Saipem Afcons Joint Venture Oman 50%
Ircon Afcons Joint Venture India 47%
Afcons Sener LNG Construction Projects Pvt.Ltd. India 49%
Afcons Sibmost Joint Venture (w.e.f. 3rd August, 2016) India 100%
Afcons Vijeta PES Joint Venture (w.e.f. 25th May, 2016) India 100%

102
Not
e 3.
Pro
pert
y, P
lant
and
Equ
ipm
ents
A. T
angi
ble
asse
ts
` in
Cro
res
Part
icul
ars
Gro
ss b
lock
Dep
reci
atio
n / A
mor
tisat
ion
Net
Blo
ckB
alan
ce a
s at
1st A
pril,
201
6A
dditi
ons
Dis
posa
lsB
alan
ce a
s at
31
st M
arch
, 201
7B
alan
ce a
s at
1st A
pril,
201
6D
epre
ciat
ion
/ am
ortis
atio
n ex
pens
e fo
r the
yea
r
Elim
inat
ed
on d
ispo
sal
of a
sset
s
Bal
ance
as
at
31st M
arch
, 201
7B
alan
ce a
s at
31
st M
arch
, 201
7
(a) F
reeh
old
Land
203
.00
- -
203
.00
- -
- -
203
.00
(b) B
uild
ings
32.
60 2
.04
- 3
4.64
14.
98 0
.71
- 1
5.69
18.
95(c
) Pla
nt a
nd E
quip
men
t 1
,538
.84
262
.20
(14.
98)
1,7
86.0
6 6
12.4
4 1
16.0
5 (1
0.98
) 7
17.5
1 1
,068
.55
(d) F
urni
ture
and
Fix
ture
s 3
4.39
4.2
7 (0
.34)
38.
32 9
.63
3.3
4 (0
.11)
12.
86 2
5.46
(e) V
ehic
les
21.
66 2
.46
(0.5
1) 2
3.61
6.9
6 2
.34
(0.3
1) 8
.99
14.
62(f)
Offi
ce e
quip
men
ts 3
5.12
5.6
7 (0
.25)
40.
54 2
3.47
4.1
8 (0
.19)
27.
46 1
3.08
(g) L
ease
hold
impr
ovem
ents
2.7
9 -
- 2
.79
2.7
9 -
- 2
.79
-(h
) Flo
atin
g E
quip
men
ts 2
20.2
6 0
.36
(0.4
4) 2
20.1
8 1
6.31
14.
54 (0
.43)
30.
42 1
89.7
6(i)
Lab
orat
ory
Equ
ipm
ents
0.9
6 1
.15
(0.1
0) 2
.01
0.5
3 0
.05
(0.0
5) 0
.53
1.4
8(i)
Shu
tterin
g M
ater
ials
72.
73 2
8.82
(4.4
9) 9
7.06
18.
44 1
7.20
- 3
5.64
61.
42(k
) Acc
esso
ries
& A
ttach
men
ts 3
4.00
12.
29 (0
.36)
45.
93 8
.70
8.9
5 -
17.
65 2
8.28
Tot
al 2
,196
.35
319
.26
(21.
47)
2,4
94.1
4 7
14.2
5 1
67.3
6 (1
2.07
) 8
69.5
4 1
,624
.60
Prev
ious
Yea
r `
in C
rore
s
Parti
cula
rs
Gro
ss b
lock
Depr
ecia
tion
/ Am
ortis
atio
nNe
t Blo
ckBa
lanc
e as
at
1st A
pril,
201
5Ad
ditio
nsDi
spos
als
Bala
nce
as a
t 31
st M
arch
, 201
6Ba
lanc
e as
at
1st A
pril,
201
5De
prec
iatio
n/
amor
tisat
ion
expe
nse
for t
he y
ear
Elim
inat
ed o
n di
spos
al o
f as
sets
Bala
nce
as a
t 31
st M
arch
, 201
6Ba
lanc
e as
at
31st M
arch
, 201
6Ba
lanc
e as
at
1st A
pril,
201
5
(a) F
reeh
old
Land
203
.00
- -
203
.00
- -
- -
203
.00
203
.00
(b) B
uild
ings
18.
54 1
4.06
- 3
2.60
14.
40 0
.58
- 1
4.98
17.
62 4
.14
(c) P
lant
and
Equ
ipm
ent
1,3
37.3
0 2
16.4
4 (1
4.90
) 1
,538
.84
519
.84
100
.00
(7.4
0) 6
12.4
4 9
26.4
0 8
17.4
6(d
) Fur
nitu
re a
nd F
ixtu
res
29.
89 5
.78
(1.2
8) 3
4.39
7.1
7 3
.21
(0.7
5) 9
.63
24.
76 2
2.72
(e) V
ehic
les
19.
10 3
.96
(1.4
0) 2
1.66
5.6
5 2
.30
(0.9
9) 6
.96
14.
70 1
3.45
(f) O
ffice
equ
ipm
ents
28.
54 7
.53
(0.9
5) 3
5.12
20.
14 4
.11
(0.7
8) 2
3.47
11.
65 8
.40
(g) L
ease
hold
impr
ovem
ents
2.7
9 -
- 2
.79
2.7
9 -
- 2
.79
- -
(h) F
loat
ing
Equi
pmen
ts 2
17.5
9 2
.67
- 2
20.2
6 -
16.
31 -
16.
31 2
03.9
5 2
17.5
9(i)
Lab
orat
ory
Equi
pmen
ts 1
.67
- (0
.71)
0.9
6 1
.00
0.0
4 (0
.51)
0.5
3 0
.43
0.6
7(j)
Shu
tterin
g M
ater
ials
46.
54 2
6.19
- 7
2.73
- 1
8.44
- 1
8.44
54.
29 4
6.54
(k) A
cces
sorie
s &
Atta
chm
ents
24.
39 9
.61
- 3
4.00
- 8
.70
- 8
.70
25.
30 2
4.39
Tot
al 1
,929
.35
286
.24
(19.
24)
2,1
96.3
5 5
70.9
9 1
53.6
9 (1
0.43
) 7
14.2
5 1
,482
.10
1,3
58.3
6N
otes
:(1
) A
dditi
ons
for t
he y
ear i
nclu
des
fore
ign
exch
ange
cap
italis
ed d
urin
g th
e ye
ar a
mou
ntin
g to
` 1
0.69
Cro
res
(Pre
viou
s Ye
ar `
0.2
9 C
rore
s). T
he b
alan
ce a
mou
nt o
f For
eign
exc
hang
e flu
ctua
tion,
ca
pita
lised
as
a pa
rt of
cos
t of T
angi
ble
Ass
ets,
rem
aini
ng to
be
amor
tised
is `
16.
28 C
rore
s (P
revi
ous
year
` 9
.57
Cro
res)
.(2
) Fr
eeho
ld L
and
with
a c
arry
ing
amou
nt o
f ` 2
03.0
0 C
rore
s (a
s at
31st
Mar
ch, 2
016
` 20
3.00
Cro
res)
has
bee
n se
cure
d by
equ
itabl
e m
ortg
age
with
con
sorti
um b
anks
. Ref
er N
ote
No.
14.
B
uild
ings
car
ryin
g am
ount
of `
18.
95 C
rore
s (a
s at
31st
Mar
ch, 2
016
` 17
.62
Cro
res)
has
bee
n se
cure
d by
equ
itabl
e m
ortg
age
with
con
sorti
um b
anks
. Ref
er N
ote
No.
14.
P
lant
and
Equ
ipm
ent i
nclu
ding
Flo
atin
g E
quip
men
ts w
ith a
car
ryin
g am
ount
of `
1,2
09.0
8 C
rore
s (a
s at
31st
Mar
ch, 2
016
` 1,
077.
16 C
rore
s) h
as b
een
secu
red
by w
ay o
f hyp
othe
catio
n in
favo
ur
of te
rm le
nder
s an
d co
nsor
tium
ban
ks h
ave
been
sec
ured
thro
ugh
Inde
ntur
e of
Mor
tgag
e. R
efer
Not
e N
o. 1
4.(3
) Th
ere
is n
o im
pairm
ent l
oss
on a
ny o
f the
ass
ets
incl
uded
abo
ve, a
s th
e va
lue
in u
se is
mor
e th
an c
arry
ing
amou
nt.
Not
es fo
rmin
g pa
rt o
f the
Con
solid
ated
fina
ncia
l sta
tem
ents
for t
he y
ear e
nded
31st
Mar
ch, 2
017
CONS
OLID
ATED
FIN
ANCI
AL S
TATE
MENT
OF
AFCO
NS I
NFRA
STRU
CTUR
E LI
MITE
D AN
D IT
S SU
BSID
IARI
ES, A
SSOC
IATE
S AN
D JO
INT
VENT
URES
(AFC
ONS
GROU
P)

103
Not
es fo
rmin
g pa
rt o
f the
con
solid
ated
fina
ncia
l sta
tem
ents
for t
he y
ear e
nded
31st
Mar
ch, 2
017
CONS
OLID
ATED
FIN
ANCI
AL S
TATE
MENT
OF
AFCO
NS IN
FRAS
TRUC
TURE
LIM
ITED
AND
ITS
SUBS
IDIA
RIES
, ASS
OCIA
TES
AND
JOIN
T VE
NTUR
ES (A
FCON
S GR
OUP)
Not
e 3.
Pro
pert
y, P
lant
and
Equ
ipm
ents
(Con
td.)
B.
Oth
er In
tang
ible
ass
ets
` in
Cro
res
Part
icul
ars
Gro
ss b
lock
(At c
ost)
Am
ortis
atio
nN
et B
lock
Bal
ance
as
at1st
Apr
il, 2
016
Add
ition
sD
ispo
sals
Bal
ance
as
at
31st M
arch
, 201
7B
alan
ce a
s at
1st A
pril,
201
6A
mor
tisat
ion
for t
he y
ear
Elim
inat
ed o
n di
spos
al o
f ass
ets
Bal
ance
as
at
31st M
arch
, 201
7B
alan
ce a
s at
31
st M
arch
, 201
7C
ompu
ter s
oftw
are
- Acq
uire
d 1
0.99
0.7
9 -
11.
78 8
.27
1.2
6 -
9.5
3 2
.25
Goo
dwill
- A
cqui
red
0.2
0 -
(0.2
0) -
- -
- -
-To
tal
11.
19 0
.79
(0.2
0) 1
1.78
8.2
7 1
.26
- 9
.53
2.2
5
Prev
ious
Yea
r `
in C
rore
s
Part
icul
ars
Gro
ss b
lock
(At c
ost)
Am
ortis
atio
nN
et B
lock
Bal
ance
as
at1st
Apr
il, 2
015
Add
ition
sD
ispo
sals
Bala
nce
as a
t 31
st M
arch
, 201
6B
alan
ce a
s at
1st A
pril,
201
5A
mor
tisat
ion
for t
he y
ear
Elim
inat
ed
on
disp
osal
of
ass
ets
Bal
ance
as
at
31st M
arch
, 201
6Ba
lanc
e as
at
31st M
arch
, 201
6B
alan
ce a
s at
1st
Apr
il, 2
015
Com
pute
r sof
twar
e - A
cqui
red
8.0
3 3
.00
(0.0
4) 1
0.99
6.2
1 2
.06
- 8
.27
2.7
2 1
.82
Goo
dwill
- A
cqui
red
0.2
0 -
- 0
.20
- -
- -
0.2
0 0
.20
Tota
l 8
.23
3.0
0 (0
.04)
11.
19 6
.21
2.0
6 -
8.2
7 2
.92
2.0
2
C.
Cap
ital W
ork
in P
rogr
ess:
` 2
0.80
Cro
res
(As
at 3
1st M
arch
, 201
6 `
124.
28 C
rore
s; A
s at
1st A
pril,
201
5 `
174.
48 C
rore
s)
D.
Goo
dwill
Cos
t or D
eem
ed C
ost
As
at 3
1st M
arch
, 201
7 A
s at
31st
Mar
ch, 2
016
Bal
ance
at b
egin
ning
of y
ear
5
.20
4.3
7 E
ffect
of f
orei
gn c
urre
ncy
exch
ange
diff
eren
ces
(0
.37)
0.8
3 B
alan
ce a
t end
of y
ear
4
.83
5.2
0

104
Consolidated finanCial statement of afCons infrastruCture limited and its subsidiaries, assoCiates and joint ventures (afCons group)
Notes forming part of the consolidated financial statements for the year ended 31st March, 2017
Note 4. Non-current investments ` in CroresParticulars Face
ValueAs at 31st March, 2017 As at 31st March, 2016 As at 1st April, 2015Quantity Amount Quantity Amount Quantity Amount
A. Investment in equity instruments at FVTOCIQuoted Investments (Fully paid)
(a) Investment in equity instruments : Hindustan Oil Exploration Co. Ltd. ` 10 40,072 0.31 40,072 0.29 40,072 0.15 Hindustan Construction Co. Ltd. ` 1 2,000 0.01 2,000 - 2,000 0.01 Simplex Infrastructures Ltd. ` 2 500 0.02 500 - 500 0.02 ITD Cementation India Ltd. ` 1 1,000 0.02 1,000 - 1,000 0.01 Gammon India Ltd. ` 2 250 - 250 - 250 - Tata Consultancy Services Ltd. ` 1 4,00,000 97.24 4,00,000 100.67 4,00,000 102.16Total Aggregate Quoted Investments 97.60 100.96 102.35Unquoted Investments (Fully paid)
(b) Investment in equity instruments : Simar Port Ltd. # ` 10 1,000 - 1,000 - 1,000 -
# denotes value less than rupees ten thousand. - - -B. Investments at FVTPL(a) Investment in mutual funds :
Quoted SBI Infrastructure Fund ` 10 50,000 0.07 50,000 0.05 50,000 0.06 UTI Infrastructure Fund - Growth Plan ` 10 12,731 0.06 12,731 0.05 12,731 0.06 ICICI Prudential Equity Arbitrage Fund -
Growth Plan ` 10 10,64,245 2.31 10,64,245 2.17 - -Total Aggregate Mutual Fund Investment 2.44 2.27 0.12
Total Investments Carrying Value (A+B) 100.04 103.23 102.47Notes:(i) Aggregate book value of quoted investments 88.23 88.23 86.13(ii) Aggregate market value of quoted investments 100.04 103.23 102.47
Category-wise Other Investments - As per IND-AS 109 classification:
As at 31st March, 2017
As at 31st March, 2016
As at 1st April, 2015
Financial Assets carried at FVTPL- Mutual funds 2.44 2.27 0.12Financial Assets measured at FVTOCI- Equity instruments 97.60 100.96 102.35
100.04 103.23 102.47
Note 5. Trade Receivables ` in Crores
ParticularsAs at 31st March, 2017 As at 31st March, 2016 As at 1st April, 2015Current Non
CurrentCurrent Non
CurrentCurrent Non
Currenti) Unsecured, considered good 764.68 129.65 510.57 115.76 415.19 138.78ii) Doubtful - 20.63 - 20.50 - 25.48
764.68 150.28 510.57 136.26 415.19 164.26 Less: Allowance for expected credit losses - 20.63 - 20.50 - 25.48
764.68 129.65 510.57 115.76 415.19 138.78Total 764.68 129.65 510.57 115.76 415.19 138.78

105
Consolidated finanCial statement of afCons infrastruCture limited and its subsidiaries, assoCiates and joint ventures (afCons group)
Notes forming part of the consolidated financial statements for the year ended 31st March, 2017
Note 5.1 - Trade Receivables
The average realization period on Construction contracts is considered as 180 days. The company has computed the expected credit loss allowance for trade receivables based on a provision matrix. The provision matrix takes into account historical credit loss experience and accordingly provided for. The expected credit loss allowance is calculated based on credit loss experienced under different ageing category. The ageing of receivables at the year end is as below:
` in Crores
Age of Receivables As at 31st March, 2017 As at 31st March, 2016 As at 1st April, 2015Within the credit period 552.80 275.70 216.511-180 days past due 2.54 54.59 1.65180-365 days past due 20.99 5.75 33.661-2 years past due 3.46 2.41 4.20More than 2 years past due 46.32 47.41 65.20
Note 5.2 - Movement in the Expected Credit Loss Allowance ` in Crores
ParticularsAs at 31st March, 2017 As at 31st March, 2016 As at 1st April, 2015Current Non
CurrentCurrent Non
CurrentCurrent Non
CurrentBalance at beginning of the year - 20.50 - 25.48 - 19.96 Add : Provisions made during the year for credit loss - 0.70 - - - 5.52 Less : Provision for doubtful debtors / advances no
longer required written back - 0.44 - 3.20 - - Impairment losses reversed (Provisions written back) - 0.13 - 1.78 - -Balance at end of the year - 20.63 - 20.50 - 25.48
Note 6. Loans ` in Crores
ParticularsAs at 31st March, 2017 As at 31st March, 2016 As at 1st April, 2015Current Non
CurrentCurrent Non
CurrentCurrent Non
Current(a) Loans to related parties (Unsecured, considered good) To Joint Operations 46.49 - 43.21 - 40.67 -
Total 46.49 - 43.21 - 40.67 -These financial assets are carried at amortised cost
Note 7. Other financial assets ` in Crores
ParticularsAs at 31st March, 2017 As at 31st March, 2016 As at 1st April, 2015Current Non
CurrentCurrent Non
CurrentCurrent Non
Current(a) Interest on trade receivables as per arbitration awards 136.58 111.60 137.98 123.33 105.46 113.89(b) Accruals
(i) Interest accrued on bank deposits 0.35 - 0.06 - 0.10 -(c) Others
(i) Insurance claims 1.37 - 6.73 - 9.11 -(ii) Other Receivables from Joint Operations 10.12 - 3.79 - 16.08 -
11.49 - 10.52 - 25.19 -(d) Deposits (Unsecured, considered good)
(i) Security deposits 10.20 11.89 7.49 13.22 13.95 12.74(ii) Other Deposits 0.16 0.85 0.03 0.68 0.03 0.57
10.36 12.74 7.52 13.90 13.98 13.31(e) Derivative Assets - - 15.76 - 12.52 10.92
(f) Other Loans and Advances (Doubtful) - 0.64 - 0.64 - 0.64 Less: Provision for other doubtful loans and advances - 0.64 - 0.64 - 0.64
- - - - - -(g) Other Bank Balances ** - - - 0.19 - 0.19 Less : Provision for doubtful balances - - - 0.19 - 0.19
- - - - - -
Total 158.78 124.34 171.84 137.23 157.25 138.12
** The balances in these bank accounts are subject to exchange control restrictions for repatriation.

106
Consolidated finanCial statement of afCons infrastruCture limited and its subsidiaries, assoCiates and joint ventures (afCons group)
Notes forming part of the consolidated financial statements for the year ended 31st March, 2017Note 8. Other non-current & current assets ` in Crores
Particulars As at 31st March, 2017 As at 31st March, 2016 As at 1st April, 2015Current Non
CurrentCurrent Non
CurrentCurrent Non
Current(a) Amounts due from customer under construction
contracts Unsecured, considered good 2,637.58 484.69 2,950.55 212.38 2,440.17 246.69 Doubtful - 1.22 - 0.07 - 0.07
2,637.58 485.91 2,950.55 212.45 2,440.17 246.76 Less: Doubtful Provision - 1.22 - 0.07 - 0.07
2,637.58 484.69 2,950.55 212.38 2,440.17 246.69(b) Capital advances - 0.60 - 6.71 - 9.68(c) Prepayments 62.24 3.96 26.90 3.36 30.18 2.13(d) Advances to employees 4.09 - 2.03 - 2.77 -(e) Balances with government authorities
(i) VAT credit receivable 24.26 66.48 10.49 75.18 26.00 43.84(ii) Service Tax credit receivable 17.47 22.19 7.91 21.99 2.82 23.08(iii) Income tax refund receivable 4.00 - - - - -(iv) Duty credit receivables 0.48 - 19.06 - 14.26 -
46.21 88.67 37.46 97.17 43.08 66.92(f) Others - Advance to vendors and others 103.19 - 103.80 - 94.51 -
Total 2,853.31 577.92 3,120.74 319.62 2,610.71 325.42
Note 8.1 Amounts due from / (to) Customers under Construction contracts ` in CroresParticulars As at 31st March, 2017 As at 31st March, 2016 As at 1st April, 2015
Contracts in progress at the end of the reporting period:Construction cost incurred plus recognised profits less recognised loss to date 18,830.75 15,292.39 14,326.75Less : Progress Billings 15,836.55 12,176.21 11,641.40
2,994.20 3,116.18 2,685.35Recognised and included in the consolidated financial statements as amounts due : - from customers under construction contracts 3,122.27 3,162.93 2,686.86 - to customers under construction contracts (128.07) (46.75) (1.51)
2,994.20 3,116.18 2,685.35As at 31st March, 2017, retentions held by customers for contract work amounted to ` 197.06 Crores (As at 31st March, 2016 ` 162.24 Crores, As at 1st April, 2015 ` 152.08 Crores). Advances received from customers for contract work amounted to ` 1,461.25 Crores (As at 31st March, 2016 ` 1,335.50 Crores, As at 1st April, 2015 ` 1,361.76 Crores).
Note 9. Inventories ` in CroresParticulars As at
31st March, 2017As at
31st March, 2016As at
1st April, 2015(a) Construction Materials - at lower of cost and net realisable value Steel 220.49 135.34 108.61 Cement 9.82 15.96 8.28 Aggregate 49.29 99.90 12.23 Bitumen 3.02 4.44 0.02 Sand 4.84 8.36 2.41 Other Construction Material 54.18 55.85 33.54
341.64 319.85 165.09(b) Stores and spares - at lower of cost and net realisable value 216.88 208.83 135.50
216.88 208.83 135.50
Total 558.52 528.68 300.59The cost of inventories recognised as an expenses during the year in respect of continuing operation was ` 2,170.85 Crores (for the year ended 31st March, 2016 ` 1,269.00 Crores)

107
Consolidated finanCial statement of afCons infrastruCture limited and its subsidiaries, assoCiates and joint ventures (afCons group)
Notes forming part of the consolidated financial statements for the year ended 31st March, 2017Note 10. Cash and cash equivalents ` in Crores
Particulars As at 31st March, 2017
As at 31st March, 2016
As at 1st April, 2015
(a) Balances with banks In current accounts 145.76 127.66 79.59 Term deposits with original maturity of less than three months 13.09 13.32 62.41(b) Cash on hand 1.53 1.48 1.03
Total cash and cash equivalents 160.38 142.46 143.03
Note 10.1. Bank Balance other than Cash and cash equivalents ` in CroresParticulars As at
31st March, 2017As at
31st March, 2016As at
1st April, 2015Earmarked balance with banks
- Unpaid dividend accounts 0.54 0.52 0.27- Balances held as margin money or security against borrowings, guarantees and other commitments 0.09 0.09 0.29- Other earmarked accounts / escrow accounts 18.68 0.48 1.52
Investment in term deposit- Original maturity more than 3 months 9.67 12.56 9.89
Total 28.98 13.65 11.97
Note 11. Non current tax assets (Net) ` in CroresParticulars As at
31st March, 2017As at
31st March, 2016As at
1st April, 2015 Advance income tax (net of provisions ` 75.19 Crores) 74.65 59.56 74.84(As at 31st March, 2016 ` 73.57 Crores; As at 1st April, 2015 ` 65.92 Crores)
Total 74.65 59.56 74.84
Note 12. Share Capital ` in Crores
ParticularsAs at 31st March, 2017 As at 31st March, 2016 As at 1st April, 2015 Number of
shares` in
Crores Number of
shares` in
Crores Number of
shares` in
Crores(a) Authorised Equity shares of ` 10 each. 35,00,00,000 350.00 35,00,00,000 350.00 35,00,00,000 350.00 Preference shares of ` 10 each. 65,00,00,000 650.00 65,00,00,000 650.00 65,00,00,000 650.00
Total 1,00,00,00,000 1,000.00 1,00,00,00,000 1,000.00 1,00,00,00,000 1,000.00(b) Issued, Subscribed and Fully Paid up Equity shares of ` 10 each. (Refer Note (i) below) 7,19,70,238 71.97 7,19,70,238 71.97 7,19,70,238 71.97 Less : Treasury shares 11,91,370 1.19 11,91,370 1.19 11,91,370 1.19
7,07,78,868 70.78 7,07,78,868 70.78 7,07,78,868 70.78 0.01% Non Cumulative and Non Profit
Participatory Convertible Preference Shares of ` 10 each. (Refer Note (ii) below) 10,00,00,000 100.00 10,00,00,000 100.00 10,00,00,000 100.00
0.01% Fully and Compulsorily Convertible Non-Cumulative, Non Participatory Preference shares of ` 10 each. (Refer Note (iii) below) 25,00,00,000 250.00 25,00,00,000 250.00 25,00,00,000 250.00
0.01% Fully and Compulsorily Convertible Non-Cumulative, Non Participatory Preference shares of ` 10 each. (Refer Note (iv) below) 10,00,00,000 100.00 10,00,00,000 100.00 10,00,00,000 100.00
Total 52,07,78,868 520.78 52,07,78,868 520.78 52,07,78,868 520.78

108
Consolidated finanCial statement of afCons infrastruCture limited and its subsidiaries, assoCiates and joint ventures (afCons group)
Notes forming part of the consolidated financial statements for the year ended 31st March, 2017Note 12. Share Capital (Contd.)
Notes:
(i) Rights, preferences and restrictions attached to Equity Shares:
(a) Rights to receive dividend as may be approved by the Board / Annual General Meeting.(b) The Equity shares are not repayable except in the case of a buy back, reduction of capital or winding up in terms of the provisions
of the Companies Act, 2013.(c) Every member of the company holding equity shares has a right to attend the General Meeting of the company and has a right
to speak and on a show of hands, has one vote if he is present in person and on a poll shall have the right to vote in proportion to his share of the paid-up capital of the company.
(ii) Rights, preferences and restrictions attached to 0.01% Non Cumulative and Non Profit Participatory Convertible Preference Shares:
(a) The Preference Shares shall be non cumulative and non profit participating convertible Preference Shares carrying a fixed rate of dividend of 0.01% per annum to be paid in priority to the holders of any other class of shares.
(b) The Preference Shares shall be deemed to be converted into common equity shares of the Company at a price of ` 68.25 per equity share (consisting of par of ` 10 and a premium of ` 58.25) immediately, automatically and without any further act of the parties in the event of conversion of the Preference Shares mentioned in note iii(a) below.
(c) Every member of the Company holding preference shares has a right to vote in the General Meeting of the Company on resolutions placed before the Company which directly affect the rights attached to his preference shares.
(iii) Rights, preferences and restrictions attached to 0.01% Fully and Compulsorily Convertible Non-Cumulative, Non Participatory Preference shares:
(a) The Preference Shares shall be automatically and mandatorily converted into equity shares on 13th January, 2019 (“Mandatory Conversion Date”) i.e. on the Eleventh year from the Issue date. The mandatory conversion date of the 0.01% Fully and Compulsorily Convertible Non-Cumulative, Non Participatory Preference shares has been revised from 13th January, 2013 (5th year from the date of issue) to 13th January, 2019 (11th year from the date of issue) in terms of the consent letter obtained from the preference shareholder and the special resolution passed by the members of the Company at the Extra Ordinary General Meeting of the Company held on 10th January,2013.
(b) On Mandatory Conversion Date, the Preference Shares shall be converted into such number of equity shares of the Company constituting 74% of the outstanding equity share capital and Convertible Preference Shares of the Company calculated on a fully diluted basis on the date of issue (i.e. 13th January, 2008) resulting into 24,65,40,258 equity shares.
(c) The Preference Shares shall be entitled to fixed non-cumulative preferential dividend at the fixed rate of 0.01% per annum which shall be paid in priority to the holder of any other class of shares.
(d) On return of capital on a liquidation or otherwise of the assets of the Company, the holder of Preference Shares shall be entitled, in priority to any payment to the holders of any other class of shares, to be repaid a sum equal to the capital paid up or credited as paid up on the Preference Shares held by it.
(e) Every member of the Company holding preference shares has a right to vote in the General Meeting of the Company on resolutions placed before the Company which directly affect the rights attached to his preference shares.
(iv) Rights, preferences and restrictions attached to 0.01% Fully and Compulsorily Convertible Non-Cumulative, Non Participatory Preference shares:
(a) The Preference Shares shall be automatically and mandatorily converted into equity shares on 21st March, 2019 (“Mandatory Conversion Date”) i.e. on the expiry of Five year from the Issue date.
(b) On Mandatory Conversion Date, the Preference Shares shall be converted into such number of equity shares of the Company at the price of ` 132 per Equity shares (consisting of par of ` 10 and a premium of ` 122).
(c) The Preference Shares shall be entitled to fixed non-cumulative preferential dividend at the fixed rate of 0.01% per annum which shall be paid in priority to the holder of any other class of shares.
(d) On return of capital on a liquidation or otherwise of the assets of the Company, the holder of Preference Shares shall be entitled, in priority to any payment to the holders of any other class of shares, to be repaid a sum equal to the capital paid up or credited as paid up on the Preference Shares held by it.
(e) Every member of the Company holding preference shares has a right to vote in the General Meeting of the Company on resolutions placed before the Company which directly affect the rights attached to his preference shares.

109
Consolidated finanCial statement of afCons infrastruCture limited and its subsidiaries, assoCiates and joint ventures (afCons group)
Notes forming part of the consolidated financial statements for the year ended 31st March, 2017Note 12. Share Capital (Contd.)
(v) Details of shares held by the holding company, the ultimate holding company, their subsidiaries and associates:Particulars As at 31st March, 2017 As at 31st March, 2016 As at 1st April, 2015
Equity Shares
0.01% Non Cumulative
and Non Profit
Participatory Convertible Preference
Shares
0.01% Fully and
Compulsorily Convertible
Non-Cumulative
Non Participatory Preference
shares
Equity Shares
0.01% Non Cumulative
and Non Profit
Participatory Convertible Preference
Shares
0.01% Fully and
Compulsorily Convertible
Non-Cumulative
Non Participatory Preference
shares
Equity Shares
0.01% Non Cumulative
and Non Profit
Participatory Convertible Preference
Shares
0.01% Fully and
Compulsorily Convertible
Non-Cumulative
Non Participatory Preference
sharesNumber of shares Number of shares Number of shares
Shapoorji Pallonji & Co.Pvt.Ltd., the holding company 4,90,53,819 - 10,00,00,000 4,90,26,389 - 10,00,00,000 4,90,09,022 - 10,00,00,000Subsidiaries of the holding company:Floreat Investments Limited (FIL) 1,30,15,929 10,00,00,000 - 1,30,15,929 10,00,00,000 - 1,30,15,929 10,00,00,000 -Renaissance Commerce Pvt. Limited 40,16,250 - - 40,16,250 - - 40,16,250 - -Hermes Commerce Ltd 40,16,250 - - 40,16,250 - - 40,16,250 - -
(vi) Details of shares held by each shareholder holding more than 5% of shares of the Company:Class of shares / Name of shareholder As at 31st March, 2017 As at 31st March, 2016 As at 1st April, 2015
Number of shares held
% holding Number of shares held
% holding Number of shares held
% holding
Equity sharesShapoorji Pallonji & Co. Pvt. Ltd 4,90,53,819 68.16 4,90,26,389 68.12 4,90,09,022 68.10Floreat Investments Limited 1,30,15,929 18.09 1,30,15,929 18.09 1,30,15,929 18.09Renaissance Commerce Pvt. Ltd 40,16,250 5.58 40,16,250 5.58 40,16,250 5.58Hermes Commerce Ltd. 40,16,250 5.58 40,16,250 5.58 40,16,250 5.580.01% Non Cumulative and Non Profit Participatory Convertible Preference SharesFloreat Investments Limited 10,00,00,000 100.00 10,00,00,000 100.00 10,00,00,000 100.000.01% Fully and Compulsorily Convertible Non-Cumulative Non Participatory Preference sharesGoswami Infratech Private Ltd. 25,00,00,000 100.00 25,00,00,000 100.00 25,00,00,000 100.000.01% Fully and Compulsorily Convertible Non-Cumulative Non Participatory Preference sharesShapoorji Pallonji & Co.Pvt.Ltd. 10,00,00,000 100.00 10,00,00,000 100.00 10,00,00,000 100.00

110
Consolidated finanCial statement of afCons infrastruCture limited and its subsidiaries, assoCiates and joint ventures (afCons group)
Notes forming part of the consolidated financial statements for the year ended 31st March, 2017
Note 13. Other Equity ` in CroresParticulars As at
31st March, 2017As at
31st March, 2016As at
1st April, 2015Capital Reserve 0.84 0.84 0.84 Capital Redemption Reserve 0.13 0.13 0.13 Securities Premium Account 10.28 10.28 10.28 Contingencies Reserve 8.00 8.00 8.00 Debenture Redemption Reserve 42.50 44.57 25.40 General Reserve 66.04 66.04 66.04 Foreign Currency Translation Reserve (5.28) 0.37 - Retained Earnings 967.89 841.29 809.79 Reserve for Equity Instruments through other comprehensive income 11.57 14.94 16.32
Total 1,101.97 986.46 936.80
(i) Movement in other equity: ` in CroresParticulars As at 31st March, 2017 As at 31st March, 2016
(a) Capital reserve Opening balance 0.84 0.84 Closing balance 0.84 0.84
(b) Capital redemption reserve Opening balance 0.13 0.13 Closing balance 0.13 0.13
(c) Securities premium account Opening balance 10.28 10.28 Closing balance 10.28 10.28
(d) Contingencies reserve Opening balance 8.00 8.00 Closing balance 8.00 8.00
(e) Debenture redemption reserve Opening balance 44.57 25.40 Add : Transferred from surplus in Statement of Profit and Loss (2.07) 19.17 Closing balance 42.50 44.57
(f) General reserve Opening balance 66.04 66.04 Closing balance 66.04 66.04
(g) Foreign Currency translation Reserve Opening balance 0.37 - Add : Effect of foreign exchange rate variations during the year (5.65) 0.37 Closing balance (5.28) 0.37
(h) Retained earnings Opening balance 841.29 809.79 Add: Profit for the year 154.23 78.59 Add: Other items classified to other comprehensive income (3.66) (1.88) Less: Appropriations
Interim Dividend on Equity Shares(` 3.00 per share) (Previous Year ` 3.00 per share)
21.59 21.59
Dividend on Preference Shares(` 0.001 per Share) (Previous Year ` 0.001 per share)
0.05 0.05
Tax on Dividend 4.40 4.40Transferred (from) / to Debenture redemption reserve (2.07) 19.17
Closing balance 967.89 841.29
(i) Reserve for Equity Instruments through other comprehensive income Opening balance 14.94 16.32 Net fair value gain on investments in equity instruments at FVTOCI (3.37) (1.38) Closing balance 11.57 14.94
Total 1,101.97 986.46

111
Consolidated finanCial statement of afCons infrastruCture limited and its subsidiaries, assoCiates and joint ventures (afCons group)
Notes forming part of the consolidated financial statements for the year ended 31st March, 2017
Note 13. Other Equity (Contd.)(ii) Nature and purpose of each reserve within Other equityCapital ReserveThe capital reserve is on account of acquisition of subsidiary companies.Capital Redemption ReserveAs per the provisions of Companies Act, Capital Redemption Reserve is created out of the general reserve for the amount equivalent to the paid up capital of shares bought back by the Company.Securities premium accountWhere company issued shares at a premium, a sum equal to the aggregate amount of the premium received on those shares shall be transferred to a “securities premium account” as per the provisions of applicable Companies Act. This reserve is utilized as per the provisions of the Companies Act.Contingencies reserveThe Contingency Reserve was created to protect against loss for amounts due from a Partnership firm.Debenture redemption reserveThe Companies Act requires that where a company issues debentures, it shall create a debenture redemption reserve out of profits of the company available for payment of dividend. The amounts credited to the debenture redemption reserve may not be utilized by the company except to redeem debenturesGeneral reserveThe general reserve is used from time to time to transfer profits from retained earnings for appropriation purposes. There is no policy of regular transfer. As the general reserve is created by a transfer from one component of equity to another and is not an item of other comprehensive income, items included in the general reserve will not be reclassified subsequently to profit or loss.Foreign currency translation reserveExchange differences relating to the translation of the results and net assets of the Group’s foreign operations from their functional currencies to the Group’s presentation currency (i.e. `) are recognised directly in other comprehensive income and accumulated in the foreign currency translation reserve. The cumulative amount is reclassified to profit or loss when the net investment is disposed-off.Retained earning and dividend on equity sharesThis represent the surplus/ (deficit) of the profit or loss. The amount that can be distributed by the Company to its equity shareholders is determined considering the requirements of the Companies Act, 2013. Thus, the amount reported above are not distributable in entirety.On 22nd March, 2017, an interim dividend of ` 3.00 per share (total dividend ` 21.59 Crores) was paid to holders of fully paid equity shares.Reserve for equity instrument through other comprehensive incomeThis reserve represents the cumulative gains and losses arising on the revaluation of equity instruments measured at fair value through other comprehensive income. The group transfers amounts from this reserve to retained earnings when the relevant equity securities are derecognized.
Note 14. Non Current Borrowings ` in CroresParticulars As at 31st March, 2017 As at 31st March, 2016 As at 1st April, 2015
Measured at amortised cost(a) Debentures (Unsecured) (Refer Note A) 400.00 300.00 200.00(b) Working Capital loans (Refer note (i) of B)
From banks Secured 50.00 200.00 150.00
(c) Equipment Loan (Secured) (Refer vote (ii) of B)From banks
Rupee Loan 307.00 280.00 105.15 Foreign Currency Loan 58.37 72.88 154.36
(d) Other loans and advances (Refer note (iii) of B)Foreign Currency Loan (Secured)
Buyers Credit from Banks 15.83 4.77 14.91Total 831.20 857.65 624.42
Notes:(A) Details of Debentures ` in Crores
Particulars Terms of repayment As at 31st March, 2017 As at 31st March, 2016 As at 1st April, 2015Secured Unsecured Secured Unsecured Secured Unsecured
Unsecured, Redeemable, Unlisted, Non-Convertible Debentures (NCDs)i) 10.45% NCDs Refer Note (i) below - - - 100.00 - 100.00ii) 9.99% NCDs Refer Note (ii) below - 50.00 - 50.00 - 50.00iii) 9.87% NCDs Refer Note (iii) below - 50.00 - 50.00 - 50.00iv) 9.05% NCDs Refer Note (iv) below - 100.00 - 100.00 - -v) 8.60% NCDs Refer Note (v) below - 100.00 - - - -vi) 8.65% NCDs Refer Note (vi) below - 100.00 - - - -Total Non-Convertible Debentures - 400.00 - 300.00 - 200.00

112
Consolidated finanCial statement of afCons infrastruCture limited and its subsidiaries, assoCiates and joint ventures (afCons group)
Notes forming part of the consolidated financial statements for the year ended 31st March, 2017Note 14. Non Current Borrowings (Contd.)
Notes:(i) The NCDs carry interest @ 10.45% per annum payable quarterly and are redeemable in full at the end of 5 years from the date of issue
i.e. on 12th February, 2018. The NCDs carry a Put option to the holders and a Call option to the Company to get the NCDs redeemed at any time after 31/2 years from the date of allotment i.e. 12th August, 2016, by giving a 30 days notice to the other party.
(ii) The NCDs carry interest @ 9.99% per annum payable annually and are redeemable in full at the end of 3 years and 40 days from the date of allotment i.e. on 26th April, 2018.
(iii) The NCDs carry interest @ 9.87% per annum payable semi annually and are redeemable in full at the end of 5 years and 20 days from the date of allotment i.e. on 6th April, 2020.
(iv) The NCDs carry interest @ 9.05% per annum payable semi annually and are redeemable in full at the end of 5 years from the date of allotment i.e. 15th January, 2021. The NCDs carry a Put option to the holders and Call option to the Company to get the NCDs redeemed at any time after 3 years 3 months and 16 days from the date of allotment i.e. on 30th April, 2019, by giving 30 days notice to the other party.
(v) The NCDs carry interest @ 8.60% per annum payable annually and are redeemable in full at the end of 5 years from the date of issue i.e. on 6th September, 2021.
(vi) The NCDs carry interest @ 8.65% per annum payable annually and are redeemable in full at the end of 5 years from the date of issue i.e. on 23rd February, 2022.
(B) Details of terms of repayment of long-term borrowings from Banks and security provided in respect thereof: ` in CroresParticulars Terms of
repayment and security
As at 31st March, 2017 As at 31st March, 2016 As at 1st April, 2015Secured Unsecured Secured Unsecured Secured Unsecured
(i) Working Capital loans from banksAxis Bank Ltd. Refer
Note (ii) below
- - 100.00 - - -State Bank of India (Refer Note (i) below)
50.00 - 100.00 - 150.00 -
Total - Term Loan 50.00 - 200.00 - 150.00 -(ii) Equipment Loan from banksRupee Loan:
Refer Note (iii) below
Indian Overseas Bank - - - - 5.15 -Axis Bank 100.00 - - - - -State Bank of India 207.00 - 280.00 - 100.00 -Foreign Currency Loan (ECB):DBS Bank Ltd - - - - 37.42 -HSBC Bank - - - - 37.42 -Societe Generale 58.37 - 72.88 - 79.52 -Total - Equipment Loan 365.37 - 352.88 - 259.51 -(iii) Other Loans and Advances from banks - Buyer's Credit Foreign Currency LoansState Bank of India
Refer Note (iv)
below
- - - - 14.91 -Yes Bank 7.36 - 4.77 - - -Axis Bank 5.65 - - - - -Kotak Mahindra Bank 2.82 - - - - -
Total - Other loans and advances 15.83 - 4.77 - 14.91 -Total Long-term Borrowings from Banks 431.20 - 557.65 - 424.42 -
(i) Working Capital loan from State Bank of India is secured by second charge on Plant and Machinery.(ii) Working Capital loans from Banks carry interest ranging from 9.75% to 9.95% per annum. The repayment schedule of the loans are
as follows.
As at 31st March, 2017 ` in CroresBank Name Loan Amount Repayment in 2018-19 Repayment in 2019-20State Bank of India 50.00 1 installment of 25.00 1 installment of 25.00
As at 31st March, 2016 ` in CroresBank Name Loan Amount Repayment in 2017-18 Repayment in 2018-19 Repayment in 2019-20Axis Bank Ltd. 100.00 - 1 installment of 100.00 -State Bank of India 100.00 2 installments of 25.00
each 1 installment of 25.00 1 installment of 25.00
As at 1st April, 2015 ` in CroresBank Name Loan Amount Repayment
in 2016-17Repayment in 2017-18
Repayment in 2018-19
Repayment in 2019-20
State Bank of India 150.00 2 installments of 25.00 each
2 installments of 25.00 each
1 installment of 25.00
1 installment of 25.00

113
Consolidated finanCial statement of afCons infrastruCture limited and its subsidiaries, assoCiates and joint ventures (afCons group)
Notes forming part of the consolidated financial statements for the year ended 31st March, 2017Note 14. Non Current Borrowings (Contd.)(iii) Secured by first pari passu charge on Plant & Machinery. The Rupee loan of Axis Bank Ltd. carry interest @ 8.75% per annum and
State Bank of India carry interest ranging from 9.90% to 9.95% per annum. Foreign currency loans carry interest @ 3.95% per annum. The repayment schedule of the loans are as follows.
As at 31st March, 2017 ` in CroresBank Name Loan
AmountRepayment in 2018-19
Repayment in 2019-20
Repayment in 2020-21
Repayment in 2021-22
Repayment in 2022-23
Repayment in 2023-24
Rupee Loan:Axis Bank Ltd. 100.00 - 1 installment
of 20.00 1 installment
of 20.00 1 installment
of 20.00 1 installment
of 20.00 1 installment
of 20.00State Bank of India 207.00 1 Installment
of 20.00 and2 installments of 16.67 each
1 Installment of 20.00 and
2 installments of 16.67 each
1 Installment of 0.33 and
2 installments of 16.66 each
Installments of 16.66 and
16.67
2 Installments of 16.67 each
Foreign Currency Loan:Societe Generale 58.37 2 Installments
of9.73 each
2 Installments of
9.73 each
Installments of
9.73 and 9.72
As at 31st March, 2016 ` in CroresBank Name Loan
AmountRepayment in 2017-18
Repayment in 2018-19
Repayment in 2019-20
Repayment in 2020-21
Repayment in 2021-22
Repayment in 2022-23
Rupee Loan:State Bank of India 280.00 Installments
of 20.00 and 33.33
Installments of 20.00 and
33.33
Installments of 20.00 and
33.33
Installments of 20.00 and
33.33
1 installment of 33.33
1 installment of 33.35
Foreign Currency Loan:Societe Generale 72.88 2 installments
of 6.63 each 2 installments
of 9.94 each 2 installments
of 9.94 each 2 installments
of 9.93 each
As at 1st April, 2015 ` in CroresBank Name Loan Amount Repayment in
2016-17Repayment in 2017-18
Repayment in 2018-19
Repayment in 2019-20
Repayment in 2020-21
Rupee Loan:Indian Overseas Bank 5.15 1 installment
of 5.15 - - - -
State Bank of India 100.00 1 installment of 20.00
1 installment of 20.00
1 installment of 20.00
1 installment of 20.00
1 installment of 20.00
Foreign Currency Loan:DBS Bank Ltd 37.42 Installments of
12.47,12.47 &12.48
- - - -
HSBC Bank 37.42 2 installments of 18.71 each
- - - -
Societe Generale 79.52 Installments of4.68 and 6.24
2 installments of 6.24 each
2 installments of 9.35 each
2 installments of 9.35 each
2 installments of 9.36 each
(iv) The Loans carry interest ranging from 1.88% to 1.99% per annum. Secured by first charge by way of equitable mortgage on the Immovable properties of the company situated at Andheri, Mumbai on a
pari passu basis. Company’s stock of construction material, stores, WIP, Book Debt is further secured under Indenture of Mortgage and first charge on movable plant & machinery of the company upto 50% of the Fund based limits with other term lenders on pari passu basis and also by goods covered under Letters of Credit.
The repayment schedule of the loans are as follows:
As at 31st March, 2017 ` in CroresBank Name Loan Amount Repayment in 2018-19 Repayment in 2019-20Yes Bank 7.36 4.67 2.69Axis Bank 5.65 2.84 2.81Kotak Mahindra Bank 2.82 - 2.82
As at 31st March, 2016 ` in CroresBank Name Loan Amount Repayment in 2018-19Yes Bank 4.77 4.77
As at 1st April, 2015 ` in CroresBank Name Loan Amount Repayment in 2016-17State Bank of India 14.91 Installments of 1.57,1.57,1.99,4.20 and 5.58

114
Consolidated finanCial statement of afCons infrastruCture limited and its subsidiaries, assoCiates and joint ventures (afCons group)
Notes forming part of the consolidated financial statements for the year ended 31st March, 2017
Note 15. Trade Payables ` in CroresParticulars As at 31st March, 2017 As at 31st March, 2016 As at 1st April, 2015
Current Non Current Current Non Current Current Non CurrentTrade Payables for goods and services 1,487.15 147.85 1,276.61 100.61 1,022.90 65.13
Total 1,487.15 147.85 1,276.61 100.61 1,022.90 65.13
Note 16. Other Financial Liabilities ` in CroresParticulars As at 31st March, 2017 As at 31st March, 2016 As at 1st April, 2015
Current Non Current Current Non Current Current Non Current(a) Current maturities of long-term debt (Refer Note below) 116.30 - 182.28 - 268.02 -(b) Interest accrued but not due on borrowings 8.97 - 5.85 - 2.90 -(c) Unclaimed / unpaid dividends 0.54 - 0.53 - 0.27 -(d) Unpaid matured deposits and interest accrued thereon - - - - 0.01 -(e) Interest accrued on advance from customers 10.90 - 11.32 - 5.51 -(f) Other payables
(i) Trade / security deposits received 36.73 - 22.80 - 1.53 -(ii) Amount received on invocation of Bank Guarantees 63.65 - 68.32 - 68.73 -(iii) Distribution of profit payable to member of JV - 0.01 - 0.01 - 0.01(iv) Others 17.14 - 11.80 - 27.95 -
117.52 0.01 102.92 0.01 98.21 0.01
Total 254.23 0.01 302.90 0.01 374.92 0.01
Note: ` in CroresParticulars As at 31st March, 2017 As at 31st March, 2016 As at 1st April, 2015
Current Non Current Current Non Current Current Non Current(a) Working Capital Loans from Banks (Secured)
50.00 - 50.00 - 125.00 -
(b) Equipment Loans from Banks (Secured) 53.33 - 116.24 - 134.08 -(c) Foreign Currency Loans (Secured) 12.97 - 16.04 - 8.94 -
Total 116.30 - 182.28 - 268.02 -
Note 17. Current Tax and Deferred Tax
(a) Income Tax Expense ` in CroresParticulars As at 31st March, 2017 As at 31st March, 2016
Current Tax:Current Income Tax Charge 27.08 46.72Adjustments in respect of prior years 0.32 0.23Deferred Tax:In respect of current year origination and reversal of temporary differences 26.75 21.24Adjustments in respect prior years - 1.76Total Tax Expense recognised in profit and loss account 54.15 69.95

115
Consolidated finanCial statement of afCons infrastruCture limited and its subsidiaries, assoCiates and joint ventures (afCons group)
Notes forming part of the consolidated financial statements for the year ended 31st March, 2017
Note 17. Current Tax and Deferred Tax (Contd.)
(b) Numerical Reconciliation between average effective tax rate and applicable tax rate : ` in Crores
ParticularsAs at 31st March, 2017 As at 31st March, 2016
Amount Tax Rate Amount Tax RateProfit Before tax from Continuing Operations 206.85 147.82Income Tax using the Company's domestic Tax rate 34.608% 71.59 34.61% 51.16 34.61%Non taxable income (0.81) -0.39% (0.66) -0.45%Loss in respect of which deferred tax assets not recognised due to uncertainty 0.47 0.23% 14.96 10.12%Disallowable expenses 1.59 0.77% 2.12 1.43%Utilisation of tax losses (3.39) -1.64% (8.39) -5.68%Effects of tax rates differences of entities operating in other jurisdictions / having different tax rates (16.28) -7.87% 4.95 3.35%Charge / (credit) in respect of previous years 0.32 0.15% 1.99 1.35%Others 0.66 0.32% 3.82 2.58%Income Tax recognised In P&L from Continuing Operations (Effective Tax Rate) 54.15 26.18% 69.95 47.32%
# The tax rate used for the reconciliation above is the corporate tax rate of 30%, surcharge of 12% on corporate tax, education cess 2% and secondary and higher education cess of 1% on corporate tax.
(c) Movement of Deferred Tax ` in Crores
ParticularsFor the Year ended 31st March 2017
Opening Balance
Recognised in profit and Loss
Recognised in OCI
Closing Balance
Tax effect of items constituting deferred tax liabilities Property, Plant and Equipment 88.30 8.69 96.99 Unremitted earnings of Subsidiaries - 15.34 15.34 Arbitration awards 109.67 16.07 125.74 FVTPL financial asset 0.03 0.04 0.07
198.00 40.14 - 238.14Tax effect of items constituting deferred tax assets Employee Benefits (6.64) (2.99) (1.94) (11.57) Expected Credit Loss (1.30) 0.05 (1.25) Provisions (7.59) 1.12 (6.47) Other Items (1.73) (1.18) (2.91) Minimum Alternate Tax Credit (65.19) (10.39) (75.58)
(82.45) (13.39) (1.94) (97.78)Net Tax (Asset) / Liabilities 115.55 26.75 (1.94) 140.36
` in Crores
ParticularsFor the Year ended 31st March 2016
Opening Balance
Recognised in profit and Loss
Recognised in OCI
Closing Balance
Tax effect of items constituting deferred tax liabilities Property, Plant and Equipment 85.50 2.80 88.30 Arbitration awards 97.55 12.12 109.67 FVTPL financial asset 0.01 0.02 0.03
183.06 14.94 - 198.00Tax effect of items constituting deferred tax assets Employee Benefits (4.87) (0.78) (0.99) (6.64) Expected Credit Loss (1.88) 0.58 (1.30) Provisions (7.15) (0.44) (7.59) Carryforward Tax Loss (8.59) 8.59 - Minimum Alternate Tax Credit (66.95) 1.76 (65.19) Other Items (0.08) (1.65) (1.73)
(89.52) 8.06 (0.99) (82.45)Net Tax (Asset) / Liabilities 93.54 23.00 (0.99) 115.55The Group has not recognised any deferred tax liabilities for taxes that would be payable on the Group’s share in unremitted earnings of certain of its subsidiaries because the Group controls when the liability will be incurred and it is probable that the liability will not be incurred in the foreseeable future. The amount of unremitted earnings was ` 72.41 Crores, ` 70.18 Crores and ` 66.86 Crores as at 31st March, 2017, 31st March, 2016 and 1st April 2015 respectively.

116
Consolidated finanCial statement of afCons infrastruCture limited and its subsidiaries, assoCiates and joint ventures (afCons group)
Notes forming part of the consolidated financial statements for the year ended 31st March, 2017
Note 18. Other non-current & current liabilities ` in CroresParticulars As at 31st March, 2017 As at 31st March, 2016 As at 1st April, 2015
Current Non Current Current Non Current Current Non Current(a) Advances from customers 1,061.01 523.01 1,432.23 193.88 1,006.87 372.91
(b) Advance against sale of scrap 1.06 - 1.27 - 1.66 -(c) Other payables
(i) Statutory remittances (VAT, Service Tax, etc.) 47.05 - 22.69 - 29.56 0.23
Total 1,109.12 523.01 1,456.19 193.88 1,038.09 373.14
Note 19. Provisions ` in CroresParticulars As at 31st March, 2017 As at 31st March, 2016 As at 1st April, 2015
Current Non Current Current Non Current Current Non Current(a) Provision for employee benefits: (i) Provision for compensated absences 17.99 - 9.02 - 7.40 - (ii) Provision for gratuity (net) 6.48 8.99 5.07 5.11 4.77 1.92
24.47 8.99 14.09 5.11 12.17 1.92(b) Provision - Others: (i) Provision for projected loss on contract - - 4.46 - 4.97 - (ii) Tax on dividend on equity shares - - - - 2.16 -
- - 4.46 - 7.13 -
Total 24.47 8.99 18.55 5.11 19.30 1.92(i) The provision for employee benefits includes annual leave and vested long service leave entitlements accrued, gratuity and ex-gratia.(ii) The Provision for projected loss created for Projects - 1) Package CC-15 - Design and Construction of Elevated Viaduct and
construction of six Elevated Stations of phase-III for Delhi MRTS, 2) Package CC-29 - Part Design and Construction of Elevated Viaduct and Construction of 2 Elevated Stations of line - 8 of phase-III for Delhi MRTS.
Note 20. Current tax liabilities (net) ` in CroresParticulars As at
31st March, 2017As at
31st March, 2016As at
1st April, 2015Provision for tax (net of advance tax ` 12.40 Crores)(As at 31st March, 2016 ` 19.15 Crores; As at 1st April, 2015 ` 20.14 Crores) 13.34 25.40 10.11
Total 13.34 25.40 10.11
Note 21. Current Borrowings ` in CroresParticulars As at
31st March, 2017As at
31st March, 2016As at
1st April, 2015(a) Working Capital Demand Loans from banks Secured (Refer note below) 100.00 249.00 168.30 Unsecured 75.00 - 49.50
175.00 249.00 217.80(b) Short term Loans from Bank Foreign Currency Loan: Buyers Credit (Secured) (Refer note below) - 16.70 - Packing Credit Finance: Secured (Refer note below) - 66.25 - Unsecured - - 9.36
- 82.95 9.36(c) Cash Credit Facility from Banks Secured (Refer note below) 509.79 346.19 295.05 Unsecured 0.01 - -(d) Commercial Papers (Unsecured) From Banks 49.49 18.70 46.29 From Other parties 273.11 292.61 295.83(e) Acceptances 60.58 30.57 50.91
Total 1,067.98 1,020.02 915.24

117
Consolidated finanCial statement of afCons infrastruCture limited and its subsidiaries, assoCiates and joint ventures (afCons group)
Notes forming part of the consolidated financial statements for the year ended 31st March, 2017
Note 21. Current Borrowings (Contd.)
Note:
Details of security for the secured short-term borrowings: ` in Crores Particulars Terms of security As at
31st March, 2017As at
31st March, 2016As at
1st April, 2015Working Capital Demand Loans (WCDL) From banks: ING Vysya Bank
Refer Note below
- - 118.30 IDBI Bank Ltd. - - 50.00 BNP Paribas - 50.00 - Export Import Bank of India 100.00 199.00 -
100.00 249.00 168.30Short Term Loans from Bank Foreign Currency Loan: Buyers Credit
Yes Bank Ltd. (US$) Refer Note below - 16.70 - Packing Credit Finance:
State Bank of India Refer Note below - 66.25 -Cash Credit Facility Refer Note below 509.79 346.19 295.05Note: Secured by first charge by way of equitable mortgage on the Immovable properties of the company situated at Andheri, Mumbai on a pari passu basis. Company’s stock of construction material, stores, WIP, Book Debt is further secured under Indenture of Mortgage and first charge on movable plant & machinery of the company upto 50% of the Fund based limits with other term lenders on pari passu basis. Cash credit facility / Working Capital Demand Loan is further secured by the Company’s proportionate share of Current Assets in all the Joint Ventures both present and future. Cash Credit Facility and Working Capital Demand Loan from Banks carry interest ranging from 7.50% to 11.00% per annum (as on 31st March, 2016 interest ranging from 9.00% to 12.25% per annum and as on 1st April, 2015 interest ranging from 10.15% to 13.65% per annum) Commercial Paper carry interest ranging from 6.50% to 8.21% per annum (as on 31st March, 2016 interest ranging from 8.95% to 9.30% per annum and as on 1st April,2015 interest ranging from 9.00% to 10.13% per annum). Acceptances carry interest @ 10.20% per annum (as on 31st March, 2016 @ 10.35% per annum and as on 1st April, 2015 @ 11.65% per annum). Buyers Credit Interest ranges from 1.29% to 1.35% per annum as on 31st March, 2016. PCFC carry interest @ 0.97% per annum as on 31st March, 2016 and 1.06% per annum as on 1st April, 2015.
Note 22. Revenue from operations ` in CroresParticulars For the year ended
31st March, 2017For the year ended
31st March, 2016(a) Revenue from sale of goods (including excise duty, if any)
(Refer Note (i) below) 0.14 1.74
(b) Construction contract revenue (Refer Note (ii) below) 6,288.00 4,275.04(c) Other operating income (Refer Note (iii) below) 16.68 60.03
Total 6,304.82 4,336.81
Note Particulars For the year ended31st March, 2017
For the year ended31st March, 2016
(i) Revenue from sale of goods comprises:Construction Materials 0.14 1.74
Total - Sale of products 0.14 1.74(ii) Construction contract revenue comprises:
Construction Revenue 6,525.11 4,422.01Less : Value added tax 237.11 146.97
Total - Sale of services 6,288.00 4,275.04(iii) Other operating income comprises:
Sale of scrap 9.95 13.71Duty Scrip credit - 26.33Equipment Hire Charges 1.22 2.54Consultancy Service Charges 0.36 6.52Others 5.15 10.93
Total - Other operating revenues 16.68 60.03

118
Consolidated finanCial statement of afCons infrastruCture limited and its subsidiaries, assoCiates and joint ventures (afCons group)
Notes forming part of the consolidated financial statements for the year ended 31st March, 2017
Note 23. Other income ` in Crores
Particulars For the year ended31st March, 2017
For the year ended31st March, 2016
(a) Interest income on financial assets at amortised cost (Refer Note (i) below) 58.98 97.75(b) Dividend income:
From non trade, on current investments** 2.22 1.80(c) Other non operating income (Refer Note (ii) below) 39.53 37.75(d) Fair value gain on financial assets mandatorily measured at FVTPL 0.17 0.07
Total 100.90 137.37** All dividends from equity instruments designated as FVOCI for both years relate to investments held at the end of each reporting period.
Note Particulars For the year ended31st March, 2017
For the year ended31st March, 2016
(i) Interest income comprises:Interest from banks deposits 0.38 2.22Interest on loans and advances 6.94 4.47Interest on Arbitration awards 43.36 89.58Interest income from non current investments 0.01 0.01Interest on income tax refund 7.74 1.47Other Interest 0.55 -
Total - Interest income 58.98 97.75(ii) Other non operating income comprises:
Provision for doubtful debtors / advances no longer required written back 0.44 3.20Creditors / Excess provision written back 1.97 7.75Insurance Claim received 15.87 15.05Provision for Projected Loss written back 4.46 4.97Net Gain on foreign currency transactions and translation 11.24 1.53Reversal of expected credit loss on financial assets 0.13 1.78Miscellaneous income 5.42 3.47
Total - Other non-operating income 39.53 37.75
Note 24. Cost of construction ` in Crores
Particulars For the year ended31st March, 2017
For the year ended31st March, 2016
Cost of Construction Materials consumed (Including Bought out Items) 2,170.85 1,269.00Other Construction Expenses: Stores and spare consumed 511.24 361.87 Subcontracting expenses (Including lease payment for equipments hired) 1,200.86 916.94 Site Installation 59.43 34.38 Technical Consultancy 126.04 56.82 Power and fuel consumed 295.65 168.17 Freight and handling charges 86.10 100.73
2,279.32 1,638.91
Total 4,450.17 2,907.91
Note 25. Employee benefits expense ` in CroresParticulars For the year ended
31st March, 2017For the year ended
31st March, 2016Salaries and wages, including bonus 601.94 473.39Contributions to provident and other funds 39.82 27.82Staff welfare expenses 32.03 21.93
Total 673.79 523.14

119
Consolidated finanCial statement of afCons infrastruCture limited and its subsidiaries, assoCiates and joint ventures (afCons group)
Notes forming part of the consolidated financial statements for the year ended 31st March, 2017
Note 26. Finance costs ` in Crores
Particulars For the year ended31st March, 2017
For the year ended31st March, 2016
Interest expense on: (Refer note below) Bank overdrafts and loans 220.38 206.96 Advances from related parties 0.23 0.29 Advance from clients 46.74 34.21 Others 3.13 4.14
270.48 245.60Less: Amounts included in the cost of qualifying assets - -
270.48 245.60Interest expenses on delayed / deferred payment of income tax 0.76 1.49Other borrowing costs:
Bank Guarantee Commission including Bank Charges 29.12 21.43L/c charges & Processing Fees 1.87 1.76
Total 302.23 270.28
Note:
Particulars For the year ended31st March, 2017
For the year ended31st March, 2016
Interest expense: On financial liability at amortised cost 270.48 245.60 On financial liability at FVTPL - -
Total 270.48 245.60
Note 27. Depreciation and Amortisation Expenses ` in Crores
Particulars For the year ended31st March, 2017
For the year ended31st March, 2016
Depreciation and amortisation for the current year on tangible assets 167.36 153.69Depreciation and amortisation for the current year on intangible assets 1.26 2.06Depreciation and amortisation as per Statement of Profit and Loss 168.62 155.75
Note 28. Other expenses ` in Crores
Particulars For the year ended31st March, 2017
For the year ended31st March, 2016
Water and Electricity 8.11 6.38Rent 62.72 56.00Repairs and maintenance - Buildings 0.01 0.02Repairs and maintenance - Machinery 14.60 18.94Repairs and maintenance - Others 6.80 7.32Insurance charges 47.53 33.24Rates and taxes 150.08 126.15Communication 6.52 5.30Travelling and conveyance 71.15 51.75Security Charges 27.25 24.21Donations and contributions 0.96 1.20Expenditure on Corporate Social Responsibility (CSR) 0.13 0.19Legal and professional 137.65 56.82Auditors remuneration (refer note below) 1.10 1.15Advances written off 0.58 -Duty Scrip Written off - 0.25Bad/Irrecoverable Debtors/Unbilled Revenue written off 0.80 8.89Net loss on foreign currency transactions and translation 1.00 15.60Directors Fees 0.24 0.17Expected credit loss on financial assets 1.86 -Provision for projected loss on contract - 4.46Loss on sale of fixed assets 2.59 4.29Fair value Loss on financial assets measured at FVTPL - 0.01Hedging expenses 1.38 5.60Miscellaneous expenses 61.00 41.34
Total 604.06 469.28

120
Consolidated finanCial statement of afCons infrastruCture limited and its subsidiaries, assoCiates and joint ventures (afCons group)
Notes forming part of the consolidated financial statements for the year ended 31st March, 2017Note 28. Other expenses (Contd.)
Note: ` in CroresParticulars For the year ended
31st March, 2017For the year ended
31st March, 2016Auditors remuneration comprises *(a) To statutory auditors
As auditors - statutory audit 0.77 0.70 For taxation matters 0.03 0.10 For other services 0.16 0.18 Reimbursement of expenses 0.01 0.01 For Service tax 0.11 0.14
1.08 1.13(b) To cost auditors for cost audit
As auditors 0.02 0.02 0.02 0.02
Total (a + b) 1.10 1.15* Excludes payment of ` 0.80 Crores (Previous Year ` 0.25 Crores) for taxation matters to an affiliated firm / company of one of the joint auditors covered by a networking arrangement which is registered with The Institute of Chartered Accountants of India.
Note 29. Contingent liabilities and commitments (to the extent not provided for) ` in Crores Particulars As at
31st March, 2017As at
31st March, 2016(i) Contingent liabilities(a) Claims against the Company not acknowledged as debts
i) Differences with sub-contractors in regard to rates and quantity of materials. 72.73 71.89(b) Claims against the Joint Venture not acknowledged as debts
i) Differences with sub-contractors / clients in regard to scope of work. 97.24 99.45 The above claim is not accepted by the Joint Venture and is contested by the
Subcontractor / client. The Management is confident that the claim will be successfully contested.
(c) Guaranteesi) Bank Guarantees given on behalf of Subsidiaries and Joint Operations and
counter guaranteed by the Company. 1,545.10 1,379.93
ii) Labour Guarantees 1.16 0.21(d) Sales Tax and Entry Tax Represents demands raised by Sales Tax Authorities in matters of a) disallowance
of labour and service charges, consumables etc. b) Tax on AS7 Turnover c) Entry tax and d) Interest and Penalty etc. for which appeal is pending before various appellate authorities. The Company is confident that the cases will be successfully contested.
20.95 5.87
(e) Excise Duty Represents demands raised by Central Excise Department for Excisability of
girders. The Company is confident that the cases will be successfully contested. 0.66 0.66
(f) Service Tax Represents demand confirmed by the CESTAT / Asst. Commissioner of Service
Tax for a) disallowance of Cenvat Credit, since abatement claimed by the Company, b) disallowance of general exemption of private Transport terminals and c) taxability under "Commercial or Industrial Construction Service", etc. The Company has appealed / in the process of appeal against the said order with Commissioner of Service Tax Mumbai,CESTAT / High Court and is confident that the cases will be successfully contested. The company has received the stay order for some case from the CESTAT.Amount disclosed does not include penalties in certain matters for which amount is unascertainable.
167.03 125.16
Note:- In respect of items mentioned under Paragraphs (a), (b), (d), (e) and (f) above, till the matters are finally decided, the financial effect cannot be ascertained and future cashflows in respect of above matters are determinable only on receipts of judgements / decisions pending at various Forums / Authorities
(ii) Commitments Estimated amount of contracts remaining to be executed on capital account and
not provided for 15.01 25.13

121
Consolidated finanCial statement of afCons infrastruCture limited and its subsidiaries, assoCiates and joint ventures (afCons group)
Notes forming part of the consolidated financial statements for the year ended 31st March, 2017Note 30. Employee benefit plansDefined Contribution PlanThe total expense recognised in profit or loss of ̀ 36.25 Crores (for the year ended 31st March, 2016: ̀ 22.79 Crores) represents contributions payable to these plans by the Company at rates specified in the rules of the plans. As at 31st March, 2017, contributions of ` 3.71 Crores (as at 31st March, 2016: ` 3.13 Crores) due in respect of 2016-2017 (2015-2016) reporting period had not been paid over to the plans. The amounts were paid subsequent to the end of the respective reporting periods.Defined benefit plansThese plans typically expose the Group to actuarial risks such as: investment risk, interest rate risk, longevity risk and salary risk.Investment riskThe present value of the defined benefit plan liability is calculated using a discount rate which is determined by reference to market yields at the end of the reporting period on government bonds.Interest riskA decrease in the bond interest rate will increase the plan liability.Longevity riskThe present value of the defined benefit plan liability is calculated by reference to the best estimate of the mortality of plan participants both during and after their employment. An increase in the life expectancy of the plan participants will increase the plan’s liability.Salary riskThe present value of the defined benefit plan liability is calculated by reference to the future salaries of plan participants. As such, an increase in the salary of the plan participants will increase the plan’s liability.The risk relating to benefits to be paid to the dependents of plan members (widow and orphan benefits) is re-insured by an external insurance company.No other post-retirement benefits are provided to these employees.In respect of the plan, the most recent actuarial valuation of the present value of the defined benefit obligation were carried out as at 31st March, 2017 by M/s. K A.Pandit, Fellow of the Institute of Actuaries of India. The present value of the defined benefit obligation, and the related current service cost and past service cost, were measured using the projected unit credit method.The principle assumptions used for the purpose of actuarial valuation were as follows.
ParticularsValuation as at
31st March, 2017 31st March, 2016 1st April, 2015Discount rate 7.20% 8.04% 7.96%Expected rate(s) of salary increase (refer note 1) 6.00% 6.00% 4.50%
*Based on India’s standard mortality table with modification to reflect expected changes in mortality.Note 1: The Estimate of rate of escalation in salary considered in actuarial valuation takes into account inflation, seniority, promotion and other relevant factors including supply and demand in the employment market.Amount recognized in Consolidated statement of profit and loss in respect of these defined benefit plans are as follows. ` in Crores
ParticularsGratuity (Funded)
Year ended 31st March, 2017
Year ended 31st March, 2016
Service cost: Current service cost 1.94 1.60 Past service cost and (gain)/loss from settlements 0.69 -Net Interest cost 0.82 0.53Benefits Paid - -Components of defined benefit costs recognised in profit or loss 3.45 2.13
Remeasurement on the net defined benefit liability: ` in Crores
ParticularsGratuity (Funded)
Year ended 31st March, 2017
Year ended 31st March, 2016
Return on plan assets (excluding amounts included in net interest expense) 0.06 0.05Actuarial (gains) / losses arising from changes in demographic assumptions - (0.11)Actuarial (gains) / losses arising from changes in financial assumptions 2.42 2.13Actuarial (gains) / losses arising from experience adjustments 3.12 0.80Components of defined benefit costs recognised in other comprehensive income 5.60 2.87
The current service cost and the net interest expense for the year are included in the ‘Employee benefits expense’ line item in the consolidated statement of profit and loss.The remeasurement of the net defined benefit liability is included in other comprehensive income.

122
Consolidated finanCial statement of afCons infrastruCture limited and its subsidiaries, assoCiates and joint ventures (afCons group)
Notes forming part of the consolidated financial statements for the year ended 31st March, 2017
Note 30. Employee benefit plans (Contd.)Movements in the present value of the defined benefit obligation are as follows. ` in Crores
ParticularsGratuity (Funded)
Year ended 31st March, 2017
Year ended 31st March, 2016
Opening defined benefit obligation 20.77 17.40Current service cost 1.94 1.60Interest Cost 1.67 1.38Remeasurement (gains)/losses: Actuarial (gains) / losses arising from changes in demographic assumptions - (0.11) Actuarial (gains) / losses arising from changes in financial assumptions 2.42 2.13 Actuarial (gains) / losses arising from experience adjustments 3.12 0.80Past service cost, including losses/(gains) on curtailments 0.69 -Benefits paid (5.06) (2.43)Closing defined benefit obligation 25.55 20.77
Movements in the fair value of plan assets are as follows. ` in CroresParticulars Year ended
31st March, 2017Year ended
31st March, 2016Opening fair value of plan assets 10.58 10.71Interest income 0.85 0.85Remeasurement gain (loss): Return on plan assets (excluding amounts included in net interest expense) (0.06) (0.05) Others - -Contributions from the employer 3.76 1.50Benefits paid (5.06) (2.43)Closing fair value of plan assets 10.07 10.58
The Company pays premium to the group gratuity scheme of LICSignificant actuarial assumptions for the determination of the defined obligation are discount rate, expected salary increase and mortality. The sensitivity analysis below have been determined based on reasonably possible changes of the respective assumptions occurring at the end of the reporting period, while holding all other assumptions constant.1) If the discount rate is 100 basis points higher (lower), the defined benefit obligation would decrease by ` 2.05 Crores (increase by
` 2.41 Crores) (as at 31st March, 2016: decrease by ` 0.78 Crores (increase by ` 0.84 Crores)).2) If the expected salary growth increases (decreases) by 1%, the defined benefit obligation would increase by ` 2.41 Crores (decrease
by ` 2.09 Crores) (as at 31st March, 2016: increase by ` 0.85 Crores (decrease by ` 0.80 Crores)).3) If the life expectancy increases (decreases) by one year for both men and women, the defined benefit obligation would increase by
` 0.18 Crores (decrease by ` 0.21 Crores) (as at 31st March, 2016: increase by ` 0.13 Crores (decrease by ` 0.14 Crores)).The sensitivity analysis presented above may not be representative of the actual change in the defined benefit obligation as it is unlikely that the change in assumptions would occur in isolation of one another as some of the assumptions may be correlated.Furthermore, in presenting the above sensitivity analysis, the present value of the defined benefit obligation has been calculated using the projected unit credit method at the end of the reporting period, which is the same as that applied in calculating the defined benefit obligation liability recognised in the balance sheet.There was no change in the methods and assumptions used in preparing the sensitivity analysis from prior years.The average duration of the benefit obligation at 31st March, 2017 is 16 years (as at 31st March, 2016: 15 years).The Company expects to make a contribution of ` 6.48 Crores (as at 31st March, 2016: ` 5.07 Crores) to the defined benefit plans during the next financial year.Maturity profile of defined benefit obligation:Projected Benefits Payable in Future Years From the Date of Reporting
` in Crores1st Following Year 2.582nd Following Year 1.953rd Following Year 1.794th Following Year 1.835th Following Year 1.64Sum of Years 6 To 10 10.73

123
Consolidated finanCial statement of afCons infrastruCture limited and its subsidiaries, assoCiates and joint ventures (afCons group)
Notes forming part of the consolidated financial statements for the year ended 31st March, 2017
Note 31. Earnings per share (EPS)EPS is calculated by dividing the profit attributable to the equity shareholders by the weighted average number of equity shares outstanding during the year, as under :
ParticularsYear ended
31st March, 2017(`)
Year ended31st March, 2016
(`)
Basic earnings per shareFrom continuing operations 4.50 2.29Total basic earnings per share 4.50 2.29
ParticularsYear ended
31st March, 2017(`)
Year ended31st March, 2016
(`)
Diluted earnings per shareFrom continuing operations 4.50 2.29Total diluted earnings per share 4.50 2.29
Basic earnings per shareThe earnings and weighted average number of ordinary shares used in the calculation of basic earnings per share are as follows:
Particulars Year ended31st March, 2017
Year ended31st March, 2016
Profit / (loss) for the year attributable to owners of the Company - earnings used in calculation of basic earning per share (` in Crores)
152.70 77.87
Dividends paid on convertible non-participating preference shares (` in Crores) (0.05) (0.05)Earnings used in the calculation of basic earnings per share 152.65 77.82Profits used in the calculation of basic earnings per share from continuing operations (` in Crores) 152.65 77.82
Weighted average number of equity shares 339,546,898 339,546,898
The weighted average number of equity shares for the purpose of basic earnings per share is as follows:
ParticularsYear ended
31st March, 2017Year ended
31st March, 2016Number Number
Weighted average number of shares used in calculation of basic earnings per share 70,778,868 70,778,868Shares deemed to be issued for no consideration in respect of:- Convertible preference shares 268,768,030 268,768,030Weighted average number of shares used in calculation of basic earnings per share 339,546,898 339,546,898
Diluted earnings per shareThe earnings and weighted average number of ordinary shares used in the calculation of diluted earnings per share are as follows:
Particulars Year ended31st March, 2017
Year ended31st March, 2016
Profit / (loss) for the year attributable to owners of the Company - earnings used in calculation of basic earning per share (` in Crores)
152.65 77.82
Earnings used in the calculation of diluted earnings per share (` in Crores) 152.65 77.82Profits used in the calculation of diluted earnings per share from continuing operations (` in Crores) 152.65 77.82
The weighted average number of equity shares for the purpose of diluted earnings per share reconciles to the weighted average number of equity shares used in the calculation of basic earnings per share as follows:
ParticularsYear ended
31st March, 2017Year ended
31st March, 2016Number Number
Weighted average number of shares used in calculation of basic earnings per share 70,778,868 70,778,868Shares deemed to be issued for no consideration in respect of:
- Convertible preference shares 268,768,030 268,768,030
Weighted average number of shares used in calculation of diluted earnings per share 339,546,898 339,546,898

124
Consolidated finanCial statement of afCons infrastruCture limited and its subsidiaries, assoCiates and joint ventures (afCons group)
Note 32. Operating Lease ArrangementsThe group as lesseeLeasing arrangementsThe company has taken various offices, residential & godown premises, land and equipments under operating lease or leave and licence agreements. These are generally cancellable and range between 11 months and 3 years under leave and licence agreement and are renewable by mutual consent on mutually agreeable terms. The group does not have an option to purchase the leased assets at the expiry of the lease periods. ` in Crores
Particulars For the year ended31st March, 2017
For the year ended31st March, 2016
(i) Lease payments recognised for residential and other properties in the Statement of Profit and Loss under ‘Rent’ in Note 28. 62.72 56.00(ii) Lease payments for equipments are recognised in the Statement of Profit and Loss under 'Subcontracting Expenses' in Note 24. 256.33 174.16
Note 33. Disclosure on Specified Bank NotesDuring the year, the Company had Specified Bank Notes (SBN’s) or other denomination notes as defined in the MCA notification, G.S.R. 308 (E), dated 31st March, 2017. The details of SBN’s held and transacted during the period from 8th November, 2016 to 30th December, 2016, the denomination-wise SBN’s and other notes as per the notification are as follows: ` in Crores
Particulars SBNs Other denomination notes
Total
Closing Cash in hand as on 8th November, 2016 (includes imprest cash SBN ` 0.21 Crores and other denomination ` 0.46 Crores)
1.37 0.73 2.10
Add: Cash withdrawal from Bank - 1.08 1.08Less: Permitted payments 0.43 1.56 1.99Less: Amount deposited in Banks 0.94 0.01 0.95Closing cash in hand as on 30th December, 2016 - 0.24 0.24For the purpose of this clause, the term ‘Specified Bank Notes’ shall have the same meaning provided in the notification of the Government of India, in the Ministry of Finance, Department of Economic Affairs number S.O. 3407(E), dated 8th November, 2016.
Note 34. Related party disclosures(a) Details of related parties: Related Party where Control exists Holding Company
Shapoorji Pallonji & Co. Pvt. Ltd. Fellow Subsidiary(s)
Floreat Investments Limited Hermes Commerce Limited Renaissance Commerce Private Limited SP Jammu Udhampur Highway Private Limited Forvol International Services Limited Armada C-7 Pte Ltd. Shapoorji AECOS Construction Pvt. Ltd. Forbes & Company Ltd. Shapoorji Pallonji Qatar, WLL Eureka Forbes Ltd. Armada Madura EPC Limited Stertling & Wilson Pvt.Ltd. Shapoorji Pallonji Rural Solutions Pvt.Ltd. Forbes Facility Services Pvt.Ltd.
Joint Operations Transtonnelstroy-Afcons Joint Venture Afcons Gunanusa Joint Venture Dahej Standby Jetty Project Undertaking Afcons Pauling Joint Venture Strabag AG Afcons Joint Venture Saipem Afcons Joint Venture Ircon Afcons Joint Venture Afcons Sener LNG Construction Projects Pvt.Ltd. Afcons Sibmost Joint Venture (w.e.f. 3rd August, 2016) Afcons Vijeta PES Joint Venture (w.e.f. 25th May, 2016)
Key Management Personnel Mr. S. P. Mistry – Chairman Mr. K. Subrahmanian – Vice Chairman & Managing Director Mr. S. Paramasivan – Deputy Managing Director Mr. Giridhar Rajagopalan (w.e.f. 1st October, 2016) Mr. Akhil Kumar Gupta (w.e.f. 1st October, 2016)
Notes forming part of the consolidated financial statements for the year ended 31st March, 2017

125
Consolidated finanCial statement of afCons infrastruCture limited and its subsidiaries, assoCiates and joint ventures (afCons group)
Notes forming part of the consolidated financial statements for the year ended 31st March, 2017Note 34. Related party disclosures (Contd.)(b) Details of transactions with related parties for the period 01/04/2016 to 31/03/2017 ` in Crores
Nature of Transaction Holding Company(s) Fellow subsidiary(s) Joint Operation(s) Key Management Personnel
Total
CY PY 15-16 CY PY 15-16 CY PY 15-16 CY PY 15-16 CY PY 15-16Managerial Remunerationa) Short Term Employee Benefit - - - - - - 6.46 3.25 6.46 3.25b) Post Employment Benefits - - - - - - 0.78 0.24 0.78 0.24c) Other Long Term Benefits 0.63 0.35 0.63 0.35Sitting Fees paidS.P.Mistry - - - - - - 0.03 0.01 0.03 0.01Dividend on Preference SharesFloreat Investments Limited - - - 0.01 - - - - - 0.01Shapoorji Pallonji & Co. Pvt. Ltd. - 0.01 - - - - - - - 0.01Interim Dividend on Equity SharesShapoorji Pallonji & Co. Pvt. Ltd. 14.72 14.71 - - - - - - 14.72 14.71Floreat Investments Limited - - 3.90 3.90 - - - - 3.90 3.90Hermes Commerce Limited - - 1.20 1.20 - - - - 1.20 1.20Renaissance Commerce Private Ltd. - - 1.20 1.20 - - - - 1.20 1.20K.Subrahmanian - - - - - - 0.02 0.02 0.02 0.02S.Paramasivan - - - - - - 0.01 0.01 0.01 0.01Giridhar Rajagopalan @ - - - - - - 0.00 - 0.00 -Income from Consultancy / Service ChargesStrabag-AG Afcons Joint Venture - - - - - 5.02 - - - 5.02Shapoorji Pallonji & Co. Pvt. Ltd. 0.36 1.50 - - - - - - 0.36 1.50Interest IncomeIrcon-Afcons Joint Venture - - - - 0.07 0.24 - - 0.07 0.24Afcons Sener LNG Construction Projects Pvt.Ltd. - - - - 0.13 0.05 - - 0.13 0.05Overhead Charges RecoveredStrabag-AG Afcons Joint Venture - - - - 3.30 2.82 - - 3.30 2.82Subcontract IncomeTranstonnelstroy-Afcons Joint Venture - - - - 0.76 0.68 - - 0.76 0.68SP Jammu Udhampur Highway Pvt. Ltd. - - - 11.97 - - - - - 11.97Income from Equipment HireIrcon-Afcons Joint Venture - - - - 0.27 1.81 - - 0.27 1.81Strabag-AG Afcons Joint Venture - - - - 0.95 0.66 - - 0.95 0.66Sale of Spares/Materials/AssetsTranstonnelstroy-Afcons Joint Venture - - - - 0.14 0.26 - - 0.14 0.26Shapoorji Pallonji & Co. Pvt. Ltd. - 1.42 - - - - - - - 1.42Advance GivenIrcon-Afcons Joint Venture - - - - 4.01 9.69 - - 4.01 9.69Transtonnelstroy-Afcons Joint Venture - - - - 6.32 11.89 - - 6.32 11.89Afcons Gunanusa Joint Venture - - - - 1.04 0.18 - - 1.04 0.18Shapoorji Pallonji Qatar WLL - - 4.10 - - - - - 4.10 -Afcons Sener LNG Construction Projects Pvt.Ltd. @ - - - - 0.00 1.02 - - 0.00 1.02Advance Received backIrcon-Afcons Joint Venture - - - - (4.33) (12.17) - - (4.33) (12.17)Transtonnelstroy-Afcons Joint Venture - - - - (4.30) (9.25) - - (4.30) (9.25)Afcons Gunanusa Joint Venture - - - - (0.23) (0.27) - - (0.23) (0.27)Afcons Sener LNG Construction Projects Pvt. Ltd. - - - - (0.04) - - - (0.04) -Shapoorji Pallonji Qatar WLL - - - (17.93) - - - - - (17.93)Purchase of Assets / MaterialsTranstonnelstroy-Afcons Joint Venture - - - - 0.04 0.05 - - 0.04 0.05Eureka Forbes Ltd. - - 0.34 0.21 - - - - 0.34 0.21Shapoorji Pallonji Rural Solutions Pvt.Ltd. - - 0.23 0.20 - - - - 0.23 0.20Sterling & Wilson Pvt.Ltd . - - 4.58 0.62 - - - - 4.58 0.62

126
Consolidated finanCial statement of afCons infrastruCture limited and its subsidiaries, assoCiates and joint ventures (afCons group)
Notes forming part of the consolidated financial statements for the year ended 31st March, 2017Note 34. Related party disclosures (Contd.)(b) Details of transactions with related parties for the period 01/04/2016 to 31/03/2017 ` in Crores
Nature of Transaction Holding Company(s) Fellow subsidiary(s) Joint Operation(s) Key Management Personnel
Total
CY PY 15-16 CY PY 15-16 CY PY 15-16 CY PY 15-16 CY PY 15-16Expenses incurred by /(on behalf of) AfconsTranstonnelstroy-Afcons Joint Venture - - - - 0.01 0.01 - - 0.01 0.01Afcons Gunanusa Joint Venture - - - - 0.51 0.51 - - 0.51 0.51Strabag-AG Afcons Joint Venture - - - - 3.11 2.72 - - 3.11 2.72Afcons Sener LNG Construction Projects Pvt.Ltd. - - - - - 0.01 - - - 0.01Armada Madura EPC Limited - - 0.04 0.19 - - - - 0.04 0.19Civil and Interior WorksShapoorji Pallonji & Co. Pvt. Ltd. - 2.88 - - - - - - - 2.88Legal & Professional fees (Strategic Support Service)Shapoorji Pallonji & Co. Pvt. Ltd. 21.75 12.86 - - - - - - 21.75 12.86Rent ExpensesForbes & Company Limited - - 0.60 0.59 - - - - 0.60 0.59Service Charges PaidShapoorji Pallonji & Co. Pvt. Ltd. - 0.24 - - - - - - - 0.24Housekeeping Services PaidForbes Facility Services Pvt.Ltd. - - 3.80 0.95 - - - - 3.80 0.95Travelling ExpenseForvol International Service Ltd - - 11.70 6.12 - - - - 11.70 6.12Guarantees Given for/ (Released)Transtonnelstroy-Afcons Joint Venture - - - - (24.86) (89.42) - - (24.86) (89.42)Afcons Gunanusa Joint Venture - - - - 22.50 - - - 22.50 -Strabag-AG Afcons Joint Venture - - - - (25.75) - - - (25.75) -Afcons Sener LNG Construction Projects Pvt.Ltd. - - - - - (15.28) - - - (15.28)Ircon-Afcons Joint Venture - - - - - (10.46) - - - (10.46)Afcons - Vijeta - PES Joint Venture 30.24 - 30.24 -Afcons Sibmost Joint Venture - - - - 234.75 - - - 234.75 -Outstanding amount of guarantee given/ (taken)Transtonnelstroy-Afcons Joint Venture - - - - 480.71 505.57 - - 480.71 505.57Afcons Gunanusa Joint Venture - - - - 346.78 333.43 - - 346.78 333.43Strabag-AG Afcons Joint Venture - - - - 133.90 165.73 - - 133.90 165.73Dahej Standby Jetty Project Undertaking (DJPU) 112.17 112.44 112.17 112.44Afcons - Vijeta - PES Joint Venture 30.24 - 30.24 -Afcons Sibmost Joint Venture - - - - 234.75 - - - 234.75 -Outstanding Amount Loans & Advances Dr/ (Cr)Transtonnelstroy-Afcons Joint Venture - - - - 7.15 5.00 - - 7.15 5.00Afcons Gunanusa Joint Venture - - - - 33.51 32.20 - - 33.51 32.20Strabag-AG Afcons Joint Venture - - - - 2.63 2.63 - - 2.63 2.63Saipem-Afcons Joint Venture - - - - 0.29 0.30 - - 0.29 0.30Ircon-Afcons Joint Venture - - - - 0.01 0.27 - - 0.01 0.27Afcons Sener LNG Construction Projects Pvt.Ltd. - - - - 1.16 1.07 - - 1.16 1.07Other ReceivablesStrabag-AG Afcons Joint Venture - - - - 11.87 5.45 - - 11.87 5.45Outstanding Amount DebtorsTranstonnelstroy-Afcons Joint Venture - - - - 3.97 3.23 - - 3.97 3.23Shapoorji Pallonji & Co. Pvt. Ltd. 0.51 1.83 - - - - - - 0.51 1.83Armada Madura EPC Limited - - 0.04 0.04 - - - - 0.04 0.04Ircon-Afcons Joint Venture - - - - 0.02 0.04 - - 0.02 0.04Strabag-AG Afcons Joint Venture - - - - 1.66 0.71 - - 1.66 0.71Outstanding Amount CreditorsForvol International Service Ltd - - 1.39 1.85 - - - - 1.39 1.85Shapoorji Pallonji & Co. Pvt. Ltd. 18.35 12.09 - - - - - - 18.35 12.09Eureka Forbes Ltd. - - 0.22 0.07 - - - - 0.22 0.07Forbes & Company Limited - - 0.12 0.04 - - - - 0.12 0.04Sterling & Wilson Pvt.Ltd . - - 0.83 0.12 - - - - 0.83 0.12Shapoorji Pallonji Rural Solutions Pvt Ltd - - - 0.14 - - - - - 0.14Forbes Facility Services Pvt.Ltd. - - 0.87 0.40 - - - - 0.87 0.40
@ Denotes amount less than ` Ten Thousand.

127
Consolidated finanCial statement of afCons infrastruCture limited and its subsidiaries, assoCiates and joint ventures (afCons group)
Notes forming part of the consolidated financial statements for the year ended 31st March, 2017Note 35. Segment information :a) Segment information for Primary reporting (by business segment) Information reported to the Chief Operating Decision Maker (CODM) for the purposes of resource allocation and assessment of
segment performance focuses on the geographic perspective. Accordingly, the company has only one reportable business segment of construction business relating to infrastructure, hence information for primary business segment is not given.
b) Segment information for Secondary segment reporting (by geographical segment). The Company has two reportable geographical segments based on location of customers.
(i) Revenue from customers within India - Local projects(ii) Revenue from customers outside India - Foreign projects
Secondary : Geographical (Location of customers) ` in CroresParticulars Local Projects Foreign Projects Total
Income from operation 5,015.14 1,289.68 6,304.82 (3,648.71) (688.10) (4,336.81)
Carrying amount of asset 2,200.21 25.37 2,225.58 (1,891.75) (37.18) (1,928.93)
Figures in parenthesis are those of previous year.Revenue from Major products and services: The Major activity of the group is Infrastructure activities.Information about major customers: Revenue from external customers contributing to more than 10% of the Group’s Revenue amounts to ` 2,988.80 Crores (for the year 2015-16 ` 2,133.26 Crores). These customers pertain to Roads and Metro Rail Projects.
Note 36. Corporate Social Responsibility: ` in CroresGross amount required to be spent by the Group Company during the year: ` Nil
Amount spent during the year: ` in CroresCSR activities Paid To be paid TotalPromoting education 0.13 - 0.13Total 0.13 - 0.13

128
Consolidated finanCial statement of afCons infrastruCture limited and its subsidiaries, assoCiates and joint ventures (afCons group)
Notes forming part of the consolidated financial statements for the year ended 31st March, 2017
Note 37. Additional information as required by Paragraph 2 of the General Instructions for Preparation of Consolidated Financial Statements to Schedule III to the Companies Act, 2013. ` in Crores
Name of the entity % Holding
Net Assets, i.e., Total Assets minus Total
Liabilities
Share of Profit or Loss Share in Other Comprehensive Income
Share in Total Comprehensive Income
As % of Consolidated
Net Assets
Amount As % of Consolidated
Profit or Loss
Amount As % of Consolidated
Other Comprehensive
Income
Amount As % of Consolidated
Total Comprehensive
Income
Amount
Parent : Afcons Infrastructure Ltd. 18.33% 297.37 30.93% 47.71 55.44% (7.03) 28.74% 40.68
Subsidiaries :Indian:1) Hazarat & Company Pvt.Ltd. 100% 0.00% 0.01 -0.13% (0.20) - - -0.14% (0.20)2) Afcons Corrosion Protection
Pvt.Ltd. 100% 0.09% 1.49 -0.03% (0.05) - - -0.04% (0.05)3) Afcons Offshore and Marine
Services Pvt.Ltd. 100% 0.07% 1.15 0.03% 0.04 - - 0.03% 0.044) Afcons (Mideast) Constructions
& Investments Co.Pvt.Ltd. 100% 0.11% 1.79 0.05% 0.07 - - 0.05% 0.07
Foreign:1) Afcons Construction Mideast
LLC 49% 3.43% 55.58 -4.95% (7.63) - - -5.39% (7.63)2) Afcons Infrastructures Kuwait
for Building, Road and Marine Contracting WLL 49% 0.15% 2.48 1.13% 1.75 0.71% (0.09) 1.17% 1.66
3) Afcons Overseas Construction LLC, Qatar 49% -0.01% (0.20) - - - - - -
4) Afcons Gulf International Project Services FZE 100% 0.11% 1.76 -0.49% (0.75) - - -0.53% (0.75)
5) Afcons Mauritius Infrastructure Ltd. 100% 0.40% 6.49 -0.38% (0.59) - - -0.42% (0.59)
6) Afcons Overseas Singapore Pte Ltd. 100% 3.14% 50.91 0.91% 1.41 3.55% (0.45) 0.68% 0.96
7) Afcons Infra Projects Kazakhstan, LLP 100% 0.04% 0.59 -0.10% (0.16) -0.16% 0.02 -0.10% (0.14)
8) Afcons Saudi Construction LLC 100% 0.05% 0.89 -0.16% (0.24) - - -0.17% (0.24)9) Afcon Overseas Project Gabon
Sarl 100% 4.66% 75.62 61.07% 94.19 43.69% (5.54) 62.63% 88.65
Minority Interests in all subsidiaries -0.01% (0.24) 0.99% 1.53 - - 1.08% 1.53
Joint OperationsIndian1) Afcons Gunanusa Joint Venture 80% 7.21% 117.01 -0.36% (0.56) - - -0.40% (0.56)2) Transtonnelstroy Afcons Joint
Venture 99% 66.65% 1,081.40 6.69% 10.32 - - 7.29% 10.323) Dahej Standby Jetty Project
Undertaking 100% 0.96% 15.52 0.10% 0.16 - - 0.11% 0.164) Afcons Pauling Joint Venture 100% 1.01% 16.35 - - - - - -5) Strabag AG Afcons Joint
Venture 40% 1.57% 25.43 1.07% 1.65 - - 1.17% 1.656) Afcons Sener LNG
Construction Projects Pvt.Ltd. 49% 0.04% 0.72 -0.18% (0.27) - - -0.19% (0.27)7) Ircon Afcons Joint Venture 47% 0.65% 10.59 13.54% 20.89 -3.23% 0.41 15.05% 21.308) Afcons Sibmost Joint Venture 100% -7.81% (126.75) 0.00% - - - - -9) Afcons Vijeta PES Joint
Venture 100% -0.05% (0.79) -0.01% (0.01) - - -0.01% (0.01)Foreign1) Saipem Afcons Joint Venture 50% 0.01% 0.24 - - - - - -
Afcons Trust 100% 0.15% 2.44 0.20% 0.31 - - 0.22% 0.31
Adjustment of deferred tax on undistributed earnings of subsidiary -0.95% (15.34) -9.95% (15.34) - - -10.84% (15.34)
Total 100.00% 1,622.51 100.00% 154.23 100.00% (12.68) 100.00% 141.55

129
Not
e 38
. For
m A
OC
-I(Pu
rsuan
t to fir
st pro
viso t
o sub
-secti
on (3
) of s
ectio
n 129
read
with
rule
5 of th
e Com
panie
s (Ac
coun
ts) Ru
les, 2
014)
Statem
ent c
ontai
ning s
alien
t featu
res of
the fi
nanc
ial st
ateme
nt of
the su
bsidi
ary an
d the
joint
opera
tions
. ` i
n Cror
esSr.
No
Name
of th
e Com
pany
Coun
try of
Inc
orpora
tion
Repo
rting
Curre
ncy
Repo
rting P
eriod
% of
Share
Rate
of Ex
chan
geSh
are
Capit
alRe
serve
s an
d Su
rplus
Total
As
sets
Total
Lia
bilitie
sDe
tails
of Inv
estm
ents
(exce
pt in
case
of
inves
tmen
t in su
bsidi
aries
)Tu
rnove
r (In
cl. O
ther
Incom
e)
Profi
t/(Lo
ss)
befor
e Tax
Prov
ision
for
Curre
nt &
Defer
red Ta
x
Profi
t/(Lo
ss)
after
Tax
Prop
osed
Div
idend
Share
sMu
tual
Fund
sTo
tal of
Inv
estm
ent
Part "
A "Su
bsidi
aries
1Ha
zarat
& Co
mpan
y Priv
ate Li
mited
India
INR
1st Apr, 2
016
100%
-0.2
0 (0
.19)
0.01
0.01
- -
- 0.
02 (0
.20)
(0.00
) (0
.20)
-31
st Mar,
2017
2Afc
ons C
orros
ion Pr
otecti
on Pr
ivate
Limite
dInd
iaIN
R1st Ap
r, 201
610
0% -
0.08
1.41
1.63
1.63
- -
- 0.
10 0.
02 (0
.07)
(0.05
) -
31st M
ar, 20
17
3Afc
ons O
ffsho
re an
d Mari
ne Se
rvice
s Pvt.
Ltd.
India
INR
1st Apr, 2
016
100%
-0.1
0 1.
05 1.
15 1.
15 -
- -
0.07
0.06
(0.02
) 0.
04 -
31st M
ar, 20
17
4Afc
ons C
onstr
uctio
n Mide
ast L
LCDu
bai, U
AEAE
D1st Ja
n, 20
1649
%18
.4952
0.55
(8.09
) 10
7.30
107.3
0 -
- -
71.79
(4.19
) -
(4.19
) -
31st
Dec,
2016
5Afc
ons G
ulf In
terna
tiona
l Proj
ects
Servi
ces F
ZE(10
0 % su
bsidi
ary of
AMIL)
Fujai
rahAE
D1st Ja
n, 20
1610
0%18
.4952
1.85
12.96
14.82
14.82
- -
- -
(0.45
) -
(0.45
) -
31st
Dec,
2016
6Afc
ons I
nfras
tructu
res Ku
wait f
or Bu
ilding
, Roa
dsan
d Mari
ne C
ontra
cting
WLL
Kuwa
itKW
D1st Ja
n, 20
1649
% 22
2.542
6 2.
67 4.
27 7.
27 7.
27 -
- -
4.50
1.48
- 1.
48 -
31st
Dec,
2016
7Afc
ons O
verse
as C
onstr
uctio
n LLC
(R
efer N
ote 4)
Qatar
QAR
1st Apr, 2
016
49%
18.65
52 -
(0.05
) -
- -
- -
- -
- -
-31
st Mar,
2017
8Afc
ons M
auriti
us In
frastr
uctur
e Lim
ited
Mauri
tius
EURO
1st Apr, 2
016
100%
69.14
597.6
1 0.
31 7.
94 7.
94 -
- -
0.12
0.00
(0.00
) 0.
00 -
31st M
ar, 20
17
9Afc
ons O
verse
as Si
ngap
ore Pt
e Ltd.
Singa
pore
SGD
1st Apr, 2
016
100%
46.38
0.24
47.50
108.4
0 10
8.40
- -
- 11
9.60
1.41
- 1.
41 -
31st M
ar, 20
17
10Afc
ons I
nfra P
rojec
ts Ka
zakh
stan L
LP(S
tep do
wn su
bsidi
ary)
Kaza
khsta
nKZ
T1st Ap
r, 201
610
0%0.2
068
0.01
(16.5
8) 0.
60 0.
60 -
- -
0.25
(0.16
) -
(0.16
) -
31st M
ar, 20
17
11Afc
ons S
audi
Cons
tructi
on LL
CSa
udi A
rabia
SAR
1st Apr, 2
016
100%
17.29
380.8
6 (0
.34)
0.96
0.96
- -
- -
(0.23
) -
(0.23
) -
31st M
ar, 20
17
12Afc
ons O
verse
as Pr
oject
Gabo
n SAR
L(S
tep do
wn su
bsidi
ary)
Gabo
nXA
F1st Ja
n, 20
1610
0% 0.
1090
0.01
39.28
251.0
0 25
1.00
- -
- 34
9.30
39.28
- 39
.28 -
31st
Dec,
2016
13Afc
ons (
Mide
ast) C
onstr
uctio
ns &
Inves
tmen
ts Pv
t.Ltd.
India
INR
1st Apr, 2
016
100%
- 0.
01 1.
78 1.
80 1.
80 -
- -
0.11
0.10
(0.03
) 0.
07 -
31st M
ar, 20
17
Notes
:1)
Name
s of s
ubsid
iaries
whic
h are
yet to
comm
ence
opera
tions
- Nil
2) Na
mes o
f sub
sidiar
ies w
hich h
ave b
een l
iquida
ted or
sold
durin
g the
year
- Nil
3) Ind
ian ru
pee e
quiva
lent o
f the fi
gures
give
n in f
oreign
curre
ncies
in th
e acc
ounts
of th
e sub
sidiar
y com
panie
s, are
base
d on t
he ex
chan
ge ra
tes as
on 31
st Dec
embe
r, 201
6 / 31
st Marc
h, 20
17.
4) Afc
ons O
verse
as C
onstr
uctio
n LLC
, Qata
r is un
der li
quida
tion s
ince J
une 2
016.
5) Th
e abo
ve st
ateme
nt do
es no
t inclu
de 28
contr
olled
trust
as th
e sam
e is n
ot as
subs
idiari
es /a
ssoc
iates
/ joint
ventu
re co
mpan
y und
er Co
mpan
ies Ac
t 201
3.
Not
es fo
rmin
g pa
rt o
f the
con
solid
ated
fina
ncia
l sta
tem
ents
for t
he y
ear e
nded
31st
Mar
ch, 2
017
CONS
OLID
ATED
FIN
ANCI
AL S
TATE
MENT
OF
AFCO
NS IN
FRAS
TRUC
TURE
LIM
ITED
AND
ITS
SUBS
IDIA
RIES
, ASS
OCIA
TES
AND
JOIN
T VE
NTUR
ES (A
FCON
S GR
OUP)

130
Not
es fo
rmin
g pa
rt o
f the
con
solid
ated
fina
ncia
l sta
tem
ents
for t
he y
ear e
nded
31st
Mar
ch, 2
017
CONS
OLID
ATED
FIN
ANCI
AL S
TATE
MENT
OF
AFCO
NS IN
FRAS
TRUC
TURE
LIM
ITED
AND
ITS
SUBS
IDIA
RIES
, ASS
OCIA
TES
AND
JOIN
T VE
NTUR
ES (A
FCON
S GR
OUP)
Not
e 38
. For
m A
OC
-I (C
ontd
.)
Part
“B” J
oint O
pera
tions
Name
of Jo
int O
pera
tions
Saipe
m Af
cons
Jo
int Ve
ntur
eSt
raba
g Afco
ns
Joint
Ven
ture
Ircon
Afco
ns
Joint
Vent
ure
Afco
ns S
ener
LN
G Co
nstru
ction
Pr
ojects
Pvt.
Ltd.
Afco
ns G
unan
usa
Joint
Vent
ure
Tran
stonn
elstro
y Af
cons
Jo
int Ve
ntur
e
Dahe
j Stan
dby
Jetty
Pro
ject
Unde
rtakin
g
Afco
ns S
ibmos
t Jo
int Ve
ntur
eAf
cons
Pau
ling
Joint
Vent
ure
Uninc
orpo
rate
d JV
(R
efer
Not
e 3)
Uninc
orpo
rate
d JV
(R
efer
Not
e 3)
Uninc
orpo
rate
d JV
(R
efer
Not
e 3)
Inco
rpor
ated
JV(R
efer
Not
e 1)
Uninc
orpo
rate
d JV
(R
efer
Not
e 3)
Uninc
orpo
rate
d JV
(R
efer
Not
e 3)
Uninc
orpo
rate
d JV
(Ref
er N
ote
3)Un
incor
pora
ted
JV(R
efer
Not
e 3)
Partn
ersh
ip Fi
rm(R
efer
Not
e 3)
1La
test
audit
ed B
alanc
e Sh
eet
Date
31st D
ecem
ber,
2015
31st M
arch
, 201
731
st Mar
ch, 2
017
31st M
arch
, 201
731
st Mar
ch, 2
014
31st M
arch
, 201
731
st Mar
ch, 2
017
31st M
arch
, 201
731
st Mar
ch, 2
017
2Sh
ares
of Jo
int op
erati
ons
held
by th
e com
pany
on th
e ye
ar en
dNo
. -
- -
4900
- -
- -
-Am
ount
of I
nves
tmen
t in Jo
int
oper
ation
s -
- -
` 49,
000
- -
- -
` 1,7
4,00
,000
Exte
nd o
f Hold
ing %
50%
40%
47%
49%
80%
99%
100%
100%
100%
3De
scrip
tion
of h
ow th
ere
is sig
nifica
nt in
fluen
ceN/
AN/
AN/
AN/
AN/
AN/
AN/
AN/
AN/
A
4Re
ason
why
the
Joint
ope
ratio
n is
not c
onso
lidat
edN/
AN/
AN/
AN/
AN/
AN/
AN/
AN/
AN/
A
5Ne
twor
th a
ttribu
table
to
Shar
ehold
ing a
s per
late
st au
dited
Bala
nce
Shee
t (`
in C
rore
s)
(0.0
9)14
.67
10.5
6 (0
.39)
(17.
54)
(18.
88)
3.8
9 (0
.00)
1.7
4
6Pr
ofit /
Loss
for t
he ye
ar
(` in
Cror
es)
i. Con
sider
ed in
Con
solid
ation
- 1
.65
20.
89 (0
.27)
3.6
8 9
.76
0.1
6 (0
.00)
-ii.
Not c
onsid
ered
in
Cons
olida
tion
- -
- -
- -
- -
-
Note
s:1)
Nam
es o
f joint
ope
ratio
ns w
hich
are
yet t
o co
mm
ence
ope
ratio
ns -
Afco
ns S
ener
LNG
Con
struc
tion
Proje
cts P
vt.Lt
d.2)
Nam
es o
f joint
ope
ratio
ns w
hich
have
bee
n liq
uidat
ed o
r sold
dur
ing th
e ye
ar -
Nil
3) T
hese
ent
ities a
re a
ccou
nted
in th
e St
anda
lone/
Cons
olida
ted
Fina
ncial
Sta
tem
ents
in te
rms I
nd A
S-11
0 &
Ind A
S-11
1, h
owev
er th
e sa
me
are
not c
onsid
ered
as s
ubsid
iaries
/ass
ociat
es/ jo
int ve
ntur
e co
mpa
ny u
nder
Com
panie
s Act
2013
.

131
Consolidated finanCial statement of afCons infrastruCture limited and its subsidiaries, assoCiates and joint ventures (afCons group)
Notes forming part of the consolidated financial statements for the year ended 31st March, 2017
Note 39. The Company had issued ` 100 crores Unsecured Unlisted Non- Convertible Debentures (NCDs) to a Bank on a private placement basis in each of the financial year 2012-13, 2014-15 and 2015-16 respectively. Out the above NCDs aggregating to ` 200 crores are outstanding as on 31st March, 2017. The said NCDs issued to the Banks have subsequently been transferred in favour of Mutual Funds which are in accordance with the provisions of Section 111A of the Companies Act, 1956 / Section 58 (2) of the Companies Act, 2013. The Company has obtained and placed reliance on legal opinion to the effect that the provisions of Section 58A of the Companies Act, 1956/ Section 73 of the Companies Act, 2013 read together with the Companies Acceptance of Deposit Rules, 1975 / Companies (Acceptance of Deposit Rules), 2014 are not attracted to the NCDs, for aforesaid amount.
Note 40. Afcons Gunanusa Joint Venture (AGJV) had submitted claims for Change orders aggregating to ` 847.41 crore to ONGC. The AGJV has invoked arbitration in respect of the aforesaid change orders, as the same were not approved by Outside Expert Committee (OEC). Claims against change orders and counter claims by ONGC aggregating to ` 30.45 crore will be discussed in arbitration.
Note 41. The Design and Construction of the underground section from Howrah Maidan Station to the west end of the Central Station, to be carried out by the Transtonnelstroy Afcons Joint Venture (TAJV) at Kolkata in the state of West Bengal, had been at a stand still since the last 3 years following issues over the alignment of the railway tracks between the aforesaid 2 stations and the state not handing over land to TAJV. Kolkata Metro Rail Corporation Limited (KMRCL) vide its letter dated 20th March, 2014 issued to TAJV has granted an extension of time up to September 2016, for completion of the above project. Also, additional variation claims have been submitted to KMRCL, by TAJV.
Further to the above, vide its interim order dated 25th September, 2014 ,the High Court of Kolkata, had ordered KMRCL to issue directions to TAJV to commence work and to release payment within 7 days, and the notice of termination to TAJV stood quashed. Additionally, the High Court vide its order dated 12th February, 2015, has reiterated that the final decision with regard to the realignment to be taken within 6 months i.e. by 1st August, 2015, and further the TAJV had also filed an interim civil application with the High Court on 8th June, 2015.
Subsequently, on receipt of a communication dated 21st August, 2015 from KMRCL advising them of the approval of the realignment and requesting them to restart the work, the construction activity has been resumed by the TAJV. In view of the above, the Supervisory Board does not anticipate any further loss to be recognised at this stage.
Note 42. Chennai Metro Rail Limited (Client) awarded two contracts (UAA 01 and UAA 05) to Transtonnelstroy Afcons Joint Venture (TAJV) in February 2011 for designing and construction of underground stations and associated tunnels. The original scheduled completion was April 2015 for UAA 01 and January 2015 for UAA 05. Due to unforeseen geological conditions and delays in handing over of land etc., these projects got delayed. Based on actual ground conditions and physical progress as of date, UAA 05 is substantially complete and UAA 01 substantial completion is now foreseen around March 2018. The TAJV had submitted variations to the Client and also invoked arbitration proceedings for speedy recovery of the same. The TAJV has received arbitration awards on 7th March, 2017. The Client can file appeal upto 120 days from the date of award. The Supervisory Board of the TAJV does not anticipate any loss to be recognised at this stage.
Note 43. a) The holding company has been legally advised that outstanding interest free advances aggregating to ̀ 901.12 Crores (As at 31st March, 2016: ` 683.10 Crores; As at 1st April, 2015 ` 333.60 Crores). made towards financing the unincorporated joint operations do not come under the purview of Section 186 of Companies Act, 2013 as the Company is in the business of constructing and developing infrastructure facilities.
b) In view of non-applicability of section 186 of the Companies Act, 2013, the details of particulars required to be made thereunder in the financial statements are not applicable in relation to loan made, guarantee given or security provided. For investments made refer to Note no. 4.
Note 44. During the earlier year, company had invoked bank guarantee amounting to ` 56.14 Crores against the sub-contractor for lack of performance in respect of an overseas project. The sub-contractor had submitted to Company, revised claims aggregating to ̀ 449.44 Crores for delay and cost overrun for the work performed by them in relation to the said project. The company has filed counter claims against the sub-contractor for an amount of ̀ 585.71 Crores on account of delays and incomplete work done by the sub-contractor. An amount aggregating to ̀ 108.12 Crores (including ̀ 56.14 Crores received on invocation of bank guarantee) is outstanding (net of receivables) as on 31st March, 2017 in the books of the Company. Based on the review of back-up documents submitted by the sub-contractor and counter claim filed by the company, no further provision is envisaged at this stage.
Note 45. Financial instruments45.1 Capital management The Group manages its capital to ensure that entities in the Group will be able to continue as going concerns while maximising
the return to stakeholders through the optimisation of the debt and equity balance. The capital structure of the Group consists of net debt (borrowings as detailed in notes 14,16 and 21 offset by cash and bank
balances) and total equity of the Group. The Group reviews the capital structure on a regular basis. As part of this review, the Group considers the cost of capital and the
risks associated with each class of capital. The gearing ratio at 31st March, 2017 of 1.13 (net debt / equity).

132
Consolidated finanCial statement of afCons infrastruCture limited and its subsidiaries, assoCiates and joint ventures (afCons group)
Notes forming part of the consolidated financial statements for the year ended 31st March, 2017
Note 45. Financial instruments (Contd.)45.1.1 Gearing ratioThe gearing ratio at end of the reporting period was as follows.
Particulars As at 31st March, 2017 As at 31st March, 2016 As at 1st April, 2015 Debt (i) 2,015.48 2,059.95 1,807.68Cash and bank balances 189.36 156.11 155.00 Net debt 1,826.12 1,903.84 1,652.68 Total Equity (ii) 1,622.51 1,508.57 1,459.55 Net debt to equity ratio 1.13 1.26 1.13
(i) Debt is defined as long-term and short-term borrowings (excluding derivative, financial guarantee contracts and contingent consideration)(ii) Equity includes all capital and reserves of the Company that are managed as capital.
45.2 Categories of financial instrumentsThe following table provides categorisation of all financial instruments at carrying value except non current investments in un-quoted equity instruments of subsidiaries and other entities which are carried at cost. ` in Crores
Particulars As at 31st March, 2017 As at 31st March, 2016 As at 1st April, 2015Financial assetsMeasured at fair value through profit or loss (FVTPL)Mandatorily measured: (a) Mutual Fund Investments 2.44 2.27 0.12 (b) Derivative Assets - 15.76 23.44Measured at amortised cost (a) Cash and bank balances 160.38 142.46 143.03 (b) Bank balance other than (a) above 28.98 13.65 11.97 (c) Trade receivables 894.33 626.33 553.97 (d) Loans 46.49 43.21 40.67 (e) Other financial assets 283.12 293.31 271.93Measured at FVTOCI (a) Investments in equity instruments 97.60 100.96 102.35Total Financial Assets 1,513.34 1,237.95 1,147.48Financial liabilitiesMeasured at amortised cost (a) Borrowings 2,015.48 2,059.95 1,807.68 (b) Trade payables 1,635.00 1,377.22 1,088.03 (c) Other financial liabilities 137.94 120.63 106.91Total Financial liabilities 3,788.42 3,557.80 3,002.62
45.3 Financial risk management objectivesThe Group’s Corporate Treasury function provides services to the business, co-ordinates access to domestic and international financial markets, monitors and manages the financial risks relating to the operations of the Group through internal risk assessment and analyses forex exposures by degree and magnitude of risks. These risks include market risk (including currency risk, interest rate risk and other price risk), credit risk and liquidity risk.The Group seeks to minimise the effects of these risks by using derivative financial instruments to hedge risk exposures. The use of financial derivatives is governed by the Group’s - Risk Management Policy approved by the board of directors, which provide written principles on foreign exchange risk, interest rate risk, the use of financial derivatives and non-derivative financial instruments. Compliance with policies and exposure limits is reviewed on a continuous basis. The Group does not enter into or trade financial instruments, including derivative financial instruments, for speculative purposes.45.4 Market riskMarket risk is the risk that the fair value of future cash flows of a financial instrument will fluctuate because of changes in market prices. Market risk comprises of Interest rate risk, Currency risk and other price risk. The Group enters into a board approved list of derivative financial instruments to manage its exposure to foreign currency risk and interest rate risk, including but not limited to:• forward foreign exchange contracts to hedge the exchange rate risk arising on the repayment of foreign currency debt;• interest rate swaps to mitigate the risk of rising interest rates on foreign currency debt.
45.5 Foreign currency risk managementThe Group undertakes transactions denominated in foreign currencies; consequently, exposures to exchange rate fluctuations arises. Exchange rate exposures are managed within approved policy parameters utilising appropriate derivative instruments.

133
Consolidated finanCial statement of afCons infrastruCture limited and its subsidiaries, assoCiates and joint ventures (afCons group)
Notes forming part of the consolidated financial statements for the year ended 31st March, 2017
Note 45. Financial instruments (Contd.)The carrying amounts of the Group’s foreign currency denominated monetary assets and monetary liabilities at the end of the reporting period are as follows. ` in Crores
ParticularsLiabilities as at Assets as at
As at 31st March, 2017
As at 31st March, 2016
As at 1st April, 2015
As at 31st March, 2017
As at 31st March, 2016
As at 1st April, 2015
USD Currency 298.33 703.82 897.31 27.44 345.88 328.38Euro Currency 4.64 74.86 74.40 10.92 0.47 19.38QAR Currency 65.31 82.14 20.32 70.77 83.16 17.16OMR Currency 0.08 0.12 0.04 0.60 0.61 0.80Mur Currency 0.13 0.19 0.18 0.01 0.10 0.05UAE Currency 0.36 0.36 0.75 56.20 9.09 35.71JOD Currency 86.54 91.57 97.28 64.42 54.37 55.01BHD Currency 3.03 12.09 15.39 26.64 48.55 45.75KWD Currency 29.41 106.99 80.44 43.88 101.99 80.65GBP Currency 0.08 0.25 0.24 0.02 - -JPY Currency 9.02 5.13 8.00 - - 3.06BDT Currency 0.01 0.04 0.41 0.12 0.59 4.53SAR Currency 0.02 0.01 0.46 0.36 0.14 0.06GHS Currency 258.40 - - 3.11 - -SGD Currency - 0.08 0.34 - - -CHF Currency - - - 0.01 - -CAD Currency - 0.08 - - - -IQD Currency - 0.06 0.04 - - -MYR Currency 0.06 0.07 0.07 - - -
45.5.1 Foreign currency sensitivity analysisThe Group is mainly exposed to the currency of USD, Euro and KWD currency.The following table details the Group’s sensitivity to a 5% increase and decrease in the Indian Rupee against the relevant foreign currencies. 5% is the sensitivity rate used when reporting foreign currency risk internally to key management personnel and represents management’s assessment of the reasonably possible change in foreign exchange rates. This is mainly attributable to the exposure outstanding on receivable and payables in the Group at the end of the reporting period.The sensitivity analysis includes only outstanding foreign currency denominated monetary items and adjusts their translation at the period end for a 5% change in foreign currency rates. A positive number below indicates an increase in the profit or equity where the Indian Rupee strengthens 5% against the relevant currency. For a 5% weakening of the Rupee against the relevant currency , there would be a comparable impact on the profit or equity, and the balances below would be negative. The impact of 5 % is also applicable on outstanding foreign currency loans as on the reporting date.
` in CroresParticulars USD Currency Impact Euro Currency Impact KWD Currency Impact
2016- 2017 2015-2016 2016- 2017 2015-2016 2016- 2017 2015-2016Impact on profit or loss for the yearIncrease in exchange rate by 5% (13.54) (17.90) 0.31 (3.72) 0.72 (0.25)Decrease in exchange rate by 5% 13.54 17.90 (0.31) 3.72 (0.72) 0.25
In management’s opinion, the sensitivity analysis is unrepresentative of the inherent foreign exchange risk because the exposure at the end of the reporting period does not reflect the exposure during the year.45.5.2 Derivative Financial InstrumentsThe Group has entered into foreign currency options and interest rates swaps to manage its exposure to fluctuations in foreign exchange rates and interest rates risk on floating rate foreign currency borrowings.The Group has entered into foreign currency options and Interest rate swaps to cover its exchange rate and interest rate risks pertaining to its foreign currency borrowings.The following table details the significant derivative financial instruments outstanding at the end of the reporting period:
As at 31st March, 2017
As at 31st March, 2016
As at 1st April, 2015
Foreign Currency OptionsNotional Value (US$) Notional Value (US$) Notional Value (US$)
- 1,38,88,120 2,78,88,120Fair Value (` in Crores) Fair Value (` in Crores) Fair Value (` in Crores)
- 15.76 23.44

134
Consolidated finanCial statement of afCons infrastruCture limited and its subsidiaries, assoCiates and joint ventures (afCons group)
Note 45. Financial instruments (Contd.)In respect of the Group’s foreign currency option contracts, a 5% appreciation/depreciation of the foreign currency underlying such contracts, would have resulted in an approximate gain / (loss) in the Group’s statement of profit and loss for the years ended as below:
As at 31st March,, 2017 As at 31st March,, 2016Gain / (Loss) - 0.79 / (0.79)
45.6 Interest rate risk managementThe Group is exposed to interest rate risk because entities in the Group borrows foreign currency funds at floating interest rates. The risk is managed by the use of interest rate swap contracts and other similar products. Hedging activities are evaluated regularly to align with interest rate views and defined risk appetite, ensuring the most cost-effective hedging strategies are applied.45.6.1 Interest rate sensitivity analysisThe sensitivity analysis below have been determined based on the exposure to interest rates for both derivatives and non-derivative instruments at the end of the reporting period. For floating rate liabilities, the analysis is prepared assuming the amount of the liability outstanding at the end of the reporting period was outstanding for the whole year. A 50 basis point increase or decrease is used when reporting interest rate risk internally to key management personnel and represents management’s assessment of the reasonably possible change in interest rates.If interest rates had been 50 basis points higher/lower and all other variables were held constant, the Group’s profit for the year ended 31st March, 2017 would decrease/increase by ` 2.74 Crores (2016: decrease/increase by ` 3.70 Crores). This is mainly attributable to the Group’s exposure to interest rates on its variable rate borrowings;45.6.2 Interest rate swap contractsUnder interest rate swap contracts, the Group agrees to exchange the difference between fixed and floating rate interest amounts calculated on agreed notional principal amounts. Such contracts enable the Group to mitigate the risk of changing interest rates and the cash flow exposures on the issued variable rate debt.
45.7 Other price risksThe Group is exposed to equity price risks arising from mutual funds and equity investments. Certain of the Group’s equity investments are held for strategic rather than trading purposes.Mutual fund investments are susceptible to market price risk, mainly arising from changes in the interest rates or market yields which may impact the return and value of such investments. However, due to the very short tenor of the underlying portfolio in the liquid schemes, these do not hold any significant price risks.
45.7.1 Equity price sensitivity analysisThe sensitivity analyses below have been determined based on the exposure to equity price risks at the end of the reporting period.If equity prices had been 5% higher/lower:i) Other comprehensive income for the year ended 31st March, 2017 would increase/decrease by ` 4.88 Crores (2015-2016: increase/
decrease by ` 5.05 Crores) as a result of the changes in fair value of equity investments measured at FVTOCI.
45.8 Credit risk managementCredit risk is the risk that a counterparty will default on its contractual obligations, resulting in financial loss. Credit risk arises from cash and deposits, derivative financial instruments and credit exposures to customers, including outstanding receivables and committed transactions. The Group has a policy of assessing the creditworthiness of potential customers before entering into transactions by performing a credit evaluation on the financial condition of accounts receivable using independent ratings where available or by assessment of the customer’s credit quality based on its financial position, past experience and other factors.For trade and other receivables, credit evaluation is performed on the financial condition of accounts receivable using independent ratings where available or by assessment of the customer’s credit quality based on its financial position, past experience and other factors. The Group’s most significant customers are public or regulated industry entities which generally have high credit ratings or are of a high credit quality due to the nature of the customer.The maximum exposure to credit risk in respect of the above at the reporting date is the carrying value of financial assets recorded in the financial statements, net of any allowance for losses.
45.9 Liquidity risk managementUltimate responsibility for liquidity risk management rests with the management, which has established an appropriate liquidity risk management framework for the management of the Group’s short-term, medium-term, and long-term funding and liquidity management requirements. The Group manages liquidity risk by maintaining adequate reserves, banking facilities and reserve borrowing facilities, by continuously monitoring forecast and actual cash flows, and by matching the maturity profiles of financial assets and liabilities.Liquidity risk tableThe following table details the Group’s remaining contractual maturity for its non-derivative financial liabilities with agreed repayment periods. The tables have been drawn up based on the undiscounted cash flows of financial liabilities based on the earliest date on which the Group can be required to pay. The tables include principal cash flows along with interest. To the extent that interest flows are floating rate, the undiscounted amount is derived from interest rate curves at the end of the reporting period. The contractual maturity is based on the earliest date on which the Group may be required to pay.
Notes forming part of the consolidated financial statements for the year ended 31st March, 2017

135
Consolidated finanCial statement of afCons infrastruCture limited and its subsidiaries, assoCiates and joint ventures (afCons group)
Notes forming part of the consolidated financial statements for the year ended 31st March, 2017
Note 45. Financial instruments (Contd.) ` in Crores Weighted averageeffective interest
rate (%)
Upto 1 year 1-5 years 5+years Total
31st March, 2017Borrowings 8.76% 1,261.84 941.39 78.88 2,282.11Trade Payables 1,487.15 147.85 - 1,635.00Other Financial Liabilities 128.96 0.01 - 128.97
2,877.95 1,089.25 78.88 4,046.0831st March, 2016Borrowings 8.80% 1,287.99 961.46 70.54 2,319.99Trade Payables 1,276.61 100.61 - 1,377.22Other Financial Liabilities 114.77 0.01 - 114.78
2,679.37 1,062.08 70.54 3,811.991st April, 2015Borrowings 9.25% 1,250.14 655.82 94.76 2,000.72Trade Payables 1,022.90 65.12 - 1,088.02Other Financial Liabilities 104.00 0.01 - 104.01
2,377.04 720.95 94.76 3,192.75The Company is exposed to credit risk in relation to guarantees given. The Company’s maximum exposure in this respect is the maximum amount the Company could have to pay if the guarantee is called on (see Note 29). Based on expectations at the end of the reporting period, the Company considers that it is more likely that such an amount will not be payable under the arrangement. However, this estimate is subject to change depending on the probability of the counterparty claiming under the guarantee which is a function of the likelihood that the beneficiary under the guarantee may default.The following table details the Group’s liquidity analysis for its significant derivative financial instruments. The table has been drawn up based on the undiscounted contractual net cash inflows and outflows on derivative instruments that settle on a net basis, and the undiscounted gross inflows and outflows on those derivatives that require gross settlement. When the amount payable or receivable is not fixed, the amount disclosed has been determined by reference to the projected interest rates as illustrated by the yield curves at the end of the reporting period. ` in Crores
Particulars Less than 1 year 1-5 years 5+years31st March, 2017Gross settled:- Currency Options - - -
- - -31st March, 2016Gross settled:- Currency Options 15.76 - -
15.76 - -1st April, 2015Gross settled:- Currency Options 12.62 10.82 -
12.62 10.82 -
45.10 Fair value measurementsThis note provides information about how the Group determines fair values of various financial assets and financial liabilities.45.10.1 Fair value of the Group’s financial assets and financial liabilities that are measured at fair value on a recurring basisSome of the Group’s financial assets and financial liabilities are measured at fair value at the end of each reporting period. The following table gives information about how the fair values of these financial assets and financial liabilities are determined (in particular, the valuation technique(s) and inputs used).
Financial Assets/ Financial Liabilities
Fair value as at Fair value hierarchy Valuation technique(s) and key input(s)31st March,
2017 31st March,
20161st April,
20151) Foreign currency Options None Assets –
15.76Assets -23.44
Level 2 Discounted cash flow.Future cash flows are estimated based on forward exchange rates (from observable forward exchange rates at the end of the reporting period) and contract forward rates, discounted at a rate that reflects the credit risk of various counterparties.
2) Investments in Mutual funds at FVTPL (quoted)
2.44 2.27 0.12 Level 1 Fair value of quoted current investments in Mutual Funds is based on price quotations at the reporting date.
3) Investments in equity instruments at FVTOCI (quoted) (see note 1)
97.60 100.96 102.35 Level 1 Quoted bid prices in an active market

136
Consolidated finanCial statement of afCons infrastruCture limited and its subsidiaries, assoCiates and joint ventures (afCons group)
Notes forming part of the consolidated financial statements for the year ended 31st March, 2017
Note 45. Financial instruments (Contd.)Footnote 1: These investments in equity instruments are not held for trading. Instead, they are held for medium or long-term strategic purpose. Upon the application of Ind AS 109, the Group has chosen to designate these investments in equity instruments as at FVTOCI as the directors believe that this provides a more meaningful presentation for medium or long-term strategic investments, than reflecting changes in fair value immediately in profit or loss.There were no transfers between Level 1 and 2 in the period.45.10.2 Fair value of financial assets and financial liabilities that are not measured at fair value (but fair value disclosures are required)The carrying amounts of the following financial assets and financial liabilities (other than Long Term Borrowings) are a reasonable approximation of their fair values. Accordingly, the fair values of such financial assets and financial liabilities have not been disclosed seperately.a) Financial Assets
Cash and bank balancesBank balance other than aboveTrade receivablesLoansOther financial assets
b) Financial LiabilitiesShort Term BorrowingsTrade payablesOther financial liabilities
The carrying amount and fair value of Long Term Borrowings, which are measured at amortised cost is disclosed in table below : ` in Crores As at 31st March, 2017 As at 31st March, 2016 As at 1st April, 2015Carrying amount
Fair value Carrying amount
Fair value Carrying amount
Fair value
Financial liabilitiesFinancial liabilities held at amortised cost: 947.49 962.89 1,039.92 1,050.81 892.44 901.54 - Borrowings 947.49 962.89 1,039.92 1,050.81 892.44 901.54
Note 46. First time Ind AS adoption reconciliations:(i) Reconciliation of equity as previously reported under Indian GAAP to Ind AS ` in Crores
Particulars As at 31st March, 2016
As at 1st April, 2015
Notes
Equity as reported under previous GAAP (including minority Interest) 1,218.73 1,168.23Ind AS: Adjustments increase / (decrease):Reversal of Provision for dividend on Preference Shares (including tax) 0.05 0.05 (a)Fair valuation gain on investments accounted at FVTOCI / FVTPL 14.99 16.33 (d)Reserves from consolidation of Trusts and resulting subsidiary 5.04 4.71 (n)Treasury shares (1.19) (1.19) (n)PPE accounted at Fair Value as deemed cost (net of tax) 269.01 271.79 (l)Provision for expected credit loss on trade receivables (net of tax) (2.45) (3.65) (m)Elimination of minority Interest for Joint Operations (earlier treated as subsidiary) 4.39 3.28 (c)Equity as reported under Ind AS (including minority interest) 1,508.57 1,459.55
(ii) Reconciliation of P&L as previously reported under Indian GAAP to Ind AS ` in CroresProfit for the year ended
31st March, 2016Notes
Profit as per previous GAAP 76.19Ind AS: Adjustments increase / (decrease):Exchange differences on translating financial statement of a foreign operations (due to change in functional currency) 1.53 (o)Fair value adjustment on Mutual fund investment through FVTPL 0.06 (d)Share of Loss of Joint venture 0.20 (n)Depreciation on PPE accounted at Fair Value as deemed cost (net of tax) (2.80) (l)Remeasurement of defined benefit obligation recognised in other comprehensive income under Ind AS (net of tax) 1.88 (b)Profit on consolidation of Trusts and resulting subsidiary 0.33 (n)Reversal of expected credit loss on trade receivables (net of tax) 1.20 (m)Total effect of transition to Ind AS 2.40Profit for the year as per Ind AS 78.59Other comprehensive income : (e)Remeasurement of defined benefit obligation recognised in other comprehensive income under Ind AS (1.88) (b)Fair value adjustment of Investment in equity shares (1.38) (d)Exchange differences on translating the financial statements of a foreign operation 0.37 (o)Other comprehensive income for the year (2.89)Total comprehensive income under Ind AS 75.70

137
Consolidated finanCial statement of afCons infrastruCture limited and its subsidiaries, assoCiates and joint ventures (afCons group)
Notes forming part of the consolidated financial statements for the year ended 31st March, 2017
Note 46. First time Ind AS adoption reconciliations: (Contd.)(iii) Effect of Ind AS adoption on the consolidated statement of cash flows for the year ended 31st March, 2016 ` in Crores
Particulars
Year ended 31st March, 2016
Notes Previous GAAP
Effect of transition to Ind AS
Ind AS
Net cash flows from operating activities 138.17 50.62 188.79Net cash flows from investing activities (143.97) (35.16) (179.13)Net cash flows from financing activities 4.99 (15.22) (10.23)Net increase / (decrease) in cash and cash equivalents (0.81) 0.24 (0.57)Cash and cash equivalents at beginning of period 142.43 0.60 143.03Effects of exchange rate changes on the balance of cash held in foreign currencies - - -Cash and cash equivalents at end of period 141.62 0.84 142.46 (q)
(iv) Analysis of cash and cash equivalents as at 31st March, 2016 and as at 1st April, 2015 for the purpose of statement of cash flows under Ind AS ` in Crores
Particulars As at 31st March, 2016
As at 1st April, 2015
Notes
Cash and cash equivalents for the purpose of statement of cash flows as per previous GAAP
141.62 142.43
Cash Credit - -Cash and cash equivalents proportionately considered under previous GAAP - -Cash and cash equivalents not considered under previous GAAP 0.84 0.60 (q)Cash and cash equivalents for the purpose of statement of cash flows under Ind AS 142.46 143.03
Notes to the reconciliations :a) In the financial statements prepared under Previous GAAP, dividend on equity shares recommended by the board of directors after
the end of reporting period but before the financial statements were approved for issue, was recognised as a liability in the financial statements in the reporting period relating to which dividend was proposed. Under Ind AS, such dividend is recognised in the reporting period in which the same is approved by the members in a general meeting.
b) Under previous GAAP, actuarial gains and losses were recognised in profit or loss. Under Ind AS, the actuarial gains and losses form part of remeasurement of the net defined benefit liability / asset which is recognised in other comprehensive income. Consequently, the tax effect of the same has also been recognised in other comprehensive income under Ind AS instead of profit or loss. This change does not affect total equity.
c) Under previous GAAP, Transtonnelstroy Afcons Joint Venture (TAJV) and Afcons Gunanusa Joint Venture (AGJV) were classified as subsidiaries and accordingly accounted for using the line by line method at the time of consolidation. Based on an assessment under Ind AS 111 Joint Arrangements, TAJV and AGJV have been accounted as jointly controlled operations using the proportionate consolidation method. The assessment is based on the fact that there is a contractual arrangement that indicate that the parties to the joint arrangements have rights to the assets and obligations for the liabilities of the joint arrangement. ` in Crores
ParticularsAGJV TAJV
As at 31st March, 2016
As at 1st April, 2015
As at 31st March, 2016
As at 1st April, 2015
Non-current assets 33.46 33.71 0.52 0.50Current assets 0.12 0.01 11.53 10.33Total Assets 33.58 33.72 12.05 10.83EquityNon-controlling interests (4.12) (3.39) (0.29) 0.10Non-current liabilities - - 0.75 0.95Current liabilities 37.70 37.11 11.59 9.78Total Equity and Liabilities 33.58 33.72 12.05 10.83
Particulars AGJV TAJVAs at
31st March, 2016As at
31st March, 2016 Total Revenue - 6.44 Total Expenses 0.73 6.82 Profit / (loss) after tax from continuing operations (0.73) (0.38) Total tax expense - - Profit / (loss) for the year (0.73) (0.38)
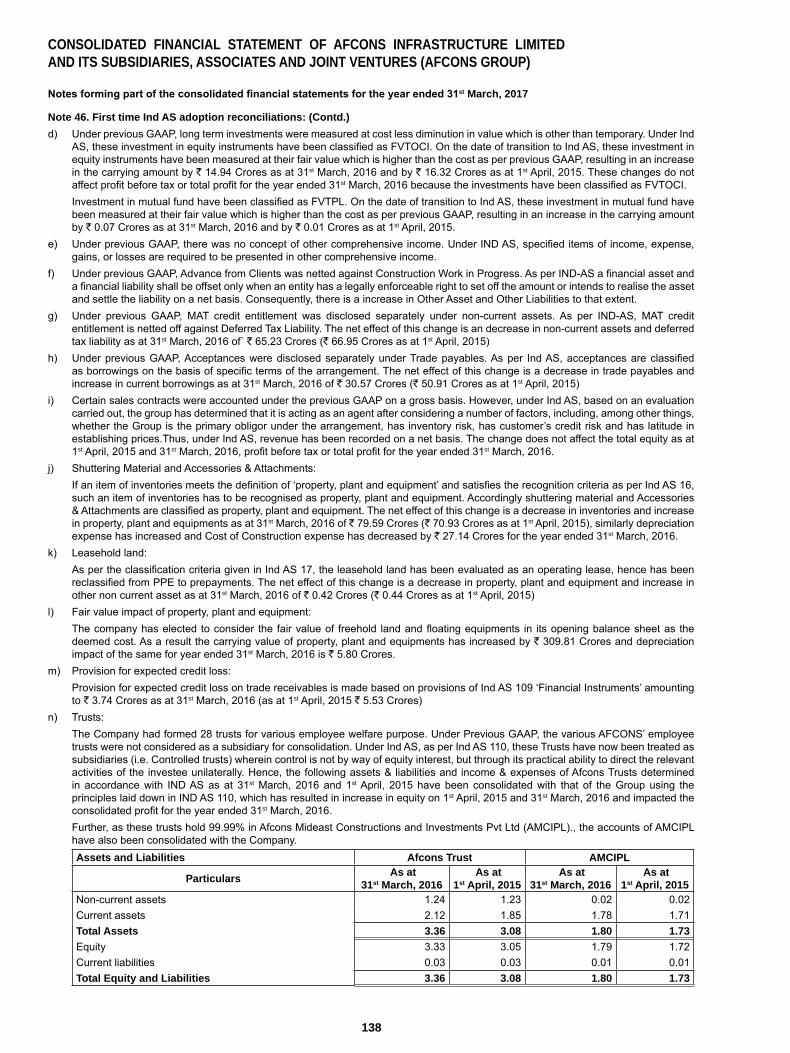
138
Consolidated finanCial statement of afCons infrastruCture limited and its subsidiaries, assoCiates and joint ventures (afCons group)
Notes forming part of the consolidated financial statements for the year ended 31st March, 2017
Note 46. First time Ind AS adoption reconciliations: (Contd.)d) Under previous GAAP, long term investments were measured at cost less diminution in value which is other than temporary. Under Ind
AS, these investment in equity instruments have been classified as FVTOCI. On the date of transition to Ind AS, these investment in equity instruments have been measured at their fair value which is higher than the cost as per previous GAAP, resulting in an increase in the carrying amount by ` 14.94 Crores as at 31st March, 2016 and by ` 16.32 Crores as at 1st April, 2015. These changes do not affect profit before tax or total profit for the year ended 31st March, 2016 because the investments have been classified as FVTOCI.
Investment in mutual fund have been classified as FVTPL. On the date of transition to Ind AS, these investment in mutual fund have been measured at their fair value which is higher than the cost as per previous GAAP, resulting in an increase in the carrying amount by ` 0.07 Crores as at 31st March, 2016 and by ` 0.01 Crores as at 1st April, 2015.
e) Under previous GAAP, there was no concept of other comprehensive income. Under IND AS, specified items of income, expense, gains, or losses are required to be presented in other comprehensive income.
f) Under previous GAAP, Advance from Clients was netted against Construction Work in Progress. As per IND-AS a financial asset and a financial liability shall be offset only when an entity has a legally enforceable right to set off the amount or intends to realise the asset and settle the liability on a net basis. Consequently, there is a increase in Other Asset and Other Liabilities to that extent.
g) Under previous GAAP, MAT credit entitlement was disclosed separately under non-current assets. As per IND-AS, MAT credit entitlement is netted off against Deferred Tax Liability. The net effect of this change is an decrease in non-current assets and deferred tax liability as at 31st March, 2016 of` ` 65.23 Crores (` 66.95 Crores as at 1st April, 2015)
h) Under previous GAAP, Acceptances were disclosed separately under Trade payables. As per Ind AS, acceptances are classified as borrowings on the basis of specific terms of the arrangement. The net effect of this change is a decrease in trade payables and increase in current borrowings as at 31st March, 2016 of ` 30.57 Crores (` 50.91 Crores as at 1st April, 2015)
i) Certain sales contracts were accounted under the previous GAAP on a gross basis. However, under Ind AS, based on an evaluation carried out, the group has determined that it is acting as an agent after considering a number of factors, including, among other things, whether the Group is the primary obligor under the arrangement, has inventory risk, has customer’s credit risk and has latitude in establishing prices.Thus, under Ind AS, revenue has been recorded on a net basis. The change does not affect the total equity as at 1st April, 2015 and 31st March, 2016, profit before tax or total profit for the year ended 31st March, 2016.
j) Shuttering Material and Accessories & Attachments: If an item of inventories meets the definition of ‘property, plant and equipment’ and satisfies the recognition criteria as per Ind AS 16,
such an item of inventories has to be recognised as property, plant and equipment. Accordingly shuttering material and Accessories & Attachments are classified as property, plant and equipment. The net effect of this change is a decrease in inventories and increase in property, plant and equipments as at 31st March, 2016 of ` 79.59 Crores (` 70.93 Crores as at 1st April, 2015), similarly depreciation expense has increased and Cost of Construction expense has decreased by ` 27.14 Crores for the year ended 31st March, 2016.
k) Leasehold land: As per the classification criteria given in Ind AS 17, the leasehold land has been evaluated as an operating lease, hence has been
reclassified from PPE to prepayments. The net effect of this change is a decrease in property, plant and equipment and increase in other non current asset as at 31st March, 2016 of ` 0.42 Crores (` 0.44 Crores as at 1st April, 2015)
l) Fair value impact of property, plant and equipment: The company has elected to consider the fair value of freehold land and floating equipments in its opening balance sheet as the
deemed cost. As a result the carrying value of property, plant and equipments has increased by ` 309.81 Crores and depreciation impact of the same for year ended 31st March, 2016 is ` 5.80 Crores.
m) Provision for expected credit loss: Provision for expected credit loss on trade receivables is made based on provisions of Ind AS 109 ‘Financial Instruments’ amounting
to ` 3.74 Crores as at 31st March, 2016 (as at 1st April, 2015 ` 5.53 Crores)n) Trusts: The Company had formed 28 trusts for various employee welfare purpose. Under Previous GAAP, the various AFCONS’ employee
trusts were not considered as a subsidiary for consolidation. Under Ind AS, as per Ind AS 110, these Trusts have now been treated as subsidiaries (i.e. Controlled trusts) wherein control is not by way of equity interest, but through its practical ability to direct the relevant activities of the investee unilaterally. Hence, the following assets & liabilities and income & expenses of Afcons Trusts determined in accordance with IND AS as at 31st March, 2016 and 1st April, 2015 have been consolidated with that of the Group using the principles laid down in IND AS 110, which has resulted in increase in equity on 1st April, 2015 and 31st March, 2016 and impacted the consolidated profit for the year ended 31st March, 2016.
Further, as these trusts hold 99.99% in Afcons Mideast Constructions and Investments Pvt Ltd (AMCIPL)., the accounts of AMCIPL have also been consolidated with the Company.Assets and Liabilities Afcons Trust AMCIPL
Particulars As at 31st March, 2016
As at 1st April, 2015
As at 31st March, 2016
As at 1st April, 2015
Non-current assets 1.24 1.23 0.02 0.02Current assets 2.12 1.85 1.78 1.71Total Assets 3.36 3.08 1.80 1.73Equity 3.33 3.05 1.79 1.72Current liabilities 0.03 0.03 0.01 0.01Total Equity and Liabilities 3.36 3.08 1.80 1.73

139
Consolidated finanCial statement of afCons infrastruCture limited and its subsidiaries, assoCiates and joint ventures (afCons group)
Notes forming part of the consolidated financial statements for the year ended 31st March, 2017
Note 46. First time Ind AS adoption reconciliations: (Contd.) ` in Crores
Income and Expenses Afcons Trust AMCIPLParticulars As at 31st March, 2016 As at 31st March, 2016
Total Revenue 0.29 0.11Total Expenses 0.01 0.01Tax expenses - 0.03Profit / (loss) after tax from continuing operations 0.28 0.07Profit / (loss) for the year 0.28 0.07
Further, as a result of consolidation of these Trusts, the shares of the Company held by these trusts have been treated as treasury shares and presented as deduction from equity on 1st April, 2015 and 31st March, 2016.
o) Items included in the consolidated financial statements of each of the Group’s entities are measured using the currency of the primary economic environment in which the entity operates (‘the functional currency’). Ind AS 21 requires the assessment of functional currency basis the conditions specified therein. Based on such reassessment, the functional currency of certain entities within the group were reassessed to be different from those considered under previous GAAP. Under Ind AS, exchange differences arising on translation of foreign operations, if any, are recognised in other comprehensive income and accumulated in equity (and attributed to non-controlling interests as appropriate). This has resulted in an adjustment to the profit or loss and other comprehensive income.
p) Under previous GAAP, deferred tax was accounted using the statement of profit and loss approach, which focuses on differences between taxable profits and accounting profits for the period. Ind AS 12 requires entities to account for deferred taxes using the balance sheet approach, which focuses on temporary differences between the carrying amount of an asset or liability in the balance sheet and its tax base. The application of Ind AS 12 approach has resulted in recognition of deferred tax on new temporary differences which was not required under previous GAAP. Deferred tax effect of Ind AS adjustments have been recognised on transition date and during the year ended 31st March, 2016.
q) The material adjustments to the Statement of Cash flows primarily arise from the accounting based on assessment of control / joint control under Ind AS.
Approval of financial statement
The financial statements were approved for issue by the board of directors on 22nd June, 2017.
For and on behalf of the Board of Directors
S.P.MISTRY Chairman
K.SUBRAHMANIAN Vice Chairman &
Managing Director
S.PARAMASIVAN Deputy Managing Director
P.N. KAPADIADirector
N.D.KHURODY Director
R.M.PREMKUMAR Director
Place: MumbaiDate: 22nd June, 2017
P.R. RAJENDRANCompany Secretary
ASHOK G.DARAKChief Financial Officer

Mission“To be a prominent transnational infrastructure company recognised for business innovations,
focused on total satisfaction and enhanced value creation for all its stakeholders”
Kuwait project bags HSE award
The KNPC refinery project site in Kuwait has bagged the ASSE GCC HSE Excellence Award 2017. American Society of Safety Engineers (ASSE) recognised us with this award to appreciate our HSE leadership and measures undertaken for employees’ safety at work place. This is the first time Afcons has received this award.
Construction Week Award for AfconsAfcons Infrastructure Ltd was honoured with the Infrastructure Company of the Year Award at the
Construction Week Awards 2016 in Mumbai, on September 21, 2016. The award was received by the Deputy Managing Director, Mr. S. Paramasivan.
IRCON Tunnel - Award for IRCON Tunnel Project
IRCON Tunnel Project 2618-T74R (A) has been given Gold Award at the Greentech Environment Award 2017 held on February 1, 2017 in Bangalore.
Greentech Award for ALEP PKG II
Agra-Lucknow Expressway Package II has received the Gold Award in Construction Sector for outstanding achievement in Environment Management at the 17th Annual Greentech Environment Award 2017 held at Taj Bangalore on February 1, 2017.
Best Infrastructure Company in Roads & Bridges
Afcons received the award for Best Infrastructure Company in Roads & Bridges at the 2017 CIA World Builders & Infra Awards, in Mumbai, on July 31, 2017. Afcons bagged the award for its impressive performance, and, ahead-of-schedule delivery of two packages in the Agra Lucknow Expressway Project (ALEP).
Award for Jammu-Udhampur Highway Project
The Jammu-Udhampur Highway Project was awarded the Construction Times Award for the Best Executed Highway Project of the Year. The award was received by Mr R. Anantakumar, Executive Vice President, on December 12, 2016, in Gurgaon.
Afcons has started its journey from being a champion EPC player to being a Knowledge Enterprise. It is the only
Indian infrastructure company (Independent Operating Unit) to receive the Global, Asia & India MAKE award
2016. Mr. R Giridhar, Executive Director - Technical, and, Mr. Deepak Gaikwad, Head – Knowledge Management, received the award during the Asia Knowledge Forum,
held in Hong Kong, on January 12, 2017
The award is considered as the ace recognition internationally in the field of Knowledge Management.
The uniqueness of this award lies in the fact, that an organization can only be nominated by other external
experts and not by itself.
MAKE AWARD FOR AFCONS

ANNUAL REPORT2016-17
AFCONS INFRASTRUCTURE LIMITEDA Shapoorji Pallonji Group Company
“Afcons House”16, Shah Industrial Estate, Veera Desai Road,
Azad Nagar P. O., Andheri (West), Mumbai - 400 053