Embed Size (px)
Citation preview

Biofabrication 12 (2020) 025004 https://doi.org/10.1088/1758-5090/ab5cf5
PAPER
Aerosol jet printing of biological inks by ultrasonic delivery
Nicholas XWilliams1,4 , NathanWatson2, Daniel Y Joh2, AshutoshChilkoti2 andAaronDFranklin1,3
1 Department of Electrical andComputer Engineering, DukeUniversity, DurhamNC27708,United States of America2 Department of Biomedical Engineering, DukeUniversity, DurhamNC27708,United States of America3 Department of Chemistry, DukeUniversity, DurhamNC27708,United States of America4 Author towhomany correspondence should be addressed.
E-mail: [email protected]
Keywords: biological ink, bioprinting, aerosol jet, immunoassay
Supplementarymaterial for this article is available online
AbstractPrinting is a promisingmethod to reduce the cost of fabricating biomedical devices.While there havebeen significant advancements in direct-write printing techniques, non-contact printing of biologicalreagents has been almost exclusively limited to inkjet printing.Motivated by this lacuna, this workinvestigated aerosol jet printing (AJP) of biological reagents onto a nonfouling polymer brush tofabricate in vitro diagnostic (IVD) assays. The ultrasonication ink delivery process, which hadpreviously been reported to damageDNAmolecules, caused no degradation of printed proteins,allowing printing of a streptavidin-biotin binding assaywith sub-nanogramml−1 analyticalsensitivity. Furthermore, a carcinoembryogenic antigen IVDwas printed and found to havesensitivities in the clinically relevant range (limit of detection of approximately 0.5 ngml−1 and adynamic range of approximately three orders ofmagnitude). Finally, themulti-material printingcapabilities of the aerosol jet printer were demonstrated by printing silver nanowires and streptavidinas interconnected patterns in the same print jobwithout removal of the substrate from the printer,whichwill facilitate the fabrication ofmixed-material devices. As cost, versatility, and ink usagebecomemore prominent factors in the development of IVDs, this work has shown that AJP shouldbecome amorewidely considered technique for fabrication.
1. Introduction
Printing has emerged as a powerful approach tosimplify and reduce the cost of fabricating a broadrange of devices and sensors [1–6]. This is because itenables low-cost, mask-free device production that isattractive for rapid throughput manufacturing at afraction of the cost of competing approaches. Withinthe biomedical sciences, printing has shown promisein the development of in vitro diagnostic (IVD) assaysfor sensing biological analytes of interest [7, 8]. IVDsallow qualitative (yes/no) or quantitative assessmentof biological analytes and play a central role inmedicaldiagnostics [9, 10], biomedical research [11–17], andforensic science [18, 19], among other fields. Whilethere have been many exciting demonstrations ofprinted IVDs, the methods for printing biological inksfor these sensors are limited and could benefit fromimproved versatility for ease of incorporation with
electrical components for the development of fullyintegrated electronic biosensors in the future.
To date, a mainstay approach to developing prin-table IVDs is inkjet printing (IJP). IJP has been used tofabricate microarrays for proteomics and genomics, aswell as the widely used lateral flow immunoassay forpoint-of-care diagnostic testing [20–26]. In morerecent work, immunoassays were fabricated using IJPto spot antibody (Ab)microarrays directly onto planarsurfaces coated with a ‘nonfouling’ (protein- andcell-resistant) polymer film comprising poly(oligo(ethylene glycol) methacrylate) (POEGMA) brushes[27, 28]. The POEGMA brush exhibits extremely lowlevels of non-specific protein adsorption [29], which istypically the largest source of ‘noise’ in surface-basedprotein assays, so that assays on POEGMA can exhibitan extremely low limit of detection (LOD) [30]. Theuse of IJPwas highly effective in embedding antibodiesinto the dry brush for noncovalent immobilization
RECEIVED
20 July 2019
REVISED
14November 2019
ACCEPTED FOR PUBLICATION
28November 2019
PUBLISHED
31 January 2020
© 2020 IOPPublishing Ltd

with two additional desirable attributes. First, despitethe noncovalent immobilization of antibodies, sub-sequent exposure of the antibodies to whiole blood,plasma or serum does not dissolve the printed anti-bodies. Second, embedding the antibodies into thePOEGMA brush protects the antibodies from dena-turation so that printed chips can be stored at roomtemperature formonths without refrigeration.
While clearly a very useful printing technique, amajor drawback to IJP is its constraint to printing inkswithin a narrow range of viscosities and densities. Theability to print a broader range of not only biologicalinks as biorecognition elements but also non-biological inks (e.g. metals, semiconductors, dielec-trics, etc) as complex sensing elements is desirable asthefield of printable biosensors continues to evolve.
Aerosol jet printing (AJP) is a relatively newmethod of printing that overcomes some of the con-straints of IJP and has been used for the low-cost print-ing of electronics [26–30], including sensors [31–34](figure 1(A)). AJP functions via the aerosolization ofink by ultrasonication (u-AJP) or pneumatic pressure(p-AJP). A schematic of u-AJP can be seen infigure 1(B), with a magnified view of how a sheeth ofinert gas guides the aerosolized ink out of the nozzle,helping to prevent clogging. There are numerous ben-efits to AJP over IJP for device fabrication, includingthe ability to print inks with a wide range of viscosities,
greater ease with printing on non-planar surfaces [35],printing high aspect ratio materials [36], and thedeposition of smaller volumes [37]. Previous reportsdemonstrate the utility and versatility of AJP byfabricating complex transistor devices via a low-temperature printing process [38], developing aflexible pressure sensing array [33], and the creation oforganic solar cells [39]. Yet, despite the considerableeffort invested in applying AJP towards fabricatingelectronic devices, to date it has been underutilized forthe deposition of biological inks, and moreover forbiosensor fabrication.
Electronic devices have typically been fabricatedby u-AJP rather than p-AJP. However, the limited stu-dies available for biologics have focused on p-AJP.This is because u-AJP was presumed to be problematicfor the printing of biological materials given prior evi-dence that the ultrasonication process denaturedDNAand thus, it was postulated, denatured all larger mole-cules containing DNA [40]. Unfortunately, comparedto ultrasonic delivery, pneumatic delivery requires aconsiderably greater ink volume and has a largermini-mum print size. Pneumatic AJP is hence potentiallyproblematic for production of biosensors because themost expensive elements of biological assays are typi-cally the biorecognition elements (e.g. antibodies),where reduction of required ink volume is critical. Inaddition, while u-AJPmay be damaging toDNA, there
Figure 1.Aerosol jet printed biological ink. (A)OptomecAerosol Jet 300 printer used in this work. (B) Schematic representation ofultrasonic atomization Aerosol Jet Printing (u-AJP), with amagnified view of the printer head. (C) Fluorescence images showingintensities for squares and circles of printedCy-5 labeled BSA, captured under 647 nm light before (top) and after (bottom) sonication.(D)Overspray ratio of the aerosol jet printed shapes as a function of printed feature size.
2
Biofabrication 12 (2020) 025004 NXWilliams et al

is actually no empirical evidence supporting thishypothesis for other biological inks. As the vast major-ity of solution fabricated biosensors use antibodies orenzymes as the recognition element, investigatingDNA leaves an incomplete picture and potentially lim-its further development. Given the limitations of theIJP process, the ability to print proteins with u-AJPcould pave the way for novel platforms for low-costproteomic and immunoassay applications that fullyintegrate biological and electronic components.
Motivated by these limitations of IJP and p-AJP,this study investigates the use of u-AJP to printproteins and other non-biological sensor elements.Ultrasonic AJP printing was carried out on POEGMA-coated substrates to facilitate noncovalent immobili-zation of protein inks and to reduce nonspecificprotein adsorption on the surface. To do so, first thefunctionality of ultrasonically delivered streptavidinwas confirmed by validating its specific binding to itsligand—biotin. Next, u-AJP was used to fabricate animmunoassay against carcinoembryogenic antigen(CEA), a clinically relevant biomarker associated withgastrointestinal malignancies that performed withinthe clinically relevant range for LOD. Finally, u-AJPwas used to print non-biological elements (silvernanowires) during the same print job as biological ele-ments (cy5-streptavidin). These results draw attentionto u-AJP as an effective tool for multi-material print-ing of biological and non-biological materials on thesame surface. Taken together, these findings arerelevant to applications requiring controlled deposi-tion of biological materials and for the development ofnext-generation IVDs requiring precise control overbiological/non-biological interfaces.
2.Methods
2.1. POEGMApolymerization on glass substratesThe synthesis of the polymer brush films (POEGMA)on glass substrates is described in detail elsewhere [41].In brief, glass substrates (Schott Nexterion GlassB; Elmsford, NY) were incubated in a 10% (v/v)3-aminopropyltriethoxysilane (APTES) solution inethanol (Gelest, Inc.; Morrisville, PA) overnight. Afterrinsing in ethanol and then water, substrate were spundry (150 rcf) and then cured in an oven for approxi-mately 2 h at 120 °C and then stored at roomtemperature. Next, substrates were placed in a dichlor-omethane (DCM) solution containing 1% trimethyla-mine and 1% alpha-bromoisobutyryl bromide(Sigma-Aldrich; St. Louis, MO) for 30 min undercontinuous stirring. Chipswere cleaned by serial rinsesin fresh DCM, ethanol, and then water. A polymeriza-tion solution was next prepared by adding 30 mg ofcopper(II) bromide, 50 μl of 1,1,4,7,10,10-Hexam-ethyltriethylenetetramine (HMTETA), and 75 g ofpoly(ethylene glycol) methyl ether methacrylatemonomer (MW∼300 Da) to 350 ml of water. This
solution degassed by gently sparging under helium for3 h. Finally, 650 mg of sodium ascorbate was added tothis degassed solution under an Argon environmentand samples were immersed for 4 h in this polymeriza-tion solution. Substrates were then rinsed thoroughlyin water, centrifuged dry, and then stored at roomtemperature. Thickness of polymer brush layers werecharacterized utilizing a M-88 spectroscopic reflectivemode ellipsometer (J.A. Woollam Co; Lincoln, NE).Measurements were obtained at 65°, 70°, and 75° atwavelengths between 400 and 800 nm and fit utilizingaCauchymodel.
2.2. Biological ink printingAJP was performed on an AJ-300 printer (Optomec;Albuquerque, NM) equipped with a 100 μm nozzle.Unless otherwise noted, all inks were prepared at0.20 mgml−1 suspended in phosphate buffered serum(PBS). The printer was set with sheath gas, atomizer,and ultrasonic current of approximately 16 standardcubic centimeters per minute (SCCM), 16 SCCM, and320 mA, respectively. Printing speed was maintainedat 0.5 mm s−1 with a fixed platen temperature of 30 °Cto facilitate ink drying. All printing was performedunder ambient room conditions. Cy5 conjugatedbovine serum albumin (BSA) (ThermoFisher Scienti-fic, Waltham MA), streptavidin (Thermo FischerScientific; Waltham, MA), and anti-cancer embryo-genic antigen antibody (anti-CEA) (Roche HoldingAG; Basel, Switzerland) inks were printed by AJP. IJprinting was performed utilizing a non-contactsciFLEXARRAYER S11 printer (Scienion, Inc.; Berlin,Germany). Printing was performed in a cleanroomsettingwith the same inks used for AJ printing.
2.3. Fluorescent imagingFluorescence imaging of Cy5 and Alexa Fluor 488labels was performed with an Axon Genepix 4400tabletop scanner (Molecular Devices, LLC; San Jose,CA). Spot intensities were measured and analyzed byImageJ Fiji. Data were plotted with Graphpad Prism(Graphpad Software Inc.; La Jolla, CA).
2.4. Protein adhesion and overspray calculationPOEGMA-coated substrates with spots of printedCy5-BSA were serially washed and sonicated (CrestUltrasonics CP230D—Peak power 160W with anaverage power of 80W) in deionized water to assessprotein surface immobilization. Extent of proteinretention following each treatment was assessed viafluorescent imaging of chips compared to baselineintensities. Overspray area was assessed and comparedto printed area to calculate an overspray ratio (OR),defined as OR=(Areaoverspray/Areafeature) [42].Overspray and feature areas were determined viaImageJ Fiji software with pixel distance fixedat 2.5 μm.
3
Biofabrication 12 (2020) 025004 NXWilliams et al

2.5. Streptavidin-biotin binding studiesCy5-streptavidin (ThermoFisher Scientific, Waltham,MA) was printed by u-AJP or IJP onto POEGMA-coated glass samples. Following printing, substrateswere gently cured at 30 °C overnight to facilitate spotdrying. Printed arrays were exposed to a dilution seriesof Alexa Fluor 488-labeled biotin spiked in fetal bovineserum (FBS) and incubated under gentle orbitalagitation for 1 h. Following incubation, chips wererinsed in 0.1% Tween-20/PBS wash buffer and subse-quently spun dry with a slide centrifuge (Labnet,Edison,NJ) for 15 s.
2.6. Sandwich immunoassaysAnti-CEA immunoassays were fabricated by either AJor IJ printing onto POEGMA-coated glass substrates.Anti-CEA capture and detection antibody pairs wereselected according to the manufacturer’s guidelines(Roche Holding AG; Basel, Switzerland). Immunoas-says were incubated with a dilution series of spikedCEA antigen (BiosPacific, Inc.; Emeryville, CA) in FBSfor 1 h on continuous orbital rotation. Followingincubation, the arrays were briefly washed in 0.1%(v/v)Tween-20/PBS wash buffer and spun dry. Next,chips were incubated with 100 μl of 5 μg ml−1 Cy5-labeled detection antibody (dAB) in PBSwith BSA (1%(w/v)) for 1 h under similar orbital agitation. Anti-body-fluorophore conjugation was performed utiliz-ing an Alexa Fluor 647 antibody labeling kit(Molecular Probes; Eugene, OR). Following incuba-tion, chips were washed one more time utilizing thesamemethods as before.
2.7. Silver nanowire ink printingSilver nanowire inks were synthesized using the polyolprocess reported in [43]. Briefly, 160 ml of ethyleneglycol (EG) (J.T. Baker, USA)was heated to 150 °C in around-bottom flask for 1 h. Four solutions were thenmade: (1) 0.257 g NaCl (Fischer Scientific) in 20 mlEG, (2) 0.08 g of Fe(NO3)3 (Sigma Aldrich, USA), (3)1.05 g polyvinylpyrrolidone in 25 ml EG, and (4)1.05 g silver nitrate (Fischer Scientific, USA) in 25 mlEG. Next, 0.2 ml of solution 1, 0.1 ml of solution 2,20.76 ml of solution 3, and 20.76 ml of solution 4 wereadded in 30 s increments to the preheated 500 ml flask.The solution was stirred at 250 RPM for 1 h. After thesynthesis, the silver nanowires were washed twice inacetone (VWR, USA) and once in deionized water.The silver nanowires were then suspended inwater at aconcentration of 10 mgml−1 and 0.1% v/v hydroxy-propyl methylcellulose was added to enhance theviscosity and surface tension of the ink. The silvernanowire ink was printed using an AJ printer with anultrasonic current of 350 mA, an atomizer flow of 35SCCM, and a sheath flow of 25 SCCM. A 200 μmnozzle was selected, and the printed platen was set at30 °C tomatch the temperature at which the biologicalinkwere printed.
2.8. Scanning electronmicroscopy (SEM)SEM was performed using an Apreo S (ThermoFisherScientific, USA). An accelerating voltage of 2 kV andan emission current of 25 pA was used. To reducecharging effects, samples were electrically groundedwith copper tape.
3. Results
3.1. AJ printing feasibility and resolutionThe ability of u-AJP to deposit biological inks ontoPOEGMA-coated planar surfaces was first character-ized by using fluorescence imaging of printed Cy5-labeled BSA (Cy5-BSA) as a model protein. Weinvestigated the well-known tendency in AJP for smalldroplets of ink to deviate from the intended print line(known as ‘overspray’), caused by errant aerosolizeddroplets that are not fully contained by the sheathflow,which can adversely affect printer resolution. Toevaluate the overspray of Cy5-BSA by u-AJP, squaresand circles of sequentially smaller sizes were printedonto a POEGMA surface as shown in figure 1(C). Boththe square and circular features retained sharp featuredefinition at side lengths down to 100 μm, while theedges of the squares began to lose definition below the100 μm limit. To quantitate printer overspray, a so-called ‘overspray ratio’ for circles was calculated bydividing the area enclosed in the overspray by the areaof the printed shape, OR=(Areaoverspray/Areafeature),adapted from [44]. As shown in figure 1(D), for largeprinted sizes (>500 μm) the overspray was negligiblein comparison to the size of the printed shape;however, as the printed surface area decreased, theoverspray ratio increased in an inverse power relation-ship. At a resolution below 50 μm, the overspray areais of similar size to the print itself, leading to reducedfidelity in printed features. To avoid the possibility ofbridging the small gap with overspray deposition, asmall gap of at least 20 μm between printed features ishence necessary.
However, for prints with a larger spacing betweenfeatures (e.g. IVDs), large separation with almost nooverspray between printed spots can be observed. Asseen in the high magnification image and intensityprofile of figure S1 which is available online at stacks.iop.org/BF/12/025004/mmedia, fluorescence inten-sity decreases over a small distance outside the inten-ded printed area for a 20 μm spot size, with almost nofluorescence observed at a distance of 10 μm from theintended print. This overspray area contributes aminimal fluorescence intensity and contributes to<20% of the overall fluorescence intensity, suggestingthat a minimal volume of ink is lost to overspray.Although overspray results in lower fidelity for print-ing small, complex structures with a line spacing of lessthan 20 μm, protein microarrays or IVDs typicallyutilize feature sizes >50 μm [45–48], and in this sizeregime the overspray intrinsic to AJP should not
4
Biofabrication 12 (2020) 025004 NXWilliams et al

negatively affect the performance of the printed assay.Additionally, the utilization of an appropriate printingsurface that is well-suited for noncovalent immobili-zation of printed proteins with minimal backgroundnoise is pivotal [28]. As highlighted in figure S2,at a high enough ink concentration (0.2 mg ml−1)POEGMA-coated surfaces retain reagents delivered byu-AJP as demonstrated with maintained fluorescenceafter increasingly energetic rinsing steps.
3.2. Binding of biotin to ultrasonically depositedstreptavidinThe ability of u-AJP to be used for microarray and IVDapplications was next investigated. To test retention ofprotein function after u-AJP printing, streptavidin wasselected as a model protein because it has a high affinityfor biotin—a small molecule ligand—only in its foldedstate, and the ability of streptavidin to bind biotin ishence a good test of the retention of protein structureand function after u-AJP printing. As shown infigure 2, spots of Cy5-streptavidin were printed byu-AJP at a concentration of 0.2 mgml−1 ontoPOEGMA-coated glass to serve as surface-immobilized
capture reagents. These samples were then exposed to adilution series ofAlexa Fluor 488-taggedbiotin (AF488-biotin) to generate dose-response curves to analyseassay performance.
A representativefluorescence image ofCy5-strepta-vidin capture spots printed by u-AJP is shown infigure 3(A) (red channel), along with the fluorescenceresponse of these spots following incubation witheither: (1) PBS spiked with AF488-biotin or (2) PBS(blue channel). The binding of AF488-biotin localizedto capture spots in samples fabricated by u-AJP suggestspreservation of streptavidin bioactivity under the ultra-sonication settings used here.Outside the capture spots,very low background fluorescence levels are observed,which is consistent with the lack of nonspecific bindingAF488-biotin to the surface (figure S3). Full dose-response curves for u-AJP are shown in figure 3(B) anddemonstrate a LOD of 0.22 ngml−1 for biotin-strepta-vidin binding and a dynamic range (DR) ofmore than 3orders ofmagnitude.
Given the importance of the minimization of inkusage, the effect of spot sizes on dose-responseparameters were next investigated. As can be observed
Figure 2.Approach to IVD fabrication and testing. (A) Schematic processflow: Cy5-streptavidin printed onto POEGMA-coated glassslides using u-AJP.Deposition dried overnight at 30 °C, then incubated in a dilution series of AF488-biotin and rinsed in 0.1%Tween-20/PBS then dried by centrifugation for 10 s. Binding event of AF488-biotin toCy5-streptavidin is characterized by fluorescence. Arepresentative florescent image and cartoon of thefluorescent intensity from aprinted feature that is blank (B) and onewith significantbinding events (C).
5
Biofabrication 12 (2020) 025004 NXWilliams et al

from the representative 2D and 3D profiles ofspots in figure 3(C), theminimum achievable spot dia-meter with a 100 μm nozzle for u-AJP was 22 μm,whereas the baseline spot has a diameter of 130 μm.This droplet miniaturization corresponds to a sig-nificant 35-fold decrease in aerosolized volume, whichwould lead to a dramatic reduction in antibody usageand hence cost. An image of a printed streptavidinarray at multiple levels of magnification can be seen infigure S4. The spots have a uniform profile withoutconsiderable fluorescence intensity outside of theintended spot area. Under these conditions, the dose-response curve for the 22 μm spots exhibit a LODof 12.2 ng ml−1, an ∼1.5 log DR from ∼10 to400 ng ml−1 (figure 3(B)) and an identical maximumfluorescence intensity at the highest biotin-AF488concentrations as the larger spot with a diameter of130 μm.
3.3. Sandwich immunoassay against CEA via u-AJPofAbmicroarraysNext, the functionality of u-AJP compared to IJP wasinvestigated via the fabrication of antibody-basedmicroarrays to detect carcinoembryonic antigen(CEA), a clinically relevant serum tumor markercommonly associated with gastrointestinal malignan-cies [49]. CEA has a diagnostic cut-off ranging from∼5 to 20 ng ml−1, and these values are typicallymeasured in the clinical laboratory by enzyme linkedimmunosorbent assay (ELISA). For these experiments,microspots of anti-CEA capture antibodies wereprinted by either u-AJP (figure 4(A)) or IJP(figure 4(B)), both with spot sizes of ∼130 μm. Theassay fabrication process flow is illustrated in figure S5.Ab microarrays were exposed to undiluted calf serumspiked with varying amounts of CEA, washed, andthen labeled with an anti-CEA detection Ab. The data
Figure 3.Confirmation of preserved biofunctionality following u-AJP printing and comparison of large and small spot sizes usingstreptavidin-biotin assay. (A) i. Printed spots of Cy5-streptavidinmeasured at 647 nm, then similar spots observed at 488 nmafter: ii.Treatment with FITC-conjugated biotin showing active binding, and iii. Rinsing with PBS control without any biotin incubation.(B)Dose-response curve fromAJP-printed assay of streptavidin-biotin. Data represent average±SD of 3 separately run assays. (C)3D (left) and 2D (right) images of FITC-biotin-treated single spots from theAJPwith a 22 μm (top) and 130 μmdiameter (bottom),imaged at 488 nm.
Figure 4.Printed anti-CEA immunoassay comparing u-AJP to IJP. Photographs of (A) optomec aerosol jet printer head and(B) Scienion inkjet printer head. (C)Dose-response curves fromu-AJ and IJ printed anti-CEA assayswith a spot size of∼130 μm.Datarepresent average±SD of 3 separately run assays. (D)Characteristic fluorescence response of printed anti-CEA capture antibodyagainst spikedCEA antigen concentration at high (top), middle (mid), and low (bottom)CEA concentrations.
6
Biofabrication 12 (2020) 025004 NXWilliams et al

show that immunoassays fabricated by IJP and u-AJP(figure 4(C)) had similar LODs and DRs, with a LODin the sub-nanogram ml−1 range (552 pg ml−1 and412 pg ml−1, respectively), and with a DR of∼3 ordersof magnitude. Representative fluorescence images ofhigh,medium, and low concentrations of CEA antigenare shown in figure 4(D). These results show thatantibodies deposited by u-AJP maintained bindingfunctionality with similar sensitivities and overallperformance as antibodies deposited by IJP.
3.4.Mixed-material printingUltrasonic AJP has been used extensively for thedeposition of materials for electrical devices [33,50–52]. Having shown that u-AJP also enables printingof biological inks, the flexibility of u-AJP to printcomplex structures comprised of both biologicalreagents and electrically conductive materials in anintegrated manner was next investigated. This has thepotential to reduce the logistical burden and overheadcost of next-generation electronic biosensor fabrica-tion due to the reduction of required sample transferfrom one fabrication process to another. u-AJP isuniquely suited for this in-place biosensor printingdue to its ability to print complex structures withoutremoval of the sample from the printer platen [38] aswell as its ability to print conductive traces at roomtemperature [36].
To demonstrate the printing of multi-materialstructures, the logo of the Duke University Chapel wasprinted with both silver nanowires and Cy5-streptavi-din (figures 5(A), (B)). Thewindows of the chapel werefirst printed with Cy5-streptavidin; then, withoutremoval of the substrate from the printer platen, con-ductive traces were printed at room temperature fromhigh aspect ratio silver nanowires, amaterial known tobe challenging to print by IJP due to cloggingissues [53]. The fluorescent image in figure 5(B) showsthe distinct boundary between the Cy5-streptavidinregions and the conductive nanowires.
A higher resolution analysis of the interfacebetween the streptavidin and nanowires was carriedout by SEM (figures 5(C), (E)). The order of the printprocess has an impact on the definition of theseboundaries, as seen in the fluorescence image in figureS6 where the inks were printed in reverse order. Whenprinted after the silver nanowires, the biological inkdiffuses into the nanowire region, increasing the fluor-escence area and decreasing the stark printing bound-ary distinction. This is either due to capillary action ordiffusion of compatible solvents between the nano-wires and streptavidin.
4.Discussion
The ability of AJP to print a broader range of inkviscosities and nanoscale morphologies than IJP hasbeen explored in this work. To date, AJP has almost
exclusively been used for the development of electri-cally conductive films and devices with some distinctadvancements in the versatility of the print process.These include recent reports that AJP enables theprinting of inks composed of relatively large, conduc-tive nanostructures at room temperature [36], and theuse of AJP to print functional electronic deviceswithout removing the substrate from the printer [38].The realization of printing proteins with AJP in thiswork further expands its capabilities and opens theway formore complex devices that integrate biologicaland non-biological elements to be realized. Since priorwork demonstrateed that u-AJP induces damage toDNA [40], our finding that the use of ultrasonic energyin u-AJP does not denature the biofunctionality ofproteins is a significant advancement, especially con-sidering the previously held assumption that anultrasonic process is generally incompatible withbiological reagents. Hence, this discovery opens a newavenue for biosensor fabrication, allowing for thedeposition of a broad range of biological inkswith u-AJP.
As demonstrated herein, u-AJP enables the rapidand simple fabrication of IVD assays with sub-ngml−1
LOD. These results will likely extend to any analyte forwhich an established Ab pair is available. The LOD iswell within the clinically relevant concentrations forvarious biomarkers, including prostate specific anti-gen [54], creatine-kinase muscle/brain [55], andleptin [56]. This indicates that the deposition ofbiomarkers with u-AJP onto POEGMA-coated sur-faces could be broadly applicable as a general platformfor highly sensitive IVD assays.
Given the high cost associated with antibodies,there is a desire to decrease the total printed volumewhile maintaining the sensitivity of an IVD assay[57]. One significant drawback of AJP is the highvolume of ink required for printing with the ultra-sonic atomizer (500–1000 μl) as compared to thevolume required to fill an IJP well (as low as 10 μl).This potentially could limit the development of IVDassays with an AJ printer; however, given the rela-tively low levels of damage associated with the ultra-sonication, there is strong evidence that the ink in theatomizer can be retained for further use, decreasingthe waste associated with the printing process. Inaddition, this issue will decrease in relevance as thisprocess is scaled up.
In tandem, reduction of the printed volume isdesirable for fabrication of low-cost biosensors. Thiswork demonstrates the ability to fabricate an IVDassay via u-AJP with minimal printed biological inkvolume; although, the LOD did increase from sub-ngml−1 to 10 ng ml−1 with a decreased DR. Hence, forscaled production of assays, print volumes can likelybe adjusted to balance the required sensitivity(depending on the application) versus the amount ofprotein ink that is consumed. For highly sensitiveassays, larger spot size may be required in order to
7
Biofabrication 12 (2020) 025004 NXWilliams et al

maintain the sub-nanogram sensitivity; however, withcancer markers (such as CEA)where the diseased statepresents with an elevated marker concentration,highly sensitive assays are not required. Futureresearch on the reduction of printed ink volumeshould explore this relationship further to optimizethe droplet volume for a total reduction in ink usagewhilemaintaining a sufficiently low LOD.
In addition to fabricating IVD assays withminimalAb ink usage, AJP also allows printing of more com-plex devices and structures. The ability for multi-material printing that is facilitated by the ultrasonica-tion and protective sheath flow intrinsic to u-AJPenables the deposition of a wide variety of materials.The demonstration of printing electrically conductivesilver nanowires with biologically active Cy5-strepta-vidin in a single, print-in-place process is evidence ofthismulti-material printing capability.With the grow-ing interest in realizing IVD assays with electricallytransduced detection of binding events, [58–64] hav-ing a printing approach for both electrical and biologi-cal inks is a significant boon.
5. Conclusion
The ability to use u-AJP to print functional biologicalreagents into arbitrary and scalable shapes has beendemonstrated. While previous studies suggested thatultrasonication may be damaging to biomolecules,
based on DNA damage from u-AJP, no indication ofdamage to protein reagents was observed. Highlysensitive immunoassays were printed via the ultra-sonic atomization mode of an aerosol jet printer ontoPOEGMA-coated substrates, showing that the printedbiological inks retained their biofunctionality. Thesebiosensors exhibited sensitivities in the pg ml−1 range,which was consistent with comparable biosensorsprinted with an inkjet printer—further evidence thatthe u-AJP process is compatible with protein inks.Finally, to demonstrate the flexibility of u-AJP, bothconductive traces as well as biological materials wereprinted on the same printer without removal of thesubstrate from the platen. As cost, throughput,versatility, and ink usage become more prominentfactors in the development of IVD assays, AJP shouldbecome a more widely considered technique forfabrication of devices that integrate biological andnon-biological elements.
Acknowledgments
This work was supported by the Department ofDefense Congressionally Directed Medical ResearchProgram (CDMRP) under award number W81XWH-17-2-0045 and by the National Institutes of Health(NIH) under award number 1R21HL141028.
E Cy
5-St
rept
avid
in
Silv
er N
anow
ires
Figure 5.Mixed-material ultrasonic aerosol jet printing. (A)Optical photograph of theDukeChapel and ‘Duke’ printedwith silvernanowires, and thewindows printedwithCy5-streptavidin. (B) Fluorescence image (measured at 647 nm) of same print area showingthe localized regions of printed biological ink. SEM images of (C) thewindow region of the print and highermagnification views of (D)the interface between the silver nanowires and streptavidin and (E) the silver nanowires.
8
Biofabrication 12 (2020) 025004 NXWilliams et al

ORCID iDs
Nicholas XWilliams https://orcid.org/0000-0003-0783-9573AaronDFranklin https://orcid.org/0000-0002-1128-9327
References
[1] HuG et al 2017 Black phosphorus ink formulation for inkjetprinting of optoelectronics and photonicsNat. Commun. 8 278
[2] CaoC, Andrews J B and Franklin AD2017Completelyprinted,flexible, stable, and hysteresis-free carbon nanotubethin-film transistors via aerosol jet printingAdv. Electron.Mater. 3 1–10
[3] MohammedMGandKramerR 2017All-printed flexible andstretchable electronicsAdv.Mater. 29 1604965
[4] ScheidelerW J,McPhailM,Kumar R, Smith J andSubramanianV 2018 Scalable, high-performance printed InOx
transistors enabled byUV-annealed printed high-kAlOx gatedielectricsACSAppl.Mater. Interfaces 10 37277–86
[5] KarimN,Afroj S,Malandraki A, Butterworth S, BeachC,RigoutM,NovoselovK, CassonA J andYeates S 2017Allinkjet-printed graphene-based conductive pattern forwearable e-textiles application J.Mater. Chem.C 5 11640–8
[6] Hondred J A, Breger J C, AlvesN J, Trammell S A,Walper SA,Medintz I L andClaussen J C 2018 Printed grapheneelectrochemical biosensors fabricated by inkjetmasklesslithography for rapid and sensitive detection oforganophosphatesACSAppl.Mater. Interfaces 10 11125–34
[7] GlavanAC,Niu J, ChenZ, Güder F, ChengCM, LiuD andWhitesidesGM2016Analytical devices based on directsynthesis ofDNAonpaperAnal. Chem. 88 725–31
[8] YuXY2016Advances inMicrofluidics: NewApplications inBiology, Energy, andMaterials Sciences (London: Intech)
[9] AAlbini, Y Iwamoto andHKKleinman 1987A rapid in vitroassay for quantitating the invasive potential of tumor cellsCancer Res. 47 3239–45
[10] HartmannA, Sasaki Y F, Tice RR, Rojas E, AndersonD,Miyamae Y, Agurell E, Burlinson B, Ryu J-C andKobayashiH2002 Single cell gel/comet assay: Guidelines for in vitro andin vivo genetic toxicology testingEnviron.Mol.Mutagen. 35206–21
[11] Polli JW,Wring SA andHumphreys J E 2001Rational use ofin vitro P-glycoprotein assays in drug discovery J. Pharmacol.Exp. Ther. 299 620–8
[12] ChangR, EmamiK,WuHand SunW2010Biofabrication of athree-dimensional livermicro-organ as an in vitro drugmetabolismmodelBiofabrication 2 45004
[13] ScudieroD,McMahon J, Vistica D, StorengR, Skehan P,Warren J T, Kenney S,Monks A, BoydMRandBokeschH2007New colorimetric cytotoxicity assay for anticancer-drugscreening JNCI J. Natl. Cancer Inst. 82 1107–12
[14] Wienkers LC andHeath TG2005 Predicting in vivo druginteractions from in vitro drug discovery dataNat. Rev. DrugDiscovery 4 825–33
[15] Jones C F andGraingerDW2009 In vitro assessments ofnanomaterial toxicityAdv.DrugDeliv. Rev. 61 438–56
[16] DiekjürgenD andGraingerDW2018Drug transporterexpression profiling in a three-dimensional kidney proximaltubule in vitronephrotoxicitymodel Pflugers Arch. Eur. J.Physiol. 470 1311–23
[17] Chen J et al 2019Glycan targeted polymeric antibioticprodrugs for alveolarmacrophage infectionsBiomaterials 19538–50
[18] CooperGAA, KronstrandR andKintz P 2012 Society of hairtesting guidelines for drug testing in hair Forensic Sci. Int. 21820–4
[19] FrumkinD,WasserstromA,DavidsonA andGrafit A 2010Authentication of forensicDNA samples Forensic Sci. Int.Genet. 4 95–103
[20] Barbulovic-Nad I, LucenteM, SunY,ZhangM,WheelerAR andBussmannM2006Bio-microarray fabricationtechniques—a reviewCrit. Rev. Biotechnol.26 237–59
[21] Calvert P 2001 Inkjet printing formaterials and devicesChem.Mater. 13 3299–305
[22] DufvaM2005 Fabrication of high qualitymicroarraysBiomol.Eng. 22 173–84
[23] PeltonR, Su S, AliM, FilipeCDMandLi Y 2008Microgel-based inks for paper-supported biosensing applicationsBiomacromolecules 9 935–41
[24] Walcarius A,Minteer SD,Wang J, Lin Y andMerkoçi A 2013Nanomaterials for bio-functionalized electrodes: recent trendsJ.Mater. Chem.B 1 4878–908
[25] Bracher P J, GuptaMandWhitesides GM2010 Patterningprecipitates of reactions in paper J.Mater. Chem. 205117–22
[26] SajidM,KawdeAN andDaudM2015Designs, formats andapplications of lateralflow assay: a literature review J. SaudiChem. Soc. 19 689–705
[27] JohDY et al 2017 Inkjet-printed point-of-care immunoassayon a nanoscale polymer brush enables subpicomolar detectionof analytes in blood Proc. Natl Acad. Sci. 114 7054–62
[28] Hucknall A et al 2009 Simple fabrication of antibodymicroarrays on nonfouling polymer brushes with femtomolarsensitivity for protein analytes in serum and bloodAdv.Mater.21 1968–71
[29] MaH,Hyun J, Stiller P andChilkoti A 2004 ‘Non-fouling’oligo(ethylene glycol)-functionalized polymer brushessynthesized by surface-initiated atom transfer radicalpolymerizationAdv.Mater. 16 338–41
[30] Hucknall A, Rangarajan S andChilkoti A 2009 In pursuit ofzero: polymer brushes that resist the adsorption of proteinsAdv.Mater. 21 2441–6
[31] Liu R,DingH, Lin J, Shen F, Cui Z andZhang T 2012Fabrication of platinum-decorated single-walled carbonnanotube based hydrogen sensors by aerosol jet printingNanotechnology 23 505301
[32] Andrews J B, CaoC, BrookeMAand Franklin AD2017Noninvasivematerial thickness detection by aerosol jet printedsensors enhanced throughmetallic carbon nanotube ink IEEESens. J. 17 4612–8
[33] Andrews J B, Cardenas J A, LimC J,Noyce SG,Mullett J andFranklin AD2018 Fully printed and flexible carbon nanotubetransistors for pressure sensing in automobile tires IEEE Sens. J.18 7875–80
[34] White S P, Frisbie CD andDorfmanKD2018Detection andsourcing of gluten in grainwithmultiple floating-gatetransistor biosensorsACS Sensors 3 395–402
[35] WilkinsonN J, SmithMAA,Kay RWandHarris RA 2019Areview of aerosol jet printing—a non-traditional hybridprocess formicro-manufacturing Int. J. Adv.Manuf. Technol.105 4599–619
[36] WilliamsNX,Noyce SG, Cardenas J A, CatenacciM J,Wiley B J and Franklin AD2019 Silver nanowire inks for roomtemperature electronic tattoo applicationsNanoscale 1114294-14302
[37] Cai F, Pavlidis S, Papapolymerou J, Chang YH,WangK,ZhangC andWang B 2014Aerosol jet printing for 3Dmultilayer passivemicrowave circuitry 2014 44th EuropeanMicrowave Conference (Rome) pp 512–5
[38] Cardenas J A, CatenacciM J, Andrews J B,WilliamsNX,Wiley B J and Franklin AD2018 In-place printing of carbonnanotube transistors at low temperatureACSAppl. NanoMater. 1 1863–9
[39] YangC, ZhouE,Miyanishi S,HashimotoK andTajimaK 2011Preparation of active layers in polymer solar cells by aerosol jetprintingACSAppl.Mater. Interfaces 3 4053–8
[40] Grunwald I, Groth E,Wirth I, Schumacher J,MaiwaldM,ZoellmerV andBusseM2010 Surface biofunctionalizationand production ofminiaturized sensor structures using aerosolprinting technologiesBiofabrication 2 14106
[41] Yager P,DomingoG J andGerdes J 2008 Point-of-carediagnostics for global healthAnn. Rev. Biomed. Eng. 10 107–44
9
Biofabrication 12 (2020) 025004 NXWilliams et al

[42] Seifert T, Sowade E, Roscher F,WiemerM,Gessner T andBaumannRR 2015Additivemanufacturing technologiescompared:morphology of deposits of silver ink using inkjetand aerosol jet printing Ind. Eng. Chem. Res. 54 769–79
[43] Stewart I E, KimM J andWiley B J 2017 Effect ofmorphologyon the electrical resistivity of silver nanostructure filmsACSAppl.Mater. Interfaces 9 1870–6
[44] Salary R, (Ross), Lombardi J P, Samie TootooniM,DonovanR,Rao PK, Borgesen P and PoliksMD2016Computational fluiddynamicsmodeling and onlinemonitoring of aerosol jetprinting process J.Manuf. Sci. Eng. 139 021015
[45] HuZ, ZhangA, StorzG,Gottesman S and Leppla SH 2006Anantibody-basedmicroarray assay for small RNAdetectionNucleic Acids Res. 34 1–7
[46] Ekins R P andChu FW1991Multianalytemicrospotimmunoassay—microanalytical ‘compact disk’ of the futureClin. Chem. 31 1955–67
[47] JoosTO et al2000Amicroarray enzyme-linked immunosorbentassay for autoimmunediagnosticsElectrophoresis212641–50
[48] SergeevN,VolokhovD, ChizhikovV andRasooly A 2004Simultaneous analysis ofmultiple staphylococcal enterotoxingenes by an oligonucleotidemicroarray assay J. Clin.Microbiol.42 2134–43
[49] Moertel CG, Fleming TR,Macdonald J S,Haller DG,Laurie J A andTangenC1993An evaluation of thecarcinoembryonic antigen (CEA) test formonitoring patientswith resected colon cancer JAMA J. Am.Med. Assoc. 270 943–7
[50] Cardenas J A, Upshaw S,WilliamsNX,CatenacciM J,Wiley B J and Franklin AD2019 Impact ofmorphology onprinted contact performance in carbon nanotube thin-filmtransistorsAdv. Funct.Mater. 29 1–7
[51] Jones C S, LuX, RennM, StroderMand ShihWS2010Aerosol-jet-printed, high-speed,flexible thin-film transistormade using single-walled carbon nanotube solutionMicroelectron. Eng. 87 434–7
[52] Jabari E andToyserkani E 2015Micro-scale aerosol-jetprinting of graphene interconnectsCarbon 91 321–9
[53] FinnD J, LotyaMandColeman JN2015 Inkjet printing of silvernanowire networksACSAppl.Mater. Interfaces7 9254–61
[54] LiljaH,Ulmert D andVickers A J 2008 Prostate-specificantigen and prostate cancer: prediction, detection andmonitoringNature Reviews Cancer 8 268–78
[55] Puelo PR et al 2006Use of a rapid assay of subforms of creatinekinaseMB to diagnose or rule out acutemyocardial infarctionSurv. Anesthesiol. 39 40
[56] Bartz S et al 2014 Severe acutemalnutrition in childhood:hormonal andmetabolic status at presentation, response totreatment, and predictors ofmortality J. Clin. Endocrinol.Metab. 99 2128–37
[57] Barron J A, YoungHD,Dlott DD, DarflerMM,KrizmanDB and Ringeisen B R 2005 Printing ofproteinmicroarrays via a capillary-free fluid Proteomics 64138–44
[58] GuoC, LiH, ZhangX,HuoH andXuC2015 3DporousCNT/MnO2 composite electrode for high-performanceenzymeless glucose detection and supercapacitor applicationSensors ActuatorsB 206 407–14
[59] TianB and Lieber CM2019Nanowired bioelectric interfacesChem. Rev. 119 9136–52
[60] Pavinatto F J, Paschoal CWAandArias AC 2015 Printed andflexible biosensor for antioxidants using interdigitated ink-jetted electrodes and gravure-deposited active layerBiosens.Bioelectron. 67 553–9
[61] NguyenT, Lam S, ParkH, Shi R and LeeH 2018Developmentofflexible glutamate biosensor using activated carbon—Ptmicroparticle composite ink IEEE Sens. 2018 1–4
[62] Vargas A E, TeymourianH, Tehrani F, Eksin E,Sánchez-tirado E,Warren P, ErdemA andWang J 2019Enzymatic/immunoassay dual biomarker sensing chip:towards decentralized insulin/glucose detectionAngew.Chemie Int. Ed. 58 6376
[63] HajianR et al 2019Detection of unamplified target genes viaCRISPR–Cas9 immobilized on a graphene field-effecttransistorNat. Biomed. Eng. 3 427–37
[64] White S P, Sreevatsan S, Frisbie CD andDorfmanKD2016Rapid, selective, label-free aptameric capture and detection ofricin in potable liquids using a printed floating gate transistorACS Sensors 1 1213–6
10
Biofabrication 12 (2020) 025004 NXWilliams et al

Inkjet-printed point-of-care immunoassay on ananoscale polymer brush enables subpicomolardetection of analytes in bloodDaniel Y. Joha,1, Angus M. Hucknalla,1,2, Qingshan Weib, Kelly A. Masonc, Margaret L. Lunda, Cassio M. Fontesa,Ryan T. Hilla, Rebecca Blaira, Zackary Zimmersa, Rohan K. Achara, Derek Tsengb, Raluca Gordand, Michael Freemarkc,Aydogan Ozcanb, and Ashutosh Chilkotia,2
aDepartment of Biomedical Engineering, Pratt School of Engineering, Duke University, Durham, NC 27708; bElectrical Engineering and BioengineeringDepartments, Henry Samueli School of Engineering and Applied Science, University of California, Los Angeles, CA 90095; cDivision of PediatricEndocrinology, Department of Pediatrics, School of Medicine, Duke University, Durham, NC 27705; and dCenter for Genomic and Computational Biology,Duke University, Durham, NC 27708
Edited by Rebecca R. Richards-Kortum, Rice University, Houston, TX, and approved July 14, 2017 (received for review February 27, 2017)
The ELISA is the mainstay for sensitive and quantitative detectionof protein analytes. Despite its utility, ELISA is time-consuming,resource-intensive, and infrastructure-dependent, limiting itsavailability in resource-limited regions. Here, we describe a self-contained immunoassay platform (the “D4 assay”) that convertsthe sandwich immunoassay into a point-of-care test (POCT). TheD4 assay is fabricated by inkjet printing assay reagents as micro-arrays on nanoscale polymer brushes on glass chips, so that allreagents are “on-chip,” and these chips show durable storage sta-bility without cold storage. The D4 assay can interrogate multipleanalytes from a drop of blood, is compatible with a smartphonedetector, and displays analytical figures of merit that are compa-rable to standard laboratory-based ELISA in whole blood. Theseattributes of the D4 POCT have the potential to democratize accessto high-performance immunoassays in resource-limited settingswithout sacrificing their performance.
nanoscale | nonfouling | polymer brush | inkjet printing | point of care
Diagnostic assessment of protein biomarkers plays an essen-tial role in modern medical practice, and its availability has a
considerable impact on clinical evaluation and decision makingin human health and disease (1). Diagnostic biomarkers are notonly used for identifying disease in individual patients but alsofor developing treatment strategies, tracking treatment response,monitoring recurrence, conducting clinical trials, and performingepidemiological analysis (2). However, shortages in sophisticatedlaboratory resources, highly trained personnel, and modern fa-cilities (with clean water, cold storage, and reliable power) havehampered the discovery and use of diagnostic and therapeuticbiomarkers in the developing world (3). The mainstay approachfor sensitive and quantitative detection of protein biomarkers isthe ELISA. In developed countries, highly sensitive ELISA andELISA-like (4) sandwich immunoassay technologies are readilyaccessible in centralized facilities and are performed by trainedoperators or even automated to handle the multistep workflow.Much of the workflow is directed toward reducing biomolecularnoise due to nonspecific binding of proteins and other compo-nents in complex biological fluids that lower signal-to-noise ratio(SNR). Depending on the assay, steps can include sample pre-processing, liquid transfer, blocking, incubation, and wash steps,in addition to data acquisition and analysis with bulky in-strumentation. Taken together, these characteristics representmajor barriers to obtaining highly sensitive quantitation of pro-tein biomarkers in limited-resource settings (LRSs) (3). Fur-thermore, these barriers can also delay treatment, as test resultsfrom laboratory-based immunoassays may not always reachhealthcare providers and patients in LRSs quickly enough toimpact critical clinical decisions (1). To address these concerns,we sought to design and implement a broadly applicable protein
biomarker detection platform with performance comparable toresource- and personnel-intensive technologies such as ELISAwhile retaining the many attractive features (i.e., low cost, por-tability, and ease of use) of “passively” driven platforms such aslateral flow immunoassays (LFIAs) (5), paper-based diagnostics(PBDs) (6), and passive microfluidics (PMFs) (7).In our previous work, we fabricated Ab-based microarrays on
nanoscale poly(oligo(ethylene glycol) methacrylate) (POEGMA)polymer brushes that were capable of femtomolar detection ofanalytes directly from complex biological milieu (8). The Abarrays were directly spotted onto POEGMA brushes that weregrown from glass by surface-initiated atom transfer radical po-lymerization (SI-ATRP) (8, 9). The POEGMA’s ability to resistnonspecific adsorption of proteins greatly improved SNR byreducing “biomolecular noise,” translating to femtomolar limitof detection (LOD) of protein analytes even from whole bloodand serum (8, 10, 11). The observation that Ab microarrayscould be directly spotted and noncovalently immobilized ontoPOEGMA coatings, and that spots of Abs dried and capturedwithin the POEGMA brush retained their activity even afterdrying and ambient storage, greatly simplified assay fabrication
Significance
Sensitive quantitation of protein biomarkers plays an impor-tant role in modern clinical decision making. This work intro-duces an inkjet-printed assay platform built on a nonfouling,nanoscale polymer brush, which eliminates nonspecific bind-ing, the largest source of noise in surface-based assays. Theassay goes to completion after adding a drop of blood (with noadditional reagents or mixing), and the assay can be read witha smartphone-based detector. This technology is significantbecause it enables high-performance diagnostic testing inblood with minimal infrastructural requirements. Furthermore,its fully printed nature makes it highly customizable and thusbroadly applicable to a wide range of diagnostic targets.
Author contributions: D.Y.J., A.M.H., Q.W., K.A.M., C.M.F., R.T.H., R.B., Z.Z., R.K.A., D.T.,R.G., M.F., A.O., and A.C. designed research; D.Y.J., A.M.H., Q.W., K.A.M., M.L.L., R.B., Z.Z.,R.K.A., D.T., R.G., M.F., and A.O. performed research; A.O. contributed new reagents/analytic tools; D.Y.J., A.M.H., Q.W., K.A.M., M.L.L., C.M.F., R.T.H., R.B., Z.Z., R.K.A., D.T.,R.G., M.F., A.O., and A.C. analyzed data; and D.Y.J., A.M.H., Q.W., M.L.L., R.G., M.F., A.O.,and A.C. wrote the paper.
Conflict of interest statement: The underlying technology of the D4 was developed byA.M.H. and A.C. and acquired by Immucor Inc. in 2014.
This article is a PNAS Direct Submission.1D.Y.J. and A.M.H. contributed equally to this work.2To whom correspondence may be addressed. Email: [email protected] or [email protected].
This article contains supporting information online at www.pnas.org/lookup/suppl/doi:10.1073/pnas.1703200114/-/DCSupplemental.
E7054–E7062 | PNAS | Published online August 7, 2017 www.pnas.org/cgi/doi/10.1073/pnas.1703200114

and subsequent storage of the microarrays. Significantly, thePOEGMA-based microarrays also decreased the time needed toperform a sandwich immunoassay by eliminating the need forblocking steps and reducing the number of rinsing steps. Likemost other immunoassays, however, this approach still requiredseparate incubation steps for labeling with detection reagents toachieve a quantifiable signal. We therefore sought to build uponthis body of work and the robust design concepts of existing“point-of-care test” (POCT) technologies to develop a quanti-tative and sensitive platform that stores all necessary reagents sothat the assay is ready for readout following direct addition ofblood or serum, while minimizing user intervention.Here, we report a quantitative, self-contained, multiplexable
immunoassay (the “D4 POCT”) that stores all necessary captureand detection reagents “on-chip” in a dry state, shows durablestability without cold storage, and detects analytes with sensi-tivity comparable to ELISA directly from whole blood withoutsample preprocessing.
ResultsDesign of the D4 Immunoassay. The challenge we faced in rede-signing an immunoassay on POEGMA brushes as a POCT, andone that is common to most POCTs, is how to spatiotemporallyseparate the capture and detection reagents, and how to time theprecise sequence of events upon introduction of the analyte intothe assay to yield a readout. Whereas recent work in PBDs thatuse highly innovative and robust sequential delivery techniqueshas been shown to be effective (12–15), our approach was toinstead design a passive POCT that uses lateral diffusion in thepolymer brush as the temporally programmable mixing principle.The architecture of the D4 assay consists of a glass chip with a∼50-nm-thick POEGMA coating that contains two types ofmicrospots that are inkjet-printed on the polymer brush: “stable”spots of capture antibodies (cAb) and “soluble” spots of de-tection reagents (Fig. 1). Here, the capture and detection re-agents are placed in very close proximity to one another (severalhundred micrometers), unlike LFIAs in which reagents musttravel larger distances. The detection reagent spots are soluble,as they consist of a mixture of fluorescently labeled detectionAbs (dAbs) and excipient (such as PEG or trehalose) to enabledissolution upon liquid exposure (Fig. 1 A and B). The D4 assayis so named because of the chain of events that drive the assayto completion upon addition of a drop of blood (Fig. 1 A–D):(A) dispense blood onto chip, (B) dissolution of “soluble” de-tection reagent spots, (C) diffusion of analyte-bound dAb acrosssurface and binding to respective cAb spots, and (D) detection ofbinding event by fluorescence imaging. An overall schematic ofthe fabrication of the D4 assay chip is shown in Fig. 1E andconsists of the following sequential steps: (i) SI-ATRP to grow∼50-nm-thick POEGMA brushes on the glass surface, (ii) fol-lowed by noncontact inkjet printing of the cAb from buffer and afluorescently labeled dAb with a molar excess of an excipient,typically PEG.
D4 Detection of Human IgM/IgG from Fingerstick. We first sought totest the concept of the D4 POCT and chose the detection ofhuman IgG and IgM as a test case, as both analytes are presentat high concentration in blood and should thus be detected bythe assay. Furthermore, detection of IgG and IgM in the sameassay also allowed us to assess the feasibility of carrying out amultiplexed D4 assay. To test this concept, a POEGMA-coatedglass slide was stamped with a wax grid to confine the sample tothe active area of the chip containing an inkjet-printed Ab array(Fig. 2A). The detection mixture was printed as three outer ringsof soluble dAb spots containing a mixture of mouse Cy-5-anti-human-IgG and/or mouse Cy-5-anti-human-IgM (dAbs with adifferent epitope against human IgG and IgM than the cAb),with linear PEG (molecular weight 116,000), an excipient that
was added to enable dissolution of the dAbs upon contact withblood, and heparin to prevent coagulation of blood. The inner4 × 4 array contains spots of “stable” cAb. Rows 1 and 4 are ananti-mouse cAb (positive control), row 2 is an anti-human IgGcAb, and row 3 is an anti-human IgM cAb.Representative steps performed by a user are shown in Fig. 2 B–D.
First, a drop of blood from a finger stick (Fig. 2B) is applied directlyto the microarray and contained within the hydrophobic corral (Fig.2C). After a predetermined incubation period (5 min for this ex-periment), the surface is rinsed with ∼1 mL wash buffer from asqueeze bottle, which displaces the loosely bound blood cells andproteins (Fig. 2D). Interestingly, the blood flows to the margins andbinds to the hydrophobic corrals, as seen from the red color aroundthe margins in Fig. 2D, but is completely removed from the non-fouling POEGMA surface. The slide is then imaged with a fluores-cence detector. The output of the D4 from a fluorescent scanner isshown in Fig. 2 E–J. Before exposure to blood, the inner 4 × 4 cAbarray has no intrinsic fluorescence (Fig. 2E). Negative control ex-periments in which the D4 chip was incubated with either PBS (Fig.2F) or whole chicken blood (Fig. 2G) show that only the positive-control spots (rows 1 and 4) generate signal, while middle rows 2 and3 (specific for human IgG and IgM, respectively) show no fluores-cence. Upon incubation with human blood with an array that isprinted with a detection mixture of both Cy5-anti-human IgM andCy5-anti-human IgG dAbs (Fig. 2H), rows 2 and 3 show positivefluorescence signal by “sandwiching” circulating human IgG (row 2)and IgM (row 3) analytes between a cAb and the Cy5-labeled dAbspecific to each analyte. In contrast, when the outer dAb spots onlycontain Cy5-anti-human IgM dAb (Fig. 2I), only row 3 (IgM cAb) is
EY
Y
Y
Y Y Y
A B
C D
Y Y Y Y Y Y
Y Y Y
YYY
YY Y Y Y YPOEGMA
Dispense Dissolve
Diffuse Detect
SiO2
PEG
dAb cAb
analyte
SiO2 POEGMA
SI-ATRP
inkjetprinting
D4
fingerstickserum/blood
dAb
cAb
NCP
signal
500 µm
Fig. 1. D4 immunoassay on POEGMA brushes. (A) “Stable” spots of cAb and“soluble” spots of the fluorescently labeled dAb are printed onto thePOEGMA brush. Whole blood or serum is dispensed directly onto the chip.(B–D) The sequence of events after addition of blood or serum is as follows.(B) “Soluble” dAb dissolves and binds to analyte. (C) These complexes diffuseand bind to their respective cAb spots, and subsequently (D) generate aquantifiable fluorescent signal. (E) D4 chip fabrication. Glass chips arecoated with POEGMA with SI-ATRP. The cAb and detection reagents arespotted onto the surface with noncontact inkjet printing (NCP). After drying,chips are ready for use.
Joh et al. PNAS | Published online August 7, 2017 | E7055
ENGINEE
RING
PNASPL
US
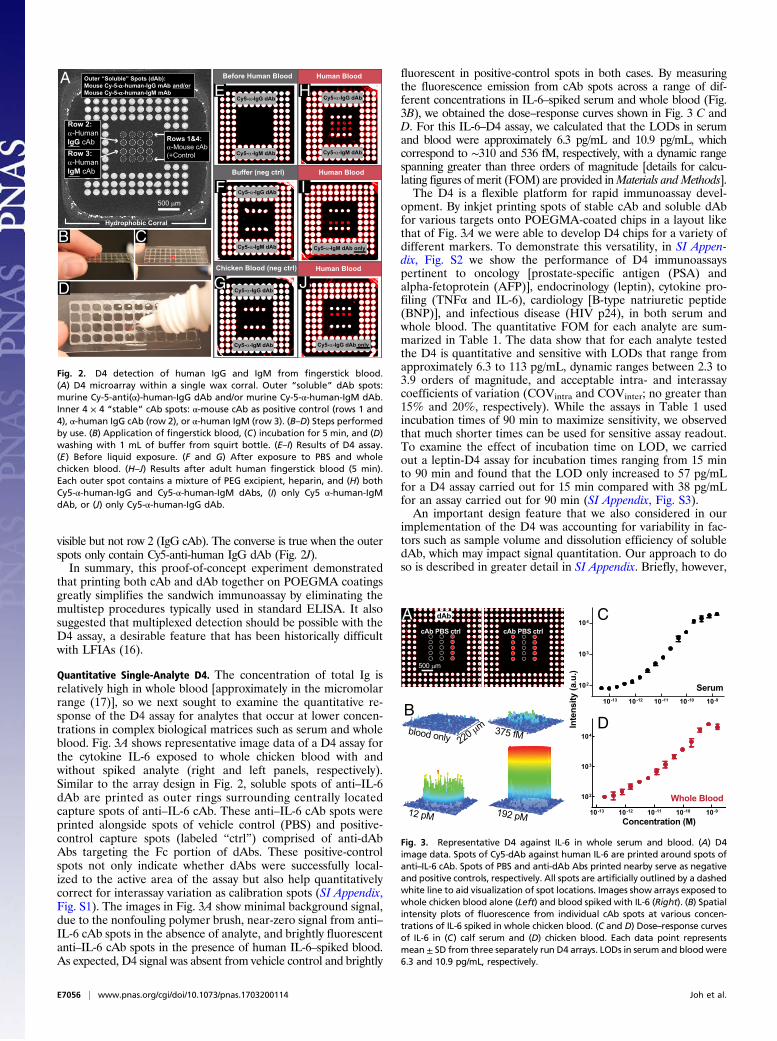
visible but not row 2 (IgG cAb). The converse is true when the outerspots only contain Cy5-anti-human IgG dAb (Fig. 2J).In summary, this proof-of-concept experiment demonstrated
that printing both cAb and dAb together on POEGMA coatingsgreatly simplifies the sandwich immunoassay by eliminating themultistep procedures typically used in standard ELISA. It alsosuggested that multiplexed detection should be possible with theD4 assay, a desirable feature that has been historically difficultwith LFIAs (16).
Quantitative Single-Analyte D4. The concentration of total Ig isrelatively high in whole blood [approximately in the micromolarrange (17)], so we next sought to examine the quantitative re-sponse of the D4 assay for analytes that occur at lower concen-trations in complex biological matrices such as serum and wholeblood. Fig. 3A shows representative image data of a D4 assay forthe cytokine IL-6 exposed to whole chicken blood with andwithout spiked analyte (right and left panels, respectively).Similar to the array design in Fig. 2, soluble spots of anti–IL-6dAb are printed as outer rings surrounding centrally locatedcapture spots of anti–IL-6 cAb. These anti–IL-6 cAb spots wereprinted alongside spots of vehicle control (PBS) and positive-control capture spots (labeled “ctrl”) comprised of anti-dAbAbs targeting the Fc portion of dAbs. These positive-controlspots not only indicate whether dAbs were successfully local-ized to the active area of the assay but also help quantitativelycorrect for interassay variation as calibration spots (SI Appendix,Fig. S1). The images in Fig. 3A show minimal background signal,due to the nonfouling polymer brush, near-zero signal from anti–IL-6 cAb spots in the absence of analyte, and brightly fluorescentanti–IL-6 cAb spots in the presence of human IL-6–spiked blood.As expected, D4 signal was absent from vehicle control and brightly
fluorescent in positive-control spots in both cases. By measuringthe fluorescence emission from cAb spots across a range of dif-ferent concentrations in IL-6–spiked serum and whole blood (Fig.3B), we obtained the dose–response curves shown in Fig. 3 C andD. For this IL-6–D4 assay, we calculated that the LODs in serumand blood were approximately 6.3 pg/mL and 10.9 pg/mL, whichcorrespond to ∼310 and 536 fM, respectively, with a dynamic rangespanning greater than three orders of magnitude [details for calcu-lating figures of merit (FOM) are provided inMaterials and Methods].The D4 is a flexible platform for rapid immunoassay devel-
opment. By inkjet printing spots of stable cAb and soluble dAbfor various targets onto POEGMA-coated chips in a layout likethat of Fig. 3A we were able to develop D4 chips for a variety ofdifferent markers. To demonstrate this versatility, in SI Appen-dix, Fig. S2 we show the performance of D4 immunoassayspertinent to oncology [prostate-specific antigen (PSA) andalpha-fetoprotein (AFP)], endocrinology (leptin), cytokine pro-filing (TNFα and IL-6), cardiology [B-type natriuretic peptide(BNP)], and infectious disease (HIV p24), in both serum andwhole blood. The quantitative FOM for each analyte are sum-marized in Table 1. The data show that for each analyte testedthe D4 is quantitative and sensitive with LODs that range fromapproximately 6.3 to 113 pg/mL, dynamic ranges between 2.3 to3.9 orders of magnitude, and acceptable intra- and interassaycoefficients of variation (COVintra and COVinter; no greater than15% and 20%, respectively). While the assays in Table 1 usedincubation times of 90 min to maximize sensitivity, we observedthat much shorter times can be used for sensitive assay readout.To examine the effect of incubation time on LOD, we carriedout a leptin-D4 assay for incubation times ranging from 15 minto 90 min and found that the LOD only increased to 57 pg/mLfor a D4 assay carried out for 15 min compared with 38 pg/mLfor an assay carried out for 90 min (SI Appendix, Fig. S3).An important design feature that we also considered in our
implementation of the D4 was accounting for variability in fac-tors such as sample volume and dissolution efficiency of solubledAb, which may impact signal quantitation. Our approach to doso is described in greater detail in SI Appendix. Briefly, however,
Hydrophobic Corral
Outer “Soluble” Spots (dAb): Mouse Cy-5-α-human-IgG mAb and/or Mouse Cy-5-α-human-IgM mAb
Rows 1&4:α-Mouse cAb(+Control)
Before Human Blood
Buffer (neg ctrl) Human Blood
Human Blood
Human Blood
Cy5-α-IgM dAb only
Cy5-α-IgG dAb only
Cy5-α-IgG dAb
Cy5-α-IgM dAb
Row 2:α-HumanIgG cAb Row 3: α-HumanIgM cAb
Chicken Blood (neg ctrl)
Cy5-α-IgG dAb
Cy5-α-IgM dAb
Cy5-α-IgG dAb
Cy5-α-IgM dAb
Cy5-α-IgG dAb
Cy5-α-IgM dAb
A
B C
D
E
J
F I
G
H
500 µm
Fig. 2. D4 detection of human IgG and IgM from fingerstick blood.(A) D4 microarray within a single wax corral. Outer “soluble” dAb spots:murine Cy-5-anti(α)-human-IgG dAb and/or murine Cy-5-α-human-IgM dAb.Inner 4 × 4 “stable” cAb spots: α-mouse cAb as positive control (rows 1 and4), α-human IgG cAb (row 2), or α-human IgM (row 3). (B–D) Steps performedby use. (B) Application of fingerstick blood, (C) incubation for 5 min, and (D)washing with 1 mL of buffer from squirt bottle. (E–I) Results of D4 assay.(E) Before liquid exposure. (F and G) After exposure to PBS and wholechicken blood. (H–J) Results after adult human fingerstick blood (5 min).Each outer spot contains a mixture of PEG excipient, heparin, and (H) bothCy5-α-human-IgG and Cy5-α-human-IgM dAbs, (I) only Cy5 α-human-IgMdAb, or (J) only Cy5-α-human-IgG dAb.
12 pM
blood only375 fM
192 pM
220 µmB
Inte
nsity
(a.u
.)
C
D
Serum
Whole Blood
Concentration (M)
10-13 10-12 10-11 10-10 10-9
102
103
104
10-13 10-12 10-11 10-10 10-9
102
103
104
dAbA
500 µm
cAb PBS ctrl cAb PBS ctrl
Fig. 3. Representative D4 against IL-6 in whole serum and blood. (A) D4image data. Spots of Cy5-dAb against human IL-6 are printed around spots ofanti–IL-6 cAb. Spots of PBS and anti-dAb Abs printed nearby serve as negativeand positive controls, respectively. All spots are artificially outlined by a dashedwhite line to aid visualization of spot locations. Images show arrays exposed towhole chicken blood alone (Left) and blood spiked with IL-6 (Right). (B) Spatialintensity plots of fluorescence from individual cAb spots at various concen-trations of IL-6 spiked in whole chicken blood. (C and D) Dose–response curvesof IL-6 in (C) calf serum and (D) chicken blood. Each data point representsmean ± SD from three separately run D4 arrays. LODs in serum and blood were6.3 and 10.9 pg/mL, respectively.
E7056 | www.pnas.org/cgi/doi/10.1073/pnas.1703200114 Joh et al.

the effect of these variations can be eliminated by incorporatingpositive control calibration spots comprised of anti-dAb Abs thattarget the Fc portion of dAbs that are printed in the center of theD4 arrays alongside anti-analyte cAb spots, as shown in the imagedata of Fig. 3A and SI Appendix, Fig. S1A. The data in SI Appendix,Fig. S1 show a significant reduction in interassay variability uponnormalization of the cAb spot intensity to the fluorescence in-tensity of control spots, and the normalized signal intensities areconsistent across a range of sample volumes from 50 to 150 μL.
Quantitative Multianalyte D4. We next assessed the performance ofthe D4 assay to simultaneously quantify multiple biomarkers usingan approach similar to that shown in Fig. 2. Printing spatially dis-tinct capture spots on a 2D surface enables the detection of mul-tiple targets from a single chip with the same fluorescent reporter.As a proof-of-concept demonstration, we developed duplexed as-says against cytokine markers TNFα and IL-6 (Fig. 4) and cancermarkers AFP and PSA (SI Appendix, Fig. S4). Fig. 4A shows animage of the multiplexed D4 against cytokines TNFα and IL-6 af-ter incubation with analyte-negative chicken blood and indicatesthe location of capture spots and Cy5-labeled detection reagents.In a format similar to that of the single-analyte assays shown ear-lier, labeled detection reagents containing dAb for TNFα andIL-6 were printed in the region surrounding cAb spots.As shown in Fig. 4B, performing the D4 in whole blood spiked
with a mixture of both TNFα and IL-6 shows detectable fluo-rescence at both cAb spots for each analyte, in a dose-dependentmanner, similar to that of the single-analyte assays shown in SIAppendix, Fig. S2. In contrast, Fig. 4 C and D show that when themultiplexed assays are exposed to either TNFα or IL-6 aloneonly cAb spots specific to each respective analyte show dose-dependent fluorescence. Similar multiplexed data for AFP andPSA are shown in SI Appendix, Fig. S4.
Pilot Clinical Study with D4. We next sought to test the D4 inhuman patients using a biomarker that would be useful for POCapplications. From the panel of analytes shown in Table 1 weelected to test the performance of a D4 against leptin in a clinicalsetting. This choice was motivated by a recent study in Ugandaby investigators at Duke University and Mulago Hospital whichdetermined that a low serum leptin level (even below 50 pg/mL)
is a major biochemical risk factor predicting infant mortality due tomalnutrition (18). The authors of this study suggested that leptinmeasurements could be used to identify and provide targetedtreatment to malnourished children at highest risk of death. Un-fortunately, many low-resource settings lack the infrastructure toperform hormone assays at such sensitivities and require bloodspecimens to be transported to larger facilities, which delays po-tentially life-saving treatment. We therefore speculated that theD4 may provide a useful diagnostic alternative to hormone assayscarried out in a centralized laboratory by allowing sensitive andquantitative on-site leptin measurements.
Table 1. D4 assay FOM
Analyte LOB, pg/mL LOD, pg/mL COVintra, % COVinter, % DR, log10
AFPCalf serum 20.1 47.5 4.7 14.5 2.7Chicken blood 30.0 58.9 6.3 13.5 2.8
PSACalf serum 54.4 82.8 5.5 10.5 2.7Chicken blood 51.0 112.9 8.0 11.0 2.5
LeptinCalf serum 10.3 38.2 6.4 8.2 3.2Chicken blood 10.4 44.3 4.8 13.4 3.1
BNPCalf serum 2.1 25.2 10.8 19.1 3.7Chicken blood 8.7 28.2 8.9 15.2 3.3
IL-6Calf serum 3.8 6.3 7.6 10.0 3.4Chicken blood 3.7 10.9 7.1 14.1 3.1
TNFαCalf serum 2.0 11.1 9.8 19.9 3.0Chicken blood 24.3 54.2 7.4 18 2.3
HIV p24Calf serum 4.8 11.0 9.9 13.3 3.9Chicken blood 3.1 16.5 9.1 15.6 3.4
IL-6TNFα
10-13 10-12 10-11 10-10 10-9
102
103
104
102
103
104
10-13 10-12 10-11 10-10 10-9 10-8
102
103
104
102
103
104
IL-6TNFα
(+)(+)
cAb
cAb
PBS Inte
nsity
IL-6
(a.u
.) Intensity TNFα (a.u.)
B
C D
A
IL-6 & TNFα dAb
IL-6 TNFα
Multiplexed Cytokine
Concentration (M)
IL-6TNFα (+)
(–)(–)(+)
10-13 10-12 10-11 10-10 10-9 10-8
102
103
104
102
103
Concentration (M) Concentration (M)
Fig. 4. Multiplexed assays against cytokine markers in whole blood. Fluores-cent detection reagents against both analytes are coprinted as outer spots.Spots of cAb against IL-6 and TNFα are printed in the center of the array.(A) D4 image after incubation with whole chicken blood alone (without ana-lyte). For clarity, spots for cAb and PBS are indicated with white dotted lines.(B) Dose–response curves after exposure to whole chicken blood spiked with amixture of both IL-6 and TNFα analytes at varying concentrations. (C and D)Dose–response curves when assay exposed to varying concentrations of(C) IL-6 only or (D) TNFα only. Insets for panels B–D show D4 image data. Eachdata point represents mean ± SD from three separately run D4 arrays.
Joh et al. PNAS | Published online August 7, 2017 | E7057
ENGINEE
RING
PNASPL
US

As proof of concept, we conducted a small IRB-approved pilotstudy at Duke University Medical Center (DUMC) comparingserum leptin levels detected by the D4 assay versus clinicalELISA from 3 lean [body mass index (BMI) <10%] and 10 obese(BMI 83.9–99.58%) pediatric patients. We selected this patientpopulation to clinically test the D4 assay across a wide range ofleptin levels, as serum leptin levels are proportional to adiposemass (19, 20). Our pilot studies demonstrated high concordancebetween D4 and clinical ELISA (Fig. 5). Fig. 5A shows D4 imagesfrom a representative obese and lean patient in whole blood, im-mediately after blood draw. The obese patients exhibited higherfluorescence intensities (indicating higher leptin levels) than leanpatients (Fig. 5B), which is consistent with known adipocytokinephysiology. Significantly, we found that the leptin levels measuredby D4 correlated strongly with those measured by clinical ELISAperformed in parallel in a central laboratory at DUMC across all13 patients (P < 0.0001) (Fig. 5 E and F).The readout of D4 microarray chips shown thus far was
obtained using a sensitive table-top fluorescence scanner to as-sess the sensitivity of the D4 assay. While this approach wouldallow for POC testing in a peripheral laboratory near or attachedto a clinic in LRSs (21), we recognize that a table-top scanner istoo burdensome for use in the field. To address this issue, wenext investigated the feasibility of portable fluorescence imagingof the D4 assay using a mobile phone-based fluorescence mi-croscope (Fig. 6 and SI Appendix, Fig. S5). This apparatus is acompact and cost-effective imaging system that uses an externallens, in addition to the existing lens of the mobile phone camera(22, 23). The illumination is introduced at an oblique illumina-tion angle of ∼75° to increase the SNR of the acquired fluores-cence images on the phone.These experiments imaged leptin-D4 assays in both simulated
and patient samples. For comparison, we also imaged the sameset of D4 arrays (to maintain consistency) with the table-topscanner in the usual fashion. The fluorescence images in Fig. 6 Aand B depict representative cAb spots of leptin-D4s (with andwithout analyte) using the table-top scanner and the mobilephone-based imager, respectively. In both cases, the fluorescencereadout behaves as expected for leptin-spiked and leptin-deficient serum (left and right image panels), with good SNR.The dose–response curves using a dilution series of leptin-spikedcalf serum are shown in Fig. 6 A and B. Both scanner andmobile phone-based imaging modalities showed quantitative,dose-dependent fluorescence intensities. In this experiment,
the scanner was more sensitive than the mobile phone, withLODs determined to be 0.037 ng/mL and 0.71 ng/mL, re-spectively. We next imaged a set of leptin-D4 arrays againstclinical specimens obtained from obese patients in our pilotclinical study. The D4 readouts from the scanner (red trace)and from the mobile phone platform (blue trace) are shown inFig. 6C. In both cases, as expected the data show good corre-spondence with ELISA values (dashed black trace).Transitioning to the mobile phone-based detection platform
reduced detection sensitivity and interassay consistency, as seen bythe higher LOD and larger error bars with the mobile phone de-vice. Nevertheless, these proof-of-concept studies demonstrate thefeasibility of merging D4 assay technology with compact, field-portable, cost-effective, and easy-to-use mobile phone-based de-tection platforms. As mobile phone detector technology, compu-tational imaging, and sensing approaches continue to evolve weexpect that the fluorescence collection efficiency and hence sensi-tivity of these portable, low-cost detectors will rival table-topfluorescence scanners. Despite the lower sensitivity of this first-generation mobile phone detector, the field portability of mobilephone-based imaging provide a detection strategy that is well-matched to complement the robustness of the D4 assay technologywith FOM that are sufficient for many clinical applications.
Fig. 5. Pilot clinical studies using D4 to measure leptin levels in pediatricpatients. (A–D) Representative D4 imaging of whole blood specimens froman (A) obese patient and (B) lean patient immediately after blood draw. Forcomparison, D4 data of (C) whole chicken blood (WCB) spiked with 1 ng/mLhuman leptin (D) and human leptin-negative chicken blood alone are alsoshown. (E) D4 fluorescence readout compared with results from standardsandwich immunoassay in all patients. D4 data are shown in red and sandwichimmunoassay data in black. (Inset) Zoomed graph of lean patients alone (NC =negative control serum). (F) Plot showing correlation between D4 versussandwich immunoassay (R-squared = 0.965; P < 0.0001, two-tailed t test).
A BScanner Mobile Phone
10-2 10-1 100 101 102 103
102
103
104
10-1 100 101 102 103103
104
Inte
nsity
(a.u
.)
Leptin (ng/mL)
Inte
nsity
(a.u
.)
Leptin (ng/mL)
O7 O3O10 O4 O5 O6 O2
0.5
1.0
0.5
1.0
SmartphoneScannerELISA
Norm
. D4
Inte
nsity
(a.u
.)
Norm. ELISA (a.u.)
C
LOD: 0.037 ng/mL LOD: 0.71 ng/mL
(+) analyte (-) analyte (+) analyte (-) analyte
Fig. 6. Mobile phone-based imaging of D4 arrays. (A and B) Representativeimage data of D4 microspots and dose–response curves in calf serum spikedwith leptin analyte acquired by a (A) benchtop scanner and (B) our mobilephone-based fluorescence microscope. Five-parameter logistic fit shown asred curve. (B, Inset) Illustration of the mobile phone attachment for fluo-rescence imaging and quantification of D4 arrays. (C) Testing of obese pa-tient serum with D4 using a scanner (red trace) versus the mobile phonemicroscope (blue trace), and comparison with ELISA results (dashed blacktrace). Normalized D4 data (scanner, phone) plotted on the left axis, andnormalized ELISA data plotted on the right axis.
E7058 | www.pnas.org/cgi/doi/10.1073/pnas.1703200114 Joh et al.

Storage Stability of D4. Because use of the leptin D4 POCT inLRSs would necessitate long-distance shipment of assay mate-rials to sites around the world, an important issue that needed tobe addressed is the need for a “cold chain” and the storagestability of D4 chips. We hence measured the performance ofD4 chips targeting leptin at different time points and under el-evated temperatures after chip fabrication. Fig. 7 comparesdose–response curves of leptin-D4s exposed to analyte-spikedcalf serum under different storage conditions. In Fig. 7A,vacuum-sealed packets containing leptin-D4 chips were stored1–92 d under ambient conditions. The data showed no significantdifference in assay performance. Likewise, we also observedminimal difference in assay performance when vacuum-sealedchips were stored at 45 °C for up to 120 h (5 d) (Fig. 7B).
DiscussionThe D4 POCT offers a promising platform for democratizingaccess to sensitive and quantitative assessment of diagnosticprotein biomarkers. We first showed proof-of-concept applica-tion of multiplexed detection of human immunoglobulins. Weobserved ELISA-like performance across a wide range of proteinanalytes when assayed in unmodified serum and blood andshowed the feasibility of quantification for multiple analytesfrom the same chip. Our pilot validation studies showed highconcordance between D4 and ELISA in human patients, sug-gesting that this platform may ultimately be translatable to theclinical setting. Next, we introduced the feasibility of combiningD4 chip technology with sensitive and cost-effective mobilephone readout for truly distributed use of the platform. Finally,the D4 chips showed durable storage stability, as evidenced byacceptable assay performance following exposure to heat orprolonged storage.Much work has been previously done toward developing POCT
platforms for LRSs. An “active” approach is to incorporate a fluidhandling system where the reagents are stored on the device sepa-rately and then mixed and washed using pumps and valves, or al-ternatively by mechanisms that are conceptually similar but withsmaller microfluidic devices (7, 24–27). This pioneering designstrategy has seen commercial success in some embodiments (e.g.,Abbott i-Stat) and shown encouraging field performance in others(26, 27). However, such systems have many parts, which increases thecomplexity and cost, and the finite possibility of malfunction fromeach individual component can limit the robustness of the device.To date, “passively” driven immunoassays have experienced the
most success as POCTs for protein analyte detection. LFIAs—themost widely used embodiment in LRSs—use nitrocellulose stripsimpregnated with dried capture/detection reagents that are pas-sively colocated by applying liquid; this design permits a low-cost,rapid approach to protein detection in a user-friendly manner(fluid application with or without premixing, sometimes followedby buffer addition step and/or signal amplification) (5, 28). Despite
its strengths, the LFIA is not a substitute for the ELISA for twomajor reasons. First, LFIAs provide semiquantitative or qualitativereadouts (in the absence of a dedicated reader), while conventionalELISA provides quantitative results with high accuracy and pre-cision. Second, most LFIAs are not as sensitive as ELISA (29–31),as more antigen-antibody (Ag–Ab) interactions are necessary togenerate a positive signal. This leads to certain clinical scenarios inwhich LFIA technology is unable to meet the required sensitivity tobe practically useful (32). Furthermore, PBDs have been ground-breaking in further evolving passively driven devices for use inLRSs and offer many advantages over existing POCTs for their lowcost, disposability, and ability to be assembled into multidimen-sional structures (33, 34). While a frequently encountered short-coming with PBDs has been limited sensitivity, several innovativesignal amplification techniques that reduce detection limit withoutsignificantly compromising usability have been described, mostnotably those using paper networks for automated sequential re-agent delivery (12, 15) and enzymatic amplification (35). Suchadvances have made PBDs a promising platform for “lab-on-a-chip” diagnostics; however, more work remains toward addressingissues such as controlling the consistency of paper matrices, theunderlying need for the sequential delivery of reagents and/orwashing, challenges with multiplex analysis, and further improvingdetection sensitivities (34, 36). In contrast, capillary-driven PMFs(e.g., MBio and Philips Minicare) have overcome challenges insensitivity faced by LFIAs and PBDs while retaining ease of use,with some platforms reaching subpicomolar LODs within 15 min(7, 37–42). By eliminating “active” elements (e.g., pumps), PMFsreduce the complexity and cost of microfluidic-based designs andsignificantly reduce instrumentation footprint compared withstandard assays. While PMFs show great promise, challengesremain in further reducing instrumentation footprint and/orlowering cost of readers to fulfill the accessibility and sustain-ability requirements that are critical for successful dissemina-tion and implementation in LRSs.Our contribution toward democratizing accesses to clinical
diagnostics—the D4—builds upon, but also departs significantlyfrom, the accomplishments of existing “passive” POCT designssuch as LFIAs, PBDs, and PMFs. The POEGMA interface is thecritical element responsible for the high performance and sim-plicity of the D4. In the D4, the POEGMA brush is nonfouling inits hydrated state. The hydrated POEGMA brush virtually elimi-nates nonspecific binding of cells, proteins, and other biomolecularnoise (8, 9, 43), yielding high SNRs even at low analyte concen-tration in complex matrices such as blood and obviates the need formicrofluidic separation (preprocessing) of cells.In the dry state, however, the POEGMA brush readily entraps
Abs that are inkjet-printed into the polymer brush. Printing cAbsonto the dry brush without excipient leads to their stable im-mobilization within the brush and prevents bleeding or dissolu-tion of cAb spots upon hydration with biological matrix (8). Thisleads to uniform capture spot morphology, which facilitatesquantification and analysis. In contrast, printing detection re-agents with an excess of soluble excipient onto the dry brushcreates a reservoir for assay reagents. Contact with blood orother aqueous fluid causes dissolution of the excipient in printedspots of the dAb and releases the dAb from the chip, and thereleased dAb freely diffuses across the surface and drives theassay to completion. The direct inkjet printing of reagents ontoPOEGMA brush is another key element of the D4 assay, as itallows precise control over assay geometry, spot concentration,and composition, without the need for covalent coupling steps,which simplifies assay fabrication. Like many existing “passive”designs, the D4 stores all necessary reagents on the same device,but it does so by inkjet printing capture and detection reagents invery close proximity onto a nonfouling polymer brush. This de-sign eliminates the need to control fluid movement with fluidics orinclude sequential liquid transfer steps. Combined, these features
Inte
nsity
(a.u
.)
BA
Leptin (M)Leptin (M)
45 oC (120 hr)Ambient (24 hr)
10-13 10-12 10-11 10-10 10-9 10-8 10-7102
103
104
105
102
103
104
10-13 10-12 10-11 10-10 10-9 10-8 10-7102
103
104
105
102
103
104
105
Day 1Day 92
Fig. 7. Storage stability of the D4. Leptin-D4 chips were stored in vacuum-sealed packets under the conditions described and then run in analyte-spiked calf serum. (A) Dose–response curves for leptin-D4 after 1 d (○) and92 d (▪) of storage in ambient temperature show similar performance.(B) Dose–response curves for leptin-D4 after 24 h of ambient storage versus120 h (5 d) of storage at 45 °C show similar performance.
Joh et al. PNAS | Published online August 7, 2017 | E7059
ENGINEE
RING
PNASPL
US

of the D4 platform translate to a robust, self-contained, and quan-titative POCT without compromising assay performance or cost.The low-cost fabrication of the D4 and smartphone-based
reader, coupled to its sensitivity and quantitative performance,may offer a scalable and sustainable route to manufacturingmultiplexed immunoassays for LRSs that are both affordableand analytically robust. When produced in bulk, we estimate thatD4 chips would cost <$1 each (SI Appendix, Table S1) and the3D-printed mobile phone attachment would cost <$30 each. Interms of workflow, we envision that the D4 platform can providea streamlined protocol for protein analyte detection in bothhealthcare and research settings and can expand the capabilitiesof both. The ability to achieve multiplexed results with ELISA-like sensitivity after a single incubation/rinse step and withoutblocking greatly simplifies protein quantification, reduces time toresults, and ultimately lowers costs. Admittedly, creating a mul-tiplexed test in LFIA format is also relatively straightforward asit involves spotting multiple capture reagents onto a strip oradding additional test “lines.” However, the LFIA is highly dy-namic, as its constituents are constantly changing at a given locationacross a test strip and never fully equilibrate. Subsequently, assayreadout relies on binding kinetics specifically during which reactantsare sufficiently close to interact on a molecular level, and this variesfor each individual test. Unless each test is isolated from the others,the same assay condition (e.g., running buffer, porous membrane,and flow rate) is applied to all tests, and one set of conditions is oftennot optimal for the multiple analytes of interest. While isolation ofindividual tests is not overly difficult and various strategies to this endare available (44), this adds to complexity of sample handling andcost. In contrast, the design of the D4 assay—by effectively coloc-alizing the detection and capture reagents and relying on 2D diffu-sion and equilibration “above” a nonfouling polymer brush—allowsmultiplexing without significantly increasing the assay complexity.Difficulty in storage is a major factor restricting the imple-
mentation of laboratory-based tests in LRSs. We speculate that thestorage stability of D4 is related to the high oligo(ethylene glycol)density of the POEGMA “bottle brush,” which provide a protectiveenvironment that stabilizes the printed proteins against denaturation(8, 45). To put our results into context, LFIAs are already well-suited for LRSs since they are generally stable for 1 to 2 y at am-bient temperature and 6 mo at elevated temperature (45 °C) (16),and similar reagent stability has also been shown in other POCTs(46, 47) . The timescales for storage stability used in our studies withthe D4 (Fig. 7) were shorter than those determined for LFIAs.Thus, while encouraging, we recognize that further studies are re-quired to characterize the storage limitations of the D4 and, ifneeded, modifying packing and/or printing solutions with existingmethods for reagent stabilization (35, 48) to meet the storage de-mands of LRSs.For patient care, we envision that this technology will provide
a robust POCT that is widely applicable for the diagnosis of adisease by quantification of the levels of one or more markers forwhich orthogonal Ab pairs are available. In the developed world,this will bring highly sensitive immunoassays to first respondersand to the bedside, while in LRSs it will allow them to simplybecome more routinely available. The low cost of the chips anddetectors also suggests that wide dissemination of this technologyis feasible, so that it would also provide new opportunities forspatiotemporal mapping and remote analysis of measurementresults, which would be highly valuable for epidemiology ingeneral. However, it is worthwhile to note that the actual needfor ELISA-like sensitivities depends on the disease and bio-marker, which must be considered when deciding between theD4 POCT and other robust alternatives such as LFIAs or PBDswhen such sensitivities are not required.There are several challenges that still need to be resolved. The
first is the requirement to remove the blood from the chip beforeimaging. Because proteins do not adsorb to the POEGMA brush
surface and cells similarly do not adhere and are only settled onto the surface by gravity, removal of the blood from the chip iscurrently easy to perform using a buffer rinse. We acknowledge,however, that the open wash requirement is not ideal for bio-safety reasons and possible specimen contamination. The abilityto read out the assay in a sealed system with an automated washor even in the presence of blood would make this a completelyhands-off POCT, which is desirable. We are currently pursuingseveral solutions to this problem, including a PMF-basedenclosed chip design that passively removes the blood beforereadout, as well as electronic modes of detection where theblood does not interfere with the signal, which will be reportedseparately. The second issue is the sensitivity of the fluorescencedetector. While the current design of the cell phone detector issensitive enough for many clinical applications, we believe thatoptimization of the detector design will yield the necessary 10- to20-times improvement to match the performance of table-topfluorescence scanners that are the “gold standard” for imagingmicroarrays. This assessment is supported by reports of mobilephone-based fluorescence imaging of individual fluorescentnanoparticles and viruses (22) and fluorescently labeled singleDNA molecules (23). Third, while the ubiquitous nature ofmobile phones makes it a promising platform for dedicated andnondedicated POCT platforms, there will be challenges witheffectively integrating them into healthcare systems. A thoroughdiscussion of this topic is provided in the review by Byrnes et al.(33), but in brief, issues related to developing protocols fortransmitting and interpreting results and subsequently makingmanagement decisions from POC data must be resolved. Fur-thermore, the diversity of phone models and short life cycles inboth hardware and software lead to challenges in compatibilityand maintaining common standards; the slow pace of regulatoryapproval also introduces its own set of obstacles. However, theseare challenges faced by the entire field of mobile phone-baseddiagnostics and are not limited to the D4 POCT. We believe thewidespread dissemination of phones, their user friendliness, andtheir computing power make them very attractive vehicles to-ward democratizing access to gold-standard diagnostic testing. Inconclusion, the D4 POCT, combined with the field portabilityof mobile phone-based imaging, may pave the way for high-performance and user-friendly diagnostic immunoassays thatare virtually independent from infrastructural requirements.
Materials and MethodsSI-ATRP of POEGMA on SiO2 Substrates. In brief, POEGMA surfaces were de-posited by SI-ATRP, specifically using an activator regenerated by electrontransfer approach under aqueous conditions (49, 50). The experimentalconditions used to create POEGMA polymer brush coatings “grafted from”
substrate surfaces for our experiment are described in extensive detailelsewhere (8). These methods involve first functionalizing the substratesurface with a bromide ATRP initiator and then immersing the substrates inpolymerization solution, producing surface-tethered brushes of POEGMA∼50 nm thick.
Spotting of Antibody Microarrays. All capture/detection Ab pairs and Ag wereobtained from R&D Systems. The dAbs were directly conjugated to fluo-rophores per the manufacturer’s instructions. The cAbs (1 mg/mL) werespotted onto POEGMA-coated substrates using a PerkinElmer Piezorraynoncontact printer under ambient conditions at 1 mg/mL concentration.Spots of soluble detection reagents were composed of dAbs (1 mg/mL)mixed with excipient (1 mg/mL PEG 115,000 or 0.25 mg/mL trehalose)and printed in a similar fashion. For experiments using fingerstick blood(Fig. 2), spots of heparin were also included in arrays to maintain anti-coagulation. After printing, D4 chips were placed under vacuum dessication(30 KPa) overnight to facilitate noncovalent immobilization of Abs into thepolymer brush.
D4 Immunoassay. To generate dose–response curves, D4 chips were in-cubated with dilution series of analyte-spiked calf serum (Clontech) or wholechicken blood (Innovative Research, Inc.) for 90 min. Substrates were then
E7060 | www.pnas.org/cgi/doi/10.1073/pnas.1703200114 Joh et al.

briefly rinsed in 0.1% Tween-20/PBS then dried. Arrays were imaged on anAxon Genepix 4400 tabletop scanner (Molecular Devices, LLC). The limit-of-blank (LOB) was estimated from the mean fluorescence intensity (μ) and SD(σ) from 10 blank samples, defined as LOB = μblank + 1.645σblank, as describedby Armbruster and Pry (51). LOD was estimated from spiked low-concentration samples (LCS) above the LOB, such that LOD = LOB +1.645σLCS. Low, intermediate, and high concentrations within the workingrange of each assay were used to determine the COVintra and COVinter. Thedynamic range (DR) was defined as the range of concentrations from theLOD to the greatest concentration that had a fluorescence signal greaterthan 3σ of that from the next-lower concentration in the dilutions series.Data were fit to a five-parameter logistic (5-PL) fit curve (52) using OriginPro9.0 (OriginLab Corp.). Details on the effect of shorter incubation times(15 min and 60 min) on assay results are shown in SI Appendix, Fig. S2.
D4 and ELISA Measurements of Patient Leptin. Approval for clinical studies wasobtained from the Duke University Health System Institutional Review Board(protocol no. Pro00064838). Parental assent and subject assent were firstobtained, and then 0.5–1.0 mL of blood was drawn in a lavender-top col-lection tube containing K2-EDTA. For D4 assays in whole blood the bloodwas directly applied to D4 chips immediately after collection then processedand analyzed as usual. For D4-sandwich immunoassay comparisons the tubewas then centrifuged for 10 min at 1,500 × g, and the resulting serum wasaliquoted into cryovials and stored at −80 °C for later use. Samples werethen thawed and analyzed with D4 and ELISA in parallel. Standard leptinsandwich immunoassays (Quantikine ELISA kit; R&D Systems) were per-formed per the manufacturer’s instructions, which required a 100× dilutionwith assay diluent buffer for all specimens. For D4 measurements, specimensfrom lean patients were directly run without dilution. In contrast, we foundthat two obese patient specimens had extremely high leptin levels, abovethe upper limit of quantitation of the leptin D4. Thus, all specimens fromobese patients (to maintain consistency) were diluted 10× with whole calfserum (and not sandwich immunoassay diluent buffer, to effectively main-tain complexity of the biological milieu) before running the leptin D4.
Mobile-Phone Imaging of D4 Arrays. The mobile phone-based D4 assay readerdevice was created by integrating a 3D-printed optomechanical attachmentto a smartphone (Lumia 1020; Nokia) which included an oblique illuminationsource for highly sensitive fluorescence detection (SI Appendix, Fig. S5) (22,23). A standard microscope slide can be inserted into the smartphone at-
tachment from the side and illuminated by an excitation beam from abattery-powered laser diode (638 nm, 180 mW; Mitsubishi Electric) at anincidence of ∼75° from the back side (SI Appendix, Fig. S5A). The fluores-cence signal of the sample was collected from the other side of the glassslide by an external lens (f2 = 2.6 mm; UCTronics) and passed through anemission filter (690/50 nm; Semrock) before entering the smartphone cam-era unit (SI Appendix, Fig. S5A). The smartphone camera is equipped with a2/3-inch complementary metal-oxide semiconductor sensor with 41 mega-pixels and 1.12 μm in pixel pitch. The default smartphone camera lens as-sembly (Carl Zeiss) has an effective focal length of f1 = ∼6.86 mm, andtherefore the nominal magnification (M) of the smartphone-based fluo-rescence microscope is M = ∼2.6× . This mobile microscope design provides ahalf-pitch resolution of ∼0.98 μm over an imaging field of view of ∼0.8 mm2
as characterized earlier (53). The size of the device is about 14.5 × 8.0 ×7.8 cm in length, width, and height, respectively, and the weight of theattachment excluding the smartphone is ∼185 g. For a typical fluorescenceimage, an integration time of 4 s was used on the mobile phone. Fluores-cence images were initially saved in raw DNG format (7,152 × 5,368 pixels)on the phone memory and subsequently converted into 16-bit TIFF for fur-ther analysis. Image analysis and quantification were performed by ImageJon a desktop computer for this study and can be conducted by a custom-developed smart application running on the same phone in future designs.
ACKNOWLEDGMENTS. We thank John Horton for technical support withmicroarray imaging and Dr. Michael Muehlbauer and Huaxia Cui at the DukeMolecular Physiology Institute for assistance with clinical ELISA. We alsothank Dr. Robert Benjamin and Teri R. Willis for assistance with procuringclinical samples. D.Y.J. was supported by the Duke Medical Scientist TrainingProgram (T32GM007171), and K.M. was supported by a T32 grant from theNational Institute of Diabetes and Digestive and Kidney Diseases. Theauthors gratefully acknowledge funding support from National Heart, Lung,and Blood Institute Grants 1R21HL115410-01 and 7R41HL123871-02; Na-tional Cancer Institute Grant 1UG3CA211232-01; National Center for Ad-vancing Translational Sciences Grant UL1TR001117; and Department ofDefense United States Special Operations Command Grant W81XWH-16-C-0219. Funding support was also received from the Duke Global HealthInstitute, Duke-Coulter Translational Partnership, Humanitarian InnovationFund, and European Commission. The content reflects the views of theauthors and does not necessarily represent the official views of thesupporting organizations.
1. Drain PK, et al. (2014) Diagnostic point-of-care tests in resource-limited settings.Lancet Infect Dis 14:239–249.
2. Hay Burgess DC, Wasserman J, Dahl CA (2006) Global health diagnostics. Nature 444:1–2.
3. Urdea M, et al. (2006) Requirements for high impact diagnostics in the developingworld. Nature 444:73–79.
4. Hu L, Xu G (2010) Applications and trends in electrochemiluminescence. Chem Soc Rev39:3275–3304.
5. Posthuma-Trumpie GA, Korf J, van Amerongen A (2009) Lateral flow (immuno)assay:Its strengths, weaknesses, opportunities and threats. A literature survey. Anal BioanalChem 393:569–582.
6. Nilghaz A, Guan L, Tan W, Shen W (2016) Advances of paper-based microfluidics fordiagnostics—The original motivation and current status. ACS Sensors 1:1382–1393.
7. Chin CD, Linder V, Sia SK (2012) Commercialization of microfluidic point-of-care di-agnostic devices. Lab Chip 12:2118–2134.
8. Hucknall A, et al. (2009) Simple fabrication of antibody microarrays on nonfoulingpolymer brushes with femtomolar sensitivity for protein analytes in serum and blood.Adv Mater 21:1968–1971.
9. Ma H, Li D, Sheng X, Zhao B, Chilkoti A (2006) Protein-resistant polymer coatings onsilicon oxide by surface-initiated atom transfer radical polymerization. Langmuir 22:3751–3756.
10. Selby C (1999) Interference in immunoassay. Ann Clin Biochem 36:704–721.11. Krishnan S, Weinman CJ, Ober CK (2008) Advances in polymers for anti-biofouling
surfaces. J Mater Chem 18:3405–3413.12. Fu E, et al. (2011) Enhanced sensitivity of lateral flow tests using a two-dimensional
paper network format. Anal Chem 83:7941–7946.13. Liang T, et al. (2016) Investigation of reagent delivery formats in a multivalent ma-
laria sandwich immunoassay and implications for assay performance. Anal Chem 88:2311–2320.
14. Schonhorn JE, et al. (2014) A device architecture for three-dimensional, patternedpaper immunoassays. Lab Chip 14:4653–4658.
15. Fu E, Lutz B, Kauffman P, Yager P (2010) Controlled reagent transport in disposable2D paper networks. Lab Chip 10:918–920.
16. O’Farrell B (2009) Evolution in Lateral Flow-Based Immunoassay Systems (Humana,New York).
17. Buckley CE, 3rd, Dorsey FC (1971) Serum immunoglobulin levels throughout the life-span of healthy man. Ann Intern Med 75:673–682.
18. Bartz S, et al. (2014) Severe acute malnutrition in childhood: Hormonal and metabolicstatus at presentation, response to treatment, and predictors of mortality. J ClinEndocrinol Metab 99:2128–2137.
19. Considine RV, et al. (1996) Serum immunoreactive-leptin concentrations in normal-weight and obese humans. N Engl J Med 334:292–295.
20. Heptulla R, et al. (2001) Temporal patterns of circulating leptin levels in lean andobese adolescents: Relationships to insulin, growth hormone, and free fatty acidsrhythmicity. J Clin Endocrinol Metab 86:90–96.
21. Pai NP, Vadnais C, Denkinger C, Engel N, Pai M (2012) Point-of-care testing for in-fectious diseases: Diversity, complexity, and barriers in low- and middle-incomecountries. PLoS Med 9:e1001306.
22. Wei Q, et al. (2013) Fluorescent imaging of single nanoparticles and viruses on a smartphone. ACS Nano 7:9147–9155.
23. Wei Q, et al. (2014) Imaging and sizing of single DNA molecules on a mobile phone.ACS Nano 8:12725–12733.
24. Gervais L, de Rooij N, Delamarche E (2011) Microfluidic chips for point-of-care im-munodiagnostics. Adv Mater 23:H151–H176.
25. Linder V (2007) Microfluidics at the crossroad with point-of-care diagnostics. Analyst(Lond) 132:1186–1192.
26. Chin CD, et al. (2011) Microfluidics-based diagnostics of infectious diseases in thedeveloping world. Nat Med 17:1015–1019.
27. Laksanasopin T, et al. (2015) A smartphone dongle for diagnosis of infectious diseasesat the point of care. Sci Transl Med 7:273re271.
28. O’Connor TP (2015) SNAP assay technology. Top Companion Anim Med 30:132–138.29. Linares EM, Kubota LT, Michaelis J, Thalhammer S (2012) Enhancement of the de-
tection limit for lateral flow immunoassays: Evaluation and comparison of bio-conjugates. J Immunol Methods 375:264–270.
30. Gordon J, Michel G (2008) Analytical sensitivity limits for lateral flow immunoassays.Clin Chem 54:1250–1251.
31. Rifai N, Gillette MA, Carr SA (2006) Protein biomarker discovery and validation: Thelong and uncertain path to clinical utility. Nat Biotechnol 24:971–983.
32. St John A, Price CP (2014) Existing and emerging technologies for point-of-caretesting. Clin Biochem Rev 35:155–167.
33. Byrnes S, Thiessen G, Fu E (2013) Progress in the development of paper-based diag-nostics for low-resource point-of-care settings. Bioanalysis 5:2821–2836.
34. Yetisen AK, Akram MS, Lowe CR (2013) Paper-based microfluidic point-of-care di-agnostic devices. Lab Chip 13:2210–2251.
Joh et al. PNAS | Published online August 7, 2017 | E7061
ENGINEE
RING
PNASPL
US

35. Ramachandran S, Fu E, Lutz B, Yager P (2014) Long-term dry storage of an enzyme-based reagent system for ELISA in point-of-care devices. Analyst (Lond) 139:1456–1462.
36. Liana DD, Raguse B, Gooding JJ, Chow E (2012) Recent advances in paper-basedsensors. Sensors (Basel) 12:11505–11526.
37. Venge P, et al. (2017) Equal clinical performance of a novel point-of-care cardiactroponin I (cTnI) assay with a commonly used high-sensitivity cTnI assay. Clin ChimActa 469:119–125.
38. Kemper DWM, et al. (2017) Analytical evaluation of a new point of care system formeasuring cardiac Troponin I. Clin Biochem 50:174–180.
39. McGrath TF, et al. (2015) Development of a rapid multiplexed assay for the directscreening of antimicrobial residues in raw milk. Anal Bioanal Chem 407:4459–4472.
40. Logan C, et al. (2016) Rapid multiplexed immunoassay for detection of antibodies toKaposi’s sarcoma-associated herpesvirus. PLoS One 11:e0163616.
41. Broger T, et al. (2017) Diagnostic performance of tuberculosis-specific IgG antibodyprofiles in patients with presumptive tuberculosis from two continents. Clin Infect Dis64:947–955.
42. Lochhead MJ, et al. (2011) Rapid multiplexed immunoassay for simultaneous sero-diagnosis of HIV-1 and coinfections. J Clin Microbiol 49:3584–3590.
43. Ma HW, Hyun JH, Stiller P, Chilkoti A (2004) “Non-fouling” oligo(ethylene glycol)-functionalized polymer brushes synthesized by surface-initiated atom transfer radicalpolymerization. Adv Mater 16:338–341.
44. Li J, Macdonald J (2016) Multiplexed lateral flow biosensors: Technological advancesfor radically improving point-of-care diagnoses. Biosens Bioelectron 83:177–192.
45. Michel R, Pasche S, Textor M, Castner DG (2005) Influence of PEG architecture onprotein adsorption and conformation. Langmuir 21:12327–12332.
46. Anderson GP, et al. (1994) Development of an evanescent wave fiber optic biosensor.IEEE Eng Med Biol Mag 13:358–363.
47. Chan CP, et al. (2013) Evidence-based point-of-care diagnostics: Current status andemerging technologies. Annu Rev Anal Chem (Palo Alto, Calif) 6:191–211.
48. Ohtake S, Wang YJ (2011) Trehalose: Current use and future applications. J Pharm Sci100:2020–2053.
49. Simakova A, Averick SE, Konkolewicz D, Matyjaszewski K (2012) Aqueous ARGETATRP. Macromolecules 45:6371–6379.
50. Jakubowski W, Matyjaszewski K (2006) Activators regenerated by electron transferfor atom-transfer radical polymerization of (meth)acrylates and related block co-polymers. Angew Chem Int Ed Engl 45:4482–4486.
51. Armbruster DA, Pry T (2008) Limit of blank, limit of detection and limit of quanti-tation. Clin Biochem Rev 29:S49–S52.
52. Gottschalk PG, Dunn JR (2005) The five-parameter logistic: A characterization andcomparison with the four-parameter logistic. Anal Biochem 343:54–65.
53. Kühnemund M, et al. (2017) Targeted DNA sequencing and in situ mutation analysisusing mobile phone microscopy. Nat Commun 8:13913.
E7062 | www.pnas.org/cgi/doi/10.1073/pnas.1703200114 Joh et al.