Embed Size (px)
Citation preview
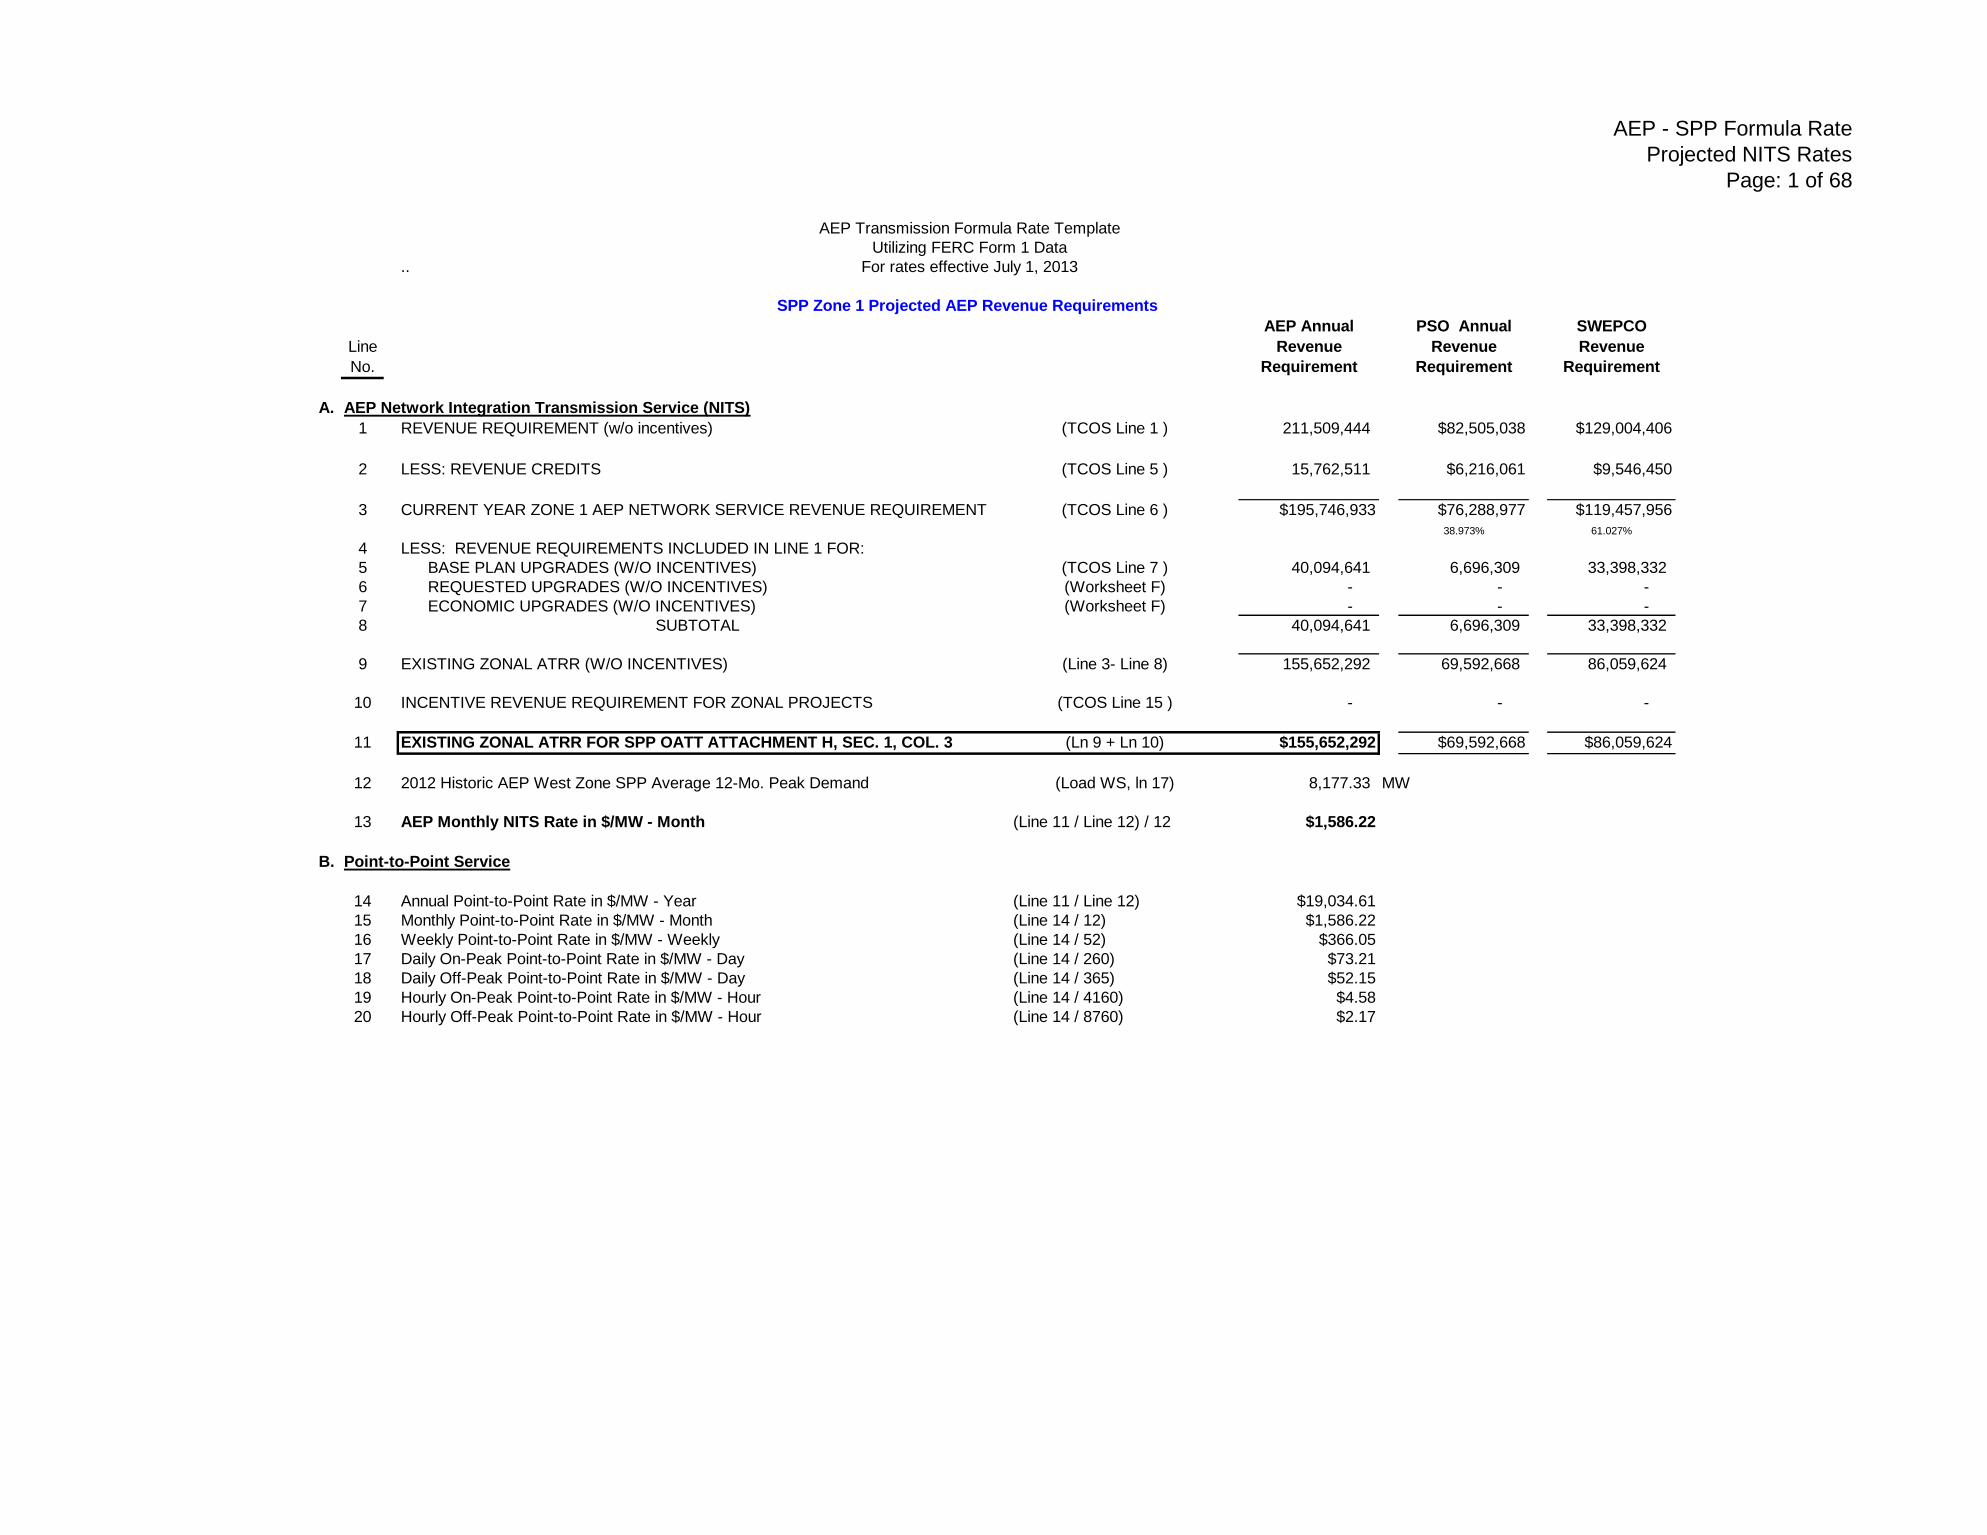
AEP - SPP Formula Rate
Projected NITS Rates
Page: 1 of 68
AEP Transmission Formula Rate Template
Utilizing FERC Form 1 Data
.. For rates effective July 1, 2013
SPP Zone 1 Projected AEP Revenue Requirements
AEP Annual PSO Annual SWEPCO
Line Revenue Revenue Revenue
No. Requirement Requirement Requirement
A. AEP Network Integration Transmission Service (NITS)
1 REVENUE REQUIREMENT (w/o incentives) (TCOS Line 1 ) 211,509,444 $82,505,038 $129,004,406
2 LESS: REVENUE CREDITS (TCOS Line 5 ) 15,762,511 $6,216,061 $9,546,450
3 CURRENT YEAR ZONE 1 AEP NETWORK SERVICE REVENUE REQUIREMENT (TCOS Line 6 ) $195,746,933 $76,288,977 $119,457,956
38.973% 61.027%
4 LESS: REVENUE REQUIREMENTS INCLUDED IN LINE 1 FOR:
5 BASE PLAN UPGRADES (W/O INCENTIVES) (TCOS Line 7 ) 40,094,641 6,696,309 33,398,332
6 REQUESTED UPGRADES (W/O INCENTIVES) (Worksheet F) - - -
7 ECONOMIC UPGRADES (W/O INCENTIVES) (Worksheet F) - - -
8 SUBTOTAL 40,094,641 6,696,309 33,398,332
9 EXISTING ZONAL ATRR (W/O INCENTIVES) (Line 3- Line 8) 155,652,292 69,592,668 86,059,624
10 INCENTIVE REVENUE REQUIREMENT FOR ZONAL PROJECTS (TCOS Line 15 ) - - -
11 EXISTING ZONAL ATRR FOR SPP OATT ATTACHMENT H, SEC. 1, COL. 3 (Ln 9 + Ln 10) $155,652,292 $69,592,668 $86,059,624
12 2012 Historic AEP West Zone SPP Average 12-Mo. Peak Demand (Load WS, ln 17) 8,177.33 MW
13 AEP Monthly NITS Rate in $/MW - Month (Line 11 / Line 12) / 12 $1,586.22
B. Point-to-Point Service
NTEC
14 Annual Point-to-Point Rate in $/MW - Year (Line 11 / Line 12) $19,034.61 $483.96
15 Monthly Point-to-Point Rate in $/MW - Month (Line 14 / 12) $1,586.22 $40.33
16 Weekly Point-to-Point Rate in $/MW - Weekly (Line 14 / 52) $366.05 $9.28
17 Daily On-Peak Point-to-Point Rate in $/MW - Day (Line 14 / 260) $73.21 $1.86
18 Daily Off-Peak Point-to-Point Rate in $/MW - Day (Line 14 / 365) $52.15 $1.33
19 Hourly On-Peak Point-to-Point Rate in $/MW - Hour (Line 14 / 4160) $4.58 $0.12
20 Hourly Off-Peak Point-to-Point Rate in $/MW - Hour (Line 14 / 8760) $2.17 $0.06

AEP - SPP Formula Rate
Schedule 1 Rates
Page: 2 of 68
AEP Transmission Formula Rate Template
Utilizing FERC Form 1 Data
For rates effective July 1, 2013
SPP SCHEDULE 1 AEP Revenue Requirements
AEP Annual PSO Annual SWEPCO Annual
Line Revenue Revenue Revenue
No. Requirement Requirement Requirement
A. Schedule 1 ARR For 2013 Projected Year
1 Total Load Dispatch & Scheduling (Account 561) (TCOS Line 77) $22,209,905 $10,929,770 $11,280,135
2 Less: Load Dispatch - Scheduling, System Control and Dispatch Services (321.88.b) $14,567,136 $7,256,250 $7,310,886
3 Less: Load Dispatch - Reliability, Planning & Standards Development Services (321.92.b) $2,167,974 $1,080,410 $1,087,564
4 Total 561 Internally Developed Costs (Line 1 - Line 2 - Line 3) $5,474,795 $2,593,110 $2,881,685
5 Less: PTP Service Credit (prior year Sched 1 revenue from PTP transactions) 541,200 $255,652 $285,548
6 PROJECTED ZONAL ARR FOR 2013 (Line 4 - Line 5) $4,933,595 $2,337,458 $2,596,137
47.378% 52.622%
B. Schedule 1 Projected 7/1/2013 Rate Calculations
7 2012 Historic AEP West Zone SPP Average 12-Mo. Peak Demand (Load WS, ln 17) 8,177.33 MW
8 Annual Point-to-Point Rate in $/MW - Year (Line 6 / Line 7) $603.33
9 Monthly Point-to-Point Rate (ln 8 / 12) $/MW - Month (Line 8 / 12) $50.28
10 Weekly Point-to-Point Rate (ln 8 / 52) $/MW - Weekly (Line 8 / 52) $11.60
11 Daily Off-Peak Point-to-Point Rate (ln 8 / 365) $/MW - Day (Line 8 / 365) $1.65
12 Hourly Off-Peak Point-to-Point Rate (ln 8 / 8760) $/MW - Hour (Line 8 / 8760) $0.07
AEP - SPP Formula Rate
Trued-Up NITS Rates
Page: 3 of 68
AEP Transmission Formula Rate Template
Calculation of True-Up Rate For Schedule 9
.. For Calendar Year 2012
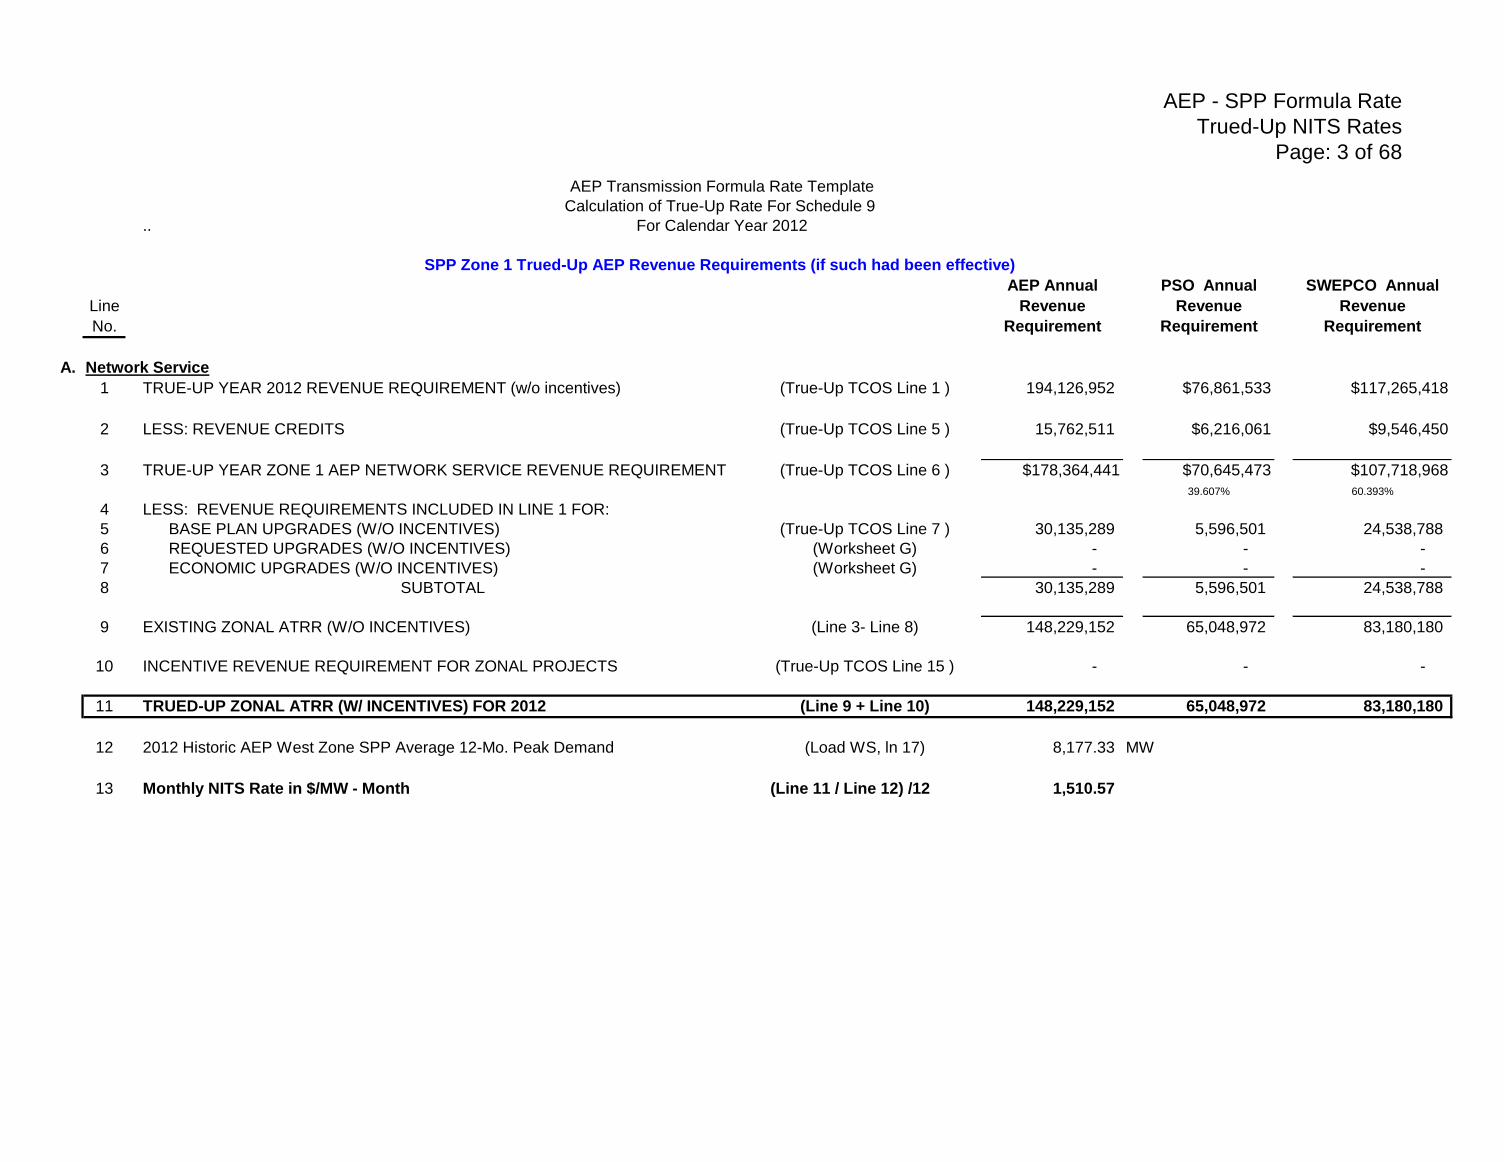
SPP Zone 1 Trued-Up AEP Revenue Requirements (if such had been effective)
AEP Annual PSO Annual SWEPCO Annual
Line Revenue Revenue Revenue
No. Requirement Requirement Requirement
A. Network Service
1 TRUE-UP YEAR 2012 REVENUE REQUIREMENT (w/o incentives) (True-Up TCOS Line 1 ) 194,126,952 $76,861,533 $117,265,418
2 LESS: REVENUE CREDITS (True-Up TCOS Line 5 ) 15,762,511 $6,216,061 $9,546,450
3 TRUE-UP YEAR ZONE 1 AEP NETWORK SERVICE REVENUE REQUIREMENT (True-Up TCOS Line 6 ) $178,364,441 $70,645,473 $107,718,968
39.607% 60.393%
4 LESS: REVENUE REQUIREMENTS INCLUDED IN LINE 1 FOR:
5 BASE PLAN UPGRADES (W/O INCENTIVES) (True-Up TCOS Line 7 ) 30,135,289 5,596,501 24,538,788
6 REQUESTED UPGRADES (W/O INCENTIVES) (Worksheet G) - - -
7 ECONOMIC UPGRADES (W/O INCENTIVES) (Worksheet G) - - -
8 SUBTOTAL 30,135,289 5,596,501 24,538,788
9 EXISTING ZONAL ATRR (W/O INCENTIVES) (Line 3- Line 8) 148,229,152 65,048,972 83,180,180
10 INCENTIVE REVENUE REQUIREMENT FOR ZONAL PROJECTS (True-Up TCOS Line 15 ) - - -
11 TRUED-UP ZONAL ATRR (W/ INCENTIVES) FOR 2012 (Line 9 + Line 10) 148,229,152 65,048,972 83,180,180
12 2012 Historic AEP West Zone SPP Average 12-Mo. Peak Demand (Load WS, ln 17) 8,177.33 MW
13 Monthly NITS Rate in $/MW - Month (Line 11 / Line 12) /12 1,510.57
AEP - SPP Formula Rate
Schedule 11 Revenue Requirements
Public Service Company of Oklahoma
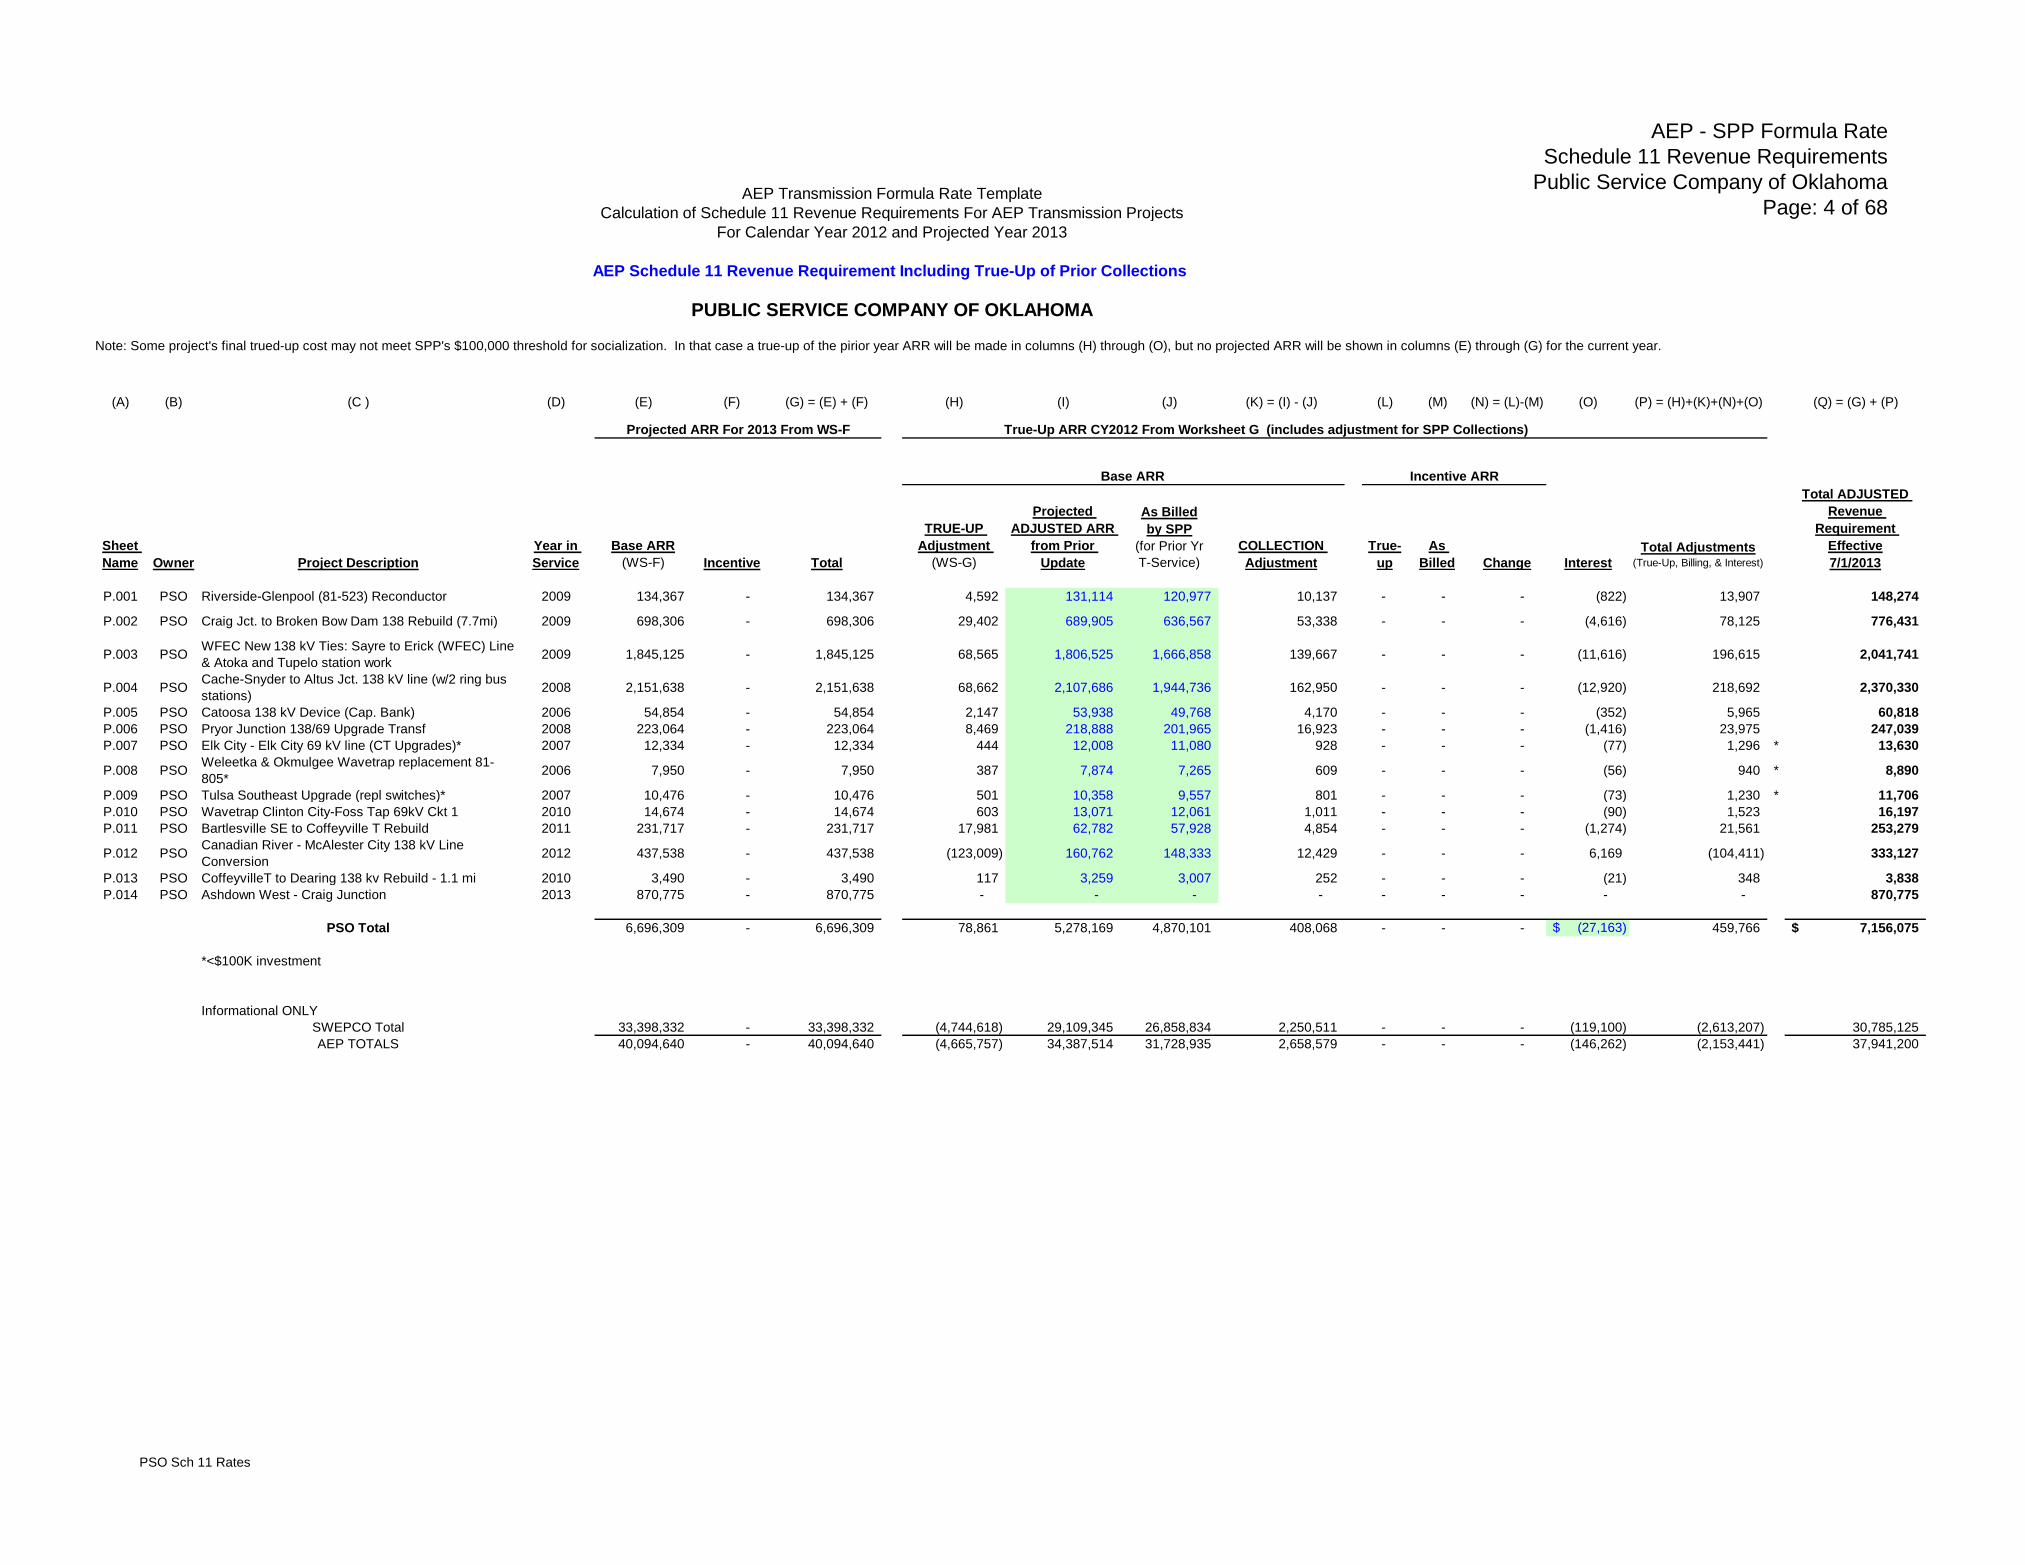
Page: 4 of 68AEP Transmission Formula Rate Template
Calculation of Schedule 11 Revenue Requirements For AEP Transmission Projects
For Calendar Year 2012 and Projected Year 2013
AEP Schedule 11 Revenue Requirement Including True-Up of Prior Collections
PUBLIC SERVICE COMPANY OF OKLAHOMA
Note: Some project's final trued-up cost may not meet SPP's $100,000 threshold for socialization. In that case a true-up of the pirior year ARR will be made in columns (H) through (O), but no projected ARR will be shown in columns (E) through (G) for the current year.
(A) (B) (C ) (D) (E) (F) (G) = (E) + (F) (H) (I) (J) (K) = (I) - (J) (L) (M) (N) = (L)-(M) (O) (P) = (H)+(K)+(N)+(O) (Q) = (G) + (P)
True-Up ARR CY2012 From Worksheet G (includes adjustment for SPP Collections)
Base ARR Incentive ARR
Sheet
Name Owner Project Description
Year in
Service
Base ARR
(WS-F) Incentive Total
TRUE-UP
Adjustment
(WS-G)
Projected
ADJUSTED ARR
from Prior
Update
As Billed
by SPP
(for Prior Yr
T-Service)
COLLECTION
Adjustment
True-
up
As
Billed Change Interest
Total Adjustments(True-Up, Billing, & Interest)
P.001 PSO Riverside-Glenpool (81-523) Reconductor 2009 134,367 - 134,367 4,592 131,114 120,977 10,137 - - - (822) 13,907 148,274
P.002 PSO Craig Jct. to Broken Bow Dam 138 Rebuild (7.7mi) 2009 698,306 - 698,306 29,402 689,905 636,567 53,338 - - - (4,616) 78,125 776,431
P.003 PSOWFEC New 138 kV Ties: Sayre to Erick (WFEC) Line
& Atoka and Tupelo station work2009 1,845,125 - 1,845,125 68,565 1,806,525 1,666,858 139,667 - - - (11,616) 196,615 2,041,741
P.004 PSOCache-Snyder to Altus Jct. 138 kV line (w/2 ring bus
stations)2008 2,151,638 - 2,151,638 68,662 2,107,686 1,944,736 162,950 - - - (12,920) 218,692 2,370,330
P.005 PSO Catoosa 138 kV Device (Cap. Bank) 2006 54,854 - 54,854 2,147 53,938 49,768 4,170 - - - (352) 5,965 60,818
P.006 PSO Pryor Junction 138/69 Upgrade Transf 2008 223,064 - 223,064 8,469 218,888 201,965 16,923 - - - (1,416) 23,975 247,039
P.007 PSO Elk City - Elk City 69 kV line (CT Upgrades)* 2007 12,334 - 12,334 444 12,008 11,080 928 - - - (77) 1,296 * 13,630
P.008 PSOWeleetka & Okmulgee Wavetrap replacement 81-
805*2006 7,950 - 7,950 387 7,874 7,265 609 - - - (56) 940 * 8,890
P.009 PSO Tulsa Southeast Upgrade (repl switches)* 2007 10,476 - 10,476 501 10,358 9,557 801 - - - (73) 1,230 * 11,706
P.010 PSO Wavetrap Clinton City-Foss Tap 69kV Ckt 1 2010 14,674 - 14,674 603 13,071 12,061 1,011 - - - (90) 1,523 16,197
P.011 PSO Bartlesville SE to Coffeyville T Rebuild 2011 231,717 - 231,717 17,981 62,782 57,928 4,854 - - - (1,274) 21,561 253,279
P.012 PSOCanadian River - McAlester City 138 kV Line
Conversion2012 437,538 - 437,538 (123,009) 160,762 148,333 12,429 - - - 6,169 (104,411) 333,127
P.013 PSO CoffeyvilleT to Dearing 138 kv Rebuild - 1.1 mi 2010 3,490 - 3,490 117 3,259 3,007 252 - - - (21) 348 3,838
P.014 PSO Ashdown West - Craig Junction 2013 870,775 - 870,775 - - - - - - - - - 870,775
PSO Total 6,696,309 - 6,696,309 78,861 5,278,169 4,870,101 408,068 - - - (27,163)$ 459,766 7,156,075$
*<$100K investment
Informational ONLY
SWEPCO Total 33,398,332 - 33,398,332 (4,744,618) 29,109,345 26,858,834 2,250,511 - - - (119,100) (2,613,207) 30,785,125
AEP TOTALS 40,094,640 - 40,094,640 (4,665,757) 34,387,514 31,728,935 2,658,579 - - - (146,262) (2,153,441) 37,941,200
Projected ARR For 2013 From WS-F
Total ADJUSTED
Revenue
Requirement
Effective
7/1/2013
PSO Sch 11 Rates
AEP - SPP Formula Rate
Schedule 11 Revenue Requirements
Southwestern Electric Power Company
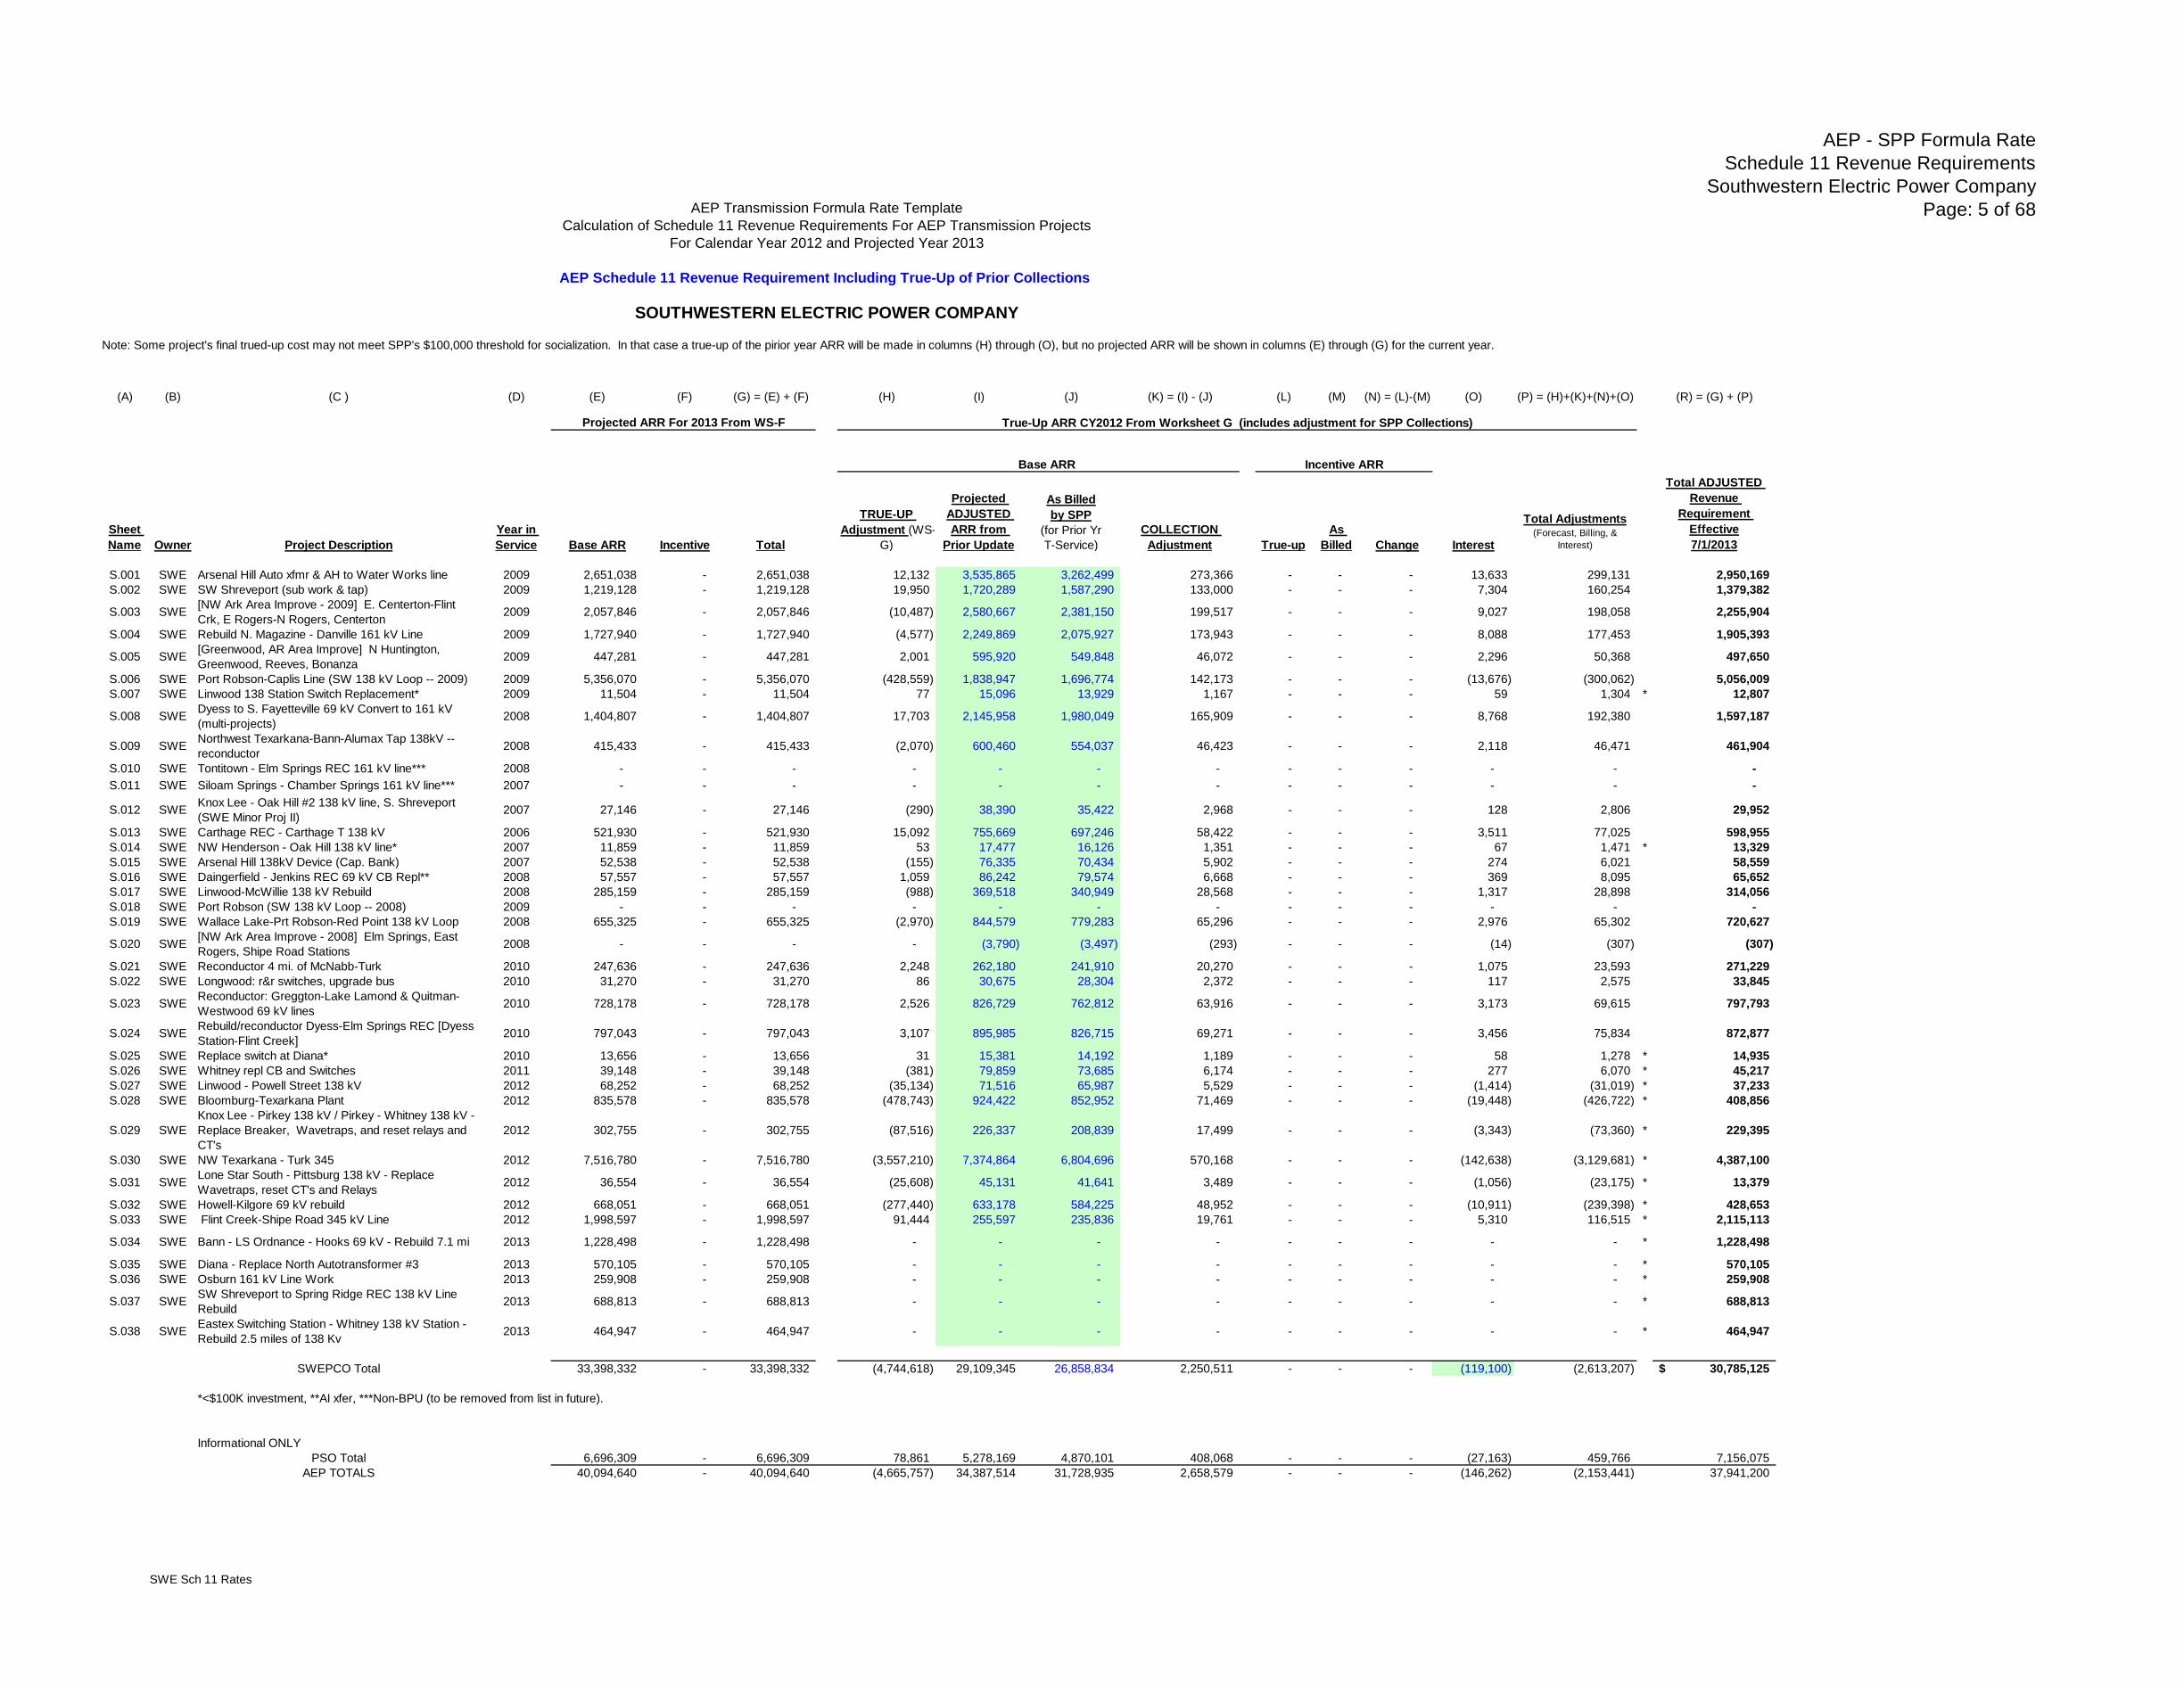
Page: 5 of 68AEP Transmission Formula Rate Template
Calculation of Schedule 11 Revenue Requirements For AEP Transmission Projects
For Calendar Year 2012 and Projected Year 2013
AEP Schedule 11 Revenue Requirement Including True-Up of Prior Collections
SOUTHWESTERN ELECTRIC POWER COMPANY
Note: Some project's final trued-up cost may not meet SPP's $100,000 threshold for socialization. In that case a true-up of the pirior year ARR will be made in columns (H) through (O), but no projected ARR will be shown in columns (E) through (G) for the current year.
(A) (B) (C ) (D) (E) (F) (G) = (E) + (F) (H) (I) (J) (K) = (I) - (J) (L) (M) (N) = (L)-(M) (O) (P) = (H)+(K)+(N)+(O) (R) = (G) + (P)
True-Up ARR CY2012 From Worksheet G (includes adjustment for SPP Collections)
Base ARR Incentive ARR
Sheet
Name Owner Project Description
Year in
Service Base ARR Incentive Total
TRUE-UP
Adjustment (WS-
G)
Projected
ADJUSTED
ARR from
Prior Update
As Billed
by SPP
(for Prior Yr
T-Service)
COLLECTION
Adjustment True-up
As
Billed Change Interest
Total Adjustments(Forecast, Billing, &
Interest)
S.001 SWE Arsenal Hill Auto xfmr & AH to Water Works line 2009 2,651,038 - 2,651,038 12,132 3,535,865 3,262,499 273,366 - - - 13,633 299,131 2,950,169
S.002 SWE SW Shreveport (sub work & tap) 2009 1,219,128 - 1,219,128 19,950 1,720,289 1,587,290 133,000 - - - 7,304 160,254 1,379,382
S.003 SWE[NW Ark Area Improve - 2009] E. Centerton-Flint
Crk, E Rogers-N Rogers, Centerton2009 2,057,846 - 2,057,846 (10,487) 2,580,667 2,381,150 199,517 - - - 9,027 198,058 2,255,904
S.004 SWE Rebuild N. Magazine - Danville 161 kV Line 2009 1,727,940 - 1,727,940 (4,577) 2,249,869 2,075,927 173,943 - - - 8,088 177,453 1,905,393
S.005 SWE[Greenwood, AR Area Improve] N Huntington,
Greenwood, Reeves, Bonanza2009 447,281 - 447,281 2,001 595,920 549,848 46,072 - - - 2,296 50,368 497,650
S.006 SWE Port Robson-Caplis Line (SW 138 kV Loop -- 2009) 2009 5,356,070 - 5,356,070 (428,559) 1,838,947 1,696,774 142,173 - - - (13,676) (300,062) 5,056,009
S.007 SWE Linwood 138 Station Switch Replacement* 2009 11,504 - 11,504 77 15,096 13,929 1,167 - - - 59 1,304 * 12,807
S.008 SWEDyess to S. Fayetteville 69 kV Convert to 161 kV
(multi-projects)2008 1,404,807 - 1,404,807 17,703 2,145,958 1,980,049 165,909 - - - 8,768 192,380 1,597,187
S.009 SWENorthwest Texarkana-Bann-Alumax Tap 138kV --
reconductor2008 415,433 - 415,433 (2,070) 600,460 554,037 46,423 - - - 2,118 46,471 461,904
S.010 SWE Tontitown - Elm Springs REC 161 kV line*** 2008 - - - - - - - - - - - - -
S.011 SWE Siloam Springs - Chamber Springs 161 kV line*** 2007 - - - - - - - - - - - - -
S.012 SWEKnox Lee - Oak Hill #2 138 kV line, S. Shreveport
(SWE Minor Proj II)2007 27,146 - 27,146 (290) 38,390 35,422 2,968 - - - 128 2,806 29,952
S.013 SWE Carthage REC - Carthage T 138 kV 2006 521,930 - 521,930 15,092 755,669 697,246 58,422 - - - 3,511 77,025 598,955
S.014 SWE NW Henderson - Oak Hill 138 kV line* 2007 11,859 - 11,859 53 17,477 16,126 1,351 - - - 67 1,471 * 13,329
S.015 SWE Arsenal Hill 138kV Device (Cap. Bank) 2007 52,538 - 52,538 (155) 76,335 70,434 5,902 - - - 274 6,021 58,559
S.016 SWE Daingerfield - Jenkins REC 69 kV CB Repl** 2008 57,557 - 57,557 1,059 86,242 79,574 6,668 - - - 369 8,095 65,652
S.017 SWE Linwood-McWillie 138 kV Rebuild 2008 285,159 - 285,159 (988) 369,518 340,949 28,568 - - - 1,317 28,898 314,056
S.018 SWE Port Robson (SW 138 kV Loop -- 2008) 2009 - - - - - - - - - - - - -
S.019 SWE Wallace Lake-Prt Robson-Red Point 138 kV Loop 2008 655,325 - 655,325 (2,970) 844,579 779,283 65,296 - - - 2,976 65,302 720,627
S.020 SWE[NW Ark Area Improve - 2008] Elm Springs, East
Rogers, Shipe Road Stations2008 - - - - (3,790) (3,497) (293) - - - (14) (307) (307)
S.021 SWE Reconductor 4 mi. of McNabb-Turk 2010 247,636 - 247,636 2,248 262,180 241,910 20,270 - - - 1,075 23,593 271,229
S.022 SWE Longwood: r&r switches, upgrade bus 2010 31,270 - 31,270 86 30,675 28,304 2,372 - - - 117 2,575 33,845
S.023 SWEReconductor: Greggton-Lake Lamond & Quitman-
Westwood 69 kV lines2010 728,178 - 728,178 2,526 826,729 762,812 63,916 - - - 3,173 69,615 797,793
S.024 SWERebuild/reconductor Dyess-Elm Springs REC [Dyess
Station-Flint Creek]2010 797,043 - 797,043 3,107 895,985 826,715 69,271 - - - 3,456 75,834 872,877
S.025 SWE Replace switch at Diana* 2010 13,656 - 13,656 31 15,381 14,192 1,189 - - - 58 1,278 * 14,935
S.026 SWE Whitney repl CB and Switches 2011 39,148 - 39,148 (381) 79,859 73,685 6,174 - - - 277 6,070 * 45,217
S.027 SWE Linwood - Powell Street 138 kV 2012 68,252 - 68,252 (35,134) 71,516 65,987 5,529 - - - (1,414) (31,019) * 37,233
S.028 SWE Bloomburg-Texarkana Plant 2012 835,578 - 835,578 (478,743) 924,422 852,952 71,469 - - - (19,448) (426,722) * 408,856
S.029 SWE
Knox Lee - Pirkey 138 kV / Pirkey - Whitney 138 kV -
Replace Breaker, Wavetraps, and reset relays and
CT's
2012 302,755 - 302,755 (87,516) 226,337 208,839 17,499 - - - (3,343) (73,360) * 229,395
S.030 SWE NW Texarkana - Turk 345 2012 7,516,780 - 7,516,780 (3,557,210) 7,374,864 6,804,696 570,168 - - - (142,638) (3,129,681) * 4,387,100
S.031 SWELone Star South - Pittsburg 138 kV - Replace
Wavetraps, reset CT's and Relays2012 36,554 - 36,554 (25,608) 45,131 41,641 3,489 - - - (1,056) (23,175) * 13,379
S.032 SWE Howell-Kilgore 69 kV rebuild 2012 668,051 - 668,051 (277,440) 633,178 584,225 48,952 - - - (10,911) (239,398) * 428,653
S.033 SWE Flint Creek-Shipe Road 345 kV Line 2012 1,998,597 - 1,998,597 91,444 255,597 235,836 19,761 - - - 5,310 116,515 * 2,115,113
S.034 SWE Bann - LS Ordnance - Hooks 69 kV - Rebuild 7.1 mi 2013 1,228,498 - 1,228,498 - - - - - - - - - * 1,228,498
S.035 SWE Diana - Replace North Autotransformer #3 2013 570,105 - 570,105 - - - - - - - - - * 570,105
S.036 SWE Osburn 161 kV Line Work 2013 259,908 - 259,908 - - - - - - - - - * 259,908
S.037 SWESW Shreveport to Spring Ridge REC 138 kV Line
Rebuild2013 688,813 - 688,813 - - - - - - - - - * 688,813
S.038 SWEEastex Switching Station - Whitney 138 kV Station -
Rebuild 2.5 miles of 138 Kv2013 464,947 - 464,947 - - - - - - - - - * 464,947
SWEPCO Total 33,398,332 - 33,398,332 (4,744,618) 29,109,345 26,858,834 2,250,511 - - - (119,100) (2,613,207) 30,785,125$
*<$100K investment, **AI xfer, ***Non-BPU (to be removed from list in future).
Informational ONLY
PSO Total 6,696,309 - 6,696,309 78,861 5,278,169 4,870,101 408,068 - - - (27,163) 459,766 7,156,075
AEP TOTALS 40,094,640 - 40,094,640 (4,665,757) 34,387,514 31,728,935 2,658,579 - - - (146,262) (2,153,441) 37,941,200
Projected ARR For 2013 From WS-F
Total ADJUSTED
Revenue
Requirement
Effective
7/1/2013
SWE Sch 11 Rates
AEP - SPP Formula Rate
Load Worksheet
Page: 6 of 68
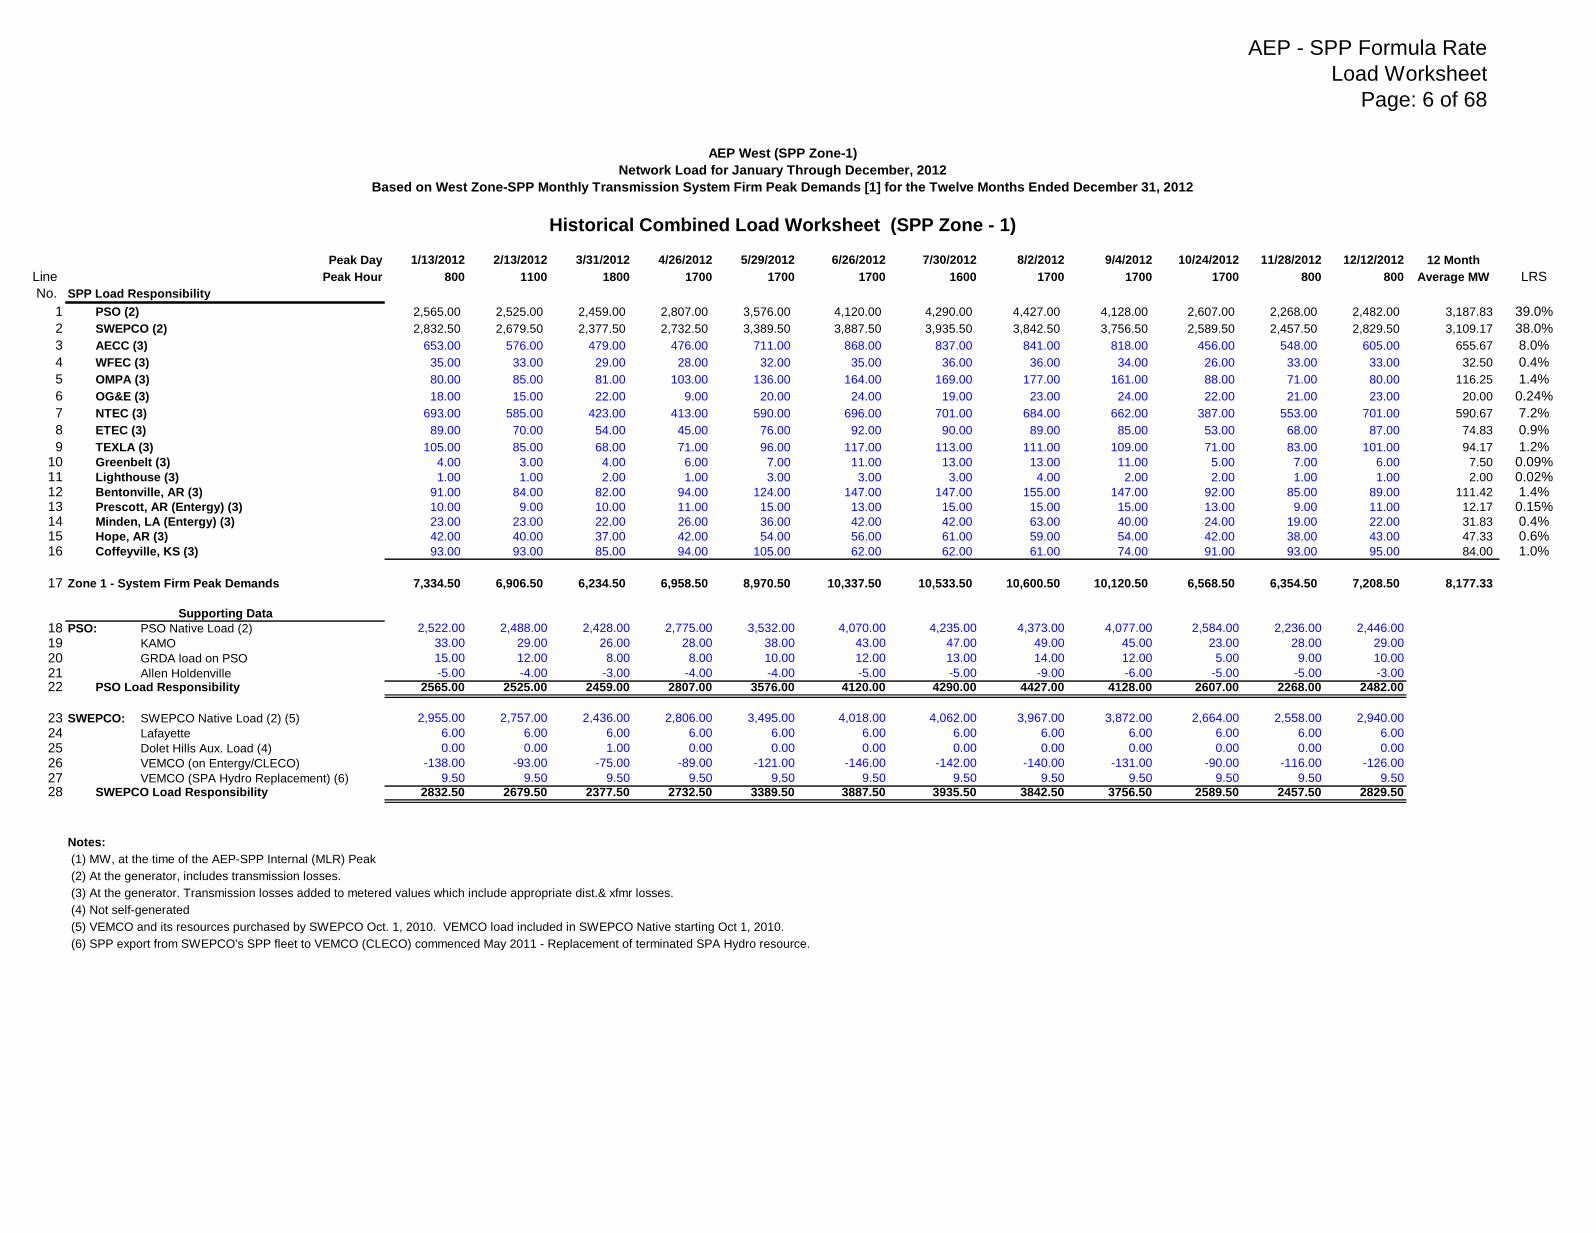
AEP West (SPP Zone-1)
Network Load for January Through December, 2012
Based on West Zone-SPP Monthly Transmission System Firm Peak Demands [1] for the Twelve Months Ended December 31, 2012
Historical Combined Load Worksheet (SPP Zone - 1)
Peak Day 1/13/2012 2/13/2012 3/31/2012 4/26/2012 5/29/2012 6/26/2012 7/30/2012 8/2/2012 9/4/2012 10/24/2012 11/28/2012 12/12/2012 12 Month
Line Peak Hour 800 1100 1800 1700 1700 1700 1600 1700 1700 1700 800 800 Average MW LRS
No. SPP Load Responsibility
1 PSO (2) 2,565.00 2,525.00 2,459.00 2,807.00 3,576.00 4,120.00 4,290.00 4,427.00 4,128.00 2,607.00 2,268.00 2,482.00 3,187.83 39.0%
2 SWEPCO (2) 2,832.50 2,679.50 2,377.50 2,732.50 3,389.50 3,887.50 3,935.50 3,842.50 3,756.50 2,589.50 2,457.50 2,829.50 3,109.17 38.0%
3 AECC (3) 653.00 576.00 479.00 476.00 711.00 868.00 837.00 841.00 818.00 456.00 548.00 605.00 655.67 8.0%
4 WFEC (3) 35.00 33.00 29.00 28.00 32.00 35.00 36.00 36.00 34.00 26.00 33.00 33.00 32.50 0.4%
5 OMPA (3) 80.00 85.00 81.00 103.00 136.00 164.00 169.00 177.00 161.00 88.00 71.00 80.00 116.25 1.4%
6 OG&E (3) 18.00 15.00 22.00 9.00 20.00 24.00 19.00 23.00 24.00 22.00 21.00 23.00 20.00 0.24%
7 NTEC (3) 693.00 585.00 423.00 413.00 590.00 696.00 701.00 684.00 662.00 387.00 553.00 701.00 590.67 7.2%
8 ETEC (3) 89.00 70.00 54.00 45.00 76.00 92.00 90.00 89.00 85.00 53.00 68.00 87.00 74.83 0.9%
9 TEXLA (3) 105.00 85.00 68.00 71.00 96.00 117.00 113.00 111.00 109.00 71.00 83.00 101.00 94.17 1.2%10 Greenbelt (3) 4.00 3.00 4.00 6.00 7.00 11.00 13.00 13.00 11.00 5.00 7.00 6.00 7.50 0.09%11 Lighthouse (3) 1.00 1.00 2.00 1.00 3.00 3.00 3.00 4.00 2.00 2.00 1.00 1.00 2.00 0.02%12 Bentonville, AR (3) 91.00 84.00 82.00 94.00 124.00 147.00 147.00 155.00 147.00 92.00 85.00 89.00 111.42 1.4%13 Prescott, AR (Entergy) (3) 10.00 9.00 10.00 11.00 15.00 13.00 15.00 15.00 15.00 13.00 9.00 11.00 12.17 0.15%14 Minden, LA (Entergy) (3) 23.00 23.00 22.00 26.00 36.00 42.00 42.00 63.00 40.00 24.00 19.00 22.00 31.83 0.4%15 Hope, AR (3) 42.00 40.00 37.00 42.00 54.00 56.00 61.00 59.00 54.00 42.00 38.00 43.00 47.33 0.6%16 Coffeyville, KS (3) 93.00 93.00 85.00 94.00 105.00 62.00 62.00 61.00 74.00 91.00 93.00 95.00 84.00 1.0%
17 Zone 1 - System Firm Peak Demands 7,334.50 6,906.50 6,234.50 6,958.50 8,970.50 10,337.50 10,533.50 10,600.50 10,120.50 6,568.50 6,354.50 7,208.50 8,177.33
Supporting Data
18 PSO: PSO Native Load (2) 2,522.00 2,488.00 2,428.00 2,775.00 3,532.00 4,070.00 4,235.00 4,373.00 4,077.00 2,584.00 2,236.00 2,446.00
19 KAMO 33.00 29.00 26.00 28.00 38.00 43.00 47.00 49.00 45.00 23.00 28.00 29.00
20 GRDA load on PSO 15.00 12.00 8.00 8.00 10.00 12.00 13.00 14.00 12.00 5.00 9.00 10.00
21 Allen Holdenville -5.00 -4.00 -3.00 -4.00 -4.00 -5.00 -5.00 -9.00 -6.00 -5.00 -5.00 -3.00
22 PSO Load Responsibility 2565.00 2525.00 2459.00 2807.00 3576.00 4120.00 4290.00 4427.00 4128.00 2607.00 2268.00 2482.00
23 SWEPCO: SWEPCO Native Load (2) (5) 2,955.00 2,757.00 2,436.00 2,806.00 3,495.00 4,018.00 4,062.00 3,967.00 3,872.00 2,664.00 2,558.00 2,940.00
24 Lafayette 6.00 6.00 6.00 6.00 6.00 6.00 6.00 6.00 6.00 6.00 6.00 6.00
25 Dolet Hills Aux. Load (4) 0.00 0.00 1.00 0.00 0.00 0.00 0.00 0.00 0.00 0.00 0.00 0.00
26 VEMCO (on Entergy/CLECO) -138.00 -93.00 -75.00 -89.00 -121.00 -146.00 -142.00 -140.00 -131.00 -90.00 -116.00 -126.00
27 VEMCO (SPA Hydro Replacement) (6) 9.50 9.50 9.50 9.50 9.50 9.50 9.50 9.50 9.50 9.50 9.50 9.50
28 SWEPCO Load Responsibility 2832.50 2679.50 2377.50 2732.50 3389.50 3887.50 3935.50 3842.50 3756.50 2589.50 2457.50 2829.50
Notes:
(1) MW, at the time of the AEP-SPP Internal (MLR) Peak
(2) At the generator, includes transmission losses.
(3) At the generator. Transmission losses added to metered values which include appropriate dist.& xfmr losses.
(4) Not self-generated
(5) VEMCO and its resources purchased by SWEPCO Oct. 1, 2010. VEMCO load included in SWEPCO Native starting Oct 1, 2010.
(6) SPP export from SWEPCO's SPP fleet to VEMCO (CLECO) commenced May 2011 - Replacement of terminated SPA Hydro resource.
AEP - SPP Formula Rate
PSO TCOS - Projected
Page: 7 of 68
AEP West SPP Member Companies
2013 Transmission Cost of Service Formula Rate
Utilizing Historic Cost Data for 2012 and Projected Net Plant at Year-End 2013
PUBLIC SERVICE COMPANY OF OKLAHOMA
Line Transmission
No. Amount
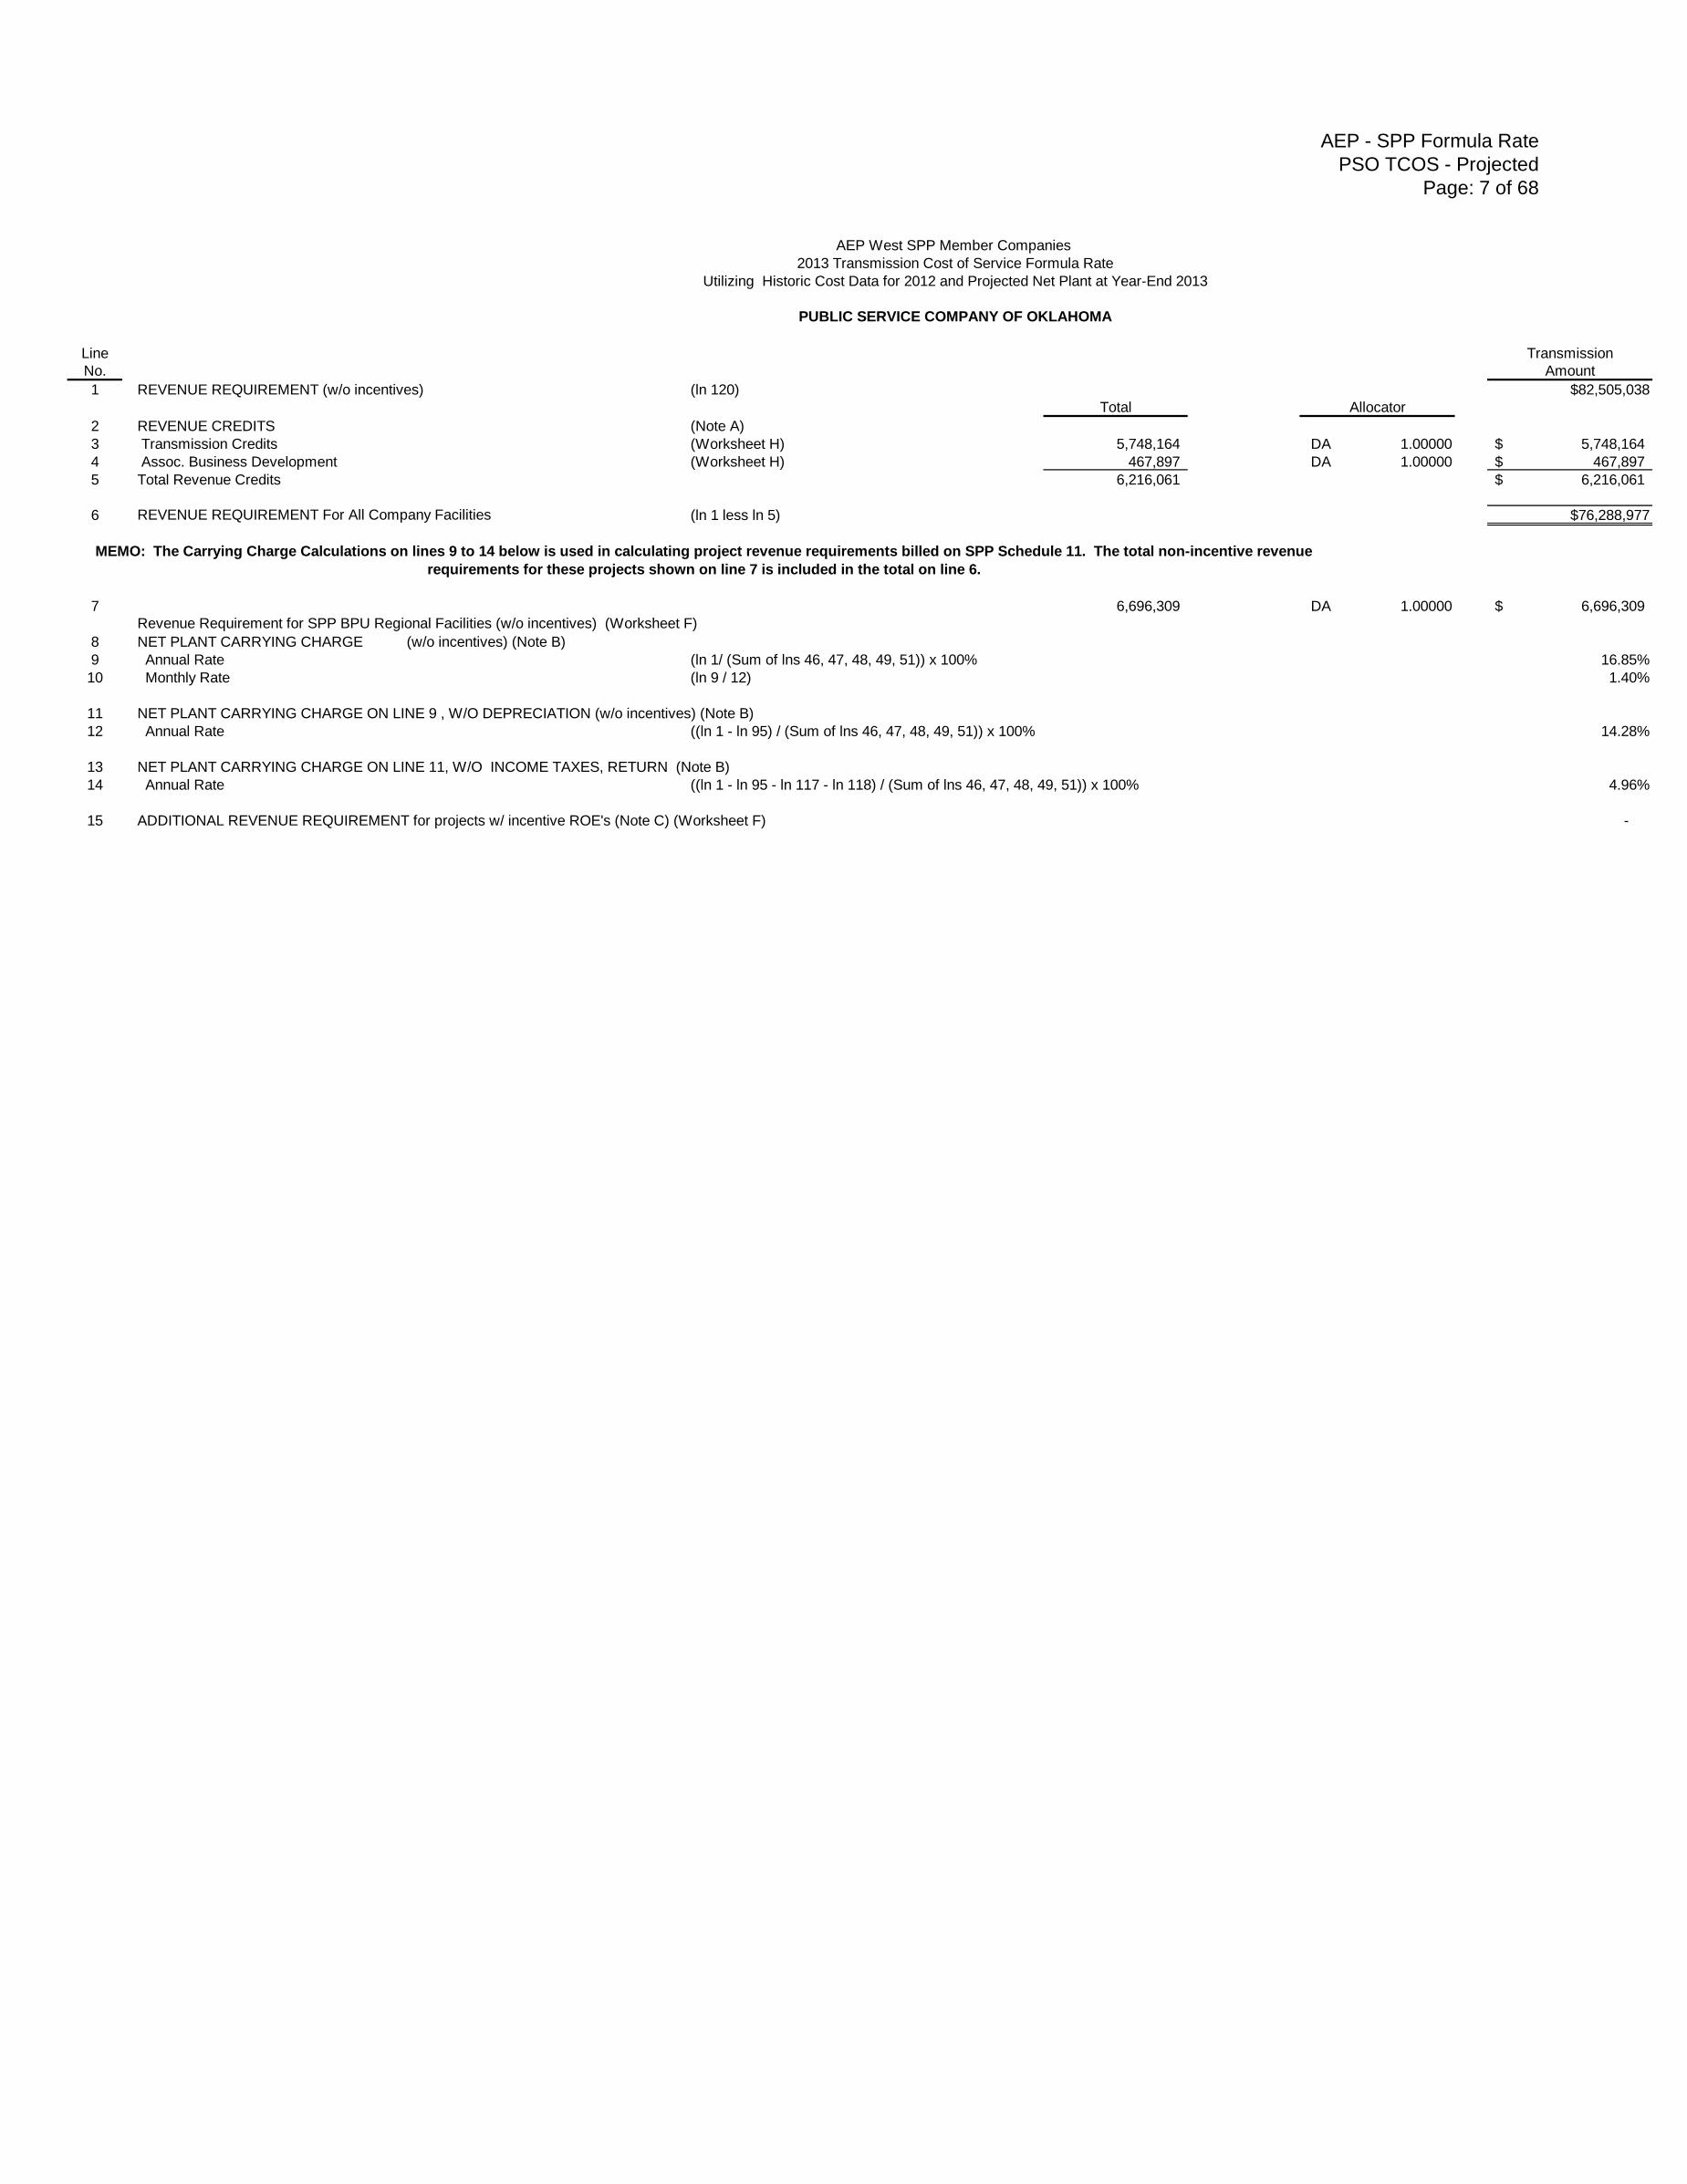
1 REVENUE REQUIREMENT (w/o incentives) (ln 120) $82,505,038
Total Allocator
2 REVENUE CREDITS (Note A)
3 Transmission Credits (Worksheet H) 5,748,164 DA 1.00000 5,748,164$
4 Assoc. Business Development (Worksheet H) 467,897 DA 1.00000 467,897$
5 Total Revenue Credits 6,216,061 6,216,061$
6 REVENUE REQUIREMENT For All Company Facilities (ln 1 less ln 5) $76,288,977
7 6,696,309 DA 1.00000 6,696,309$
8 NET PLANT CARRYING CHARGE (w/o incentives) (Note B)
9 Annual Rate (ln 1/ (Sum of lns 46, 47, 48, 49, 51)) x 100% 16.85%
10 Monthly Rate (ln 9 / 12) 1.40%
11 NET PLANT CARRYING CHARGE ON LINE 9 , W/O DEPRECIATION (w/o incentives) (Note B)
12 Annual Rate ((ln 1 - ln 95) / (Sum of lns 46, 47, 48, 49, 51)) x 100% 14.28%
13 NET PLANT CARRYING CHARGE ON LINE 11, W/O INCOME TAXES, RETURN (Note B)
14 Annual Rate ((ln 1 - ln 95 - ln 117 - ln 118) / (Sum of lns 46, 47, 48, 49, 51)) x 100% 4.96%
15 ADDITIONAL REVENUE REQUIREMENT for projects w/ incentive ROE's (Note C) (Worksheet F) -
MEMO: The Carrying Charge Calculations on lines 9 to 14 below is used in calculating project revenue requirements billed on SPP Schedule 11. The total non-incentive revenue
requirements for these projects shown on line 7 is included in the total on line 6.
Revenue Requirement for SPP BPU Regional Facilities (w/o incentives) (Worksheet F)
AEP - SPP Formula Rate
PSO TCOS - Projected
Page: 8 of 68
AEP West SPP Member Companies
2013 Transmission Cost of Service Formula Rate
Utilizing Historic Cost Data for 2012 and Projected Net Plant at Year-End 2013
PUBLIC SERVICE COMPANY OF OKLAHOMA
(1) (2) (3) (5)
Data Sources Total
RATE BASE CALCULATION (See "General Notes") TO Total Transmission
Line NOTE D
No. GROSS PLANT IN SERVICE
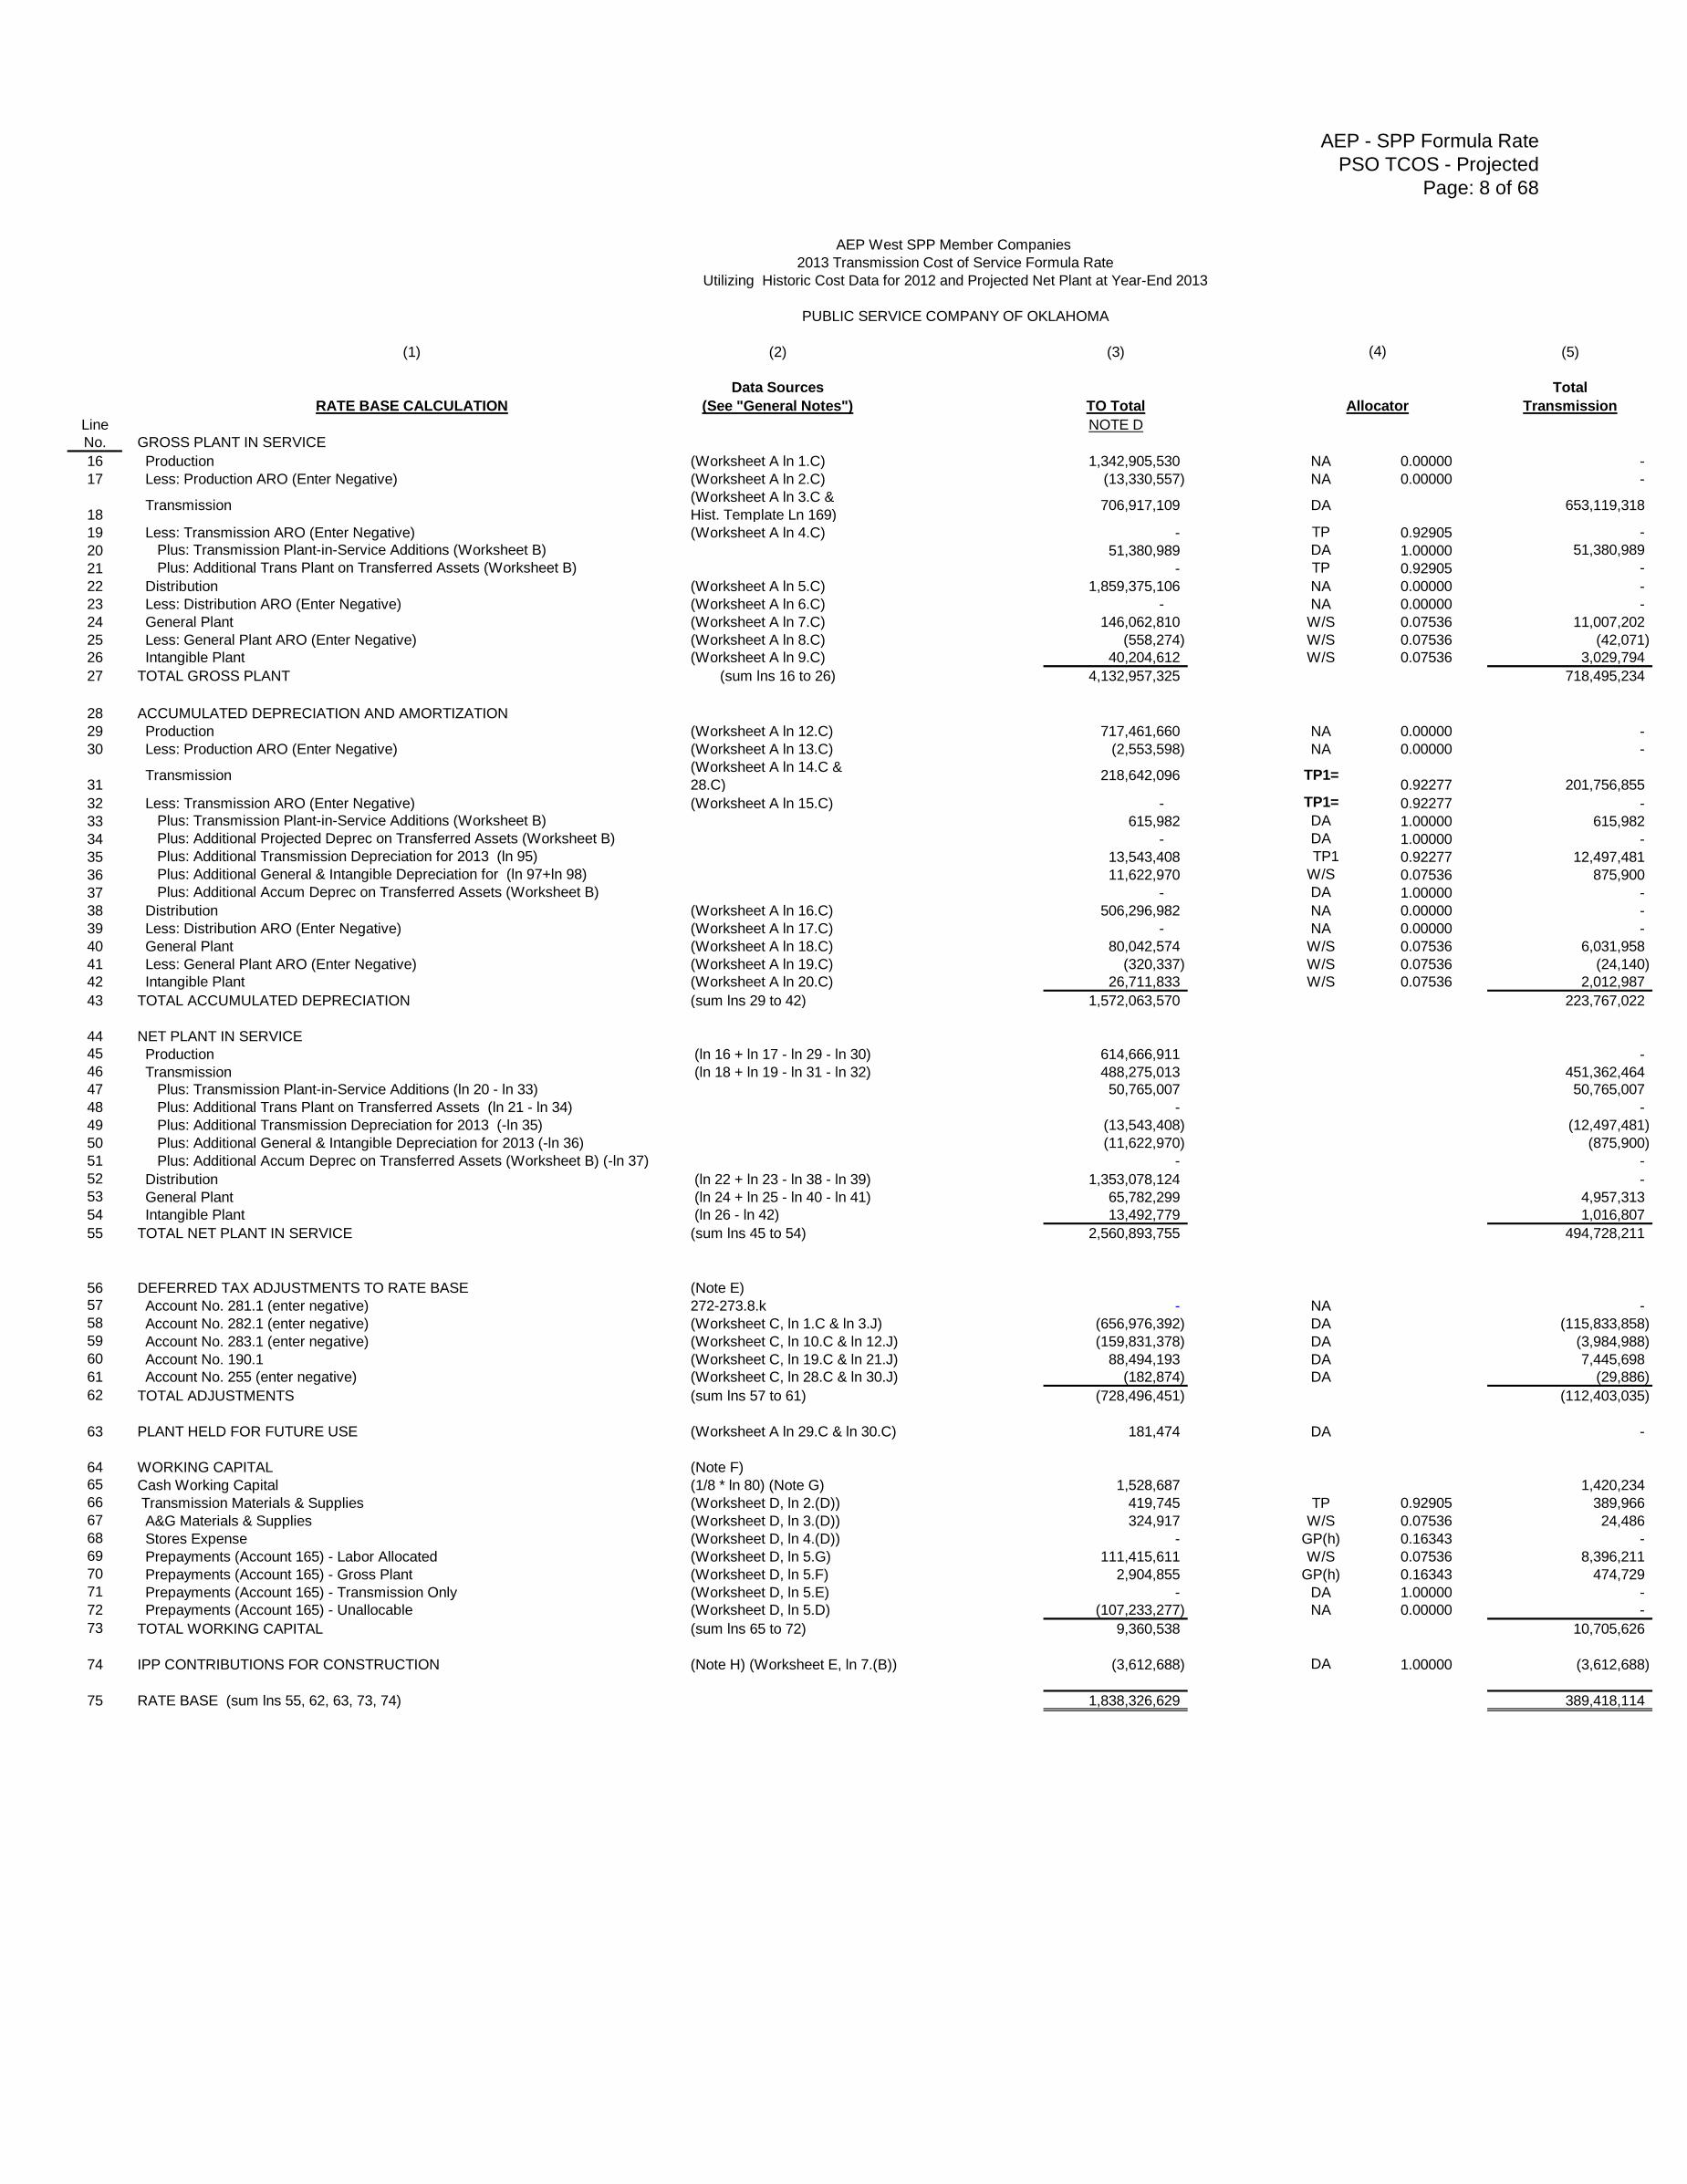
16 Production (Worksheet A ln 1.C) 1,342,905,530 NA 0.00000 -
17 Less: Production ARO (Enter Negative) (Worksheet A ln 2.C) (13,330,557) NA 0.00000 -
18 Transmission
(Worksheet A ln 3.C &
Hist. Template Ln 169)706,917,109 DA 653,119,318
19 Less: Transmission ARO (Enter Negative) (Worksheet A ln 4.C) - TP 0.92905 -
20 Plus: Transmission Plant-in-Service Additions (Worksheet B) 51,380,989 DA 1.00000 51,380,989
21 Plus: Additional Trans Plant on Transferred Assets (Worksheet B) - TP 0.92905 -
22 Distribution (Worksheet A ln 5.C) 1,859,375,106 NA 0.00000 -
23 Less: Distribution ARO (Enter Negative) (Worksheet A ln 6.C) - NA 0.00000 -
24 General Plant (Worksheet A ln 7.C) 146,062,810 W/S 0.07536 11,007,202
25 Less: General Plant ARO (Enter Negative) (Worksheet A ln 8.C) (558,274) W/S 0.07536 (42,071)
26 Intangible Plant (Worksheet A ln 9.C) 40,204,612 W/S 0.07536 3,029,794
27 TOTAL GROSS PLANT (sum lns 16 to 26) 4,132,957,325 718,495,234
28 ACCUMULATED DEPRECIATION AND AMORTIZATION
29 Production (Worksheet A ln 12.C) 717,461,660 NA 0.00000 -
30 Less: Production ARO (Enter Negative) (Worksheet A ln 13.C) (2,553,598) NA 0.00000 -
31 Transmission
(Worksheet A ln 14.C &
28.C)218,642,096 TP1=
0.92277 201,756,855
32 Less: Transmission ARO (Enter Negative) (Worksheet A ln 15.C) - TP1= 0.92277 -
33 Plus: Transmission Plant-in-Service Additions (Worksheet B) 615,982 DA 1.00000 615,982
34 Plus: Additional Projected Deprec on Transferred Assets (Worksheet B) - DA 1.00000 -
35 Plus: Additional Transmission Depreciation for 2013 (ln 95) 13,543,408 TP1 0.92277 12,497,481
36 Plus: Additional General & Intangible Depreciation for (ln 97+ln 98) 11,622,970 W/S 0.07536 875,900
37 Plus: Additional Accum Deprec on Transferred Assets (Worksheet B) - DA 1.00000 -
38 Distribution (Worksheet A ln 16.C) 506,296,982 NA 0.00000 -
39 Less: Distribution ARO (Enter Negative) (Worksheet A ln 17.C) - NA 0.00000 -
40 General Plant (Worksheet A ln 18.C) 80,042,574 W/S 0.07536 6,031,958
41 Less: General Plant ARO (Enter Negative) (Worksheet A ln 19.C) (320,337) W/S 0.07536 (24,140)
42 Intangible Plant (Worksheet A ln 20.C) 26,711,833 W/S 0.07536 2,012,987
43 TOTAL ACCUMULATED DEPRECIATION (sum lns 29 to 42) 1,572,063,570 223,767,022
44 NET PLANT IN SERVICE
45 Production (ln 16 + ln 17 - ln 29 - ln 30) 614,666,911 -
46 Transmission (ln 18 + ln 19 - ln 31 - ln 32) 488,275,013 451,362,464
47 Plus: Transmission Plant-in-Service Additions (ln 20 - ln 33) 50,765,007 50,765,007
48 Plus: Additional Trans Plant on Transferred Assets (ln 21 - ln 34) - -
49 Plus: Additional Transmission Depreciation for 2013 (-ln 35) (13,543,408) (12,497,481)
50 Plus: Additional General & Intangible Depreciation for 2013 (-ln 36) (11,622,970) (875,900)
51 Plus: Additional Accum Deprec on Transferred Assets (Worksheet B) (-ln 37) - -
52 Distribution (ln 22 + ln 23 - ln 38 - ln 39) 1,353,078,124 -
53 General Plant (ln 24 + ln 25 - ln 40 - ln 41) 65,782,299 4,957,313
54 Intangible Plant (ln 26 - ln 42) 13,492,779 1,016,807
55 TOTAL NET PLANT IN SERVICE (sum lns 45 to 54) 2,560,893,755 494,728,211
56 DEFERRED TAX ADJUSTMENTS TO RATE BASE (Note E)
57 Account No. 281.1 (enter negative) 272-273.8.k - NA -
58 Account No. 282.1 (enter negative) (Worksheet C, ln 1.C & ln 3.J) (656,976,392) DA (115,833,858)
59 Account No. 283.1 (enter negative) (Worksheet C, ln 10.C & ln 12.J) (159,831,378) DA (3,984,988)
60 Account No. 190.1 (Worksheet C, ln 19.C & ln 21.J) 88,494,193 DA 7,445,698
61 Account No. 255 (enter negative) (Worksheet C, ln 28.C & ln 30.J) (182,874) DA (29,886)
62 TOTAL ADJUSTMENTS (sum lns 57 to 61) (728,496,451) (112,403,035)
63 PLANT HELD FOR FUTURE USE (Worksheet A ln 29.C & ln 30.C) 181,474 DA -
64 WORKING CAPITAL (Note F)
65 Cash Working Capital (1/8 * ln 80) (Note G) 1,528,687 1,420,234
66 Transmission Materials & Supplies (Worksheet D, ln 2.(D)) 419,745 TP 0.92905 389,966
67 A&G Materials & Supplies (Worksheet D, ln 3.(D)) 324,917 W/S 0.07536 24,486
68 Stores Expense (Worksheet D, ln 4.(D)) - GP(h) 0.16343 -
69 Prepayments (Account 165) - Labor Allocated (Worksheet D, ln 5.G) 111,415,611 W/S 0.07536 8,396,211
70 Prepayments (Account 165) - Gross Plant (Worksheet D, ln 5.F) 2,904,855 GP(h) 0.16343 474,729
71 Prepayments (Account 165) - Transmission Only (Worksheet D, ln 5.E) - DA 1.00000 -
72 Prepayments (Account 165) - Unallocable (Worksheet D, ln 5.D) (107,233,277) NA 0.00000 -
73 TOTAL WORKING CAPITAL (sum lns 65 to 72) 9,360,538 10,705,626
74 IPP CONTRIBUTIONS FOR CONSTRUCTION (Note H) (Worksheet E, ln 7.(B)) (3,612,688) DA 1.00000 (3,612,688)
75 RATE BASE (sum lns 55, 62, 63, 73, 74) 1,838,326,629 389,418,114
(4)
Allocator
AEP - SPP Formula Rate
PSO TCOS - Projected
Page: 9 of 68
AEP West SPP Member Companies
2013 Transmission Cost of Service Formula Rate
Utilizing Historic Cost Data for 2012 and Projected Net Plant at Year-End 2013
PUBLIC SERVICE COMPANY OF OKLAHOMA
(1) (2) (3) (5)
EXPENSE, TAXES, RETURN & REVENUE Data Sources Total
REQUIREMENTS CALCULATION (See "General Notes") TO Total Transmission
Line
No. OPERATION & MAINTENANCE EXPENSE
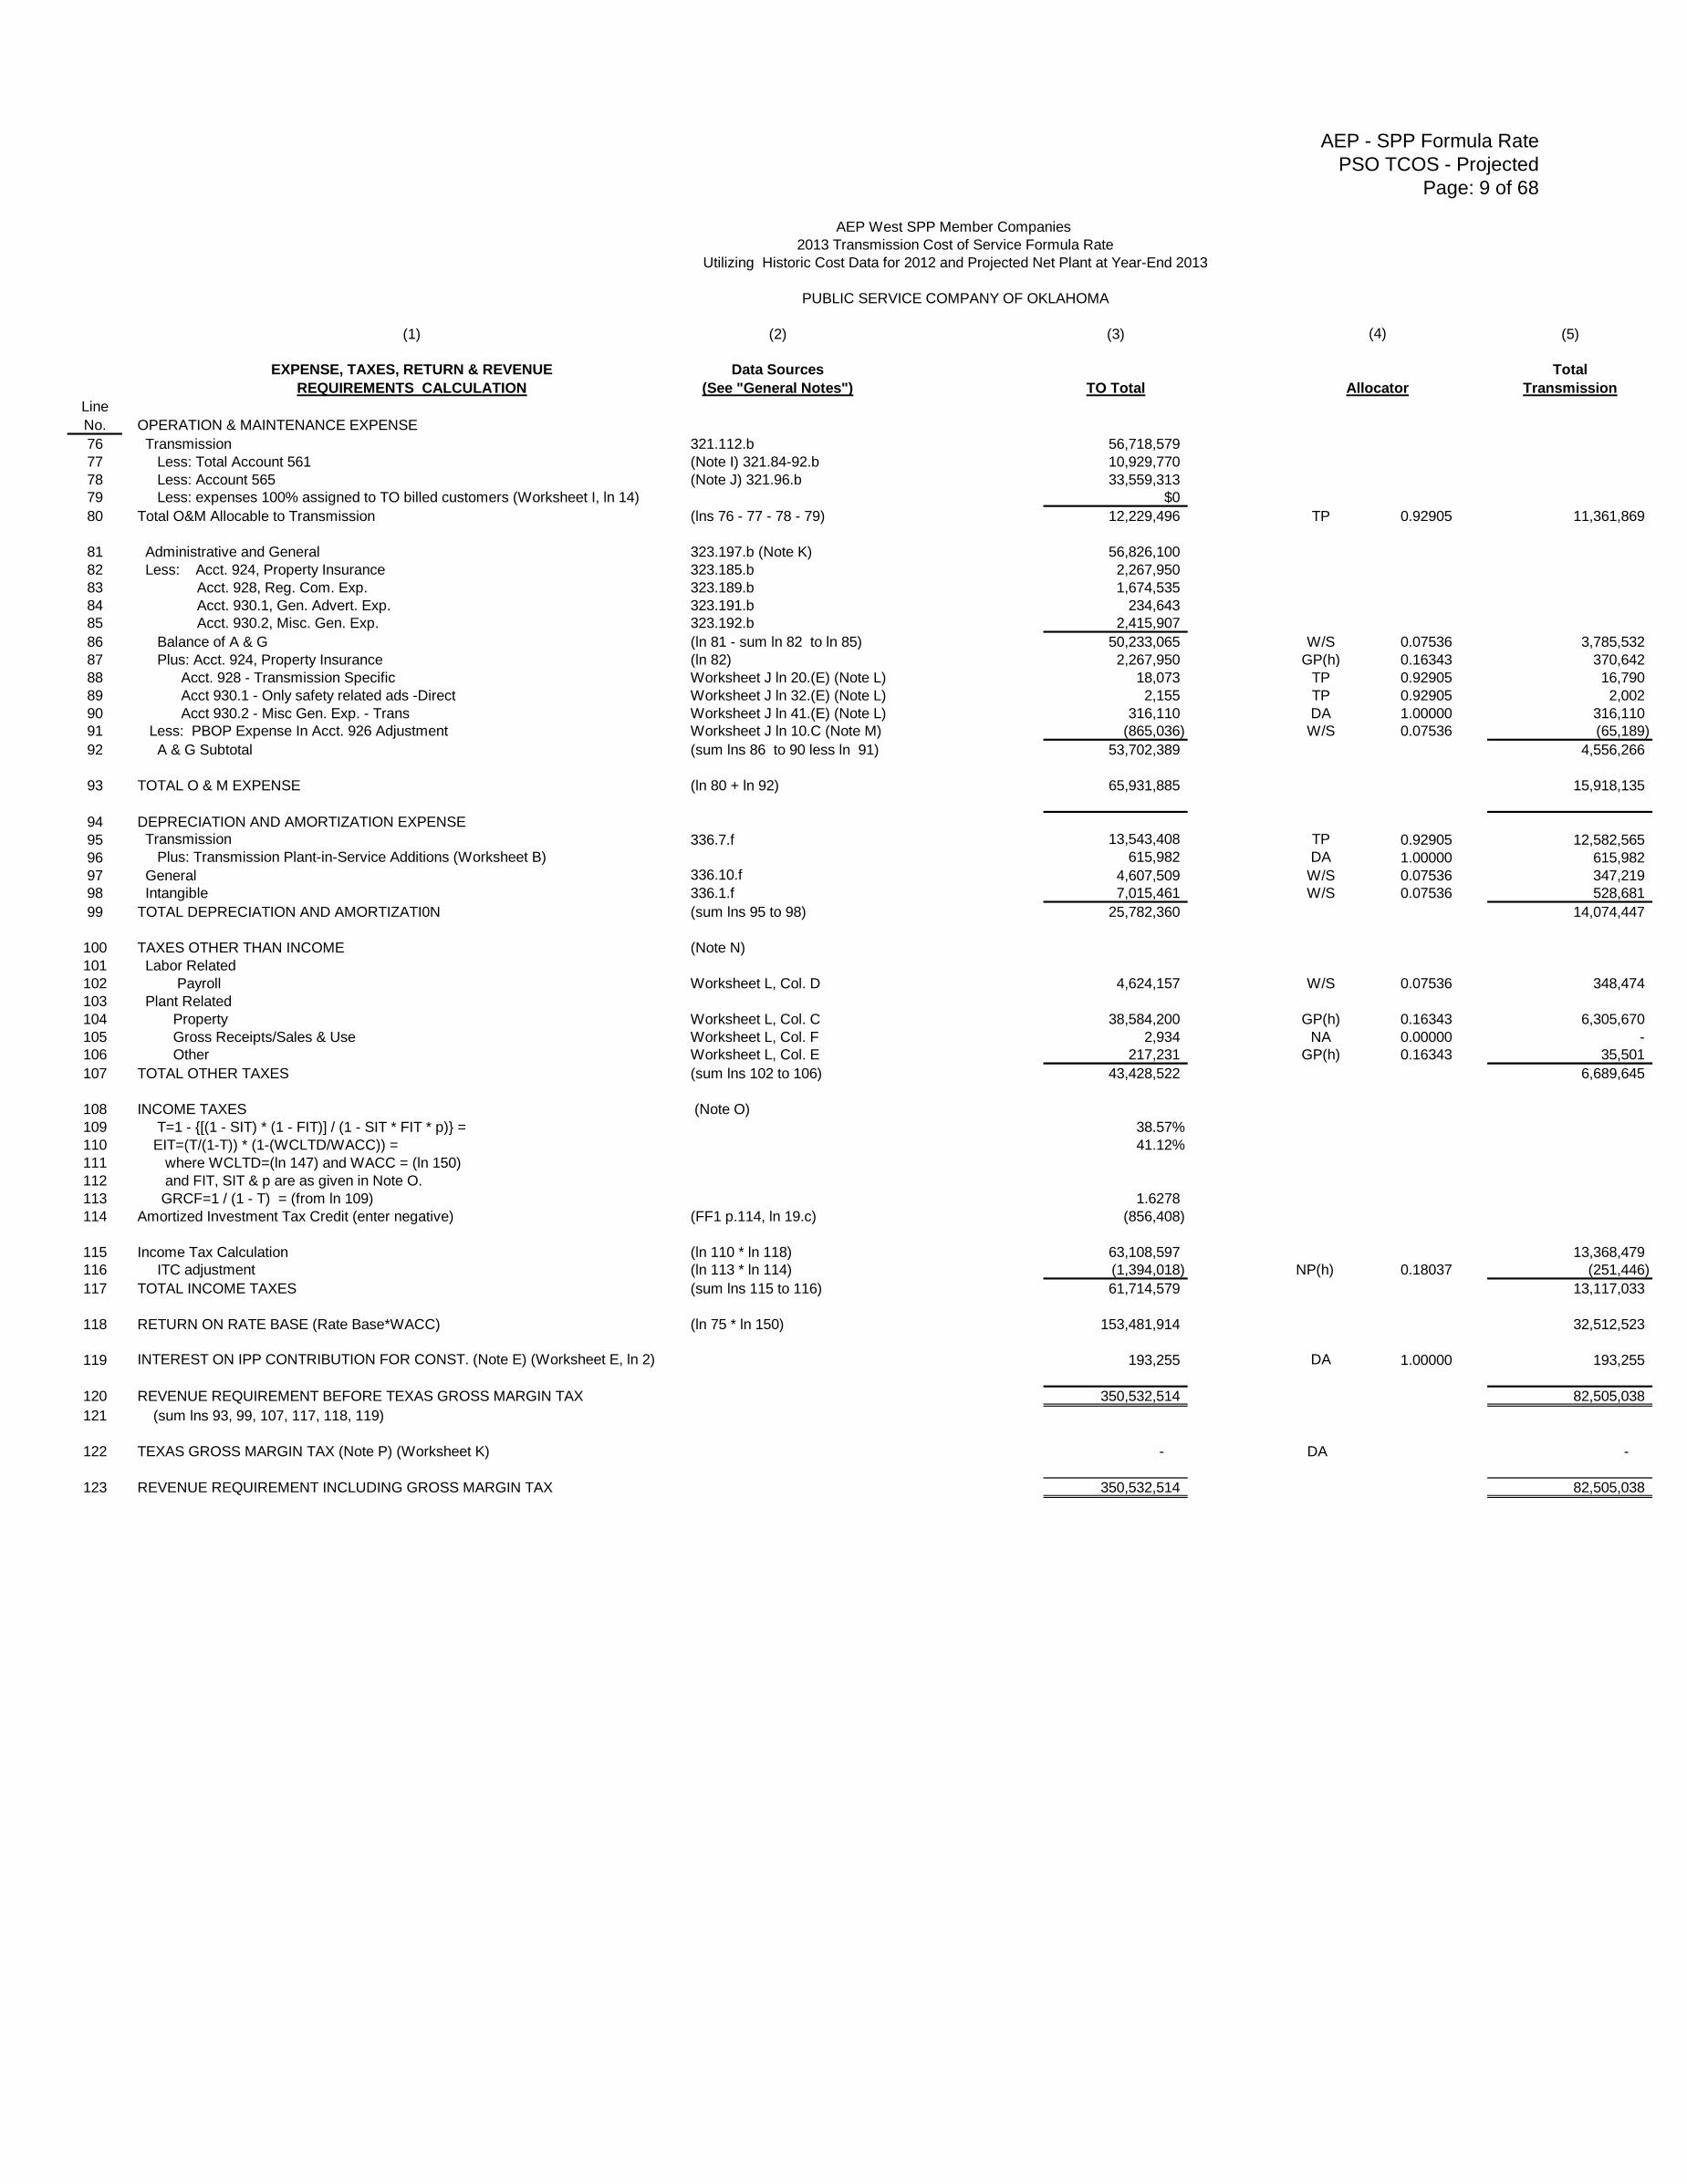
76 Transmission 321.112.b 56,718,579
77 Less: Total Account 561 (Note I) 321.84-92.b 10,929,770
78 Less: Account 565 (Note J) 321.96.b 33,559,313
79 Less: expenses 100% assigned to TO billed customers (Worksheet I, ln 14) $0
80 Total O&M Allocable to Transmission (lns 76 - 77 - 78 - 79) 12,229,496 TP 0.92905 11,361,869
81 Administrative and General 323.197.b (Note K) 56,826,100
82 Less: Acct. 924, Property Insurance 323.185.b 2,267,950
83 Acct. 928, Reg. Com. Exp. 323.189.b 1,674,535
84 Acct. 930.1, Gen. Advert. Exp. 323.191.b 234,643
85 Acct. 930.2, Misc. Gen. Exp. 323.192.b 2,415,907
86 Balance of A & G (ln 81 - sum ln 82 to ln 85) 50,233,065 W/S 0.07536 3,785,532
87 Plus: Acct. 924, Property Insurance (ln 82) 2,267,950 GP(h) 0.16343 370,642
88 Acct. 928 - Transmission Specific Worksheet J ln 20.(E) (Note L) 18,073 TP 0.92905 16,790
89 Acct 930.1 - Only safety related ads -Direct Worksheet J ln 32.(E) (Note L) 2,155 TP 0.92905 2,002
90 Acct 930.2 - Misc Gen. Exp. - Trans Worksheet J ln 41.(E) (Note L) 316,110 DA 1.00000 316,110
91 Less: PBOP Expense In Acct. 926 Adjustment Worksheet J ln 10.C (Note M) (865,036) W/S 0.07536 (65,189)
92 A & G Subtotal (sum lns 86 to 90 less ln 91) 53,702,389 4,556,266
93 TOTAL O & M EXPENSE (ln 80 + ln 92) 65,931,885 15,918,135
94 DEPRECIATION AND AMORTIZATION EXPENSE
95 Transmission 336.7.f 13,543,408 TP 0.92905 12,582,565
96 Plus: Transmission Plant-in-Service Additions (Worksheet B) 615,982 DA 1.00000 615,982
97 General 336.10.f 4,607,509 W/S 0.07536 347,219
98 Intangible 336.1.f 7,015,461 W/S 0.07536 528,681
99 TOTAL DEPRECIATION AND AMORTIZATI0N (sum lns 95 to 98) 25,782,360 14,074,447
100 TAXES OTHER THAN INCOME (Note N)
101 Labor Related
102 Payroll Worksheet L, Col. D 4,624,157 W/S 0.07536 348,474
103 Plant Related
104 Property Worksheet L, Col. C 38,584,200 GP(h) 0.16343 6,305,670
105 Gross Receipts/Sales & Use Worksheet L, Col. F 2,934 NA 0.00000 -
106 Other Worksheet L, Col. E 217,231 GP(h) 0.16343 35,501
107 TOTAL OTHER TAXES (sum lns 102 to 106) 43,428,522 6,689,645
108 INCOME TAXES (Note O)
109 T=1 - {[(1 - SIT) * (1 - FIT)] / (1 - SIT * FIT * p)} = 38.57%
110 EIT=(T/(1-T)) * (1-(WCLTD/WACC)) = 41.12%
111 where WCLTD=(ln 147) and WACC = (ln 150)
112 and FIT, SIT & p are as given in Note O.
113 GRCF=1 / (1 - T) = (from ln 109) 1.6278
114 Amortized Investment Tax Credit (enter negative) (FF1 p.114, ln 19.c) (856,408)
115 Income Tax Calculation (ln 110 * ln 118) 63,108,597 13,368,479
116 ITC adjustment (ln 113 * ln 114) (1,394,018) NP(h) 0.18037 (251,446)
117 TOTAL INCOME TAXES (sum lns 115 to 116) 61,714,579 13,117,033
118 RETURN ON RATE BASE (Rate Base*WACC) (ln 75 * ln 150) 153,481,914 32,512,523
119 INTEREST ON IPP CONTRIBUTION FOR CONST. (Note E) (Worksheet E, ln 2) 193,255 DA 1.00000 193,255
120 REVENUE REQUIREMENT BEFORE TEXAS GROSS MARGIN TAX 350,532,514 82,505,038
121 (sum lns 93, 99, 107, 117, 118, 119)
122 TEXAS GROSS MARGIN TAX (Note P) (Worksheet K) - DA -
123 REVENUE REQUIREMENT INCLUDING GROSS MARGIN TAX 350,532,514 82,505,038
Allocator
(4)
AEP - SPP Formula Rate
PSO TCOS - Projected
Page: 10 of 68
AEP West SPP Member Companies
2013 Transmission Cost of Service Formula Rate
Utilizing Historic Cost Data for 2012 and Projected Net Plant at Year-End 2013
PUBLIC SERVICE COMPANY OF OKLAHOMA
SUPPORTING CALCULATIONS
ln
No. TRANSMISSION PLANT INCLUDED IN SPP TARIFF
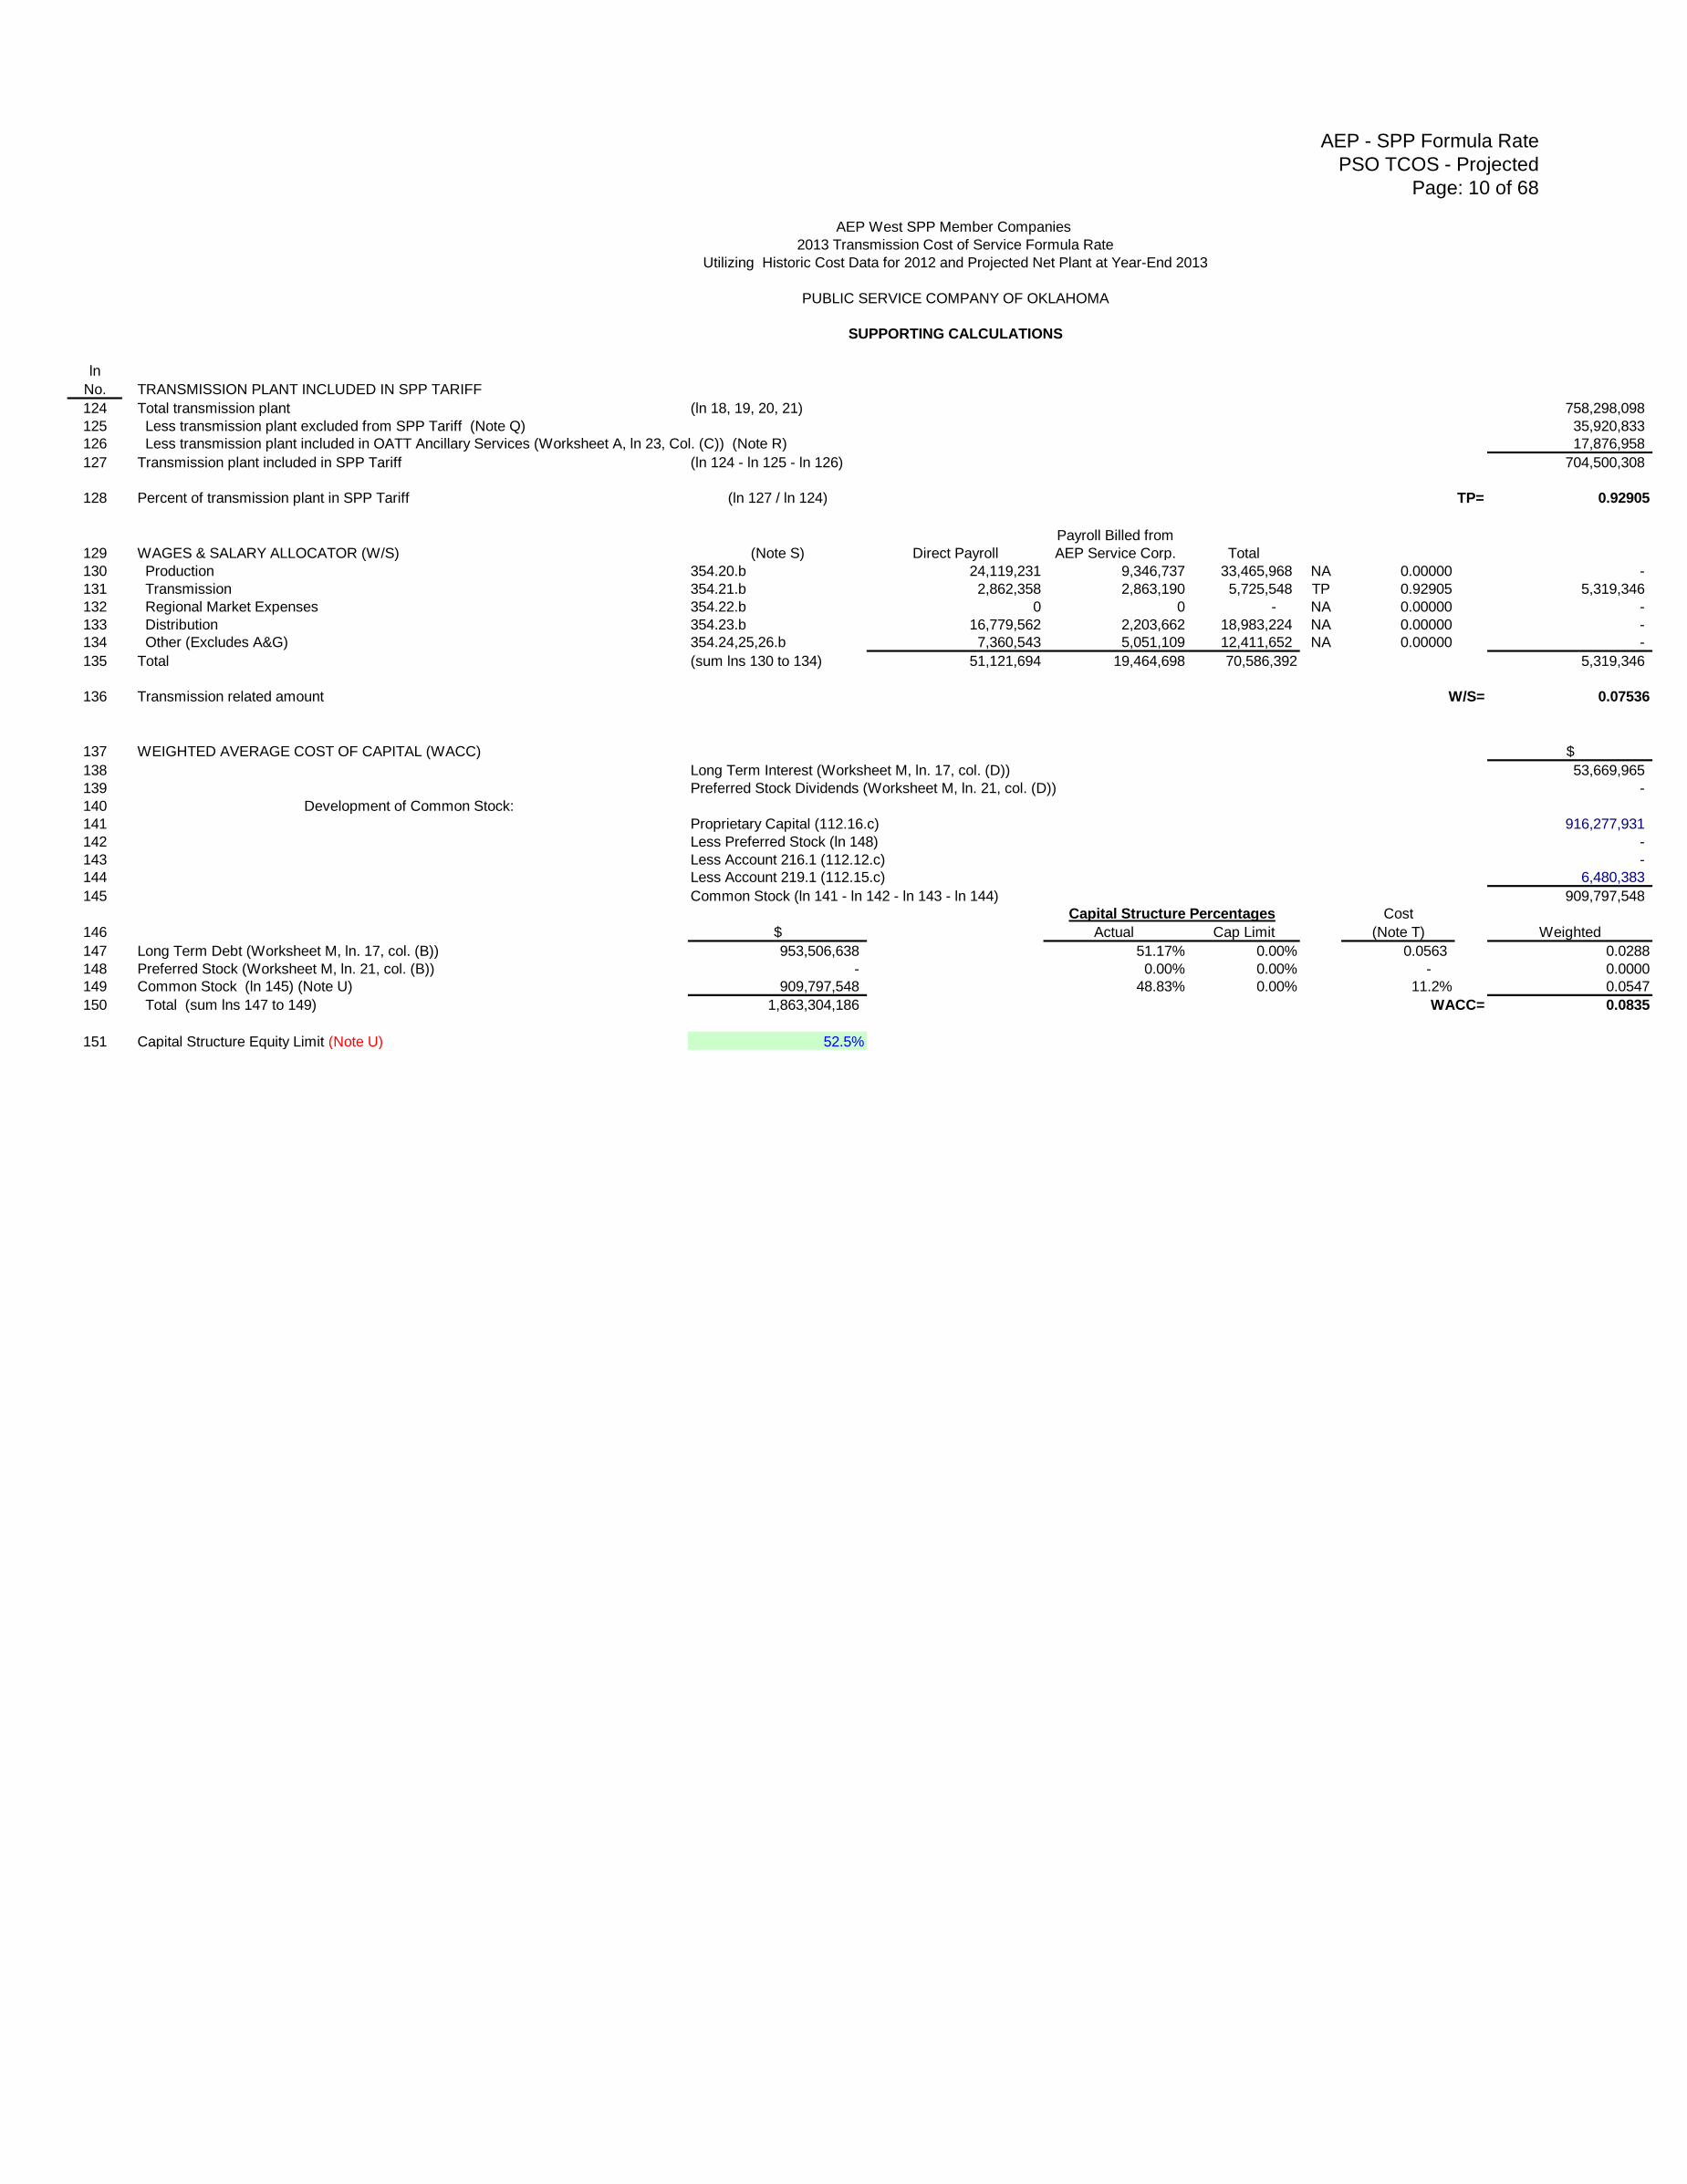
124 Total transmission plant (ln 18, 19, 20, 21) 758,298,098
125 Less transmission plant excluded from SPP Tariff (Note Q) 35,920,833
126 Less transmission plant included in OATT Ancillary Services (Worksheet A, ln 23, Col. (C)) (Note R) 17,876,958
127 Transmission plant included in SPP Tariff (ln 124 - ln 125 - ln 126) 704,500,308
128 Percent of transmission plant in SPP Tariff (ln 127 / ln 124) TP= 0.92905
129 WAGES & SALARY ALLOCATOR (W/S) (Note S) Direct Payroll
Payroll Billed from
AEP Service Corp. Total
130 Production 354.20.b 24,119,231 9,346,737 33,465,968 NA 0.00000 -
131 Transmission 354.21.b 2,862,358 2,863,190 5,725,548 TP 0.92905 5,319,346
132 Regional Market Expenses 354.22.b 0 0 - NA 0.00000 -
133 Distribution 354.23.b 16,779,562 2,203,662 18,983,224 NA 0.00000 -
134 Other (Excludes A&G) 354.24,25,26.b 7,360,543 5,051,109 12,411,652 NA 0.00000 -
135 Total (sum lns 130 to 134) 51,121,694 19,464,698 70,586,392 5,319,346
136 Transmission related amount W/S= 0.07536
137 WEIGHTED AVERAGE COST OF CAPITAL (WACC) $
138 Long Term Interest (Worksheet M, ln. 17, col. (D)) 53,669,965
139 Preferred Stock Dividends (Worksheet M, ln. 21, col. (D)) -
140 Development of Common Stock:
141 Proprietary Capital (112.16.c) 916,277,931
142 Less Preferred Stock (ln 148) -
143 Less Account 216.1 (112.12.c) -
144 Less Account 219.1 (112.15.c) 6,480,383
145 Common Stock (ln 141 - ln 142 - ln 143 - ln 144) 909,797,548
Cost
146 $ Actual Cap Limit (Note T) Weighted
147 Long Term Debt (Worksheet M, ln. 17, col. (B)) 953,506,638 51.17% 0.00% 0.0563 0.0288
148 Preferred Stock (Worksheet M, ln. 21, col. (B)) - 0.00% 0.00% - 0.0000
149 Common Stock (ln 145) (Note U) 909,797,548 48.83% 0.00% 11.2% 0.0547
150 Total (sum lns 147 to 149) 1,863,304,186 WACC= 0.0835
151 Capital Structure Equity Limit (Note U) 52.5%
Capital Structure Percentages
AEP - SPP Formula Rate
PSO TCOS - Projected
Page: 11 of 68
AEP West SPP Member Companies
2013 Transmission Cost of Service Formula Rate
Utilizing Historic Cost Data for 2012 and Projected Net Plant at Year-End 2013
PUBLIC SERVICE COMPANY OF OKLAHOMA
Letter Notes
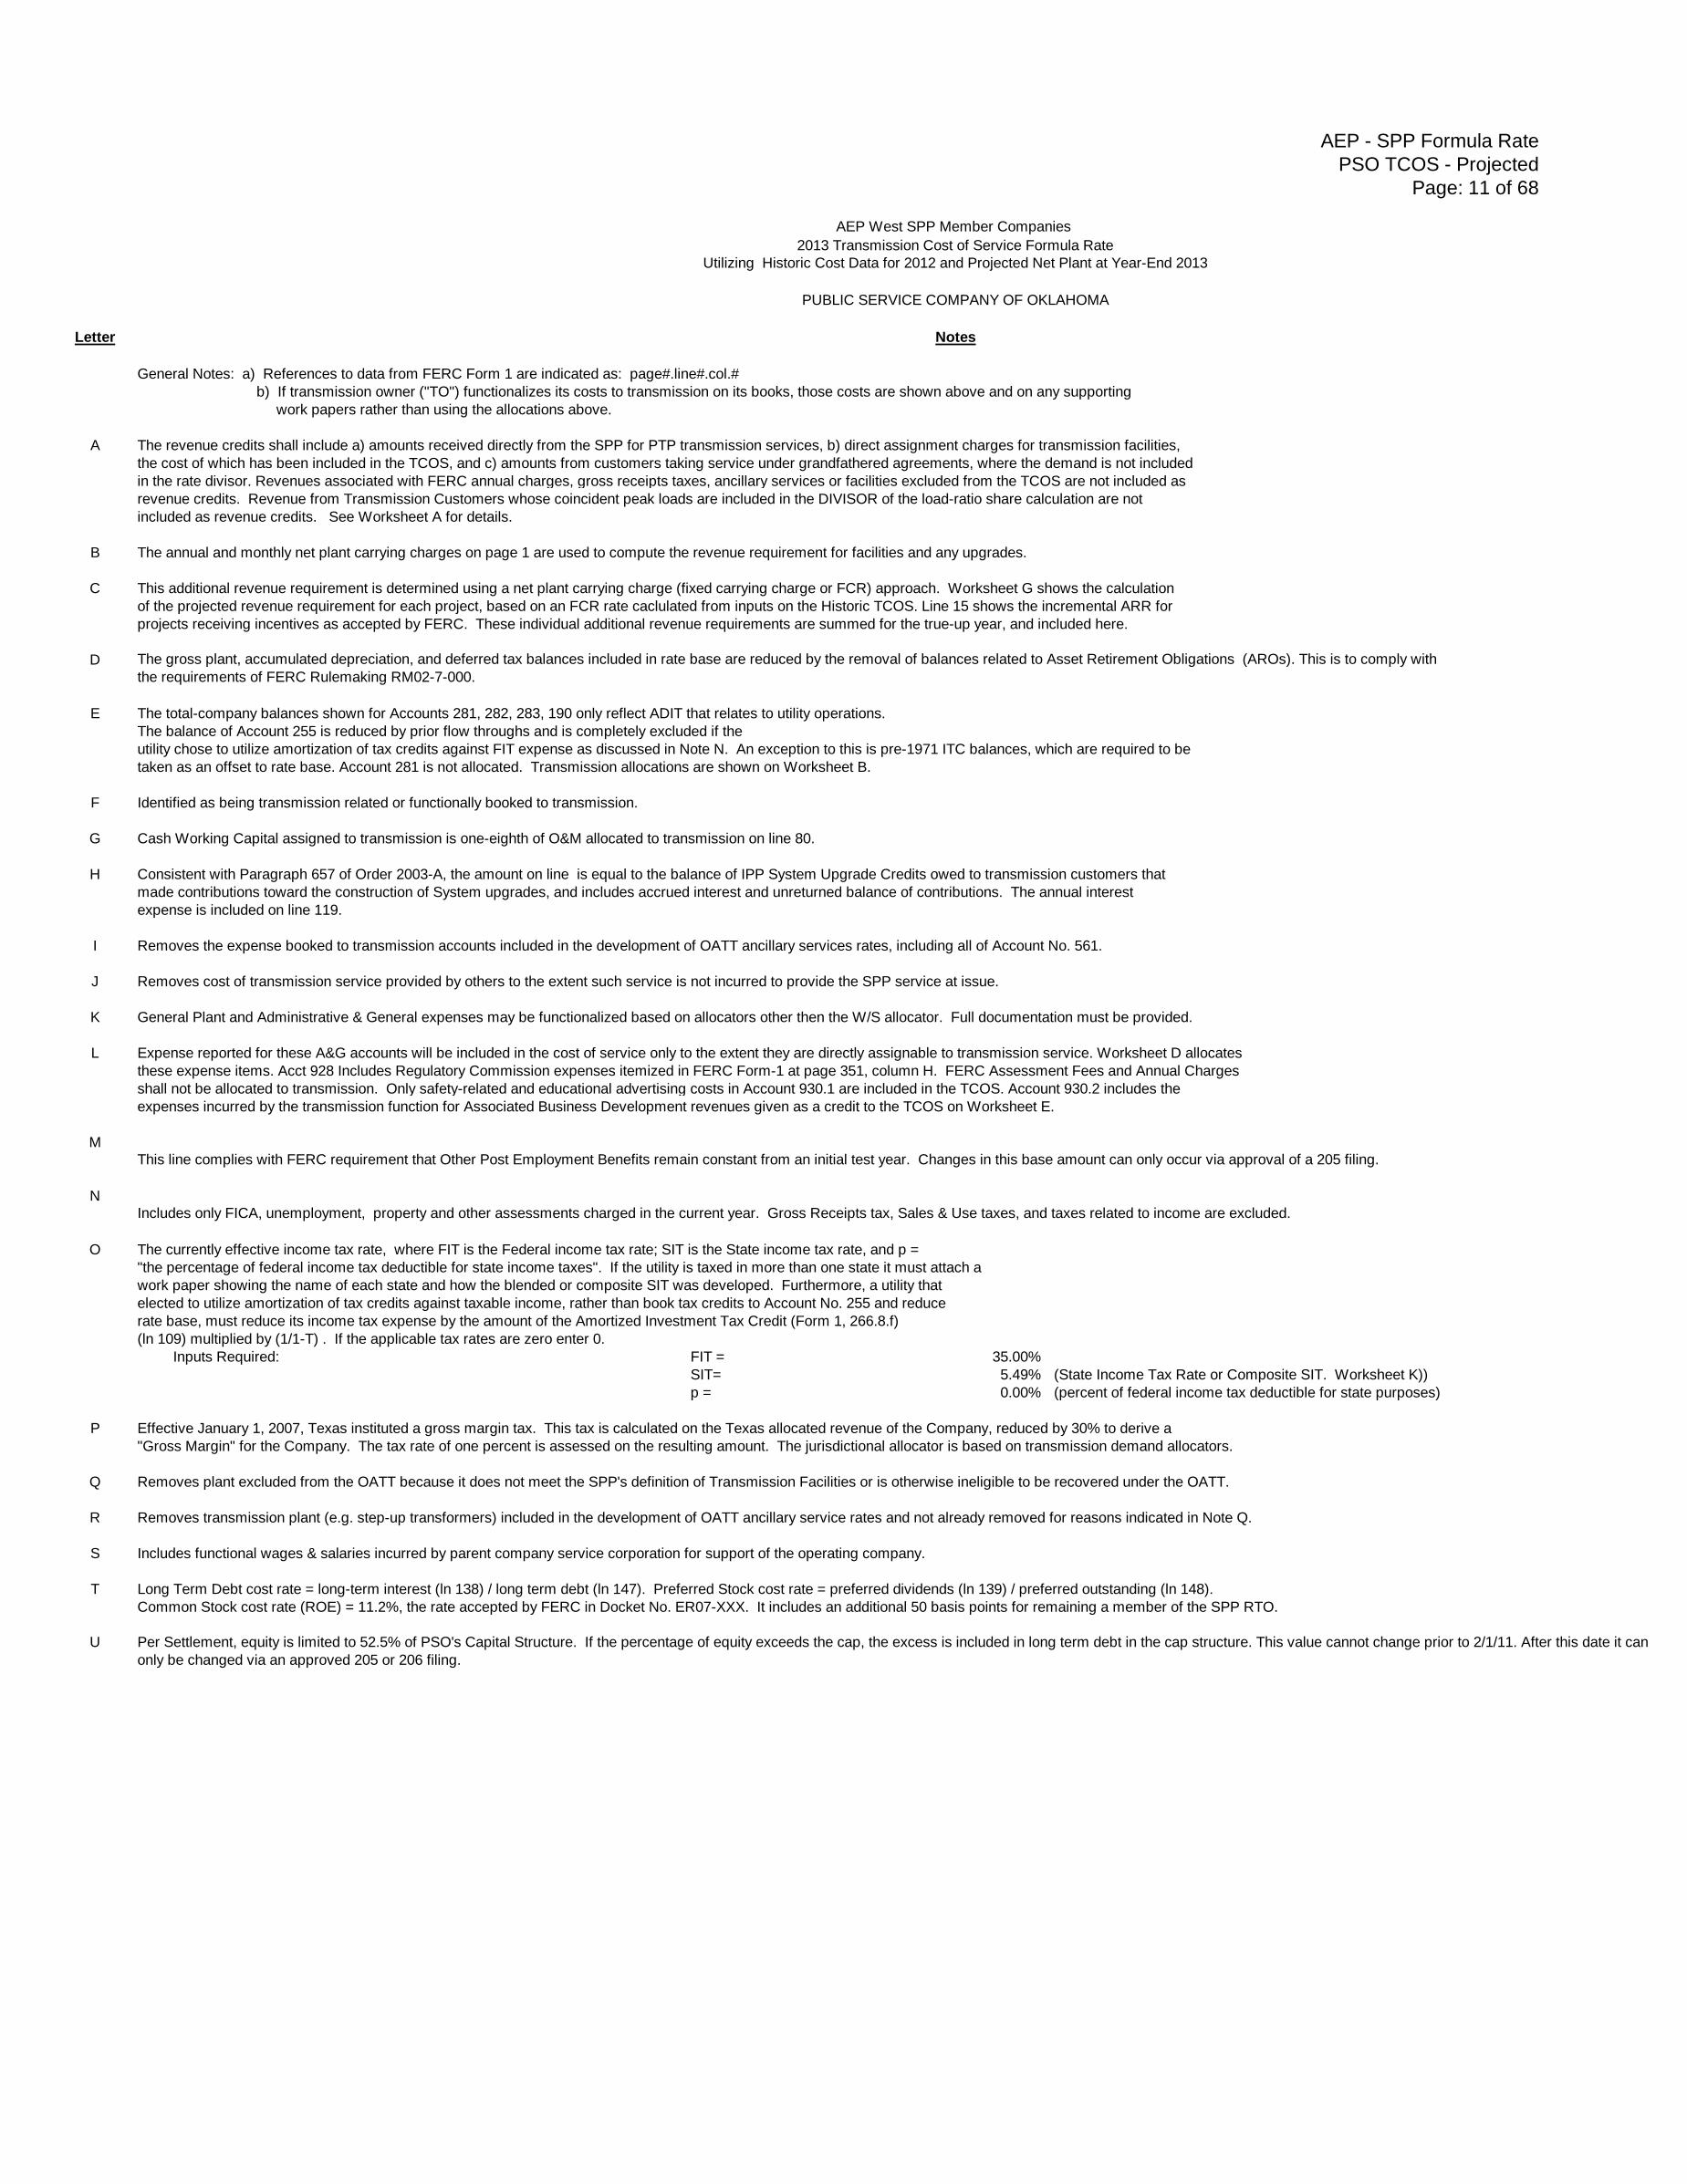
General Notes: a) References to data from FERC Form 1 are indicated as: page#.line#.col.#
b) If transmission owner ("TO") functionalizes its costs to transmission on its books, those costs are shown above and on any supporting
work papers rather than using the allocations above.
A The revenue credits shall include a) amounts received directly from the SPP for PTP transmission services, b) direct assignment charges for transmission facilities,
the cost of which has been included in the TCOS, and c) amounts from customers taking service under grandfathered agreements, where the demand is not included
in the rate divisor. Revenues associated with FERC annual charges, gross receipts taxes, ancillary services or facilities excluded from the TCOS are not included as
revenue credits. Revenue from Transmission Customers whose coincident peak loads are included in the DIVISOR of the load-ratio share calculation are not
included as revenue credits. See Worksheet A for details.
B The annual and monthly net plant carrying charges on page 1 are used to compute the revenue requirement for facilities and any upgrades.
C This additional revenue requirement is determined using a net plant carrying charge (fixed carrying charge or FCR) approach. Worksheet G shows the calculation
of the projected revenue requirement for each project, based on an FCR rate caclulated from inputs on the Historic TCOS. Line 15 shows the incremental ARR for
projects receiving incentives as accepted by FERC. These individual additional revenue requirements are summed for the true-up year, and included here.
D
E The total-company balances shown for Accounts 281, 282, 283, 190 only reflect ADIT that relates to utility operations.
The balance of Account 255 is reduced by prior flow throughs and is completely excluded if the
utility chose to utilize amortization of tax credits against FIT expense as discussed in Note N. An exception to this is pre-1971 ITC balances, which are required to be
taken as an offset to rate base. Account 281 is not allocated. Transmission allocations are shown on Worksheet B.
F Identified as being transmission related or functionally booked to transmission.
G Cash Working Capital assigned to transmission is one-eighth of O&M allocated to transmission on line 80.
H Consistent with Paragraph 657 of Order 2003-A, the amount on line is equal to the balance of IPP System Upgrade Credits owed to transmission customers that
made contributions toward the construction of System upgrades, and includes accrued interest and unreturned balance of contributions. The annual interest
expense is included on line 119.
I Removes the expense booked to transmission accounts included in the development of OATT ancillary services rates, including all of Account No. 561.
J Removes cost of transmission service provided by others to the extent such service is not incurred to provide the SPP service at issue.
K General Plant and Administrative & General expenses may be functionalized based on allocators other then the W/S allocator. Full documentation must be provided.
L Expense reported for these A&G accounts will be included in the cost of service only to the extent they are directly assignable to transmission service. Worksheet D allocates
these expense items. Acct 928 Includes Regulatory Commission expenses itemized in FERC Form-1 at page 351, column H. FERC Assessment Fees and Annual Charges
shall not be allocated to transmission. Only safety-related and educational advertising costs in Account 930.1 are included in the TCOS. Account 930.2 includes the
expenses incurred by the transmission function for Associated Business Development revenues given as a credit to the TCOS on Worksheet E.
M
N
O The currently effective income tax rate, where FIT is the Federal income tax rate; SIT is the State income tax rate, and p =
"the percentage of federal income tax deductible for state income taxes". If the utility is taxed in more than one state it must attach a
work paper showing the name of each state and how the blended or composite SIT was developed. Furthermore, a utility that
elected to utilize amortization of tax credits against taxable income, rather than book tax credits to Account No. 255 and reduce
rate base, must reduce its income tax expense by the amount of the Amortized Investment Tax Credit (Form 1, 266.8.f)
(ln 109) multiplied by (1/1-T) . If the applicable tax rates are zero enter 0.
Inputs Required: FIT = 35.00%
SIT= 5.49% (State Income Tax Rate or Composite SIT. Worksheet K))
p = 0.00% (percent of federal income tax deductible for state purposes)
P Effective January 1, 2007, Texas instituted a gross margin tax. This tax is calculated on the Texas allocated revenue of the Company, reduced by 30% to derive a
"Gross Margin" for the Company. The tax rate of one percent is assessed on the resulting amount. The jurisdictional allocator is based on transmission demand allocators.
Q Removes plant excluded from the OATT because it does not meet the SPP's definition of Transmission Facilities or is otherwise ineligible to be recovered under the OATT.
R Removes transmission plant (e.g. step-up transformers) included in the development of OATT ancillary service rates and not already removed for reasons indicated in Note Q.
S Includes functional wages & salaries incurred by parent company service corporation for support of the operating company.
T Long Term Debt cost rate = long-term interest (ln 138) / long term debt (ln 147). Preferred Stock cost rate = preferred dividends (ln 139) / preferred outstanding (ln 148).
Common Stock cost rate (ROE) = 11.2%, the rate accepted by FERC in Docket No. ER07-XXX. It includes an additional 50 basis points for remaining a member of the SPP RTO.
U
The gross plant, accumulated depreciation, and deferred tax balances included in rate base are reduced by the removal of balances related to Asset Retirement Obligations (AROs). This is to comply with
the requirements of FERC Rulemaking RM02-7-000.
This line complies with FERC requirement that Other Post Employment Benefits remain constant from an initial test year. Changes in this base amount can only occur via approval of a 205 filing.
Per Settlement, equity is limited to 52.5% of PSO's Capital Structure. If the percentage of equity exceeds the cap, the excess is included in long term debt in the cap structure. This value cannot change prior to 2/1/11. After this date it can
only be changed via an approved 205 or 206 filing.
Includes only FICA, unemployment, property and other assessments charged in the current year. Gross Receipts tax, Sales & Use taxes, and taxes related to income are excluded.
AEP - SPP Formula Rate
PSO TCOS - Historic
Page: 12 of 68
AEP West SPP Member Companies
Transmission Cost of Service Formula Rate
Utilizing Historic Cost Data for 2012 with Year-End Rate Base Balances
PUBLIC SERVICE COMPANY OF OKLAHOMA
Line Transmission
No. Amount
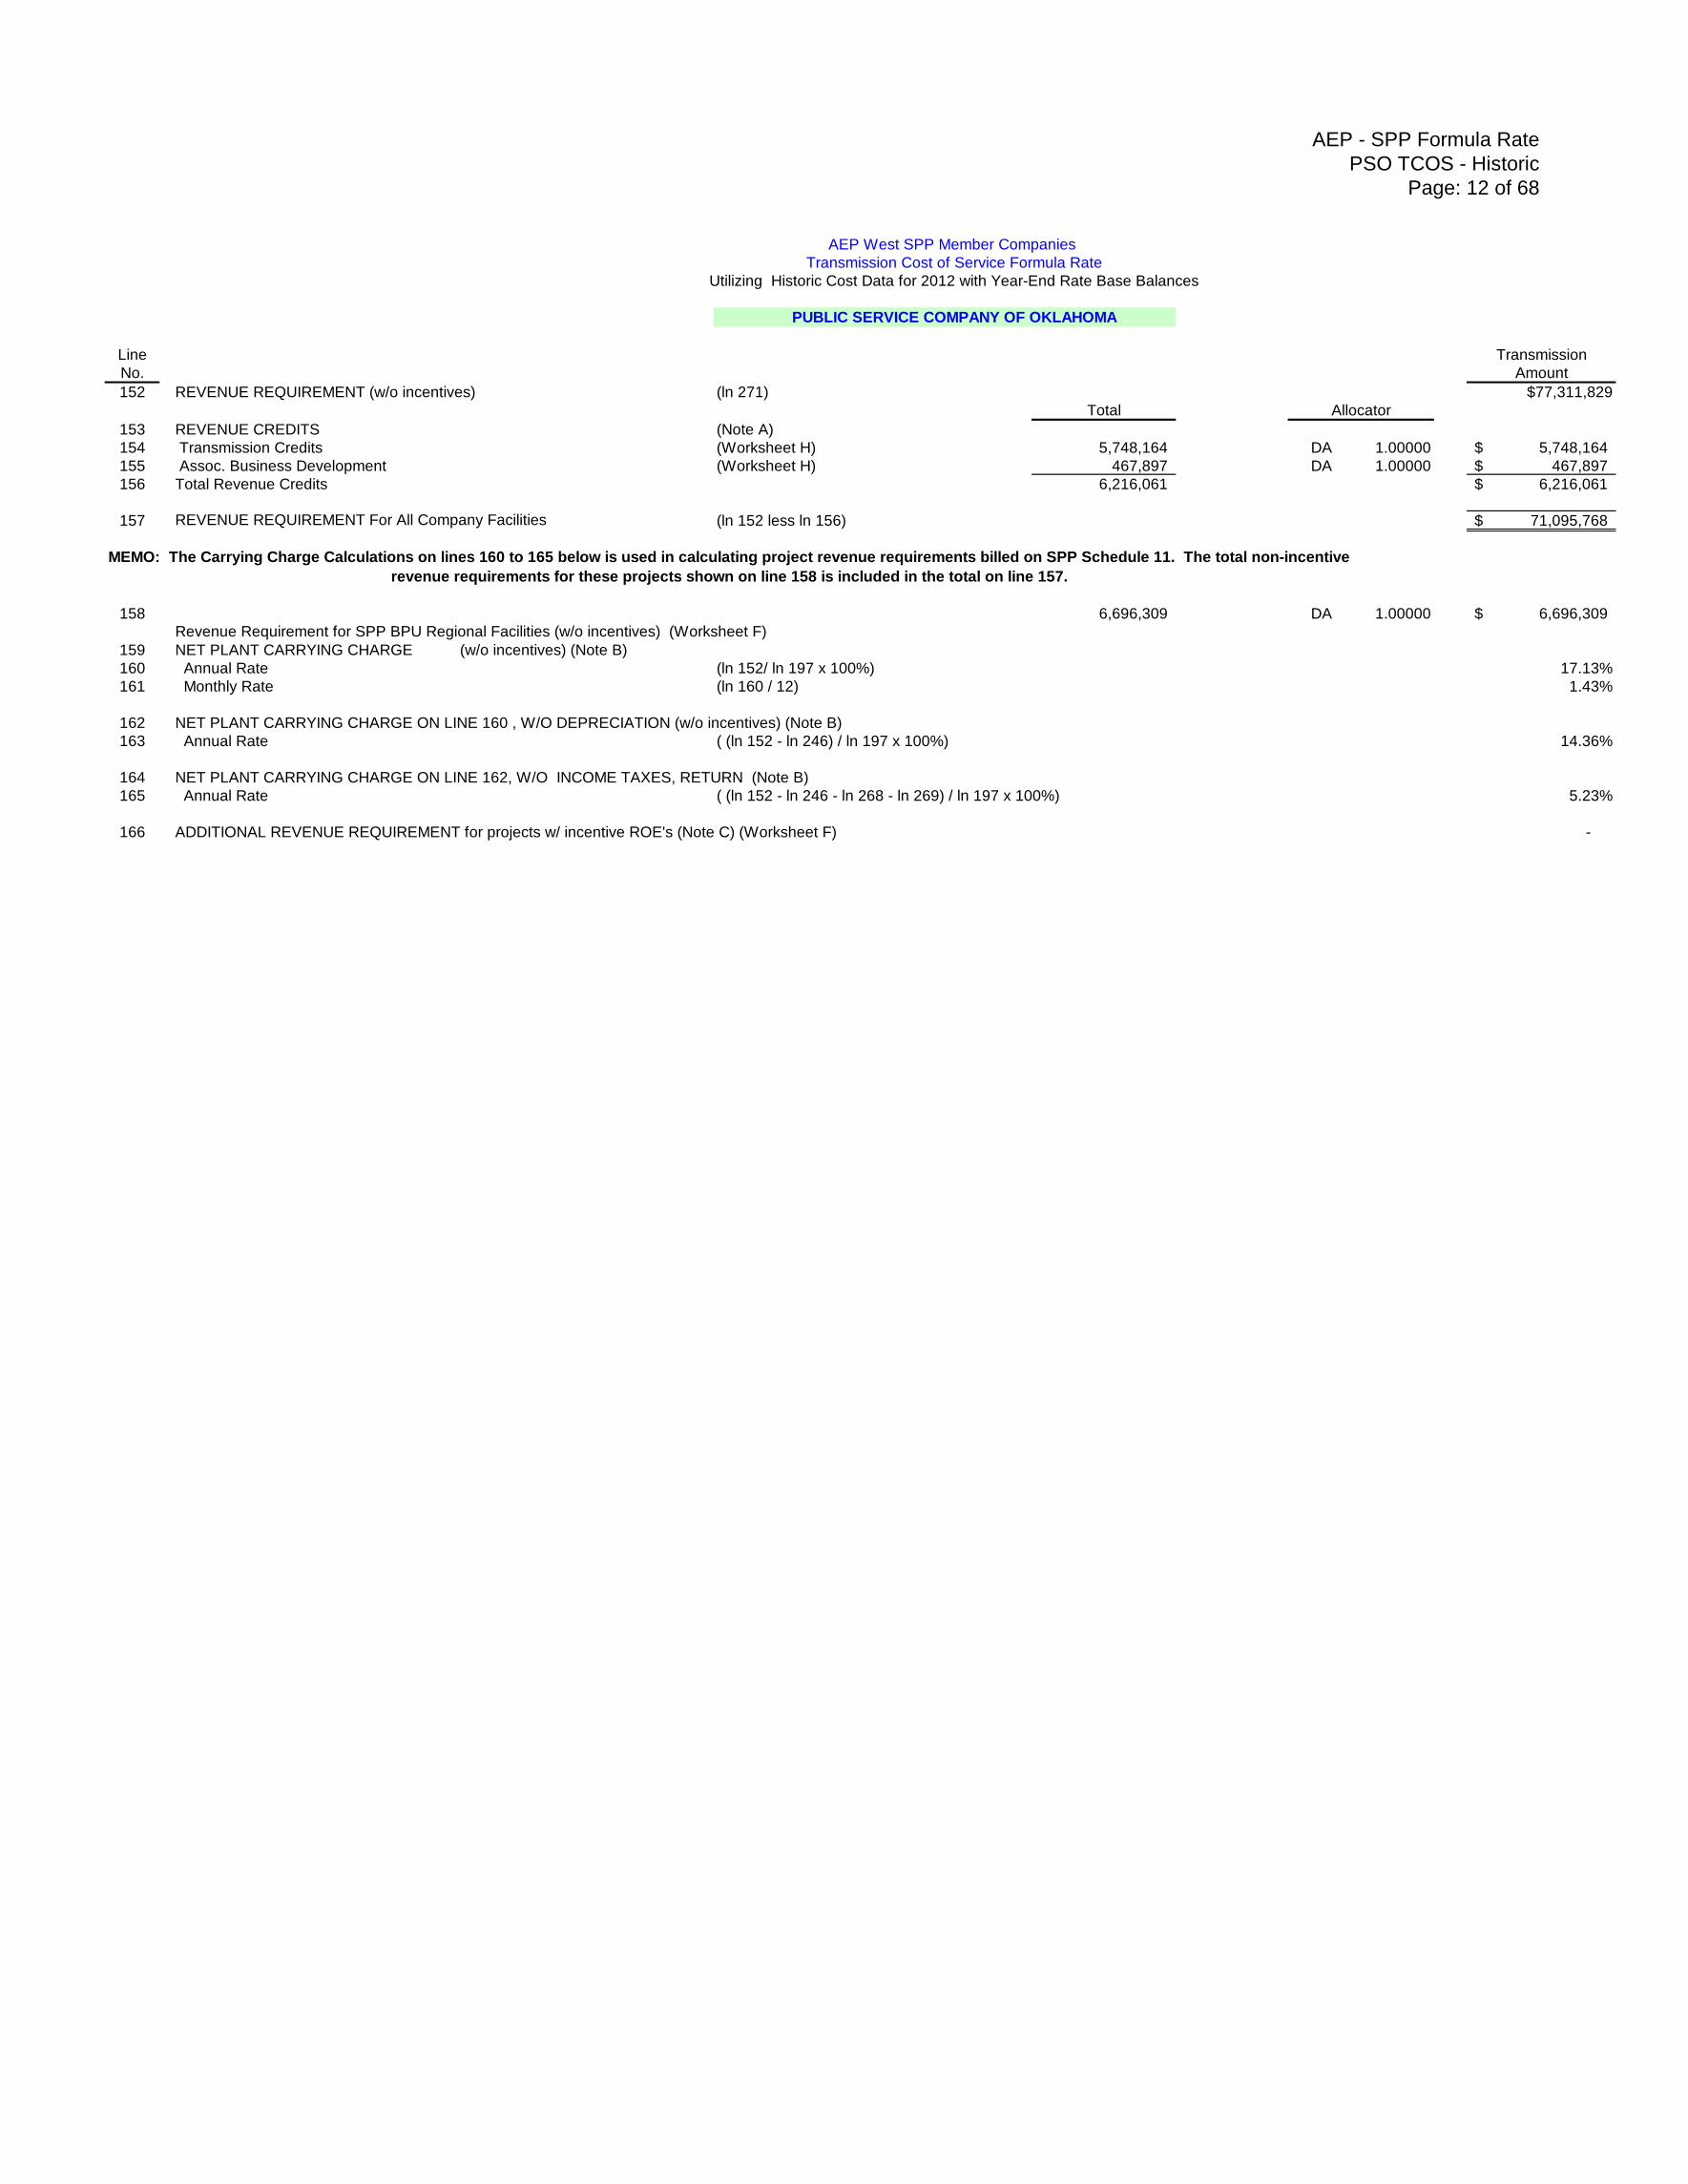
152 REVENUE REQUIREMENT (w/o incentives) (ln 271) $77,311,829
Total Allocator
153 REVENUE CREDITS (Note A)
154 Transmission Credits (Worksheet H) 5,748,164 DA 1.00000 5,748,164$
155 Assoc. Business Development (Worksheet H) 467,897 DA 1.00000 467,897$
156 Total Revenue Credits 6,216,061 6,216,061$
157 REVENUE REQUIREMENT For All Company Facilities (ln 152 less ln 156) 71,095,768$
158 6,696,309 DA 1.00000 6,696,309$
159 NET PLANT CARRYING CHARGE (w/o incentives) (Note B)
160 Annual Rate (ln 152/ ln 197 x 100%) 17.13%
161 Monthly Rate (ln 160 / 12) 1.43%
162 NET PLANT CARRYING CHARGE ON LINE 160 , W/O DEPRECIATION (w/o incentives) (Note B)
163 Annual Rate ( (ln 152 - ln 246) / ln 197 x 100%) 14.36%
164 NET PLANT CARRYING CHARGE ON LINE 162, W/O INCOME TAXES, RETURN (Note B)
165 Annual Rate ( (ln 152 - ln 246 - ln 268 - ln 269) / ln 197 x 100%) 5.23%
166 ADDITIONAL REVENUE REQUIREMENT for projects w/ incentive ROE's (Note C) (Worksheet F) -
MEMO: The Carrying Charge Calculations on lines 160 to 165 below is used in calculating project revenue requirements billed on SPP Schedule 11. The total non-incentive
revenue requirements for these projects shown on line 158 is included in the total on line 157.
Revenue Requirement for SPP BPU Regional Facilities (w/o incentives) (Worksheet F)
AEP - SPP Formula Rate
PSO TCOS - Historic
Page: 13 of 68
AEP West SPP Member Companies
Transmission Cost of Service Formula Rate
Utilizing Historic Cost Data for 2012 with Year-End Rate Base Balances
PUBLIC SERVICE COMPANY OF OKLAHOMA
(1) (2) (3) (5)
Data Sources Total
RATE BASE CALCULATION (See "General Notes") TO Total Transmission
Line NOTE D
No. GROSS PLANT IN SERVICE
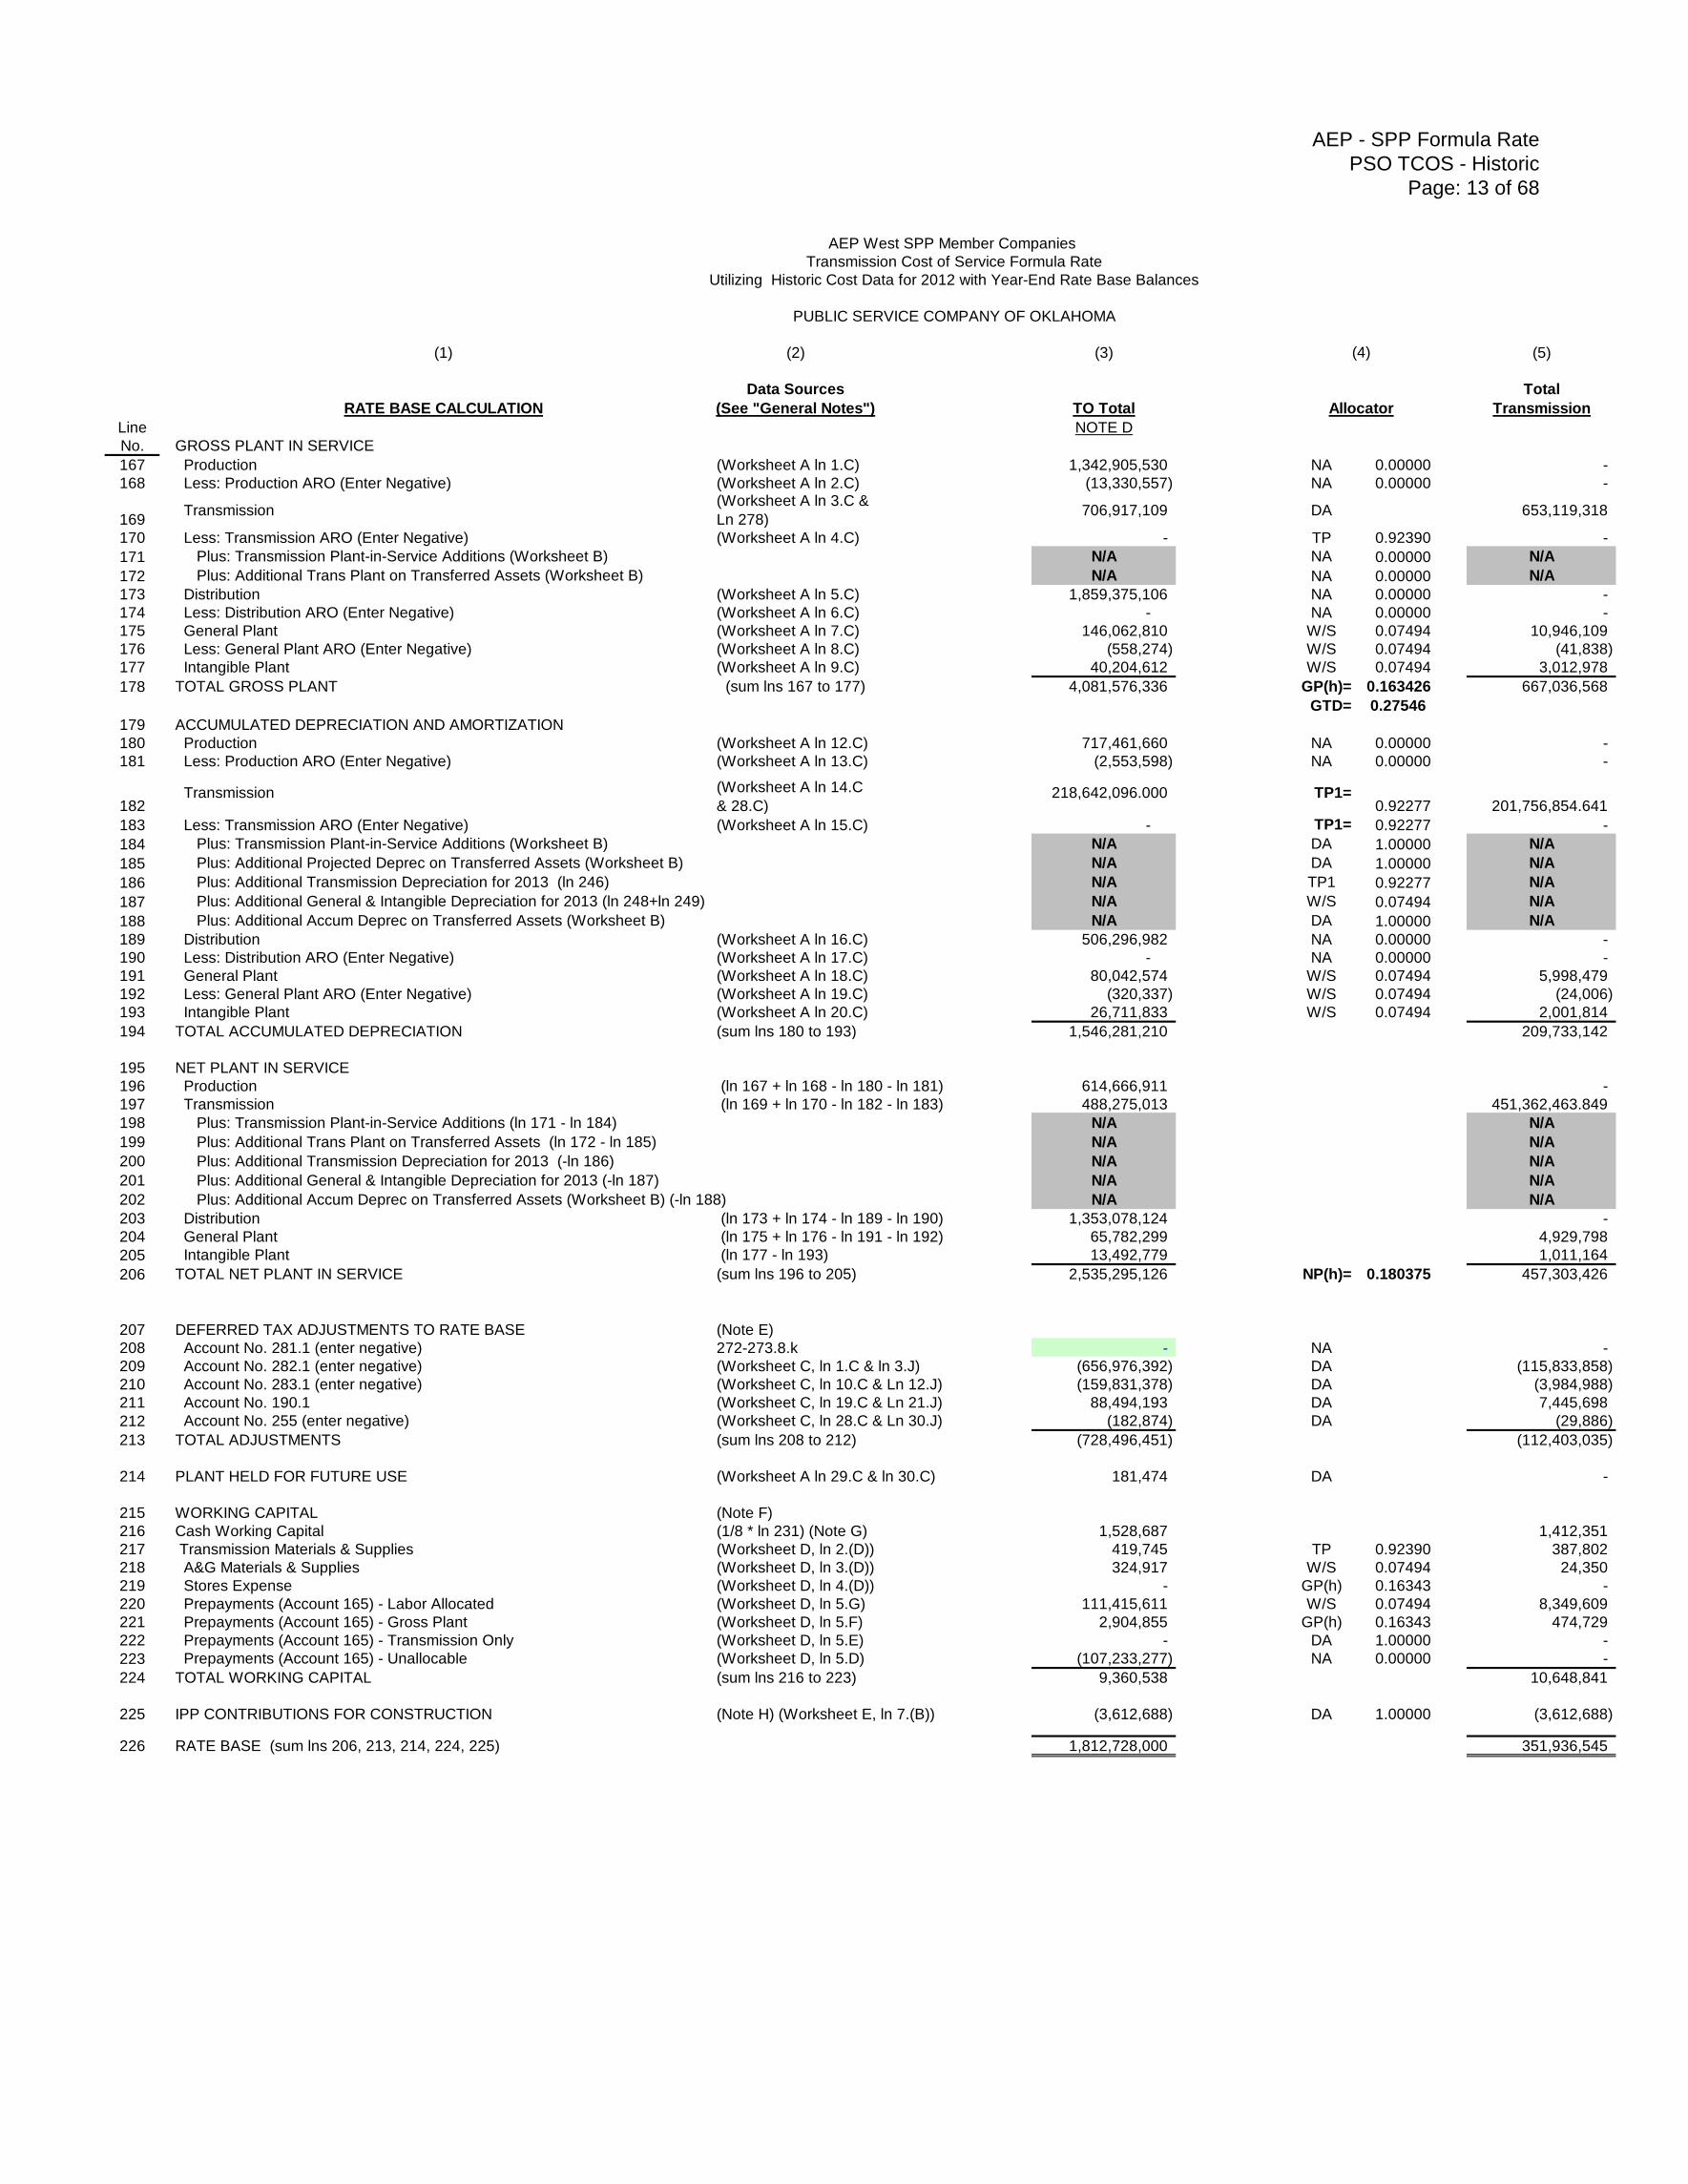
167 Production (Worksheet A ln 1.C) 1,342,905,530 NA 0.00000 -
168 Less: Production ARO (Enter Negative) (Worksheet A ln 2.C) (13,330,557) NA 0.00000 -
169 Transmission
(Worksheet A ln 3.C &
Ln 278)706,917,109 DA 653,119,318
170 Less: Transmission ARO (Enter Negative) (Worksheet A ln 4.C) - TP 0.92390 -
171 Plus: Transmission Plant-in-Service Additions (Worksheet B) N/A NA 0.00000 N/A
172 Plus: Additional Trans Plant on Transferred Assets (Worksheet B) N/A NA 0.00000 N/A
173 Distribution (Worksheet A ln 5.C) 1,859,375,106 NA 0.00000 -
174 Less: Distribution ARO (Enter Negative) (Worksheet A ln 6.C) - NA 0.00000 -
175 General Plant (Worksheet A ln 7.C) 146,062,810 W/S 0.07494 10,946,109
176 Less: General Plant ARO (Enter Negative) (Worksheet A ln 8.C) (558,274) W/S 0.07494 (41,838)
177 Intangible Plant (Worksheet A ln 9.C) 40,204,612 W/S 0.07494 3,012,978
178 TOTAL GROSS PLANT (sum lns 167 to 177) 4,081,576,336 GP(h)= 0.163426 667,036,568
GTD= 0.27546
179 ACCUMULATED DEPRECIATION AND AMORTIZATION
180 Production (Worksheet A ln 12.C) 717,461,660 NA 0.00000 -
181 Less: Production ARO (Enter Negative) (Worksheet A ln 13.C) (2,553,598) NA 0.00000 -
182 Transmission (Worksheet A ln 14.C
& 28.C)218,642,096.000 TP1=
0.92277 201,756,854.641
183 Less: Transmission ARO (Enter Negative) (Worksheet A ln 15.C) - TP1= 0.92277 -
184 Plus: Transmission Plant-in-Service Additions (Worksheet B) N/A DA 1.00000 N/A
185 Plus: Additional Projected Deprec on Transferred Assets (Worksheet B) N/A DA 1.00000 N/A
186 Plus: Additional Transmission Depreciation for 2013 (ln 246) N/A TP1 0.92277 N/A
187 Plus: Additional General & Intangible Depreciation for 2013 (ln 248+ln 249) N/A W/S 0.07494 N/A
188 Plus: Additional Accum Deprec on Transferred Assets (Worksheet B) N/A DA 1.00000 N/A
189 Distribution (Worksheet A ln 16.C) 506,296,982 NA 0.00000 -
190 Less: Distribution ARO (Enter Negative) (Worksheet A ln 17.C) - NA 0.00000 -
191 General Plant (Worksheet A ln 18.C) 80,042,574 W/S 0.07494 5,998,479
192 Less: General Plant ARO (Enter Negative) (Worksheet A ln 19.C) (320,337) W/S 0.07494 (24,006)
193 Intangible Plant (Worksheet A ln 20.C) 26,711,833 W/S 0.07494 2,001,814
194 TOTAL ACCUMULATED DEPRECIATION (sum lns 180 to 193) 1,546,281,210 209,733,142
195 NET PLANT IN SERVICE
196 Production (ln 167 + ln 168 - ln 180 - ln 181) 614,666,911 -
197 Transmission (ln 169 + ln 170 - ln 182 - ln 183) 488,275,013 451,362,463.849
198 Plus: Transmission Plant-in-Service Additions (ln 171 - ln 184) N/A N/A
199 Plus: Additional Trans Plant on Transferred Assets (ln 172 - ln 185) N/A N/A
200 Plus: Additional Transmission Depreciation for 2013 (-ln 186) N/A N/A
201 Plus: Additional General & Intangible Depreciation for 2013 (-ln 187) N/A N/A
202 Plus: Additional Accum Deprec on Transferred Assets (Worksheet B) (-ln 188) N/A N/A
203 Distribution (ln 173 + ln 174 - ln 189 - ln 190) 1,353,078,124 -
204 General Plant (ln 175 + ln 176 - ln 191 - ln 192) 65,782,299 4,929,798
205 Intangible Plant (ln 177 - ln 193) 13,492,779 1,011,164
206 TOTAL NET PLANT IN SERVICE (sum lns 196 to 205) 2,535,295,126 NP(h)= 0.180375 457,303,426
207 DEFERRED TAX ADJUSTMENTS TO RATE BASE (Note E)
208 Account No. 281.1 (enter negative) 272-273.8.k - NA -
209 Account No. 282.1 (enter negative) (Worksheet C, ln 1.C & ln 3.J) (656,976,392) DA (115,833,858)
210 Account No. 283.1 (enter negative) (Worksheet C, ln 10.C & Ln 12.J) (159,831,378) DA (3,984,988)
211 Account No. 190.1 (Worksheet C, ln 19.C & Ln 21.J) 88,494,193 DA 7,445,698
212 Account No. 255 (enter negative) (Worksheet C, ln 28.C & Ln 30.J) (182,874) DA (29,886)
213 TOTAL ADJUSTMENTS (sum lns 208 to 212) (728,496,451) (112,403,035)
214 PLANT HELD FOR FUTURE USE (Worksheet A ln 29.C & ln 30.C) 181,474 DA -
215 WORKING CAPITAL (Note F)
216 Cash Working Capital (1/8 * ln 231) (Note G) 1,528,687 1,412,351
217 Transmission Materials & Supplies (Worksheet D, ln 2.(D)) 419,745 TP 0.92390 387,802
218 A&G Materials & Supplies (Worksheet D, ln 3.(D)) 324,917 W/S 0.07494 24,350
219 Stores Expense (Worksheet D, ln 4.(D)) - GP(h) 0.16343 -
220 Prepayments (Account 165) - Labor Allocated (Worksheet D, ln 5.G) 111,415,611 W/S 0.07494 8,349,609
221 Prepayments (Account 165) - Gross Plant (Worksheet D, ln 5.F) 2,904,855 GP(h) 0.16343 474,729
222 Prepayments (Account 165) - Transmission Only (Worksheet D, ln 5.E) - DA 1.00000 -
223 Prepayments (Account 165) - Unallocable (Worksheet D, ln 5.D) (107,233,277) NA 0.00000 -
224 TOTAL WORKING CAPITAL (sum lns 216 to 223) 9,360,538 10,648,841
225 IPP CONTRIBUTIONS FOR CONSTRUCTION (Note H) (Worksheet E, ln 7.(B)) (3,612,688) DA 1.00000 (3,612,688)
226 RATE BASE (sum lns 206, 213, 214, 224, 225) 1,812,728,000 351,936,545
(4)
Allocator
AEP - SPP Formula Rate
PSO TCOS - Historic
Page: 14 of 68
AEP West SPP Member Companies
Transmission Cost of Service Formula Rate
Utilizing Historic Cost Data for 2012 with Year-End Rate Base Balances
PUBLIC SERVICE COMPANY OF OKLAHOMA
(1) (2) (3) (5)
EXPENSE, TAXES, RETURN & REVENUE Data Sources Total
REQUIREMENTS CALCULATION (See "General Notes") TO Total Transmission
Line
No. OPERATION & MAINTENANCE EXPENSE
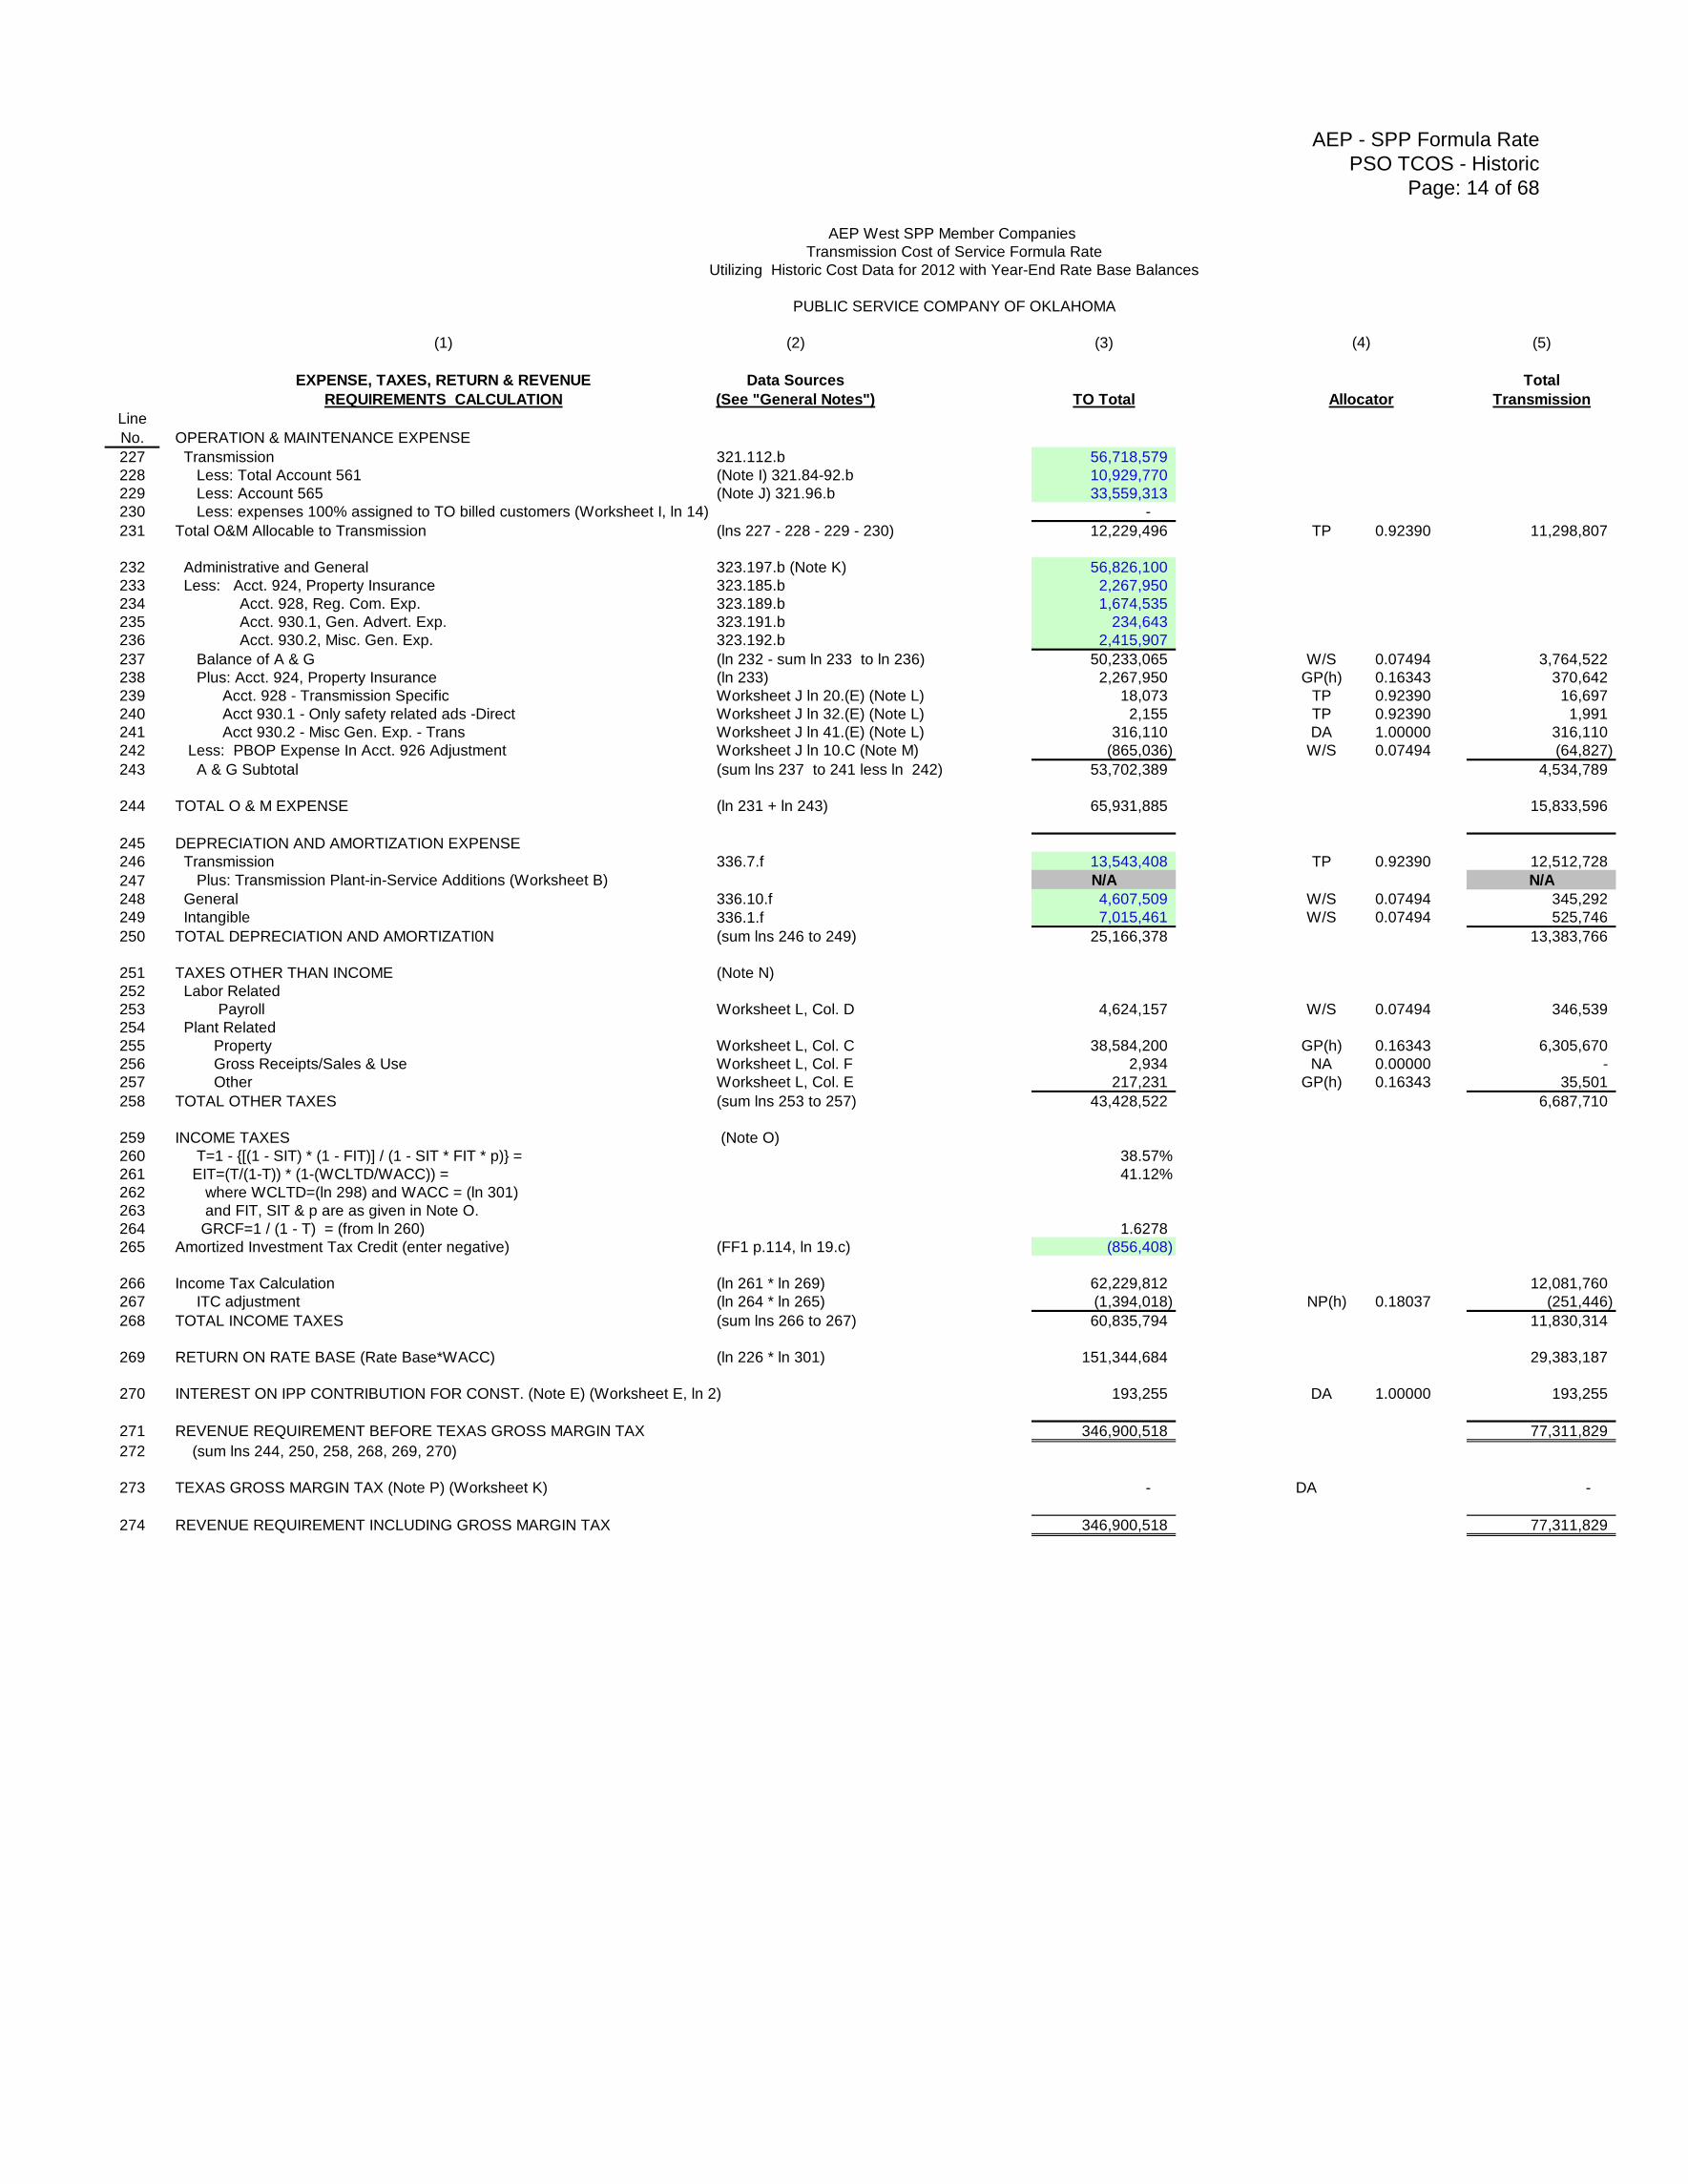
227 Transmission 321.112.b 56,718,579
228 Less: Total Account 561 (Note I) 321.84-92.b 10,929,770
229 Less: Account 565 (Note J) 321.96.b 33,559,313
230 Less: expenses 100% assigned to TO billed customers (Worksheet I, ln 14) -
231 Total O&M Allocable to Transmission (lns 227 - 228 - 229 - 230) 12,229,496 TP 0.92390 11,298,807
232 Administrative and General 323.197.b (Note K) 56,826,100
233 Less: Acct. 924, Property Insurance 323.185.b 2,267,950
234 Acct. 928, Reg. Com. Exp. 323.189.b 1,674,535
235 Acct. 930.1, Gen. Advert. Exp. 323.191.b 234,643
236 Acct. 930.2, Misc. Gen. Exp. 323.192.b 2,415,907
237 Balance of A & G (ln 232 - sum ln 233 to ln 236) 50,233,065 W/S 0.07494 3,764,522
238 Plus: Acct. 924, Property Insurance (ln 233) 2,267,950 GP(h) 0.16343 370,642
239 Acct. 928 - Transmission Specific Worksheet J ln 20.(E) (Note L) 18,073 TP 0.92390 16,697
240 Acct 930.1 - Only safety related ads -Direct Worksheet J ln 32.(E) (Note L) 2,155 TP 0.92390 1,991
241 Acct 930.2 - Misc Gen. Exp. - Trans Worksheet J ln 41.(E) (Note L) 316,110 DA 1.00000 316,110
242 Less: PBOP Expense In Acct. 926 Adjustment Worksheet J ln 10.C (Note M) (865,036) W/S 0.07494 (64,827)
243 A & G Subtotal (sum lns 237 to 241 less ln 242) 53,702,389 4,534,789
244 TOTAL O & M EXPENSE (ln 231 + ln 243) 65,931,885 15,833,596
245 DEPRECIATION AND AMORTIZATION EXPENSE
246 Transmission 336.7.f 13,543,408 TP 0.92390 12,512,728
247 Plus: Transmission Plant-in-Service Additions (Worksheet B) N/A N/A
248 General 336.10.f 4,607,509 W/S 0.07494 345,292
249 Intangible 336.1.f 7,015,461 W/S 0.07494 525,746
250 TOTAL DEPRECIATION AND AMORTIZATI0N (sum lns 246 to 249) 25,166,378 13,383,766
251 TAXES OTHER THAN INCOME (Note N)
252 Labor Related
253 Payroll Worksheet L, Col. D 4,624,157 W/S 0.07494 346,539
254 Plant Related
255 Property Worksheet L, Col. C 38,584,200 GP(h) 0.16343 6,305,670
256 Gross Receipts/Sales & Use Worksheet L, Col. F 2,934 NA 0.00000 -
257 Other Worksheet L, Col. E 217,231 GP(h) 0.16343 35,501
258 TOTAL OTHER TAXES (sum lns 253 to 257) 43,428,522 6,687,710
259 INCOME TAXES (Note O)
260 T=1 - {[(1 - SIT) * (1 - FIT)] / (1 - SIT * FIT * p)} = 38.57%
261 EIT=(T/(1-T)) * (1-(WCLTD/WACC)) = 41.12%
262 where WCLTD=(ln 298) and WACC = (ln 301)
263 and FIT, SIT & p are as given in Note O.
264 GRCF=1 / (1 - T) = (from ln 260) 1.6278
265 Amortized Investment Tax Credit (enter negative) (FF1 p.114, ln 19.c) (856,408)
266 Income Tax Calculation (ln 261 * ln 269) 62,229,812 12,081,760
267 ITC adjustment (ln 264 * ln 265) (1,394,018) NP(h) 0.18037 (251,446)
268 TOTAL INCOME TAXES (sum lns 266 to 267) 60,835,794 11,830,314
269 RETURN ON RATE BASE (Rate Base*WACC) (ln 226 * ln 301) 151,344,684 29,383,187
270 INTEREST ON IPP CONTRIBUTION FOR CONST. (Note E) (Worksheet E, ln 2) 193,255 DA 1.00000 193,255
271 REVENUE REQUIREMENT BEFORE TEXAS GROSS MARGIN TAX 346,900,518 77,311,829
272 (sum lns 244, 250, 258, 268, 269, 270)
273 TEXAS GROSS MARGIN TAX (Note P) (Worksheet K) - DA -
274 REVENUE REQUIREMENT INCLUDING GROSS MARGIN TAX 346,900,518 77,311,829
Allocator
(4)
AEP - SPP Formula Rate
PSO TCOS - Historic
Page: 15 of 68
AEP West SPP Member Companies
Transmission Cost of Service Formula Rate
Utilizing Historic Cost Data for 2012 with Year-End Rate Base Balances
PUBLIC SERVICE COMPANY OF OKLAHOMA
SUPPORTING CALCULATIONS
ln
No. TRANSMISSION PLANT INCLUDED IN SPP TARIFF
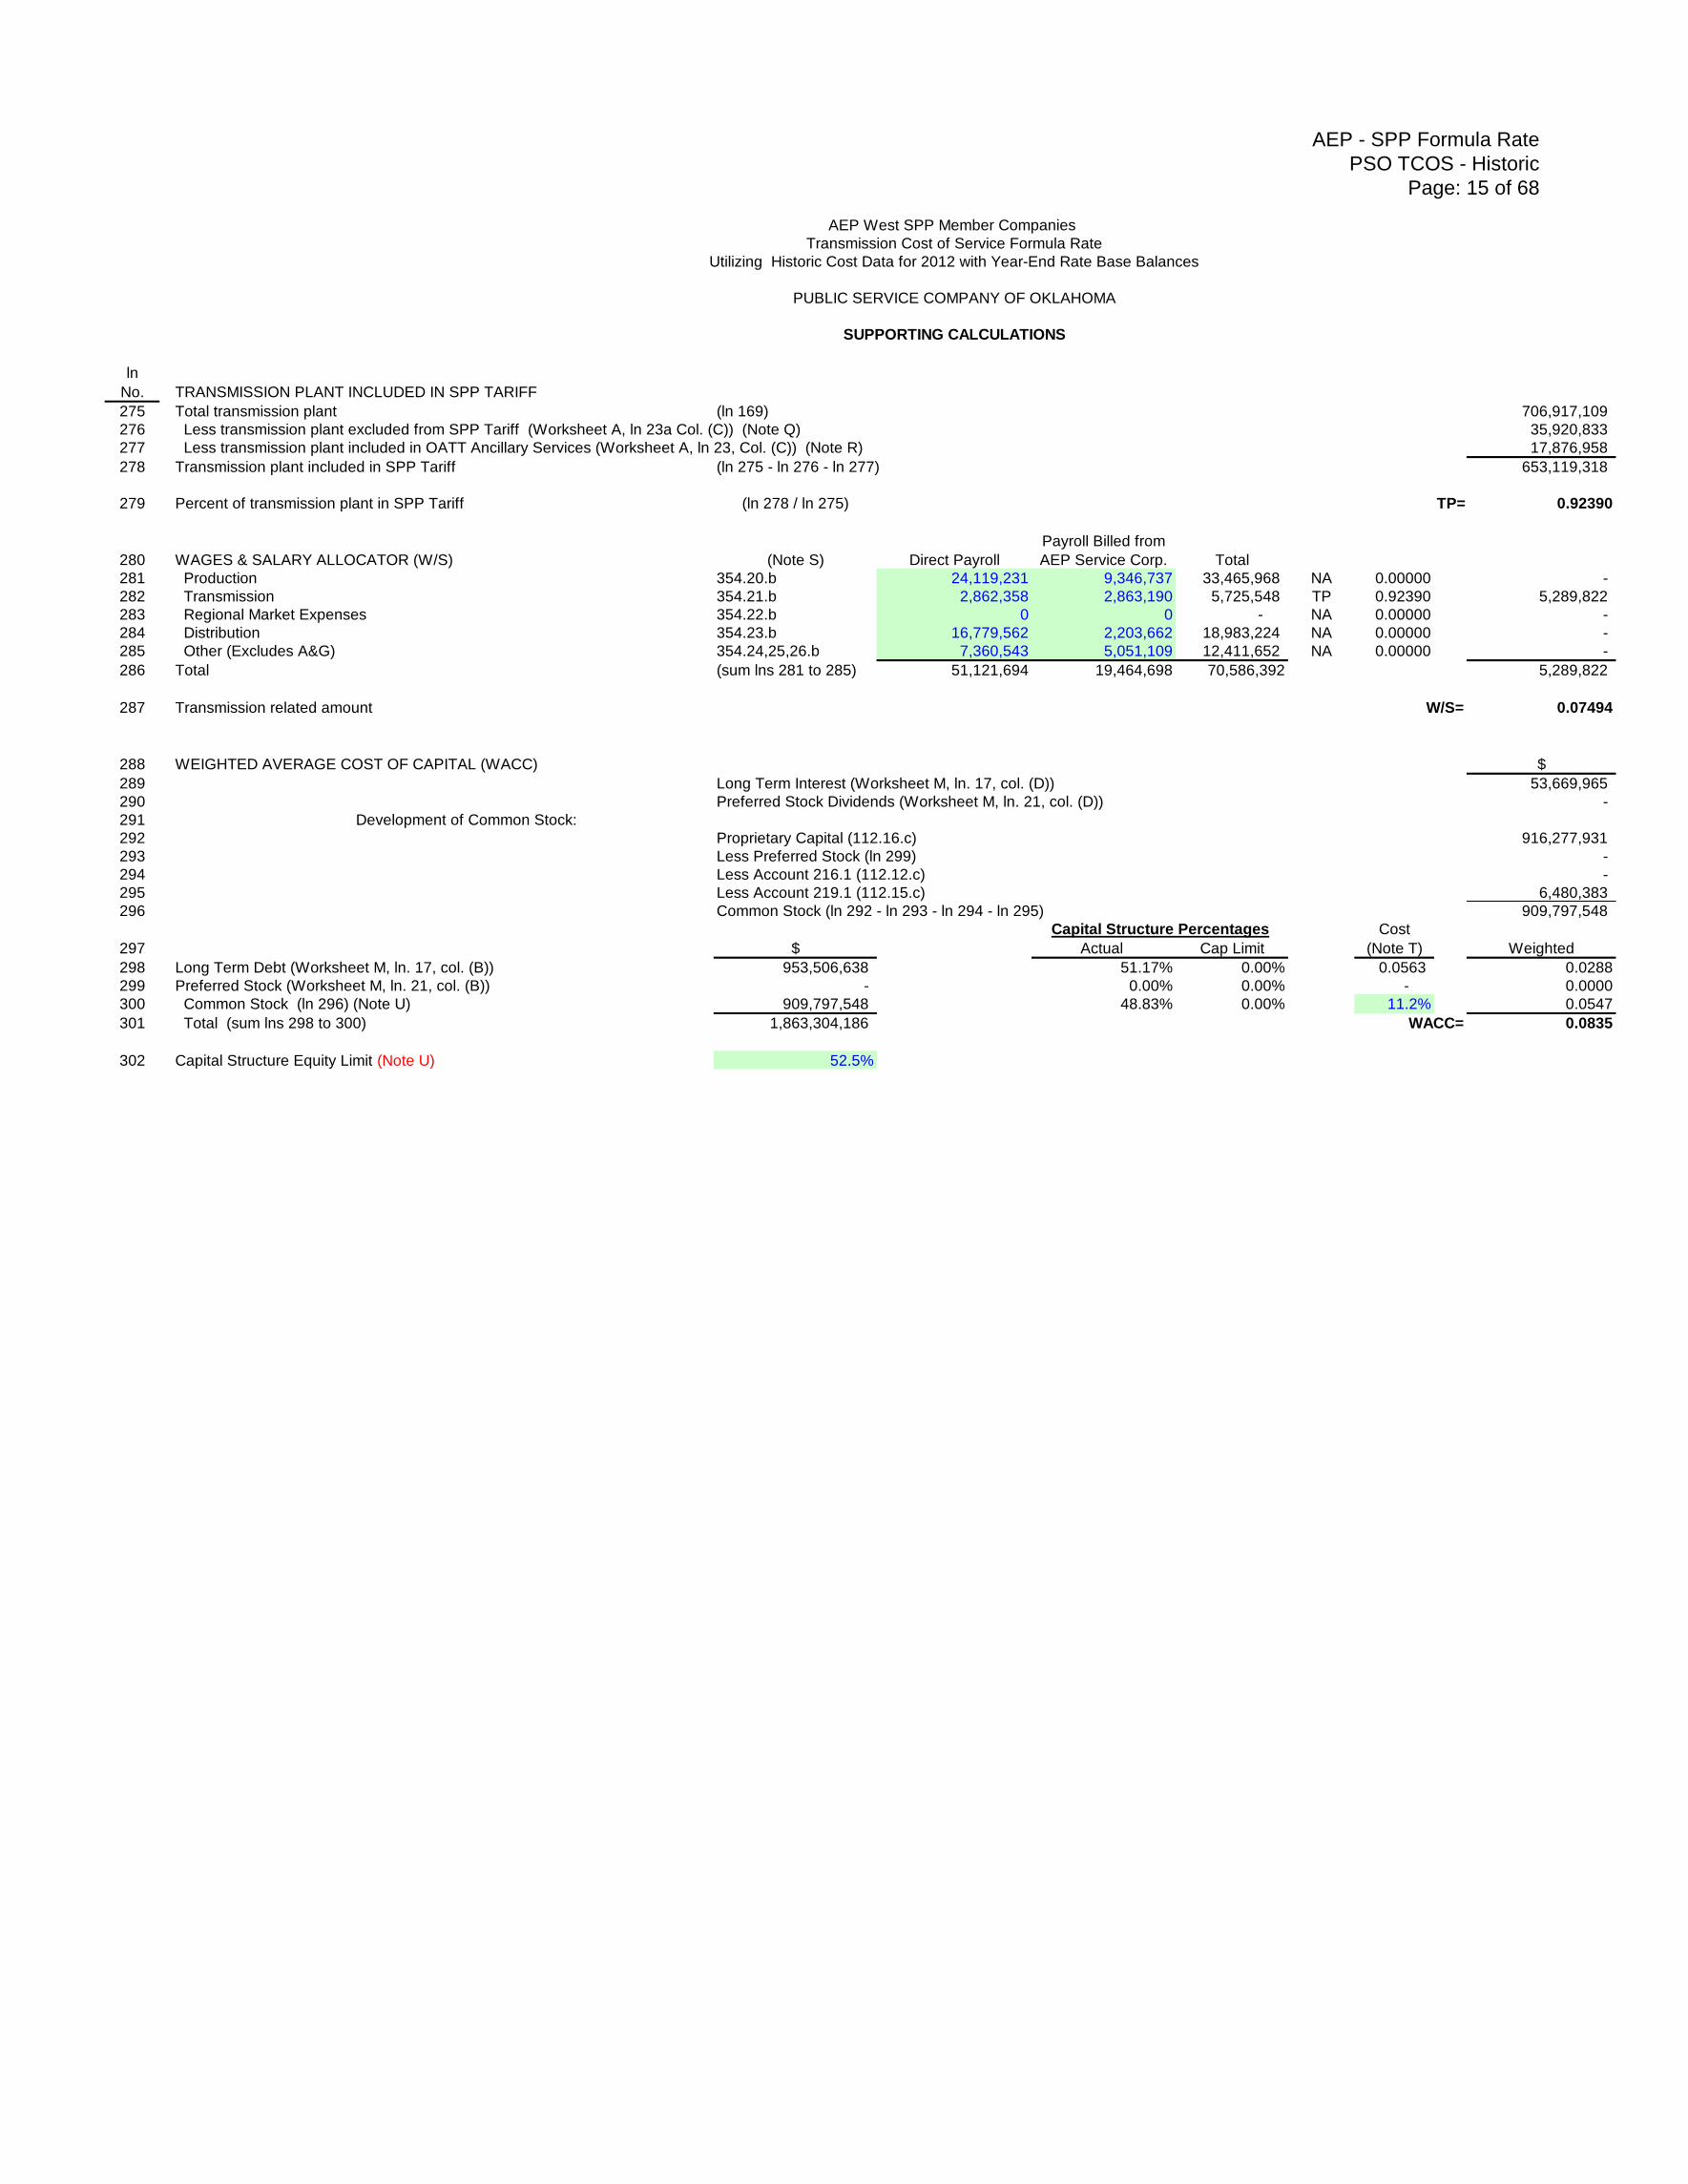
275 Total transmission plant (ln 169) 706,917,109
276 Less transmission plant excluded from SPP Tariff (Worksheet A, ln 23a Col. (C)) (Note Q) 35,920,833
277 Less transmission plant included in OATT Ancillary Services (Worksheet A, ln 23, Col. (C)) (Note R) 17,876,958
278 Transmission plant included in SPP Tariff (ln 275 - ln 276 - ln 277) 653,119,318
279 Percent of transmission plant in SPP Tariff (ln 278 / ln 275) TP= 0.92390
280 WAGES & SALARY ALLOCATOR (W/S) (Note S) Direct Payroll
Payroll Billed from
AEP Service Corp. Total
281 Production 354.20.b 24,119,231 9,346,737 33,465,968 NA 0.00000 -
282 Transmission 354.21.b 2,862,358 2,863,190 5,725,548 TP 0.92390 5,289,822
283 Regional Market Expenses 354.22.b 0 0 - NA 0.00000 -
284 Distribution 354.23.b 16,779,562 2,203,662 18,983,224 NA 0.00000 -
285 Other (Excludes A&G) 354.24,25,26.b 7,360,543 5,051,109 12,411,652 NA 0.00000 -
286 Total (sum lns 281 to 285) 51,121,694 19,464,698 70,586,392 5,289,822
287 Transmission related amount W/S= 0.07494
288 WEIGHTED AVERAGE COST OF CAPITAL (WACC) $
289 Long Term Interest (Worksheet M, ln. 17, col. (D)) 53,669,965
290 Preferred Stock Dividends (Worksheet M, ln. 21, col. (D)) -
291 Development of Common Stock:
292 Proprietary Capital (112.16.c) 916,277,931
293 Less Preferred Stock (ln 299) -
294 Less Account 216.1 (112.12.c) -
295 Less Account 219.1 (112.15.c) 6,480,383
296 Common Stock (ln 292 - ln 293 - ln 294 - ln 295) 909,797,548
Cost
297 $ Actual Cap Limit (Note T) Weighted
298 Long Term Debt (Worksheet M, ln. 17, col. (B)) 953,506,638 51.17% 0.00% 0.0563 0.0288
299 Preferred Stock (Worksheet M, ln. 21, col. (B)) - 0.00% 0.00% - 0.0000
300 Common Stock (ln 296) (Note U) 909,797,548 48.83% 0.00% 11.2% 0.0547
301 Total (sum lns 298 to 300) 1,863,304,186 WACC= 0.0835
302 Capital Structure Equity Limit (Note U) 52.5%
Capital Structure Percentages
AEP - SPP Formula Rate
PSO TCOS - Historic
Page: 16 of 68
AEP West SPP Member Companies
Transmission Cost of Service Formula Rate
Utilizing Historic Cost Data for 2012 with Year-End Rate Base Balances
PUBLIC SERVICE COMPANY OF OKLAHOMA
Letter Notes
General Notes: a) References to data from FERC Form 1 are indicated as: page#.line#.col.#
b) If transmission owner ("TO") functionalizes its costs to transmission on its books, those costs are shown above and on any supporting
work papers rather than using the allocations above.
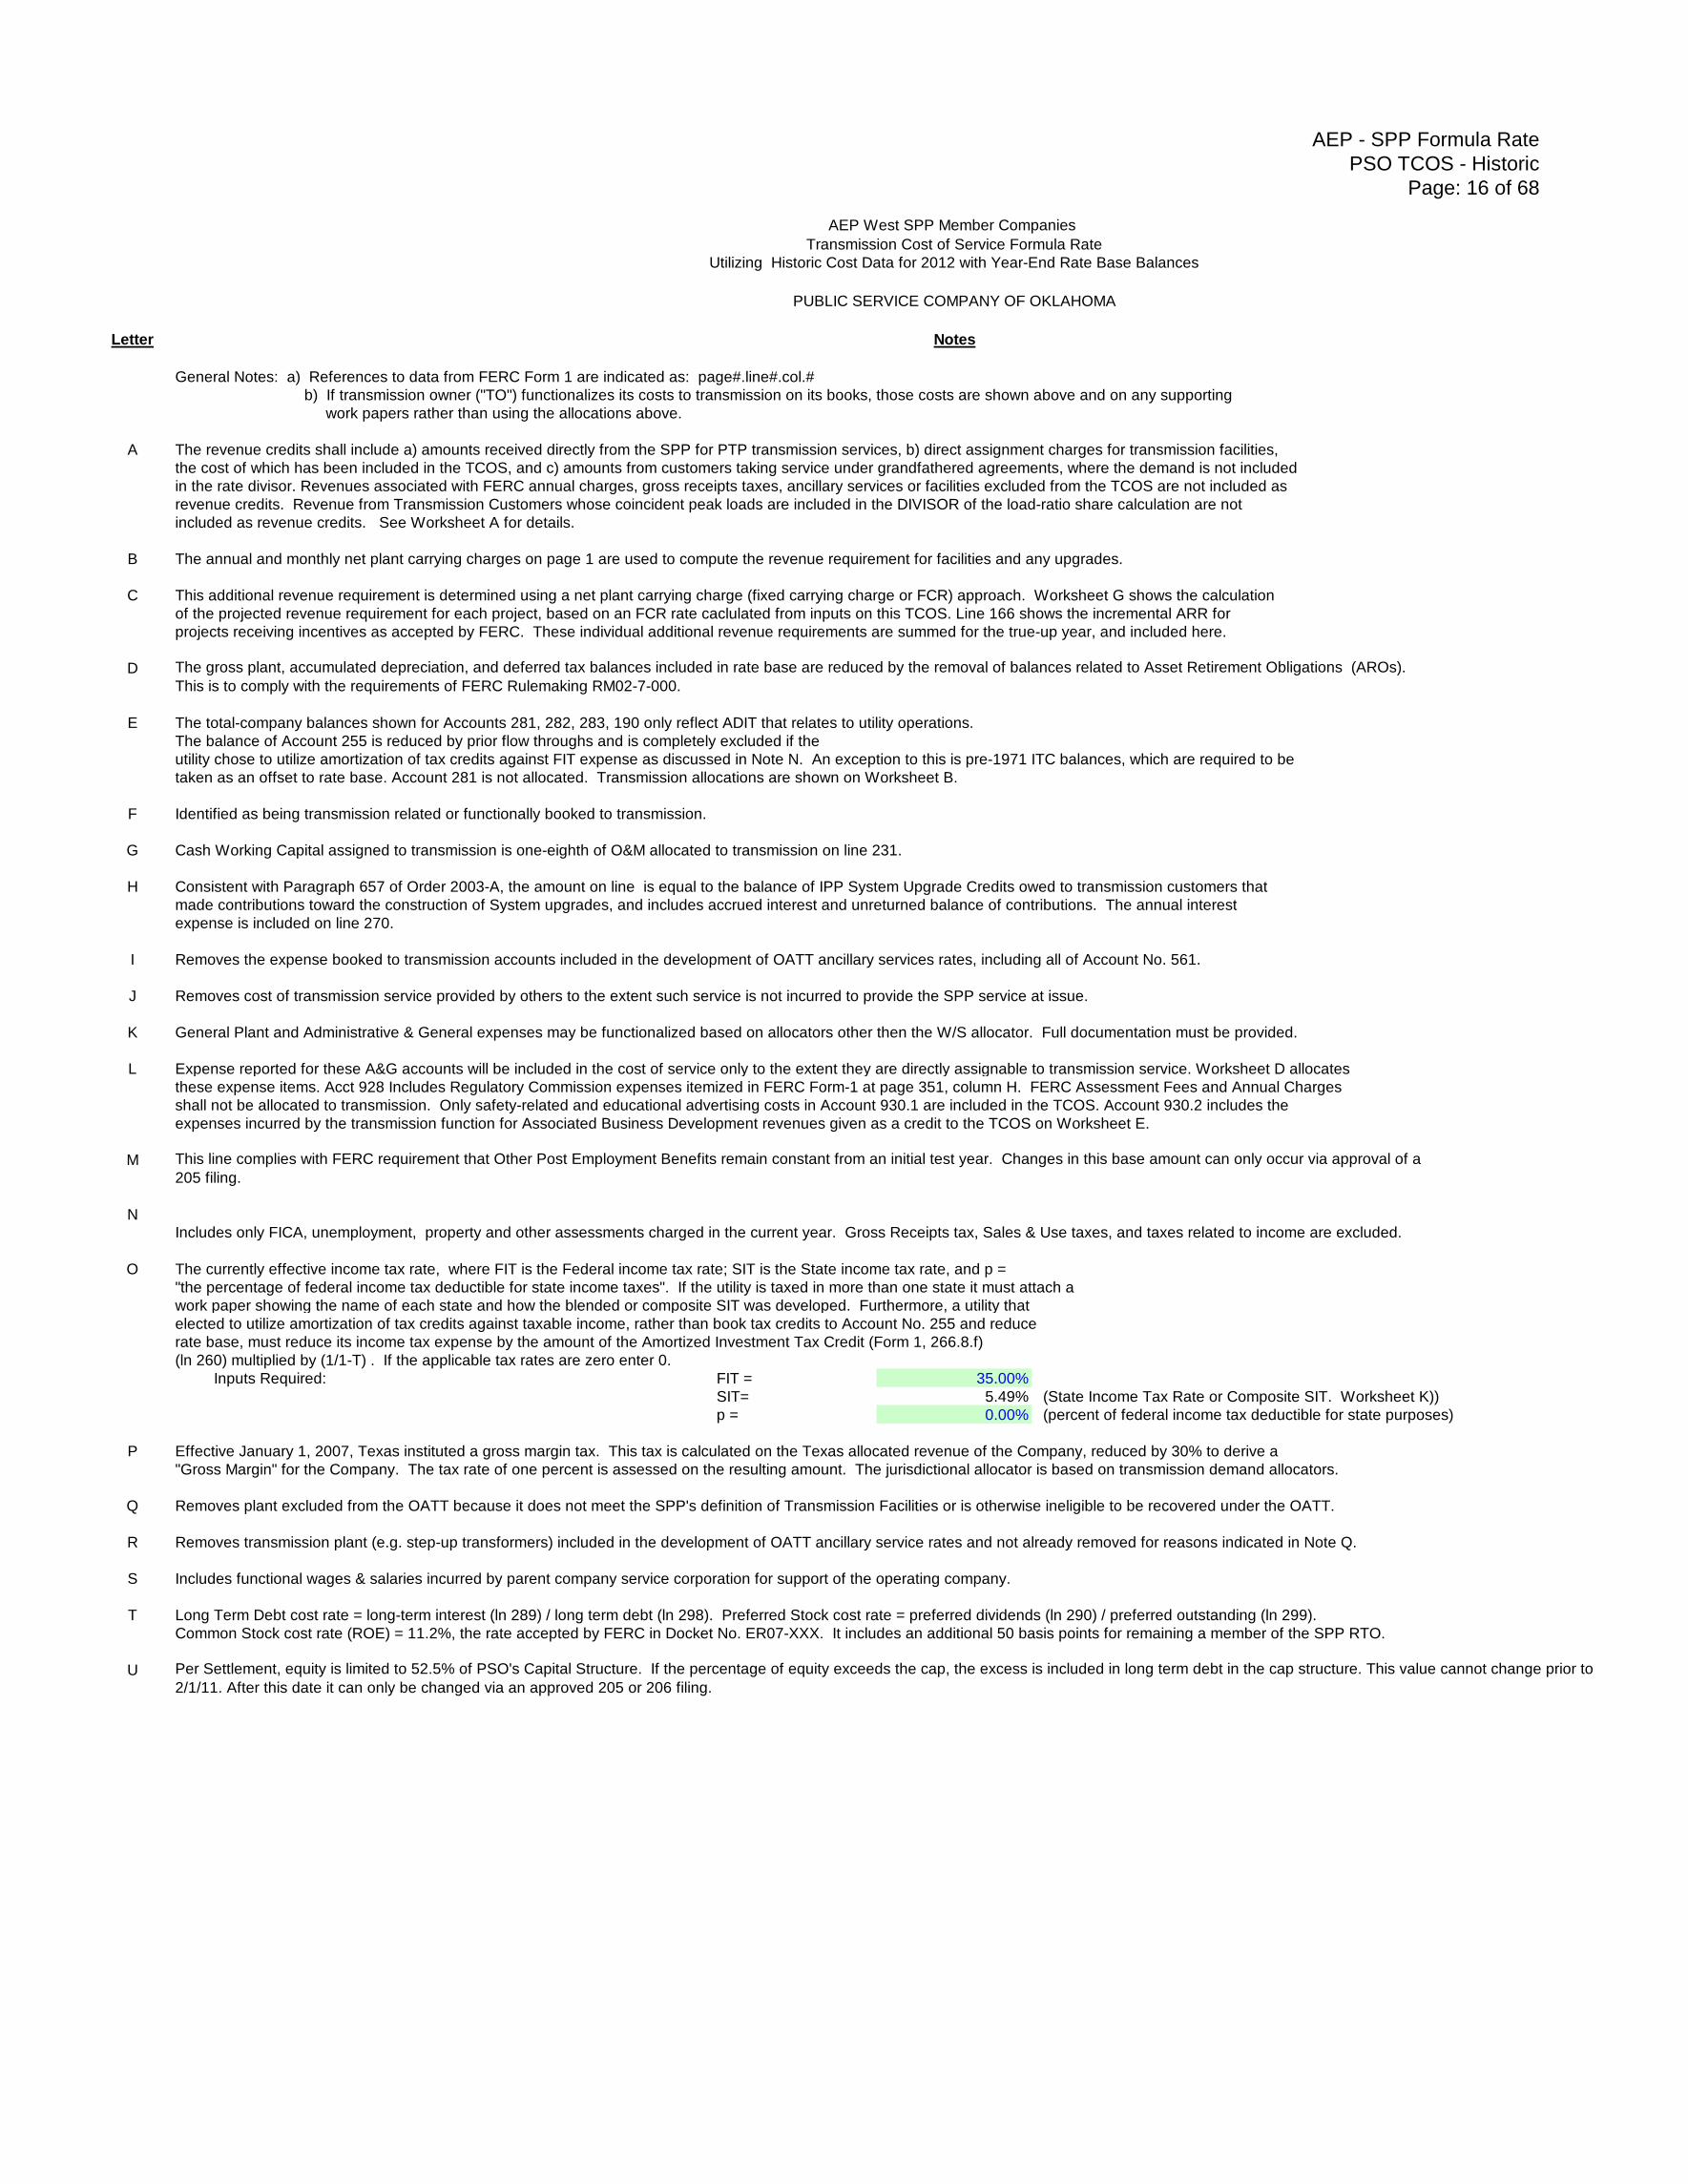
A The revenue credits shall include a) amounts received directly from the SPP for PTP transmission services, b) direct assignment charges for transmission facilities,
the cost of which has been included in the TCOS, and c) amounts from customers taking service under grandfathered agreements, where the demand is not included
in the rate divisor. Revenues associated with FERC annual charges, gross receipts taxes, ancillary services or facilities excluded from the TCOS are not included as
revenue credits. Revenue from Transmission Customers whose coincident peak loads are included in the DIVISOR of the load-ratio share calculation are not
included as revenue credits. See Worksheet A for details.
B The annual and monthly net plant carrying charges on page 1 are used to compute the revenue requirement for facilities and any upgrades.
C This additional revenue requirement is determined using a net plant carrying charge (fixed carrying charge or FCR) approach. Worksheet G shows the calculation
of the projected revenue requirement for each project, based on an FCR rate caclulated from inputs on this TCOS. Line 166 shows the incremental ARR for
projects receiving incentives as accepted by FERC. These individual additional revenue requirements are summed for the true-up year, and included here.
D
E The total-company balances shown for Accounts 281, 282, 283, 190 only reflect ADIT that relates to utility operations.
The balance of Account 255 is reduced by prior flow throughs and is completely excluded if the
utility chose to utilize amortization of tax credits against FIT expense as discussed in Note N. An exception to this is pre-1971 ITC balances, which are required to be
taken as an offset to rate base. Account 281 is not allocated. Transmission allocations are shown on Worksheet B.
F Identified as being transmission related or functionally booked to transmission.
G Cash Working Capital assigned to transmission is one-eighth of O&M allocated to transmission on line 231.
H Consistent with Paragraph 657 of Order 2003-A, the amount on line is equal to the balance of IPP System Upgrade Credits owed to transmission customers that
made contributions toward the construction of System upgrades, and includes accrued interest and unreturned balance of contributions. The annual interest
expense is included on line 270.
I Removes the expense booked to transmission accounts included in the development of OATT ancillary services rates, including all of Account No. 561.
J Removes cost of transmission service provided by others to the extent such service is not incurred to provide the SPP service at issue.
K General Plant and Administrative & General expenses may be functionalized based on allocators other then the W/S allocator. Full documentation must be provided.
L Expense reported for these A&G accounts will be included in the cost of service only to the extent they are directly assignable to transmission service. Worksheet D allocates
these expense items. Acct 928 Includes Regulatory Commission expenses itemized in FERC Form-1 at page 351, column H. FERC Assessment Fees and Annual Charges
shall not be allocated to transmission. Only safety-related and educational advertising costs in Account 930.1 are included in the TCOS. Account 930.2 includes the
expenses incurred by the transmission function for Associated Business Development revenues given as a credit to the TCOS on Worksheet E.
M
N
O The currently effective income tax rate, where FIT is the Federal income tax rate; SIT is the State income tax rate, and p =
"the percentage of federal income tax deductible for state income taxes". If the utility is taxed in more than one state it must attach a
work paper showing the name of each state and how the blended or composite SIT was developed. Furthermore, a utility that
elected to utilize amortization of tax credits against taxable income, rather than book tax credits to Account No. 255 and reduce
rate base, must reduce its income tax expense by the amount of the Amortized Investment Tax Credit (Form 1, 266.8.f)
(ln 260) multiplied by (1/1-T) . If the applicable tax rates are zero enter 0.
Inputs Required: FIT = 35.00%
SIT= 5.49% (State Income Tax Rate or Composite SIT. Worksheet K))
p = 0.00% (percent of federal income tax deductible for state purposes)
P Effective January 1, 2007, Texas instituted a gross margin tax. This tax is calculated on the Texas allocated revenue of the Company, reduced by 30% to derive a
"Gross Margin" for the Company. The tax rate of one percent is assessed on the resulting amount. The jurisdictional allocator is based on transmission demand allocators.
Q Removes plant excluded from the OATT because it does not meet the SPP's definition of Transmission Facilities or is otherwise ineligible to be recovered under the OATT.
R Removes transmission plant (e.g. step-up transformers) included in the development of OATT ancillary service rates and not already removed for reasons indicated in Note Q.
S Includes functional wages & salaries incurred by parent company service corporation for support of the operating company.
T Long Term Debt cost rate = long-term interest (ln 289) / long term debt (ln 298). Preferred Stock cost rate = preferred dividends (ln 290) / preferred outstanding (ln 299).
Common Stock cost rate (ROE) = 11.2%, the rate accepted by FERC in Docket No. ER07-XXX. It includes an additional 50 basis points for remaining a member of the SPP RTO.
U
The gross plant, accumulated depreciation, and deferred tax balances included in rate base are reduced by the removal of balances related to Asset Retirement Obligations (AROs).
This is to comply with the requirements of FERC Rulemaking RM02-7-000.
This line complies with FERC requirement that Other Post Employment Benefits remain constant from an initial test year. Changes in this base amount can only occur via approval of a
205 filing.
Per Settlement, equity is limited to 52.5% of PSO's Capital Structure. If the percentage of equity exceeds the cap, the excess is included in long term debt in the cap structure. This value cannot change prior to
2/1/11. After this date it can only be changed via an approved 205 or 206 filing.
Includes only FICA, unemployment, property and other assessments charged in the current year. Gross Receipts tax, Sales & Use taxes, and taxes related to income are excluded.
AEP - SPP Formula Rate
PSO TCOS - True-Up
Page: 17 of 68
AEP West SPP Member Companies
Transmission Cost of Service Formula Rate
Utilizing Actual Cost Data for 2012 with Average Ratebase Balances
PUBLIC SERVICE COMPANY OF OKLAHOMA
Line Transmission
No. Amount
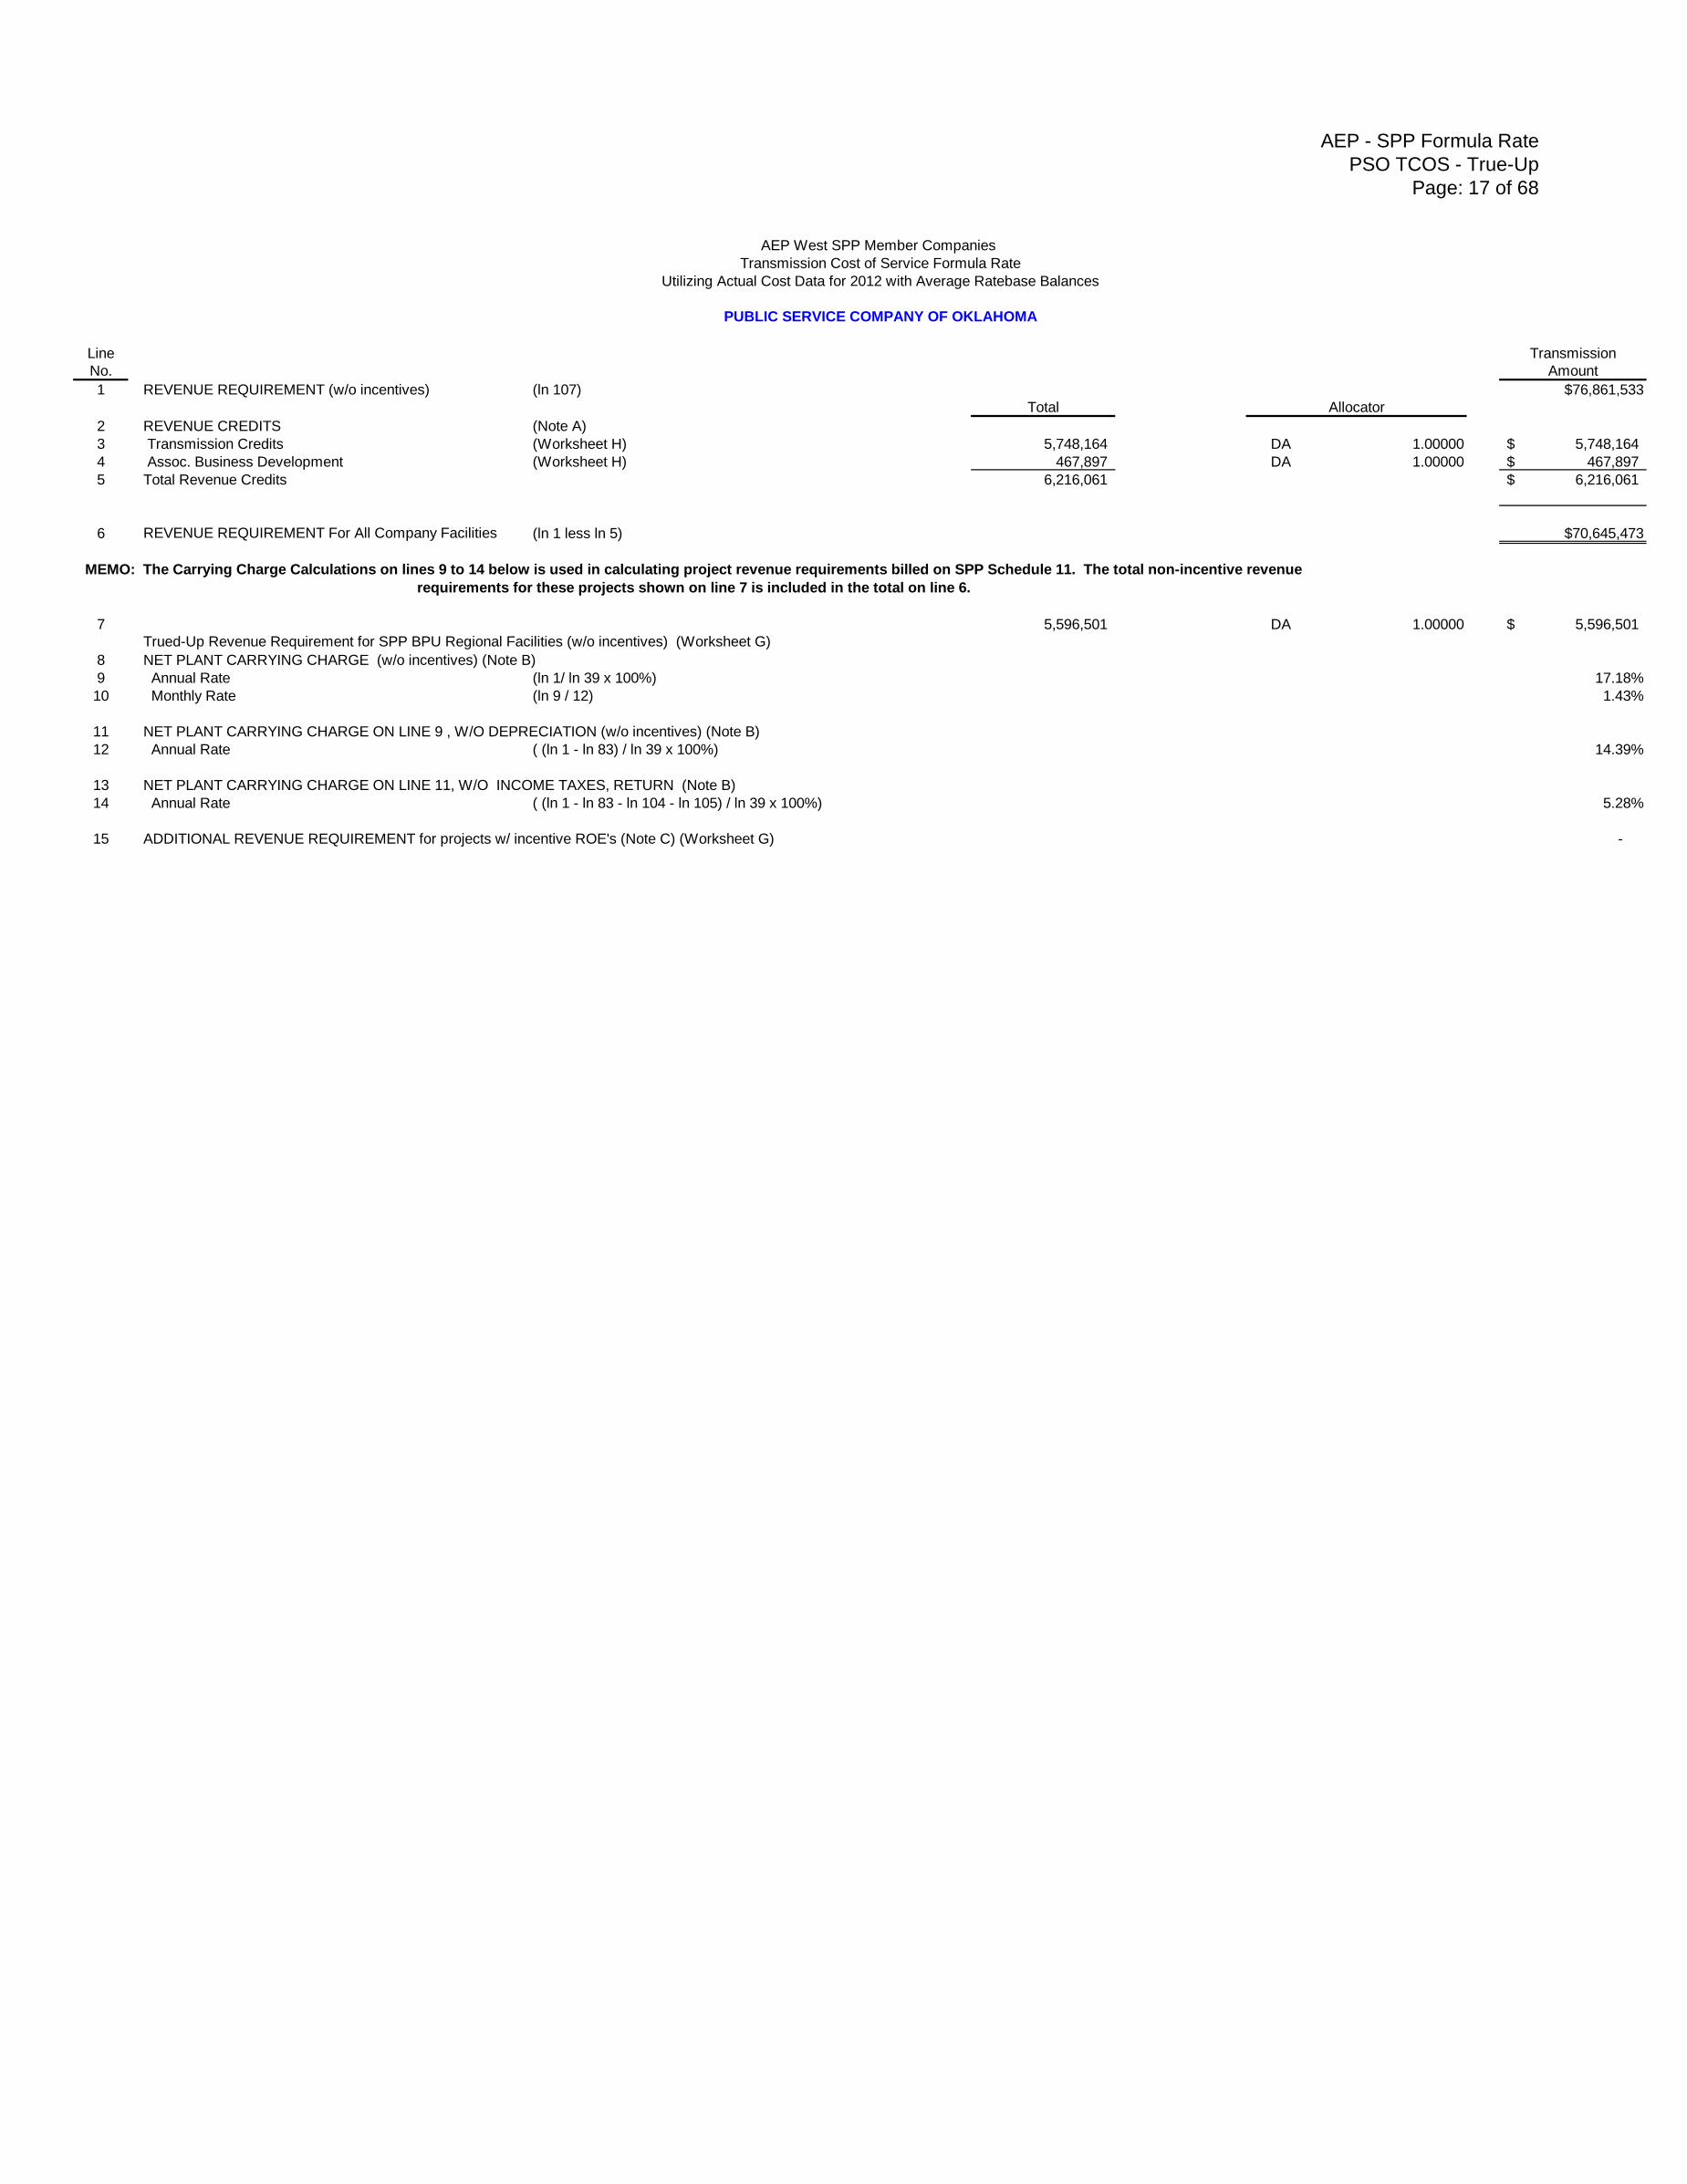
1 REVENUE REQUIREMENT (w/o incentives) (ln 107) $76,861,533
Total Allocator
2 REVENUE CREDITS (Note A)
3 Transmission Credits (Worksheet H) 5,748,164 DA 1.00000 5,748,164$
4 Assoc. Business Development (Worksheet H) 467,897 DA 1.00000 467,897$
5 Total Revenue Credits 6,216,061 6,216,061$
6 REVENUE REQUIREMENT For All Company Facilities (ln 1 less ln 5) $70,645,473
7 5,596,501 DA 1.00000 5,596,501$
8 NET PLANT CARRYING CHARGE (w/o incentives) (Note B)
9 Annual Rate (ln 1/ ln 39 x 100%) 17.18%
10 Monthly Rate (ln 9 / 12) 1.43%
11 NET PLANT CARRYING CHARGE ON LINE 9 , W/O DEPRECIATION (w/o incentives) (Note B)
12 Annual Rate ( (ln 1 - ln 83) / ln 39 x 100%) 14.39%
13 NET PLANT CARRYING CHARGE ON LINE 11, W/O INCOME TAXES, RETURN (Note B)
14 Annual Rate ( (ln 1 - ln 83 - ln 104 - ln 105) / ln 39 x 100%) 5.28%
15 ADDITIONAL REVENUE REQUIREMENT for projects w/ incentive ROE's (Note C) (Worksheet G) -
MEMO: The Carrying Charge Calculations on lines 9 to 14 below is used in calculating project revenue requirements billed on SPP Schedule 11. The total non-incentive revenue
requirements for these projects shown on line 7 is included in the total on line 6.
Trued-Up Revenue Requirement for SPP BPU Regional Facilities (w/o incentives) (Worksheet G)
AEP - SPP Formula Rate
PSO TCOS - True-Up
Page: 18 of 68
AEP West SPP Member Companies
Transmission Cost of Service Formula Rate
Utilizing Actual Cost Data for 2012 with Average Ratebase Balances
PUBLIC SERVICE COMPANY OF OKLAHOMA
(1) (2) (3) (5)
Data Sources Total
RATE BASE CALCULATION (See "General Notes") TO Total Transmission
Line NOTE D
No. GROSS PLANT IN SERVICE
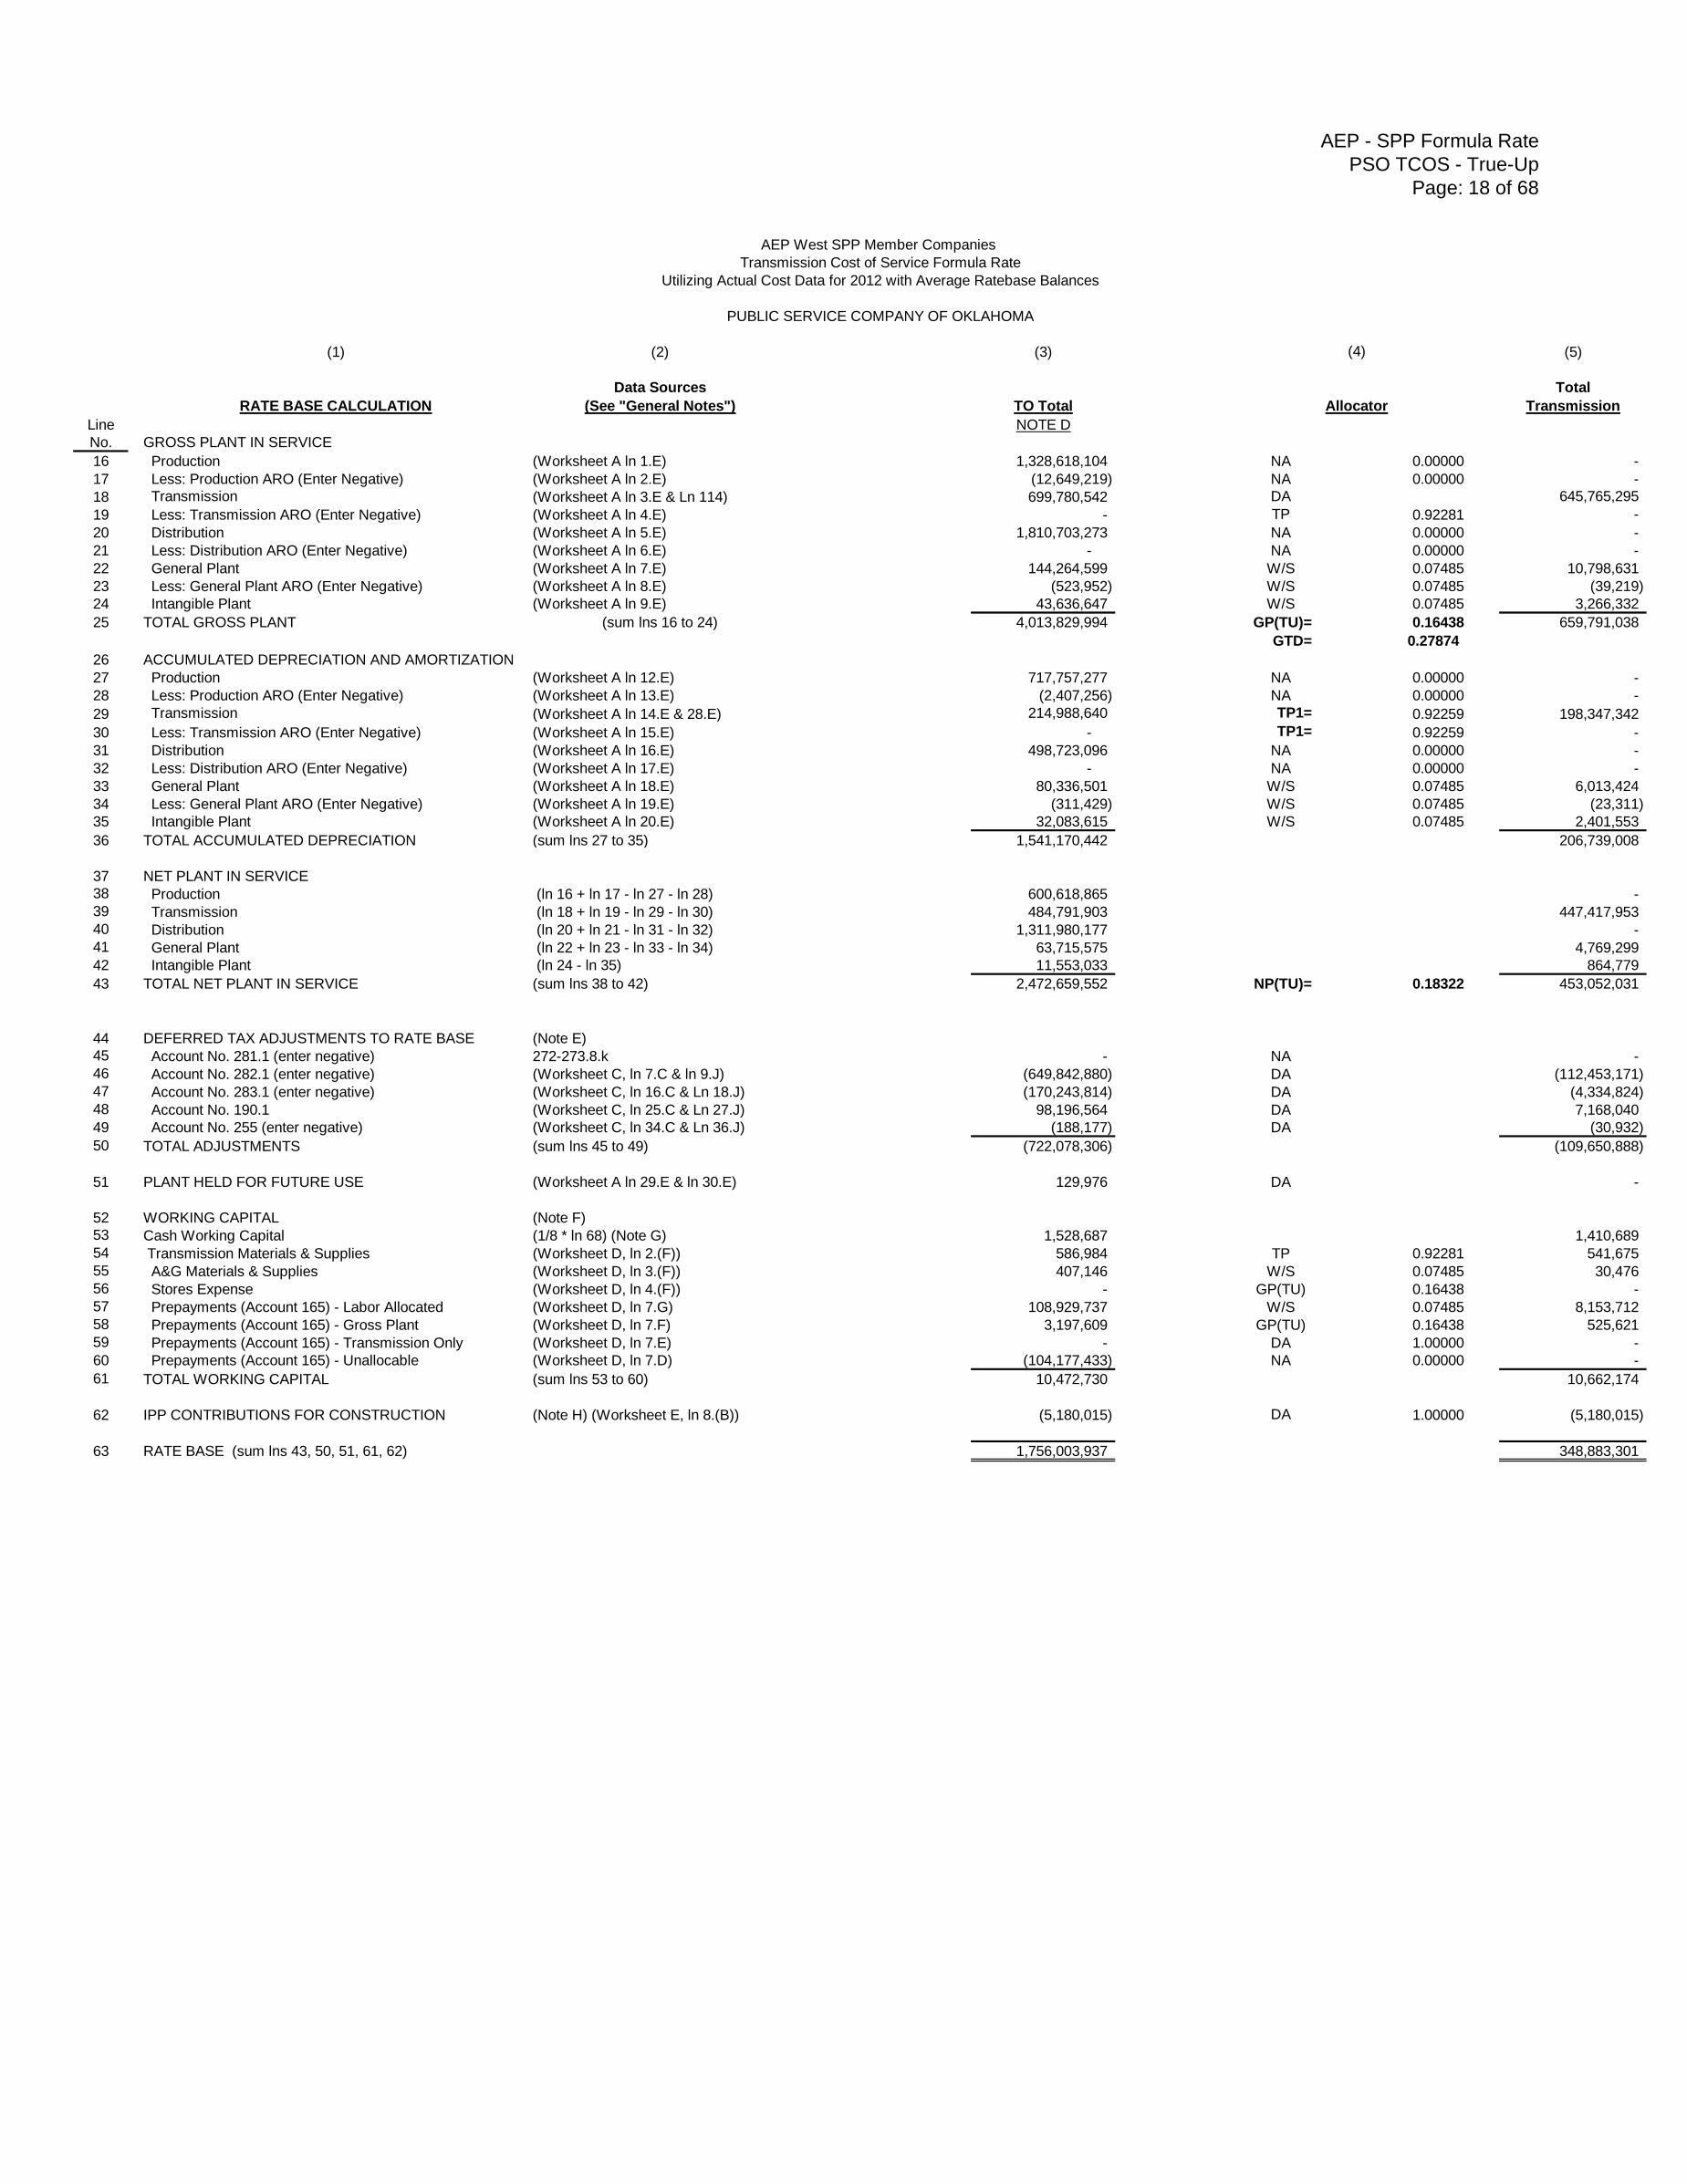
16 Production (Worksheet A ln 1.E) 1,328,618,104 NA 0.00000 -
17 Less: Production ARO (Enter Negative) (Worksheet A ln 2.E) (12,649,219) NA 0.00000 -
18 Transmission (Worksheet A ln 3.E & Ln 114) 699,780,542 DA 645,765,295
19 Less: Transmission ARO (Enter Negative) (Worksheet A ln 4.E) - TP 0.92281 -
20 Distribution (Worksheet A ln 5.E) 1,810,703,273 NA 0.00000 -
21 Less: Distribution ARO (Enter Negative) (Worksheet A ln 6.E) - NA 0.00000 -
22 General Plant (Worksheet A ln 7.E) 144,264,599 W/S 0.07485 10,798,631
23 Less: General Plant ARO (Enter Negative) (Worksheet A ln 8.E) (523,952) W/S 0.07485 (39,219)
24 Intangible Plant (Worksheet A ln 9.E) 43,636,647 W/S 0.07485 3,266,332
25 TOTAL GROSS PLANT (sum lns 16 to 24) 4,013,829,994 GP(TU)= 0.16438 659,791,038
GTD= 0.27874
26 ACCUMULATED DEPRECIATION AND AMORTIZATION
27 Production (Worksheet A ln 12.E) 717,757,277 NA 0.00000 -
28 Less: Production ARO (Enter Negative) (Worksheet A ln 13.E) (2,407,256) NA 0.00000 -
29 Transmission (Worksheet A ln 14.E & 28.E) 214,988,640 TP1= 0.92259 198,347,342
30 Less: Transmission ARO (Enter Negative) (Worksheet A ln 15.E) - TP1= 0.92259 -
31 Distribution (Worksheet A ln 16.E) 498,723,096 NA 0.00000 -
32 Less: Distribution ARO (Enter Negative) (Worksheet A ln 17.E) - NA 0.00000 -
33 General Plant (Worksheet A ln 18.E) 80,336,501 W/S 0.07485 6,013,424
34 Less: General Plant ARO (Enter Negative) (Worksheet A ln 19.E) (311,429) W/S 0.07485 (23,311)
35 Intangible Plant (Worksheet A ln 20.E) 32,083,615 W/S 0.07485 2,401,553
36 TOTAL ACCUMULATED DEPRECIATION (sum lns 27 to 35) 1,541,170,442 206,739,008
37 NET PLANT IN SERVICE
38 Production (ln 16 + ln 17 - ln 27 - ln 28) 600,618,865 -
39 Transmission (ln 18 + ln 19 - ln 29 - ln 30) 484,791,903 447,417,953
40 Distribution (ln 20 + ln 21 - ln 31 - ln 32) 1,311,980,177 -
41 General Plant (ln 22 + ln 23 - ln 33 - ln 34) 63,715,575 4,769,299
42 Intangible Plant (ln 24 - ln 35) 11,553,033 864,779
43 TOTAL NET PLANT IN SERVICE (sum lns 38 to 42) 2,472,659,552 NP(TU)= 0.18322 453,052,031
44 DEFERRED TAX ADJUSTMENTS TO RATE BASE (Note E)
45 Account No. 281.1 (enter negative) 272-273.8.k - NA -
46 Account No. 282.1 (enter negative) (Worksheet C, ln 7.C & ln 9.J) (649,842,880) DA (112,453,171)
47 Account No. 283.1 (enter negative) (Worksheet C, ln 16.C & Ln 18.J) (170,243,814) DA (4,334,824)
48 Account No. 190.1 (Worksheet C, ln 25.C & Ln 27.J) 98,196,564 DA 7,168,040
49 Account No. 255 (enter negative) (Worksheet C, ln 34.C & Ln 36.J) (188,177) DA (30,932)
50 TOTAL ADJUSTMENTS (sum lns 45 to 49) (722,078,306) (109,650,888)
51 PLANT HELD FOR FUTURE USE (Worksheet A ln 29.E & ln 30.E) 129,976 DA -
52 WORKING CAPITAL (Note F)
53 Cash Working Capital (1/8 * ln 68) (Note G) 1,528,687 1,410,689
54 Transmission Materials & Supplies (Worksheet D, ln 2.(F)) 586,984 TP 0.92281 541,675
55 A&G Materials & Supplies (Worksheet D, ln 3.(F)) 407,146 W/S 0.07485 30,476
56 Stores Expense (Worksheet D, ln 4.(F)) - GP(TU) 0.16438 -
57 Prepayments (Account 165) - Labor Allocated (Worksheet D, ln 7.G) 108,929,737 W/S 0.07485 8,153,712
58 Prepayments (Account 165) - Gross Plant (Worksheet D, ln 7.F) 3,197,609 GP(TU) 0.16438 525,621
59 Prepayments (Account 165) - Transmission Only (Worksheet D, ln 7.E) - DA 1.00000 -
60 Prepayments (Account 165) - Unallocable (Worksheet D, ln 7.D) (104,177,433) NA 0.00000 -
61 TOTAL WORKING CAPITAL (sum lns 53 to 60) 10,472,730 10,662,174
62 IPP CONTRIBUTIONS FOR CONSTRUCTION (Note H) (Worksheet E, ln 8.(B)) (5,180,015) DA 1.00000 (5,180,015)
63 RATE BASE (sum lns 43, 50, 51, 61, 62) 1,756,003,937 348,883,301
(4)
Allocator
AEP - SPP Formula Rate
PSO TCOS - True-Up
Page: 19 of 68
AEP West SPP Member Companies
Transmission Cost of Service Formula Rate
Utilizing Actual Cost Data for 2012 with Average Ratebase Balances
PUBLIC SERVICE COMPANY OF OKLAHOMA
(1) (2) (3) (5)
EXPENSE, TAXES, RETURN & REVENUE Data Sources Total
REQUIREMENTS CALCULATION (See "General Notes") TO Total Transmission
Line
No. OPERATION & MAINTENANCE EXPENSE
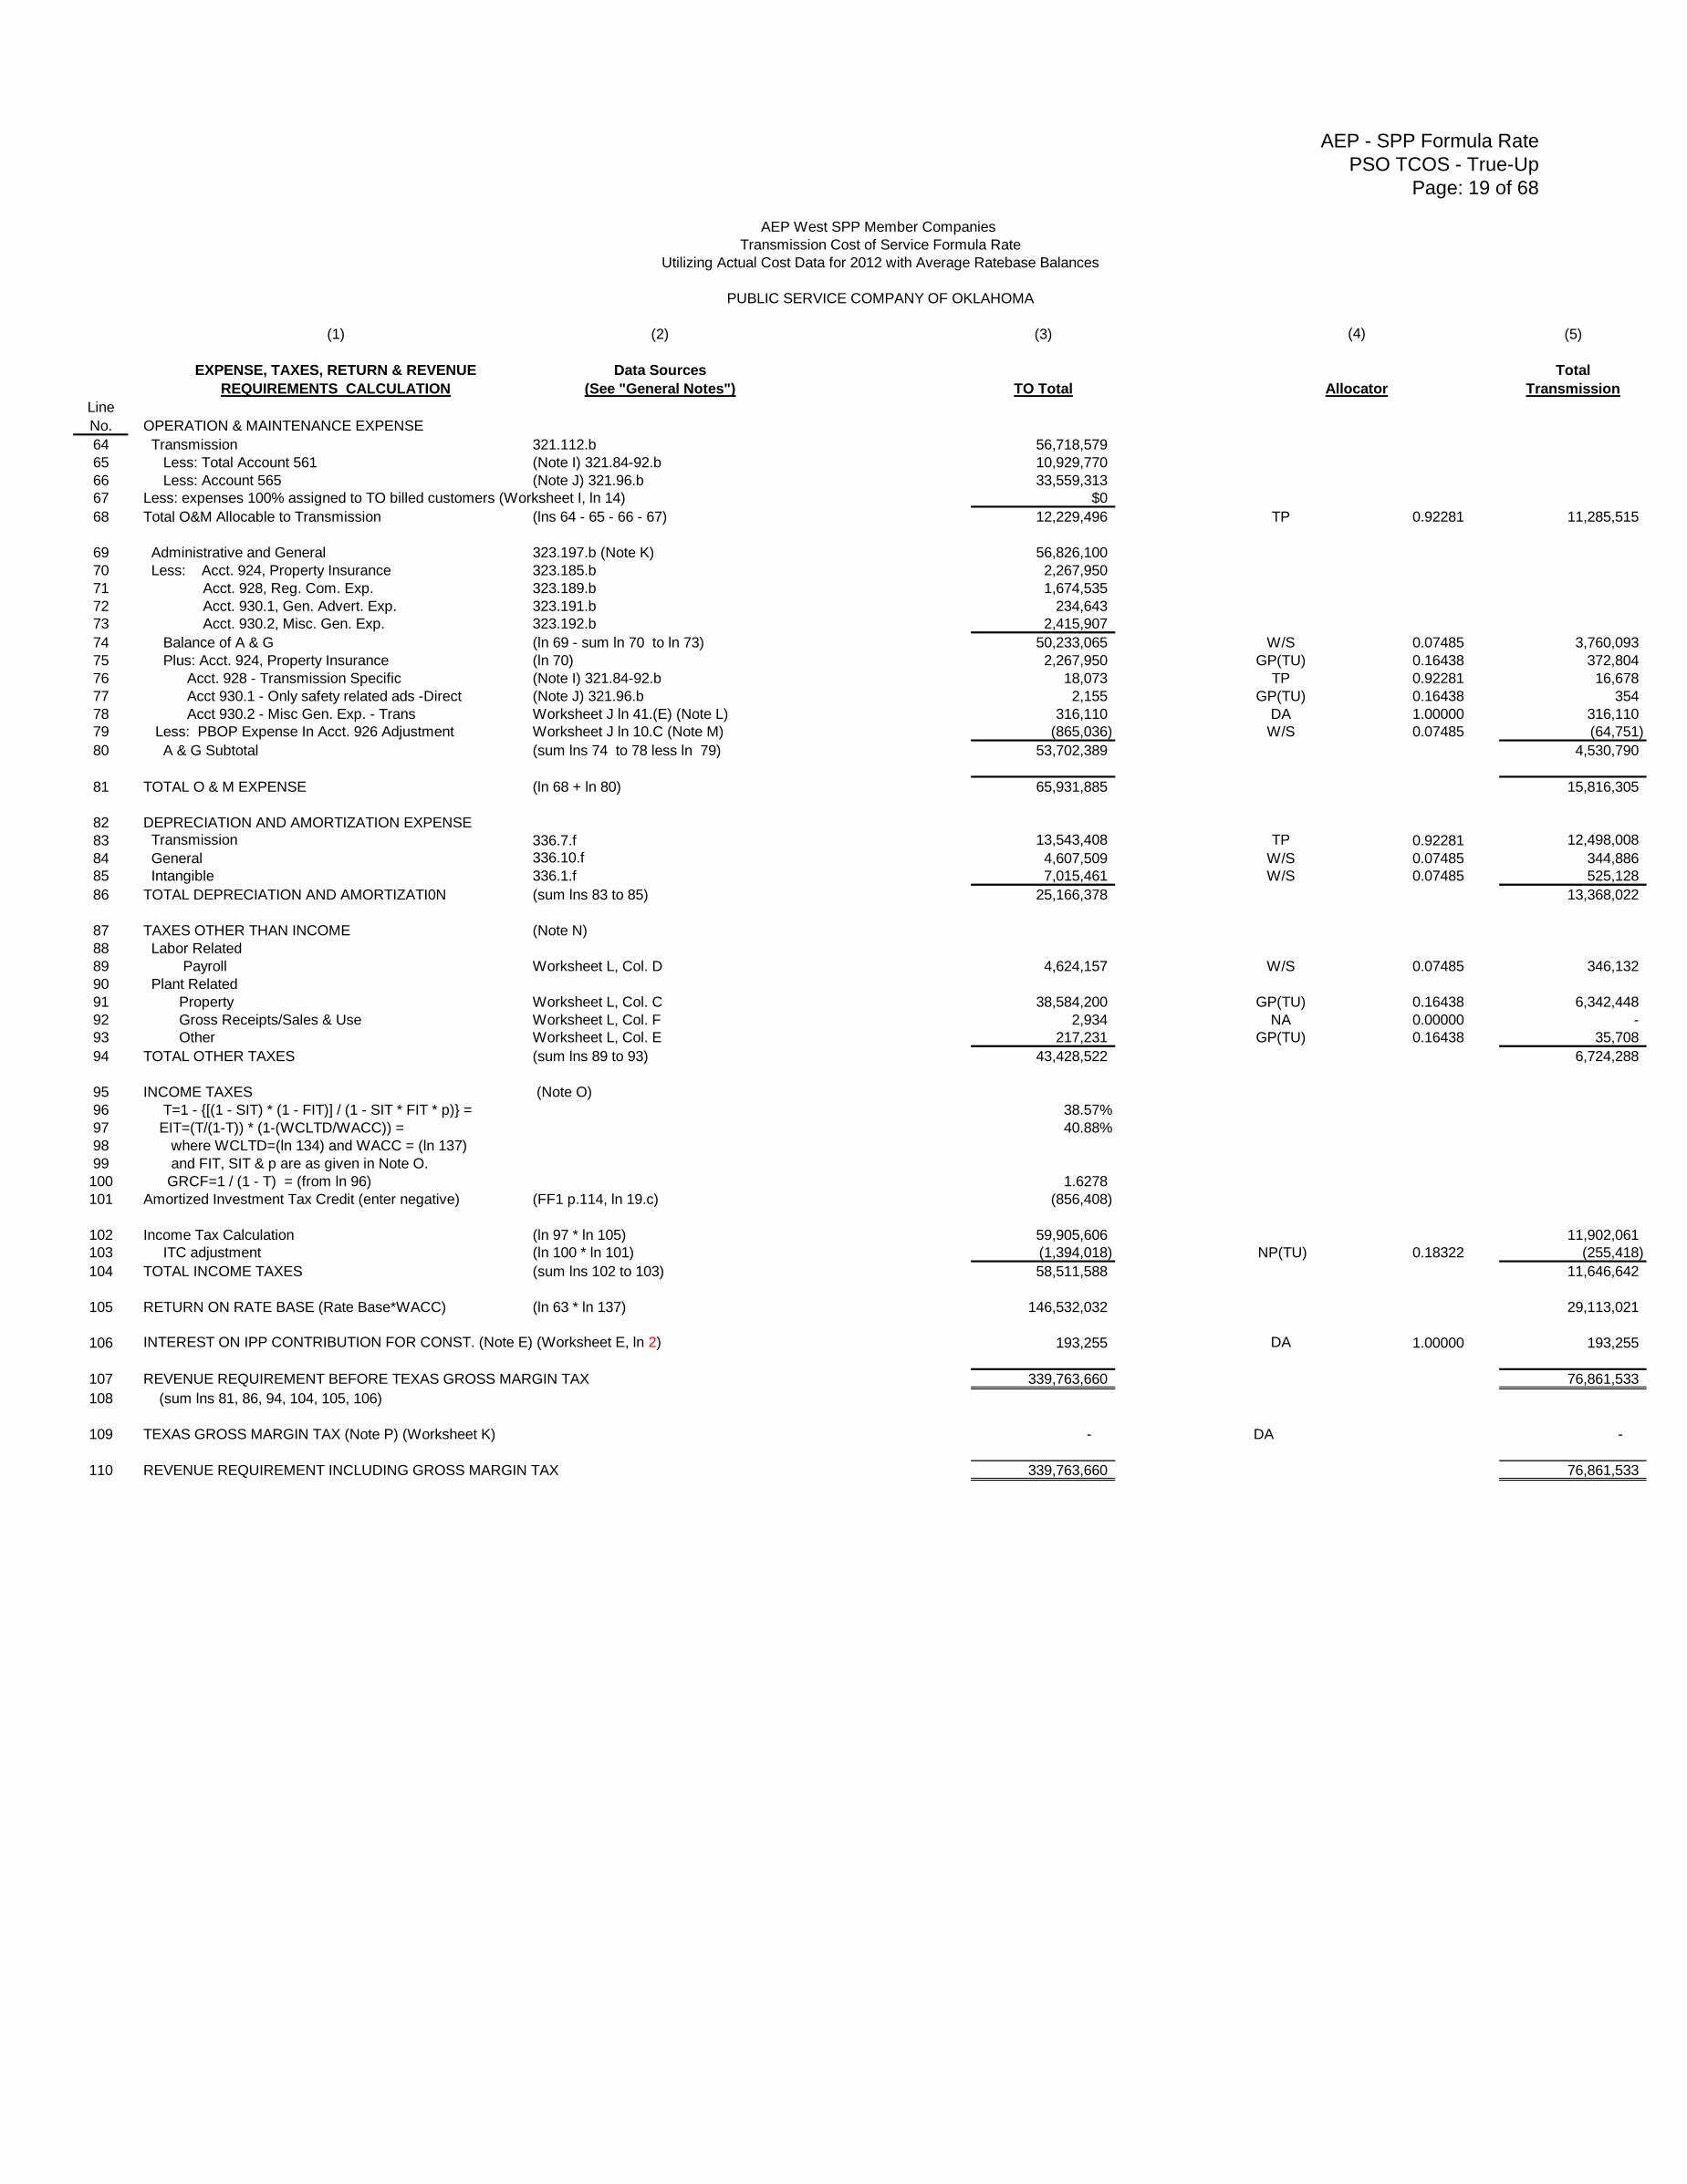
64 Transmission 321.112.b 56,718,579
65 Less: Total Account 561 (Note I) 321.84-92.b 10,929,770
66 Less: Account 565 (Note J) 321.96.b 33,559,313
67 Less: expenses 100% assigned to TO billed customers (Worksheet I, ln 14) $0
68 Total O&M Allocable to Transmission (lns 64 - 65 - 66 - 67) 12,229,496 TP 0.92281 11,285,515
69 Administrative and General 323.197.b (Note K) 56,826,100
70 Less: Acct. 924, Property Insurance 323.185.b 2,267,950
71 Acct. 928, Reg. Com. Exp. 323.189.b 1,674,535
72 Acct. 930.1, Gen. Advert. Exp. 323.191.b 234,643
73 Acct. 930.2, Misc. Gen. Exp. 323.192.b 2,415,907
74 Balance of A & G (ln 69 - sum ln 70 to ln 73) 50,233,065 W/S 0.07485 3,760,093
75 Plus: Acct. 924, Property Insurance (ln 70) 2,267,950 GP(TU) 0.16438 372,804
76 Acct. 928 - Transmission Specific (Note I) 321.84-92.b 18,073 TP 0.92281 16,678
77 Acct 930.1 - Only safety related ads -Direct (Note J) 321.96.b 2,155 GP(TU) 0.16438 354
78 Acct 930.2 - Misc Gen. Exp. - Trans Worksheet J ln 41.(E) (Note L) 316,110 DA 1.00000 316,110
79 Less: PBOP Expense In Acct. 926 Adjustment Worksheet J ln 10.C (Note M) (865,036) W/S 0.07485 (64,751)
80 A & G Subtotal (sum lns 74 to 78 less ln 79) 53,702,389 4,530,790
81 TOTAL O & M EXPENSE (ln 68 + ln 80) 65,931,885 15,816,305
82 DEPRECIATION AND AMORTIZATION EXPENSE
83 Transmission 336.7.f 13,543,408 TP 0.92281 12,498,008
84 General 336.10.f 4,607,509 W/S 0.07485 344,886
85 Intangible 336.1.f 7,015,461 W/S 0.07485 525,128
86 TOTAL DEPRECIATION AND AMORTIZATI0N (sum lns 83 to 85) 25,166,378 13,368,022
87 TAXES OTHER THAN INCOME (Note N)
88 Labor Related
89 Payroll Worksheet L, Col. D 4,624,157 W/S 0.07485 346,132
90 Plant Related
91 Property Worksheet L, Col. C 38,584,200 GP(TU) 0.16438 6,342,448
92 Gross Receipts/Sales & Use Worksheet L, Col. F 2,934 NA 0.00000 -
93 Other Worksheet L, Col. E 217,231 GP(TU) 0.16438 35,708
94 TOTAL OTHER TAXES (sum lns 89 to 93) 43,428,522 6,724,288
95 INCOME TAXES (Note O)
96 T=1 - {[(1 - SIT) * (1 - FIT)] / (1 - SIT * FIT * p)} = 38.57%
97 EIT=(T/(1-T)) * (1-(WCLTD/WACC)) = 40.88%
98 where WCLTD=(ln 134) and WACC = (ln 137)
99 and FIT, SIT & p are as given in Note O.
100 GRCF=1 / (1 - T) = (from ln 96) 1.6278
101 Amortized Investment Tax Credit (enter negative) (FF1 p.114, ln 19.c) (856,408)
102 Income Tax Calculation (ln 97 * ln 105) 59,905,606 11,902,061
103 ITC adjustment (ln 100 * ln 101) (1,394,018) NP(TU) 0.18322 (255,418)
104 TOTAL INCOME TAXES (sum lns 102 to 103) 58,511,588 11,646,642
105 RETURN ON RATE BASE (Rate Base*WACC) (ln 63 * ln 137) 146,532,032 29,113,021
106 INTEREST ON IPP CONTRIBUTION FOR CONST. (Note E) (Worksheet E, ln 2) 193,255 DA 1.00000 193,255
107 REVENUE REQUIREMENT BEFORE TEXAS GROSS MARGIN TAX 339,763,660 76,861,533
108 (sum lns 81, 86, 94, 104, 105, 106)
109 TEXAS GROSS MARGIN TAX (Note P) (Worksheet K) - DA -
110 REVENUE REQUIREMENT INCLUDING GROSS MARGIN TAX 339,763,660 76,861,533
Allocator
(4)
AEP - SPP Formula Rate
PSO TCOS - True-Up
Page: 20 of 68
AEP West SPP Member Companies
Transmission Cost of Service Formula Rate
Utilizing Actual Cost Data for 2012 with Average Ratebase Balances
PUBLIC SERVICE COMPANY OF OKLAHOMA
SUPPORTING CALCULATIONS
ln
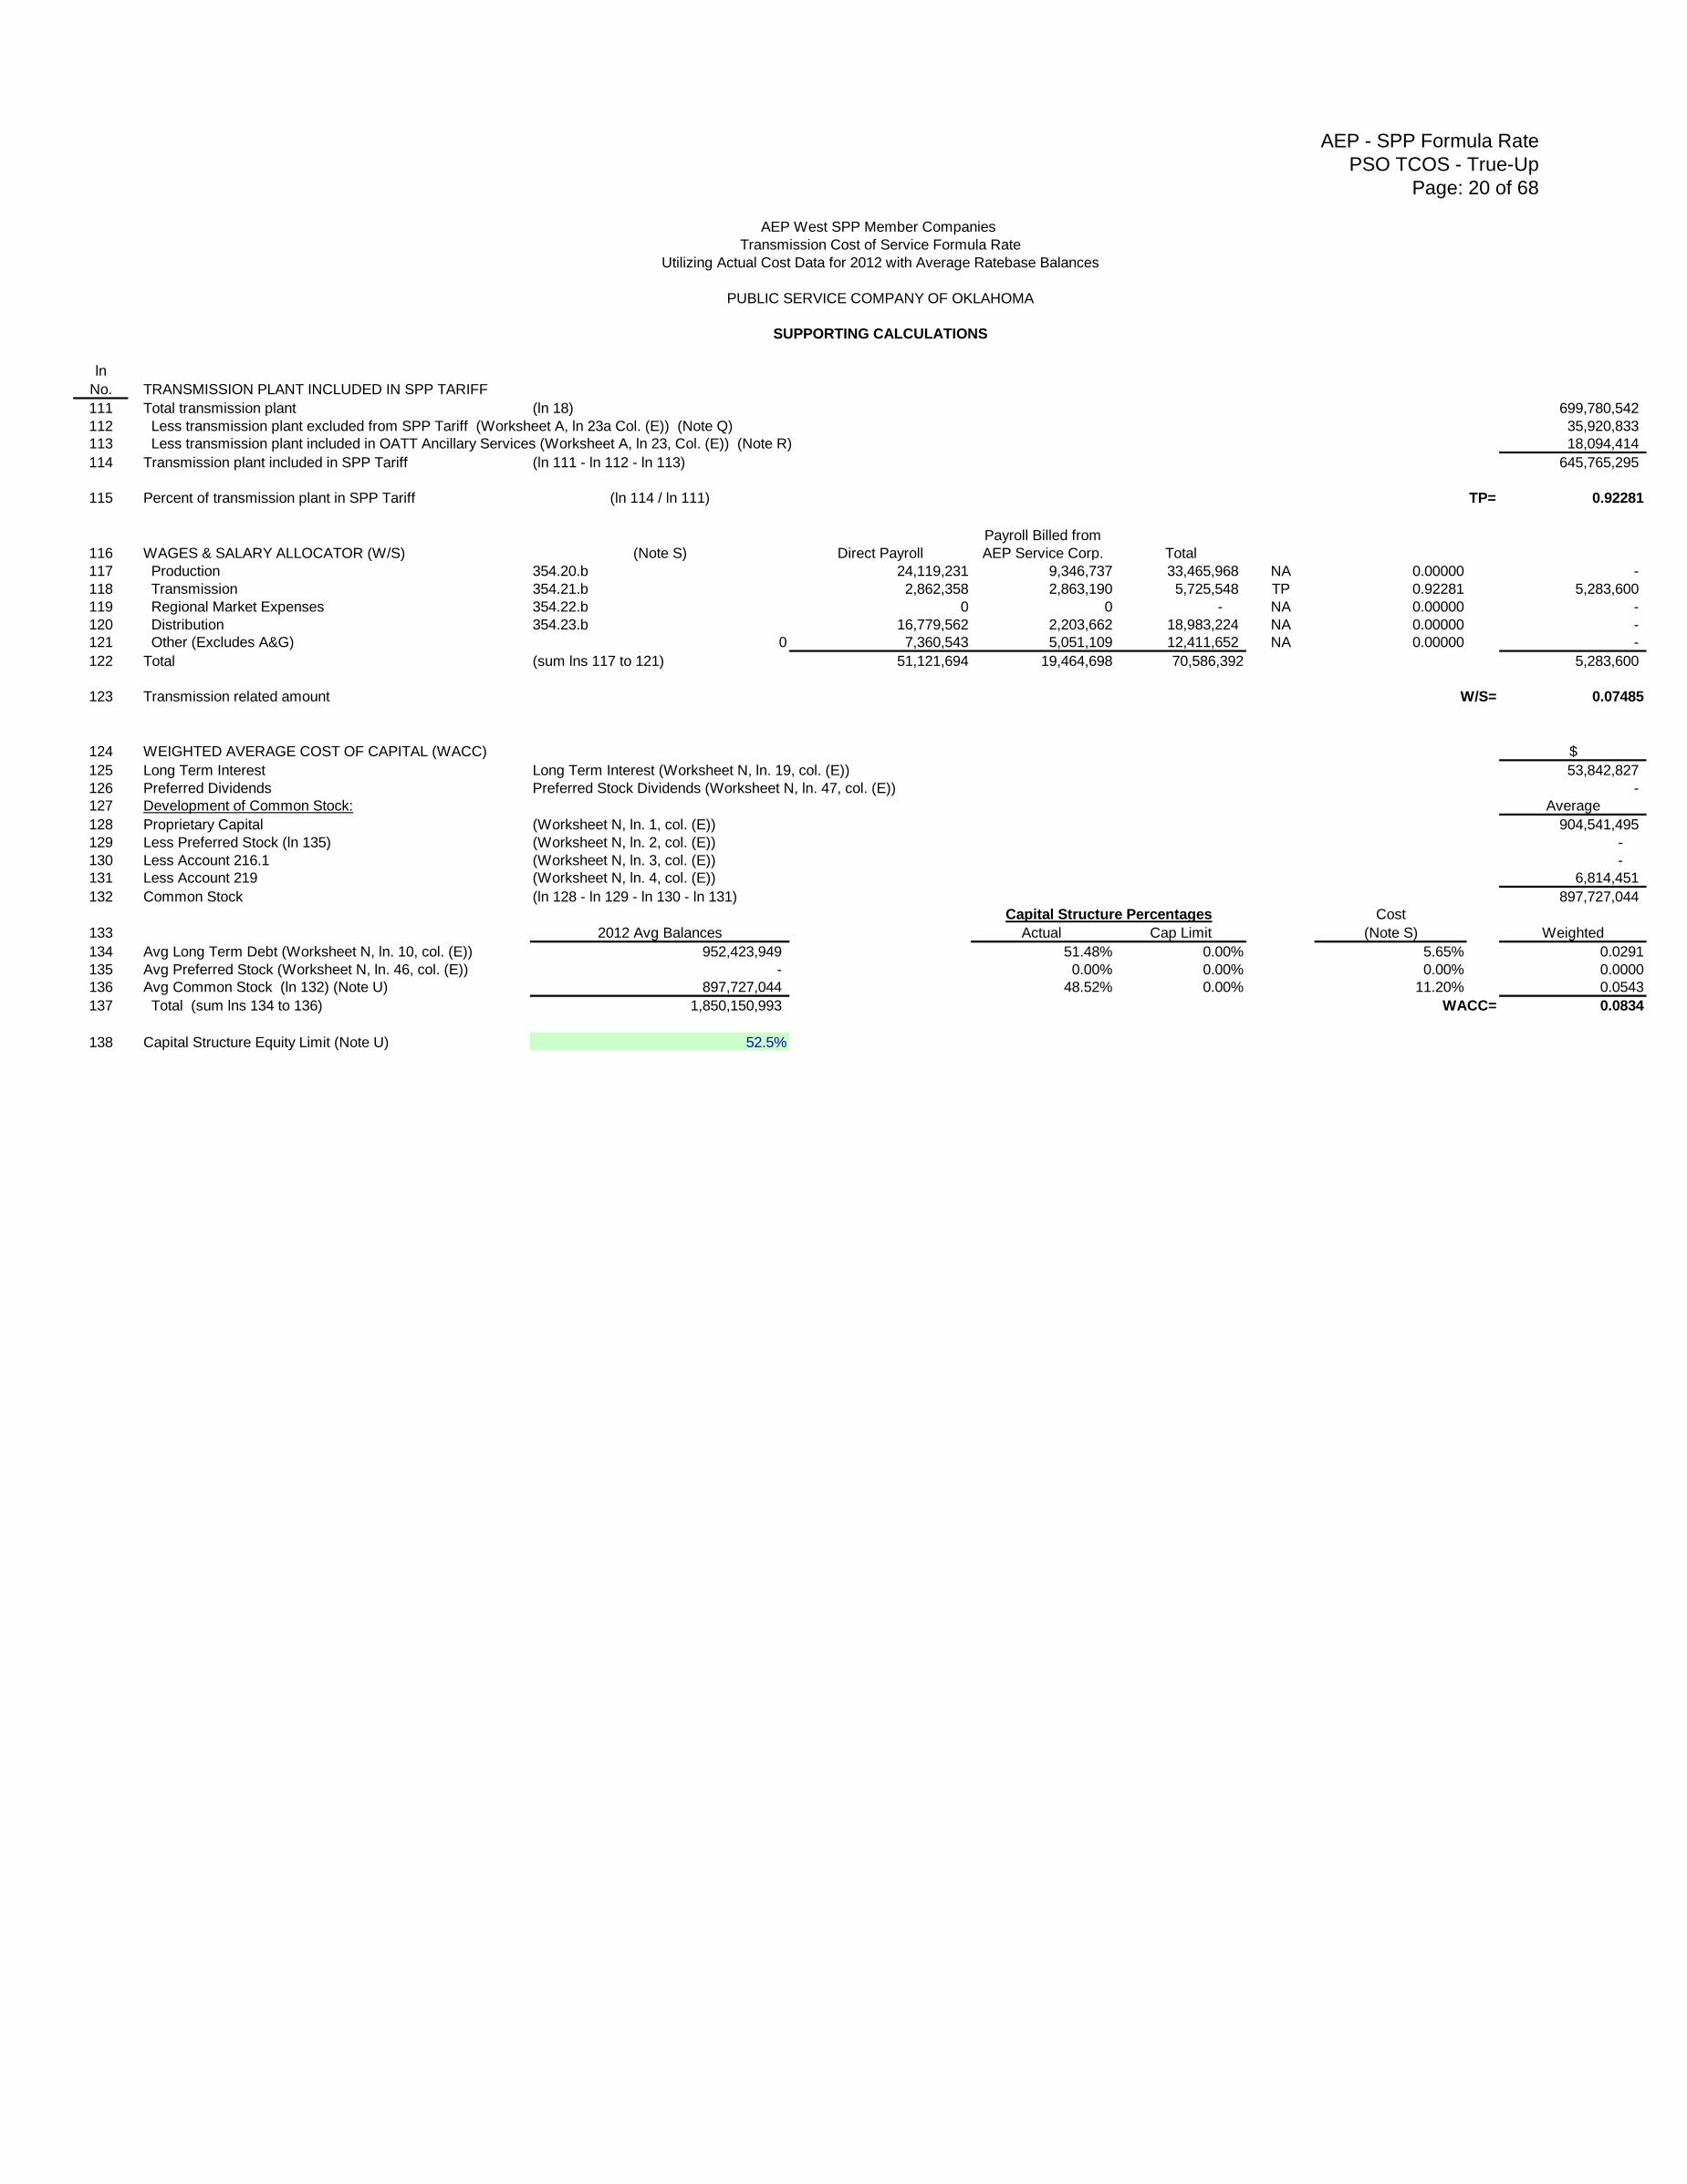
No. TRANSMISSION PLANT INCLUDED IN SPP TARIFF
111 Total transmission plant (ln 18) 699,780,542
112 Less transmission plant excluded from SPP Tariff (Worksheet A, ln 23a Col. (E)) (Note Q) 35,920,833
113 Less transmission plant included in OATT Ancillary Services (Worksheet A, ln 23, Col. (E)) (Note R) 18,094,414
114 Transmission plant included in SPP Tariff (ln 111 - ln 112 - ln 113) 645,765,295
115 Percent of transmission plant in SPP Tariff (ln 114 / ln 111) TP= 0.92281
116 WAGES & SALARY ALLOCATOR (W/S) (Note S) Direct Payroll
Payroll Billed from
AEP Service Corp. Total
117 Production 354.20.b 24,119,231 9,346,737 33,465,968 NA 0.00000 -
118 Transmission 354.21.b 2,862,358 2,863,190 5,725,548 TP 0.92281 5,283,600
119 Regional Market Expenses 354.22.b 0 0 - NA 0.00000 -
120 Distribution 354.23.b 16,779,562 2,203,662 18,983,224 NA 0.00000 -
121 Other (Excludes A&G) 0 7,360,543 5,051,109 12,411,652 NA 0.00000 -
122 Total (sum lns 117 to 121) 51,121,694 19,464,698 70,586,392 5,283,600
123 Transmission related amount W/S= 0.07485
124 WEIGHTED AVERAGE COST OF CAPITAL (WACC) $
125 Long Term Interest Long Term Interest (Worksheet N, ln. 19, col. (E)) 53,842,827
126 Preferred Dividends Preferred Stock Dividends (Worksheet N, ln. 47, col. (E)) -
127 Development of Common Stock: Average
128 Proprietary Capital (Worksheet N, ln. 1, col. (E)) 904,541,495
129 Less Preferred Stock (ln 135) (Worksheet N, ln. 2, col. (E)) -
130 Less Account 216.1 (Worksheet N, ln. 3, col. (E)) -
131 Less Account 219 (Worksheet N, ln. 4, col. (E)) 6,814,451
132 Common Stock (ln 128 - ln 129 - ln 130 - ln 131) 897,727,044
Cost
133 2012 Avg Balances Actual Cap Limit (Note S) Weighted
134 Avg Long Term Debt (Worksheet N, ln. 10, col. (E)) 952,423,949 51.48% 0.00% 5.65% 0.0291
135 Avg Preferred Stock (Worksheet N, ln. 46, col. (E)) - 0.00% 0.00% 0.00% 0.0000
136 Avg Common Stock (ln 132) (Note U) 897,727,044 48.52% 0.00% 11.20% 0.0543
137 Total (sum lns 134 to 136) 1,850,150,993 WACC= 0.0834
138 Capital Structure Equity Limit (Note U) 52.5%
Capital Structure Percentages
AEP - SPP Formula Rate
PSO TCOS - True-Up
Page: 21 of 68
AEP West SPP Member Companies
Transmission Cost of Service Formula Rate
Utilizing Actual Cost Data for 2012 with Average Ratebase Balances
PUBLIC SERVICE COMPANY OF OKLAHOMA
Letter Notes
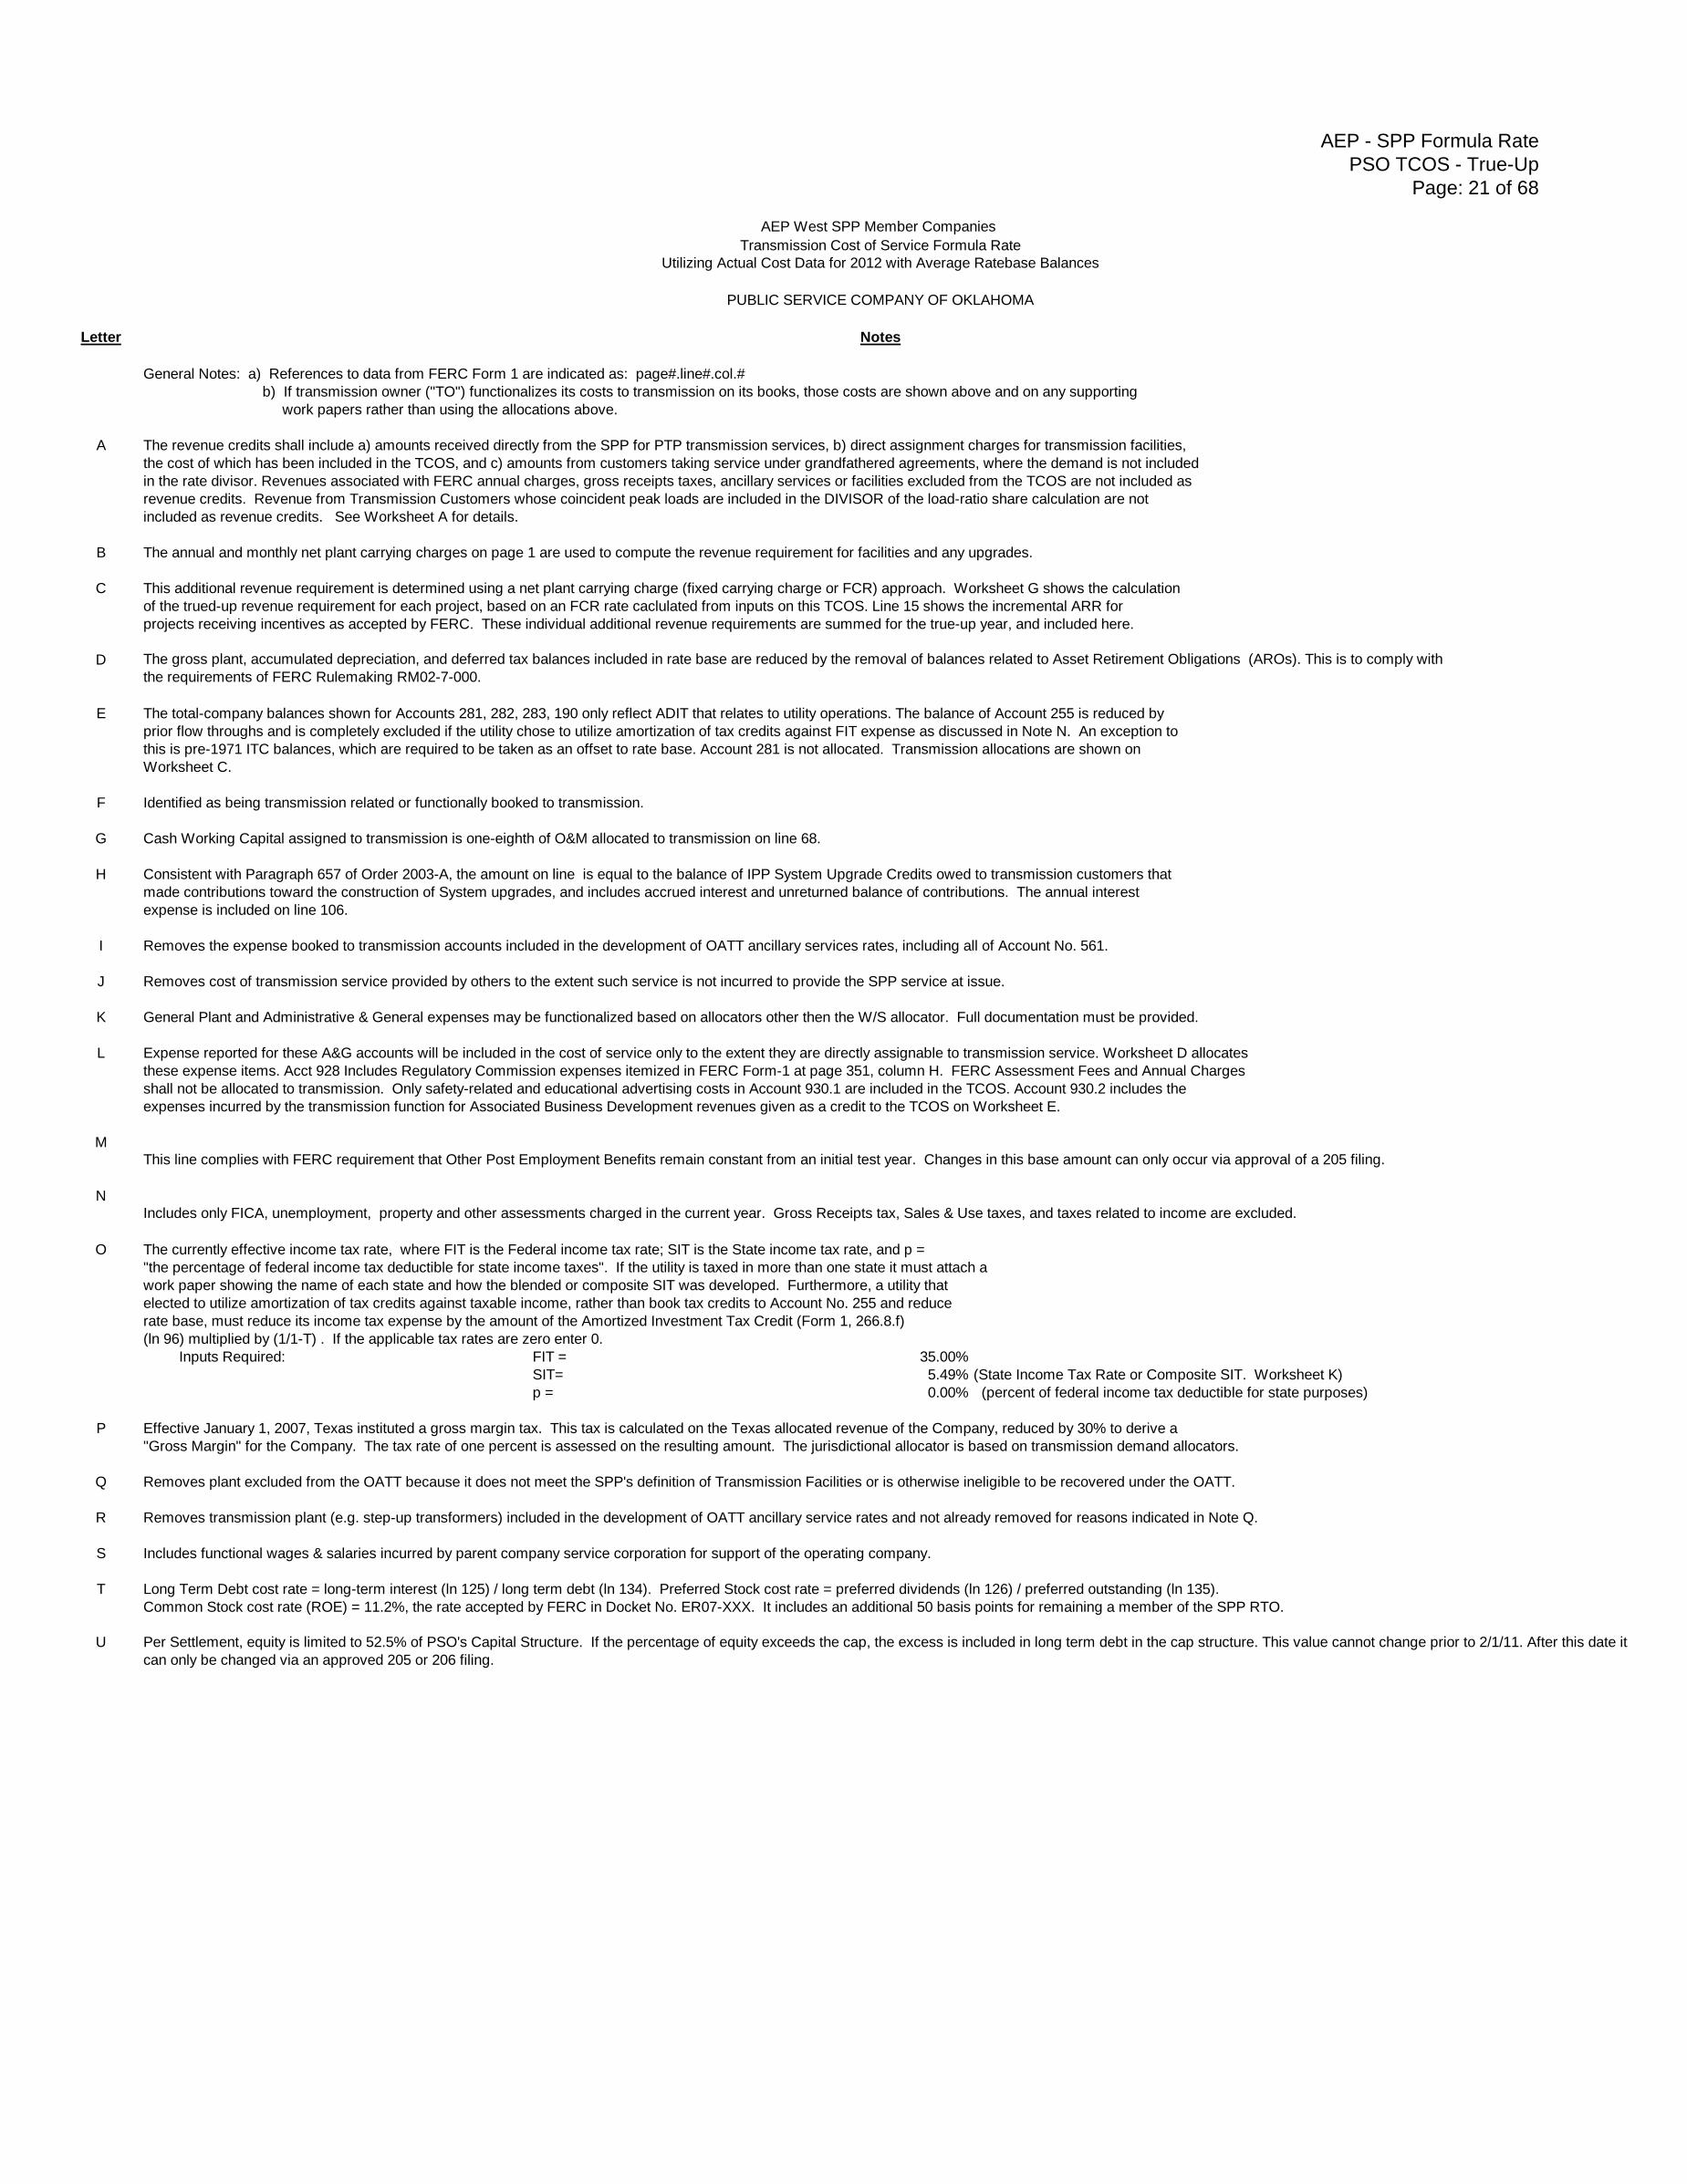
General Notes: a) References to data from FERC Form 1 are indicated as: page#.line#.col.#
b) If transmission owner ("TO") functionalizes its costs to transmission on its books, those costs are shown above and on any supporting
work papers rather than using the allocations above.
A The revenue credits shall include a) amounts received directly from the SPP for PTP transmission services, b) direct assignment charges for transmission facilities,
the cost of which has been included in the TCOS, and c) amounts from customers taking service under grandfathered agreements, where the demand is not included
in the rate divisor. Revenues associated with FERC annual charges, gross receipts taxes, ancillary services or facilities excluded from the TCOS are not included as
revenue credits. Revenue from Transmission Customers whose coincident peak loads are included in the DIVISOR of the load-ratio share calculation are not
included as revenue credits. See Worksheet A for details.
B The annual and monthly net plant carrying charges on page 1 are used to compute the revenue requirement for facilities and any upgrades.
C This additional revenue requirement is determined using a net plant carrying charge (fixed carrying charge or FCR) approach. Worksheet G shows the calculation
of the trued-up revenue requirement for each project, based on an FCR rate caclulated from inputs on this TCOS. Line 15 shows the incremental ARR for
projects receiving incentives as accepted by FERC. These individual additional revenue requirements are summed for the true-up year, and included here.
D
E The total-company balances shown for Accounts 281, 282, 283, 190 only reflect ADIT that relates to utility operations. The balance of Account 255 is reduced by
prior flow throughs and is completely excluded if the utility chose to utilize amortization of tax credits against FIT expense as discussed in Note N. An exception to
this is pre-1971 ITC balances, which are required to be taken as an offset to rate base. Account 281 is not allocated. Transmission allocations are shown on
Worksheet C.
F Identified as being transmission related or functionally booked to transmission.
G Cash Working Capital assigned to transmission is one-eighth of O&M allocated to transmission on line 68.
H Consistent with Paragraph 657 of Order 2003-A, the amount on line is equal to the balance of IPP System Upgrade Credits owed to transmission customers that
made contributions toward the construction of System upgrades, and includes accrued interest and unreturned balance of contributions. The annual interest
expense is included on line 106.
I Removes the expense booked to transmission accounts included in the development of OATT ancillary services rates, including all of Account No. 561.
J Removes cost of transmission service provided by others to the extent such service is not incurred to provide the SPP service at issue.
K General Plant and Administrative & General expenses may be functionalized based on allocators other then the W/S allocator. Full documentation must be provided.
L Expense reported for these A&G accounts will be included in the cost of service only to the extent they are directly assignable to transmission service. Worksheet D allocates
these expense items. Acct 928 Includes Regulatory Commission expenses itemized in FERC Form-1 at page 351, column H. FERC Assessment Fees and Annual Charges
shall not be allocated to transmission. Only safety-related and educational advertising costs in Account 930.1 are included in the TCOS. Account 930.2 includes the
expenses incurred by the transmission function for Associated Business Development revenues given as a credit to the TCOS on Worksheet E.
M
N
O The currently effective income tax rate, where FIT is the Federal income tax rate; SIT is the State income tax rate, and p =
"the percentage of federal income tax deductible for state income taxes". If the utility is taxed in more than one state it must attach a
work paper showing the name of each state and how the blended or composite SIT was developed. Furthermore, a utility that
elected to utilize amortization of tax credits against taxable income, rather than book tax credits to Account No. 255 and reduce
rate base, must reduce its income tax expense by the amount of the Amortized Investment Tax Credit (Form 1, 266.8.f)
(ln 96) multiplied by (1/1-T) . If the applicable tax rates are zero enter 0.
Inputs Required: FIT = 35.00%
SIT= 5.49% (State Income Tax Rate or Composite SIT. Worksheet K)
p = 0.00% (percent of federal income tax deductible for state purposes)
P Effective January 1, 2007, Texas instituted a gross margin tax. This tax is calculated on the Texas allocated revenue of the Company, reduced by 30% to derive a
"Gross Margin" for the Company. The tax rate of one percent is assessed on the resulting amount. The jurisdictional allocator is based on transmission demand allocators.
Q Removes plant excluded from the OATT because it does not meet the SPP's definition of Transmission Facilities or is otherwise ineligible to be recovered under the OATT.
R Removes transmission plant (e.g. step-up transformers) included in the development of OATT ancillary service rates and not already removed for reasons indicated in Note Q.
S Includes functional wages & salaries incurred by parent company service corporation for support of the operating company.
T Long Term Debt cost rate = long-term interest (ln 125) / long term debt (ln 134). Preferred Stock cost rate = preferred dividends (ln 126) / preferred outstanding (ln 135).
Common Stock cost rate (ROE) = 11.2%, the rate accepted by FERC in Docket No. ER07-XXX. It includes an additional 50 basis points for remaining a member of the SPP RTO.
U
The gross plant, accumulated depreciation, and deferred tax balances included in rate base are reduced by the removal of balances related to Asset Retirement Obligations (AROs). This is to comply with
the requirements of FERC Rulemaking RM02-7-000.
This line complies with FERC requirement that Other Post Employment Benefits remain constant from an initial test year. Changes in this base amount can only occur via approval of a 205 filing.
Per Settlement, equity is limited to 52.5% of PSO's Capital Structure. If the percentage of equity exceeds the cap, the excess is included in long term debt in the cap structure. This value cannot change prior to 2/1/11. After this date it
can only be changed via an approved 205 or 206 filing.
Includes only FICA, unemployment, property and other assessments charged in the current year. Gross Receipts tax, Sales & Use taxes, and taxes related to income are excluded.

AEP - SPP Formula Rate
PSO TCOS - WS A
Page: 22 of 68
(A) (B) (C) (D) (E)
Line Balances @ Balances
Number Rate Base Item & Supporting Balance Source of Data 12/31/2012 12/31/2011
NOTE: Functional ARO investment and accumulated depreciation balances shown below are included in the total functional balances shown here.
Plant Investment Balances
1 Production Plant In Service FF1, page 205 Col.(g) & pg. 204 Col. (b), ln 46 1,342,905,530 1,314,330,678 1,328,618,104
2 Production Asset Retirement Obligation (ARO) FF1, page 205&204, Col.(g)&(b), lns 15,24,34,44 13,330,557 11,967,880 12,649,219
3 Transmission Plant In Service FF1, page 207 Col.(g) & pg. 206 Col. (b), ln 58 706,917,109 692,643,975 699,780,542
4 Transmission Asset Retirement Obligation FF1, page 207 Col.(g) & pg. 206 Col. (b), ln 57 - - -
5 Distribution Plant In Service FF1, page 207 Col.(g) & pg. 206 Col. (b), ln 75 1,859,375,106 1,762,031,440 1,810,703,273
6 Distribution Asset Retirement Obligation FF1, page 207 Col.(g) & pg. 206 Col. (b), ln 74 - - -
7 General Plant In Service FF1, page 207 Col.(g) & pg. 206 Col. (b), ln 99 146,062,810 142,466,387 144,264,599
8 General Asset Retirement Obligation FF1, page 207 Col.(g) & pg. 206 Col. (b), ln 98 558,274 489,630 523,952
9 Intangible Plant In Service FF1, page 205 Col.(g) & pg. 204 Col. (b), ln 5 40,204,612 47,068,682 43,636,647
10 Total Property Investment Balance (Sum of Lines: 1, 3, 5, 7, 9) 4,095,465,167 3,958,541,162 4,027,003,165
11 Total ARO Balance (included in total on line 10) (Sum of Lines: 2, 4, 6, 8) 13,888,831 12,457,510 13,173,171
Accumulated Depreciation & Amortization Balances
12 Production Accumulated Depreciation FF1, page 219, lns 20-24, Col. (b) 717,461,660 718,052,893 717,757,277
13 Production ARO Accumulated Depreciation Company Records 2,553,598 2,260,914 2,407,256
14 Transmission Accumulated Depreciation FF1, page 219, ln 25, Col. (b) 218,642,096 211,335,183 214,988,640
15 Transmission ARO Accumulated Depreciation Company Records - - -
16 Distribution Accumulated Depreciation FF1, page 219, ln 26, Col. (b) 506,296,982 491,149,210 498,723,096
17 Distribution ARO Accumulated Depreciation Company Records - - -
18 General Accumulated Depreciation FF1, page 219, ln 28, Col. (b) 80,042,574 80,630,427 80,336,501
19 General ARO Accumulated Depreciation Company Records 320,337 302,521 311,429
20 Intangible Accumulated Amortization FF1, page 200, ln 21, Col. (b) 26,711,833 37,455,396 32,083,615
21 Total Accumulated Depreciation or Amortization (Sum of Lines: 12, 14, 16, 18, 20) 1,549,155,145 1,538,623,109 1,543,889,127
22 Total ARO Balance (included in total on line 21) (Sum of Lines: 13, 15, 17, 19) 2,873,935 2,563,435 2,718,685
Generation Step-Up Units
23 GSU Investment Amount Company Records 17,876,958 18,311,870 18,094,414
24 GSU Accumulated Depreciation Company Records 3,285,064 3,492,381 3,388,722
25 GSU Net Balance (Line 23 - Line 24) 14,591,894 14,819,489 14,705,691
Transmission Plant Excluded from SPP Tariff (see TCOS Note Q)
23a Excluded Facilities Investment Amount Company Records 35,920,833 35,920,833 35,920,833
24a Excluded Facilities Accumulated Depreciation Company Records 13,600,177 12,904,973 13,252,575
25a Excluded Facilities Net Balance (Line 23a - Line 24a) 22,320,656 23,015,860 22,668,258
Transmission Accumulated Depreciation Net of GSU/Excluded Facilities Accumulated Depreciation
26 Transmission Accumulated Depreciation (Line 14 Above) 218,642,096 211,335,183 214,988,640
27 Less: GSU & Excl Facilities Acc Dep (Line 24 + Line 24a Above) 16,885,241 16,397,354 16,641,298
28Subtotal of Transmission Accumulated Depreciation
Net of GSU/Excluded Facilities(Line 26 - Line 27) 201,756,855 194,937,829 198,347,342
Plant Held For Future Use
29 Plant Held For Future Use FF1, page 214, ln 47, Col. (d) 181,474 78,478 129,976
30 Transmission Plant Held For Future Company Records - - -
Average Balance for
2012
2013 Cost of Service Formula Rate
AEP West SPP Member Companies
Worksheet A - Detail Plant Balances
PUBLIC SERVICE COMPANY OF OKLAHOMA

AEP - SPP Formula Rate
PSO TCOS - WS B
Page: 23 of 68
I. Calculation of Composite Depreciation Rate
1 Transmission Plant @ Beginning of Historic Period (2012) (P.206, ln 58,(b)): 692,643,975
2 Transmission Plant @ End of Historic Period (2012) (P.207, ln 58,(g)): 706,917,109
3 1,399,561,084
4 Average Balance of Transmission Investment 699,780,542
5 Annual Depreciation Expense, Historic TCOS, ln 246 13,543,408
6 Composite Depreciation Rate 1.94%
7 Round to 2% to Reflect a Composite Life of 50 Years 2.00%
II. Calculation of Property Placed in Service by Month and the Related Depreciation Expense
8
Month in
Service Capitalized Balance
Composite
Annual
Depreciation
Rate
Annual
Depreciation Monthly Depreciation
No. Months
Depreciation
First Year
Depreciation
Expense
9 January 23,939,156$ 2.00% 478,783$ 39,899$ 11 438,889$
10 February 565,430$ 2.00% 11,309$ 942$ 10 9,420$
11 March 287,256$ 2.00% 5,745$ 479$ 9 4,311$
12 April 1,367,828$ 2.00% 27,357$ 2,280$ 8 18,240$
13 May 2,531,837$ 2.00% 50,637$ 4,220$ 7 29,540$
14 June 8,025,121$ 2.00% 160,502$ 13,375$ 6 80,250$
15 July 1,160,385$ 2.00% 23,208$ 1,934$ 5 9,670$
16 August 1,893,620$ 2.00% 37,872$ 3,156$ 4 12,624$
17 September 363,105$ 2.00% 7,262$ 605$ 3 1,815$
18 October 325,243$ 2.00% 6,505$ 542$ 2 1,084$
19 November 6,083,526$ 2.00% 121,671$ 10,139$ 1 10,139$
20 December 4,838,483$ 2.00% 96,770$ 8,064$ 0 -$
21 Investment 51,380,989$ Depreciation Expense 615,982$
III. Plant Transferred 22 -$ <== This input area is for original cost plant
23 -$ <== This input area is for accumulated depreciation that may be associated with capital
expenditures. It would have an impact if a company had assets transferred from a subsidiary.
24 (Ln 7 * Ln 22) -$ <== This input area is for additional Depreciation Expense
2013 Cost of Service Formula Rate Projected on 2012 FF1 Balances
AEP West SPP Member Companies
PUBLIC SERVICE COMPANY OF OKLAHOMA
Worksheet B - Projected Transmission Plant in Service Additions
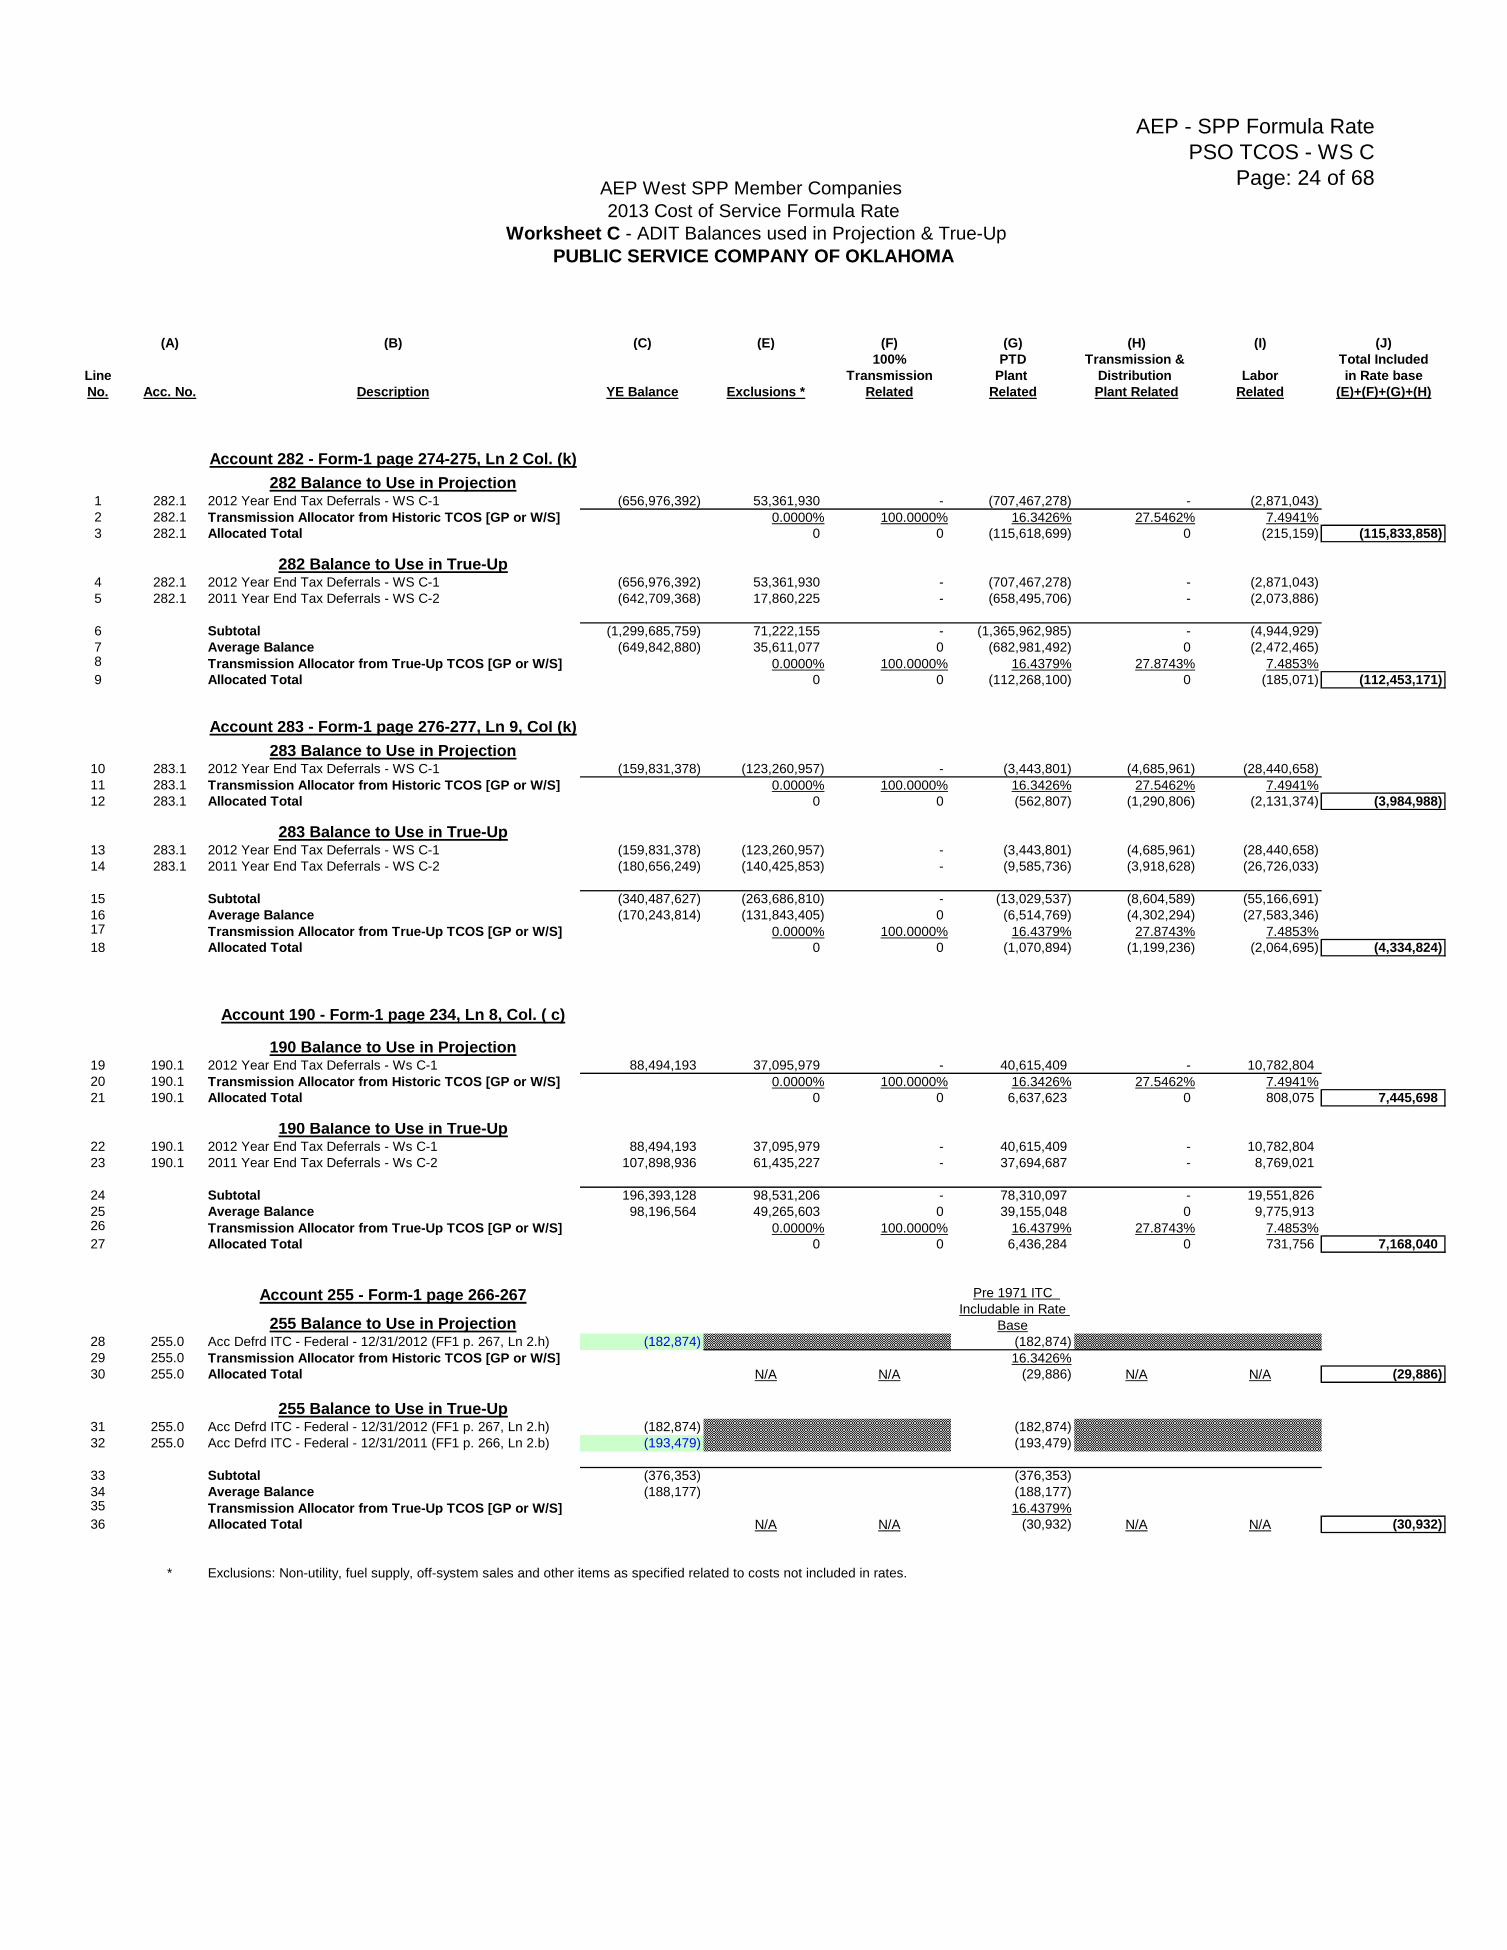
AEP - SPP Formula Rate
PSO TCOS - WS C
Page: 24 of 68
(A) (B) (C) (E) (F) (G) (H) (I) (J)
100% PTD Transmission & Total Included
Line Transmission Plant Distribution Labor in Rate base
No. Acc. No. Description YE Balance Exclusions * Related Related Plant Related Related (E)+(F)+(G)+(H)
Account 282 - Form-1 page 274-275, Ln 2 Col. (k)
282 Balance to Use in Projection1 282.1 2012 Year End Tax Deferrals - WS C-1 (656,976,392) 53,361,930 - (707,467,278) - (2,871,043)
2 282.1 Transmission Allocator from Historic TCOS [GP or W/S] 0.0000% 100.0000% 16.3426% 27.5462% 7.4941%
3 282.1 Allocated Total 0 0 (115,618,699) 0 (215,159) (115,833,858)
282 Balance to Use in True-Up4 282.1 2012 Year End Tax Deferrals - WS C-1 (656,976,392) 53,361,930 - (707,467,278) - (2,871,043)
5 282.1 2011 Year End Tax Deferrals - WS C-2 (642,709,368) 17,860,225 - (658,495,706) - (2,073,886)
6 Subtotal (1,299,685,759) 71,222,155 - (1,365,962,985) - (4,944,929)
7 Average Balance (649,842,880) 35,611,077 0 (682,981,492) 0 (2,472,465) 8 Transmission Allocator from True-Up TCOS [GP or W/S] 0.0000% 100.0000% 16.4379% 27.8743% 7.4853%
9 Allocated Total 0 0 (112,268,100) 0 (185,071) (112,453,171)
Account 283 - Form-1 page 276-277, Ln 9, Col (k)
283 Balance to Use in Projection10 283.1 2012 Year End Tax Deferrals - WS C-1 (159,831,378) (123,260,957) - (3,443,801) (4,685,961) (28,440,658)
11 283.1 Transmission Allocator from Historic TCOS [GP or W/S] 0.0000% 100.0000% 16.3426% 27.5462% 7.4941%
12 283.1 Allocated Total 0 0 (562,807) (1,290,806) (2,131,374) (3,984,988)
283 Balance to Use in True-Up13 283.1 2012 Year End Tax Deferrals - WS C-1 (159,831,378) (123,260,957) - (3,443,801) (4,685,961) (28,440,658)
14 283.1 2011 Year End Tax Deferrals - WS C-2 (180,656,249) (140,425,853) - (9,585,736) (3,918,628) (26,726,033)
15 Subtotal (340,487,627) (263,686,810) - (13,029,537) (8,604,589) (55,166,691)
16 Average Balance (170,243,814) (131,843,405) 0 (6,514,769) (4,302,294) (27,583,346)17 Transmission Allocator from True-Up TCOS [GP or W/S] 0.0000% 100.0000% 16.4379% 27.8743% 7.4853%
18 Allocated Total 0 0 (1,070,894) (1,199,236) (2,064,695) (4,334,824)
Account 190 - Form-1 page 234, Ln 8, Col. ( c)
190 Balance to Use in Projection19 190.1 2012 Year End Tax Deferrals - Ws C-1 88,494,193 37,095,979 - 40,615,409 - 10,782,804
20 190.1 Transmission Allocator from Historic TCOS [GP or W/S] 0.0000% 100.0000% 16.3426% 27.5462% 7.4941%
21 190.1 Allocated Total 0 0 6,637,623 0 808,075 7,445,698
190 Balance to Use in True-Up22 190.1 2012 Year End Tax Deferrals - Ws C-1 88,494,193 37,095,979 - 40,615,409 - 10,782,804
23 190.1 2011 Year End Tax Deferrals - Ws C-2 107,898,936 61,435,227 - 37,694,687 - 8,769,021
24 Subtotal 196,393,128 98,531,206 - 78,310,097 - 19,551,826
25 Average Balance 98,196,564 49,265,603 0 39,155,048 0 9,775,91326 Transmission Allocator from True-Up TCOS [GP or W/S] 0.0000% 100.0000% 16.4379% 27.8743% 7.4853%
27 Allocated Total 0 0 6,436,284 0 731,756 7,168,040
Account 255 - Form-1 page 266-267
255 Balance to Use in Projection28 255.0 Acc Defrd ITC - Federal - 12/31/2012 (FF1 p. 267, Ln 2.h) (182,874) (182,874)
29 255.0 Transmission Allocator from Historic TCOS [GP or W/S] 16.3426%
30 255.0 Allocated Total N/A N/A (29,886) N/A N/A (29,886)
255 Balance to Use in True-Up31 255.0 Acc Defrd ITC - Federal - 12/31/2012 (FF1 p. 267, Ln 2.h) (182,874) (182,874)
32 255.0 Acc Defrd ITC - Federal - 12/31/2011 (FF1 p. 266, Ln 2.b) (193,479) (193,479)
33 Subtotal (376,353) (376,353)
34 Average Balance (188,177) (188,177)35 Transmission Allocator from True-Up TCOS [GP or W/S] 16.4379%
36 Allocated Total N/A N/A (30,932) N/A N/A (30,932)
* Exclusions: Non-utility, fuel supply, off-system sales and other items as specified related to costs not included in rates.
Pre 1971 ITC
Includable in Rate
Base
AEP West SPP Member Companies
2013 Cost of Service Formula Rate
Worksheet C - ADIT Balances used in Projection & True-Up
PUBLIC SERVICE COMPANY OF OKLAHOMA
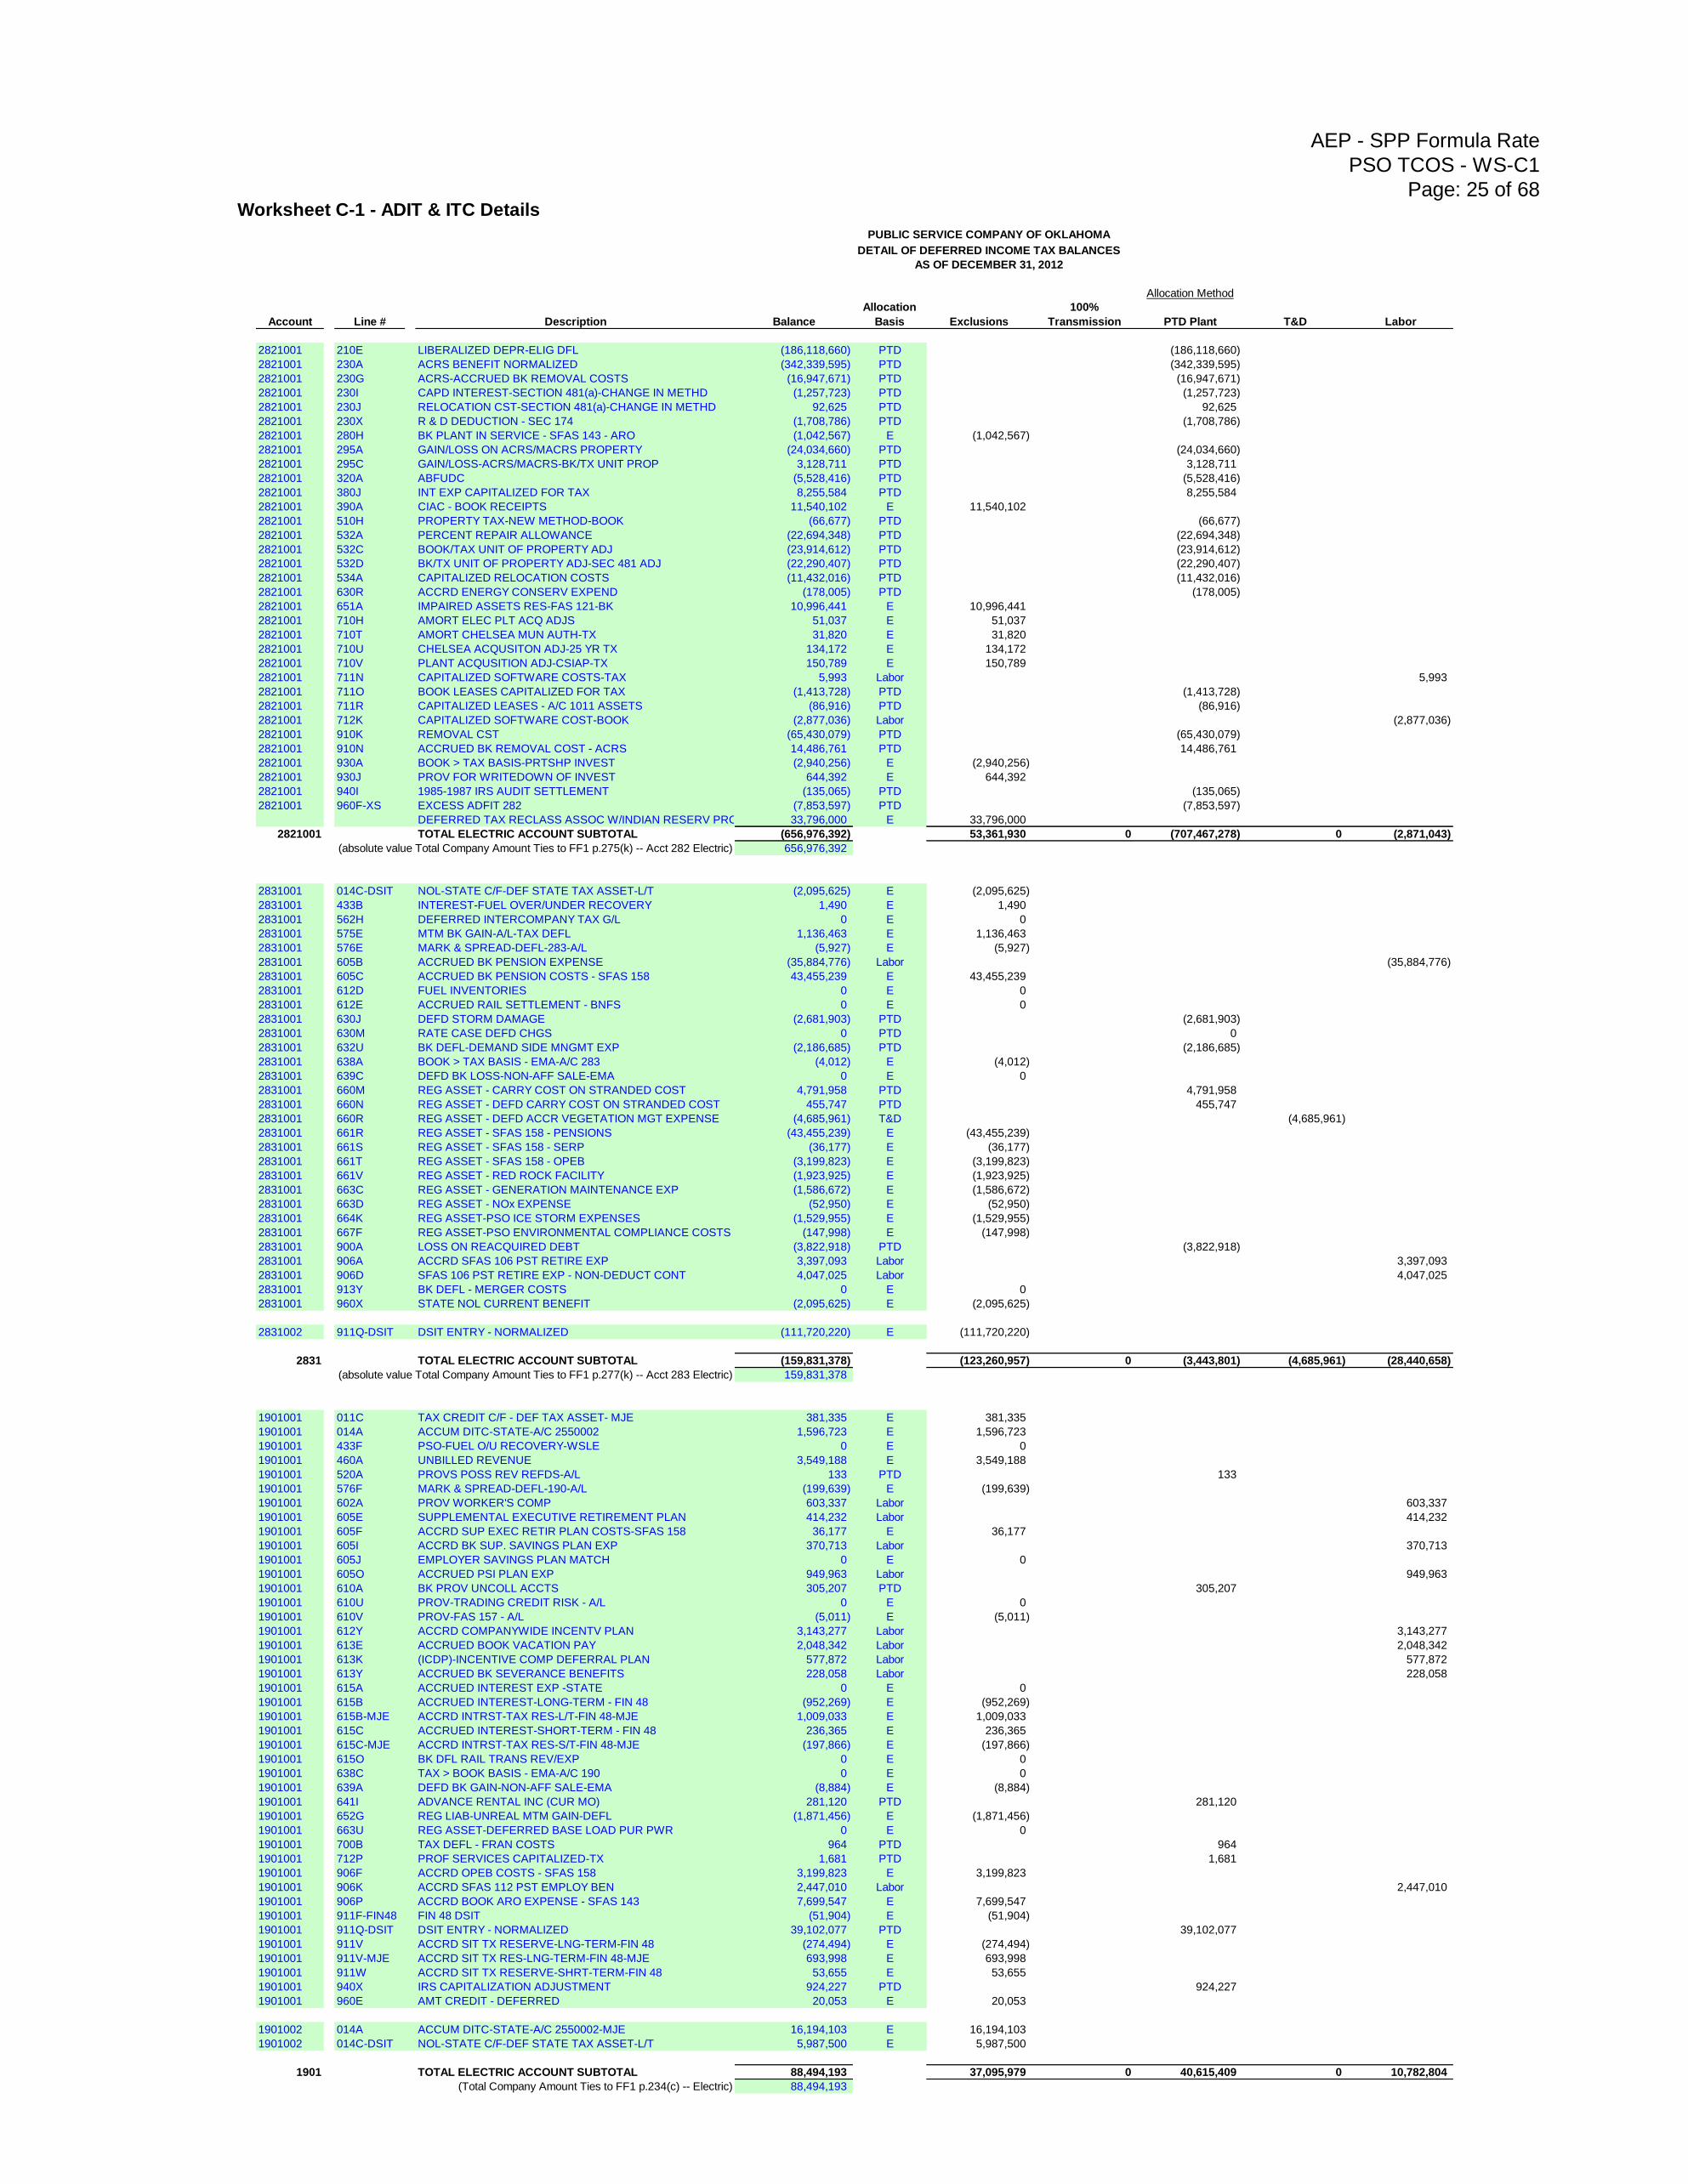
AEP - SPP Formula Rate
PSO TCOS - WS-C1
Page: 25 of 68Worksheet C-1 - ADIT & ITC Details
Account Line # Description Balance
Allocation
Basis Exclusions
100%
Transmission PTD Plant T&D Labor
2821001 210E LIBERALIZED DEPR-ELIG DFL (186,118,660) PTD (186,118,660)
2821001 230A ACRS BENEFIT NORMALIZED (342,339,595) PTD (342,339,595)
2821001 230G ACRS-ACCRUED BK REMOVAL COSTS (16,947,671) PTD (16,947,671)
2821001 230I CAPD INTEREST-SECTION 481(a)-CHANGE IN METHD (1,257,723) PTD (1,257,723)
2821001 230J RELOCATION CST-SECTION 481(a)-CHANGE IN METHD 92,625 PTD 92,625
2821001 230X R & D DEDUCTION - SEC 174 (1,708,786) PTD (1,708,786)
2821001 280H BK PLANT IN SERVICE - SFAS 143 - ARO (1,042,567) E (1,042,567)
2821001 295A GAIN/LOSS ON ACRS/MACRS PROPERTY (24,034,660) PTD (24,034,660)
2821001 295C GAIN/LOSS-ACRS/MACRS-BK/TX UNIT PROP 3,128,711 PTD 3,128,711
2821001 320A ABFUDC (5,528,416) PTD (5,528,416)
2821001 380J INT EXP CAPITALIZED FOR TAX 8,255,584 PTD 8,255,584
2821001 390A CIAC - BOOK RECEIPTS 11,540,102 E 11,540,102
2821001 510H PROPERTY TAX-NEW METHOD-BOOK (66,677) PTD (66,677)
2821001 532A PERCENT REPAIR ALLOWANCE (22,694,348) PTD (22,694,348)
2821001 532C BOOK/TAX UNIT OF PROPERTY ADJ (23,914,612) PTD (23,914,612)
2821001 532D BK/TX UNIT OF PROPERTY ADJ-SEC 481 ADJ (22,290,407) PTD (22,290,407)
2821001 534A CAPITALIZED RELOCATION COSTS (11,432,016) PTD (11,432,016)
2821001 630R ACCRD ENERGY CONSERV EXPEND (178,005) PTD (178,005)
2821001 651A IMPAIRED ASSETS RES-FAS 121-BK 10,996,441 E 10,996,441
2821001 710H AMORT ELEC PLT ACQ ADJS 51,037 E 51,037
2821001 710T AMORT CHELSEA MUN AUTH-TX 31,820 E 31,820
2821001 710U CHELSEA ACQUSITON ADJ-25 YR TX 134,172 E 134,172
2821001 710V PLANT ACQUSITION ADJ-CSIAP-TX 150,789 E 150,789
2821001 711N CAPITALIZED SOFTWARE COSTS-TAX 5,993 Labor 5,993
2821001 711O BOOK LEASES CAPITALIZED FOR TAX (1,413,728) PTD (1,413,728)
2821001 711R CAPITALIZED LEASES - A/C 1011 ASSETS (86,916) PTD (86,916)
2821001 712K CAPITALIZED SOFTWARE COST-BOOK (2,877,036) Labor (2,877,036)
2821001 910K REMOVAL CST (65,430,079) PTD (65,430,079)
2821001 910N ACCRUED BK REMOVAL COST - ACRS 14,486,761 PTD 14,486,761
2821001 930A BOOK > TAX BASIS-PRTSHP INVEST (2,940,256) E (2,940,256)
2821001 930J PROV FOR WRITEDOWN OF INVEST 644,392 E 644,392
2821001 940I 1985-1987 IRS AUDIT SETTLEMENT (135,065) PTD (135,065)
2821001 960F-XS EXCESS ADFIT 282 (7,853,597) PTD (7,853,597)
DEFERRED TAX RECLASS ASSOC W/INDIAN RESERV PROP 33,796,000 E 33,796,000
2821001 TOTAL ELECTRIC ACCOUNT SUBTOTAL (656,976,392) 53,361,930 0 (707,467,278) 0 (2,871,043)
(absolute value Total Company Amount Ties to FF1 p.275(k) -- Acct 282 Electric) 656,976,392
2831001 014C-DSIT NOL-STATE C/F-DEF STATE TAX ASSET-L/T (2,095,625) E (2,095,625)
2831001 433B INTEREST-FUEL OVER/UNDER RECOVERY 1,490 E 1,490
2831001 562H DEFERRED INTERCOMPANY TAX G/L 0 E 0
2831001 575E MTM BK GAIN-A/L-TAX DEFL 1,136,463 E 1,136,463
2831001 576E MARK & SPREAD-DEFL-283-A/L (5,927) E (5,927)
2831001 605B ACCRUED BK PENSION EXPENSE (35,884,776) Labor (35,884,776)
2831001 605C ACCRUED BK PENSION COSTS - SFAS 158 43,455,239 E 43,455,239
2831001 612D FUEL INVENTORIES 0 E 0
2831001 612E ACCRUED RAIL SETTLEMENT - BNFS 0 E 0
2831001 630J DEFD STORM DAMAGE (2,681,903) PTD (2,681,903)
2831001 630M RATE CASE DEFD CHGS 0 PTD 0
2831001 632U BK DEFL-DEMAND SIDE MNGMT EXP (2,186,685) PTD (2,186,685)
2831001 638A BOOK > TAX BASIS - EMA-A/C 283 (4,012) E (4,012)
2831001 639C DEFD BK LOSS-NON-AFF SALE-EMA 0 E 0
2831001 660M REG ASSET - CARRY COST ON STRANDED COST 4,791,958 PTD 4,791,958
2831001 660N REG ASSET - DEFD CARRY COST ON STRANDED COST 455,747 PTD 455,747
2831001 660R REG ASSET - DEFD ACCR VEGETATION MGT EXPENSE (4,685,961) T&D (4,685,961)
2831001 661R REG ASSET - SFAS 158 - PENSIONS (43,455,239) E (43,455,239)
2831001 661S REG ASSET - SFAS 158 - SERP (36,177) E (36,177)
2831001 661T REG ASSET - SFAS 158 - OPEB (3,199,823) E (3,199,823)
2831001 661V REG ASSET - RED ROCK FACILITY (1,923,925) E (1,923,925)
2831001 663C REG ASSET - GENERATION MAINTENANCE EXP (1,586,672) E (1,586,672)
2831001 663D REG ASSET - NOx EXPENSE (52,950) E (52,950)
2831001 664K REG ASSET-PSO ICE STORM EXPENSES (1,529,955) E (1,529,955)
2831001 667F REG ASSET-PSO ENVIRONMENTAL COMPLIANCE COSTS (147,998) E (147,998)
2831001 900A LOSS ON REACQUIRED DEBT (3,822,918) PTD (3,822,918)
2831001 906A ACCRD SFAS 106 PST RETIRE EXP 3,397,093 Labor 3,397,093
2831001 906D SFAS 106 PST RETIRE EXP - NON-DEDUCT CONT 4,047,025 Labor 4,047,025
2831001 913Y BK DEFL - MERGER COSTS 0 E 0
2831001 960X STATE NOL CURRENT BENEFIT (2,095,625) E (2,095,625)
2831002 911Q-DSIT DSIT ENTRY - NORMALIZED (111,720,220) E (111,720,220)
2831 TOTAL ELECTRIC ACCOUNT SUBTOTAL (159,831,378) (123,260,957) 0 (3,443,801) (4,685,961) (28,440,658)
(absolute value Total Company Amount Ties to FF1 p.277(k) -- Acct 283 Electric) 159,831,378
1901001 011C TAX CREDIT C/F - DEF TAX ASSET- MJE 381,335 E 381,335
1901001 014A ACCUM DITC-STATE-A/C 2550002 1,596,723 E 1,596,723
1901001 433F PSO-FUEL O/U RECOVERY-WSLE 0 E 0
1901001 460A UNBILLED REVENUE 3,549,188 E 3,549,188
1901001 520A PROVS POSS REV REFDS-A/L 133 PTD 133
1901001 576F MARK & SPREAD-DEFL-190-A/L (199,639) E (199,639)
1901001 602A PROV WORKER'S COMP 603,337 Labor 603,337
1901001 605E SUPPLEMENTAL EXECUTIVE RETIREMENT PLAN 414,232 Labor 414,232
1901001 605F ACCRD SUP EXEC RETIR PLAN COSTS-SFAS 158 36,177 E 36,177
1901001 605I ACCRD BK SUP. SAVINGS PLAN EXP 370,713 Labor 370,713
1901001 605J EMPLOYER SAVINGS PLAN MATCH 0 E 0
1901001 605O ACCRUED PSI PLAN EXP 949,963 Labor 949,963
1901001 610A BK PROV UNCOLL ACCTS 305,207 PTD 305,207
1901001 610U PROV-TRADING CREDIT RISK - A/L 0 E 0
1901001 610V PROV-FAS 157 - A/L (5,011) E (5,011)
1901001 612Y ACCRD COMPANYWIDE INCENTV PLAN 3,143,277 Labor 3,143,277
1901001 613E ACCRUED BOOK VACATION PAY 2,048,342 Labor 2,048,342
1901001 613K (ICDP)-INCENTIVE COMP DEFERRAL PLAN 577,872 Labor 577,872
1901001 613Y ACCRUED BK SEVERANCE BENEFITS 228,058 Labor 228,058
1901001 615A ACCRUED INTEREST EXP -STATE 0 E 0
1901001 615B ACCRUED INTEREST-LONG-TERM - FIN 48 (952,269) E (952,269)
1901001 615B-MJE ACCRD INTRST-TAX RES-L/T-FIN 48-MJE 1,009,033 E 1,009,033
1901001 615C ACCRUED INTEREST-SHORT-TERM - FIN 48 236,365 E 236,365
1901001 615C-MJE ACCRD INTRST-TAX RES-S/T-FIN 48-MJE (197,866) E (197,866)
1901001 615O BK DFL RAIL TRANS REV/EXP 0 E 0
1901001 638C TAX > BOOK BASIS - EMA-A/C 190 0 E 0
1901001 639A DEFD BK GAIN-NON-AFF SALE-EMA (8,884) E (8,884)
1901001 641I ADVANCE RENTAL INC (CUR MO) 281,120 PTD 281,120
1901001 652G REG LIAB-UNREAL MTM GAIN-DEFL (1,871,456) E (1,871,456)
1901001 663U REG ASSET-DEFERRED BASE LOAD PUR PWR 0 E 0
1901001 700B TAX DEFL - FRAN COSTS 964 PTD 964
1901001 712P PROF SERVICES CAPITALIZED-TX 1,681 PTD 1,681
1901001 906F ACCRD OPEB COSTS - SFAS 158 3,199,823 E 3,199,823
1901001 906K ACCRD SFAS 112 PST EMPLOY BEN 2,447,010 Labor 2,447,010
1901001 906P ACCRD BOOK ARO EXPENSE - SFAS 143 7,699,547 E 7,699,547
1901001 911F-FIN48 FIN 48 DSIT (51,904) E (51,904)
1901001 911Q-DSIT DSIT ENTRY - NORMALIZED 39,102,077 PTD 39,102,077
1901001 911V ACCRD SIT TX RESERVE-LNG-TERM-FIN 48 (274,494) E (274,494)
1901001 911V-MJE ACCRD SIT TX RES-LNG-TERM-FIN 48-MJE 693,998 E 693,998
1901001 911W ACCRD SIT TX RESERVE-SHRT-TERM-FIN 48 53,655 E 53,655
1901001 940X IRS CAPITALIZATION ADJUSTMENT 924,227 PTD 924,227
1901001 960E AMT CREDIT - DEFERRED 20,053 E 20,053
1901002 014A ACCUM DITC-STATE-A/C 2550002-MJE 16,194,103 E 16,194,103
1901002 014C-DSIT NOL-STATE C/F-DEF STATE TAX ASSET-L/T 5,987,500 E 5,987,500
1901 TOTAL ELECTRIC ACCOUNT SUBTOTAL 88,494,193 37,095,979 0 40,615,409 0 10,782,804
(Total Company Amount Ties to FF1 p.234(c) -- Electric) 88,494,193
PUBLIC SERVICE COMPANY OF OKLAHOMA
DETAIL OF DEFERRED INCOME TAX BALANCES
AS OF DECEMBER 31, 2012
Allocation Method
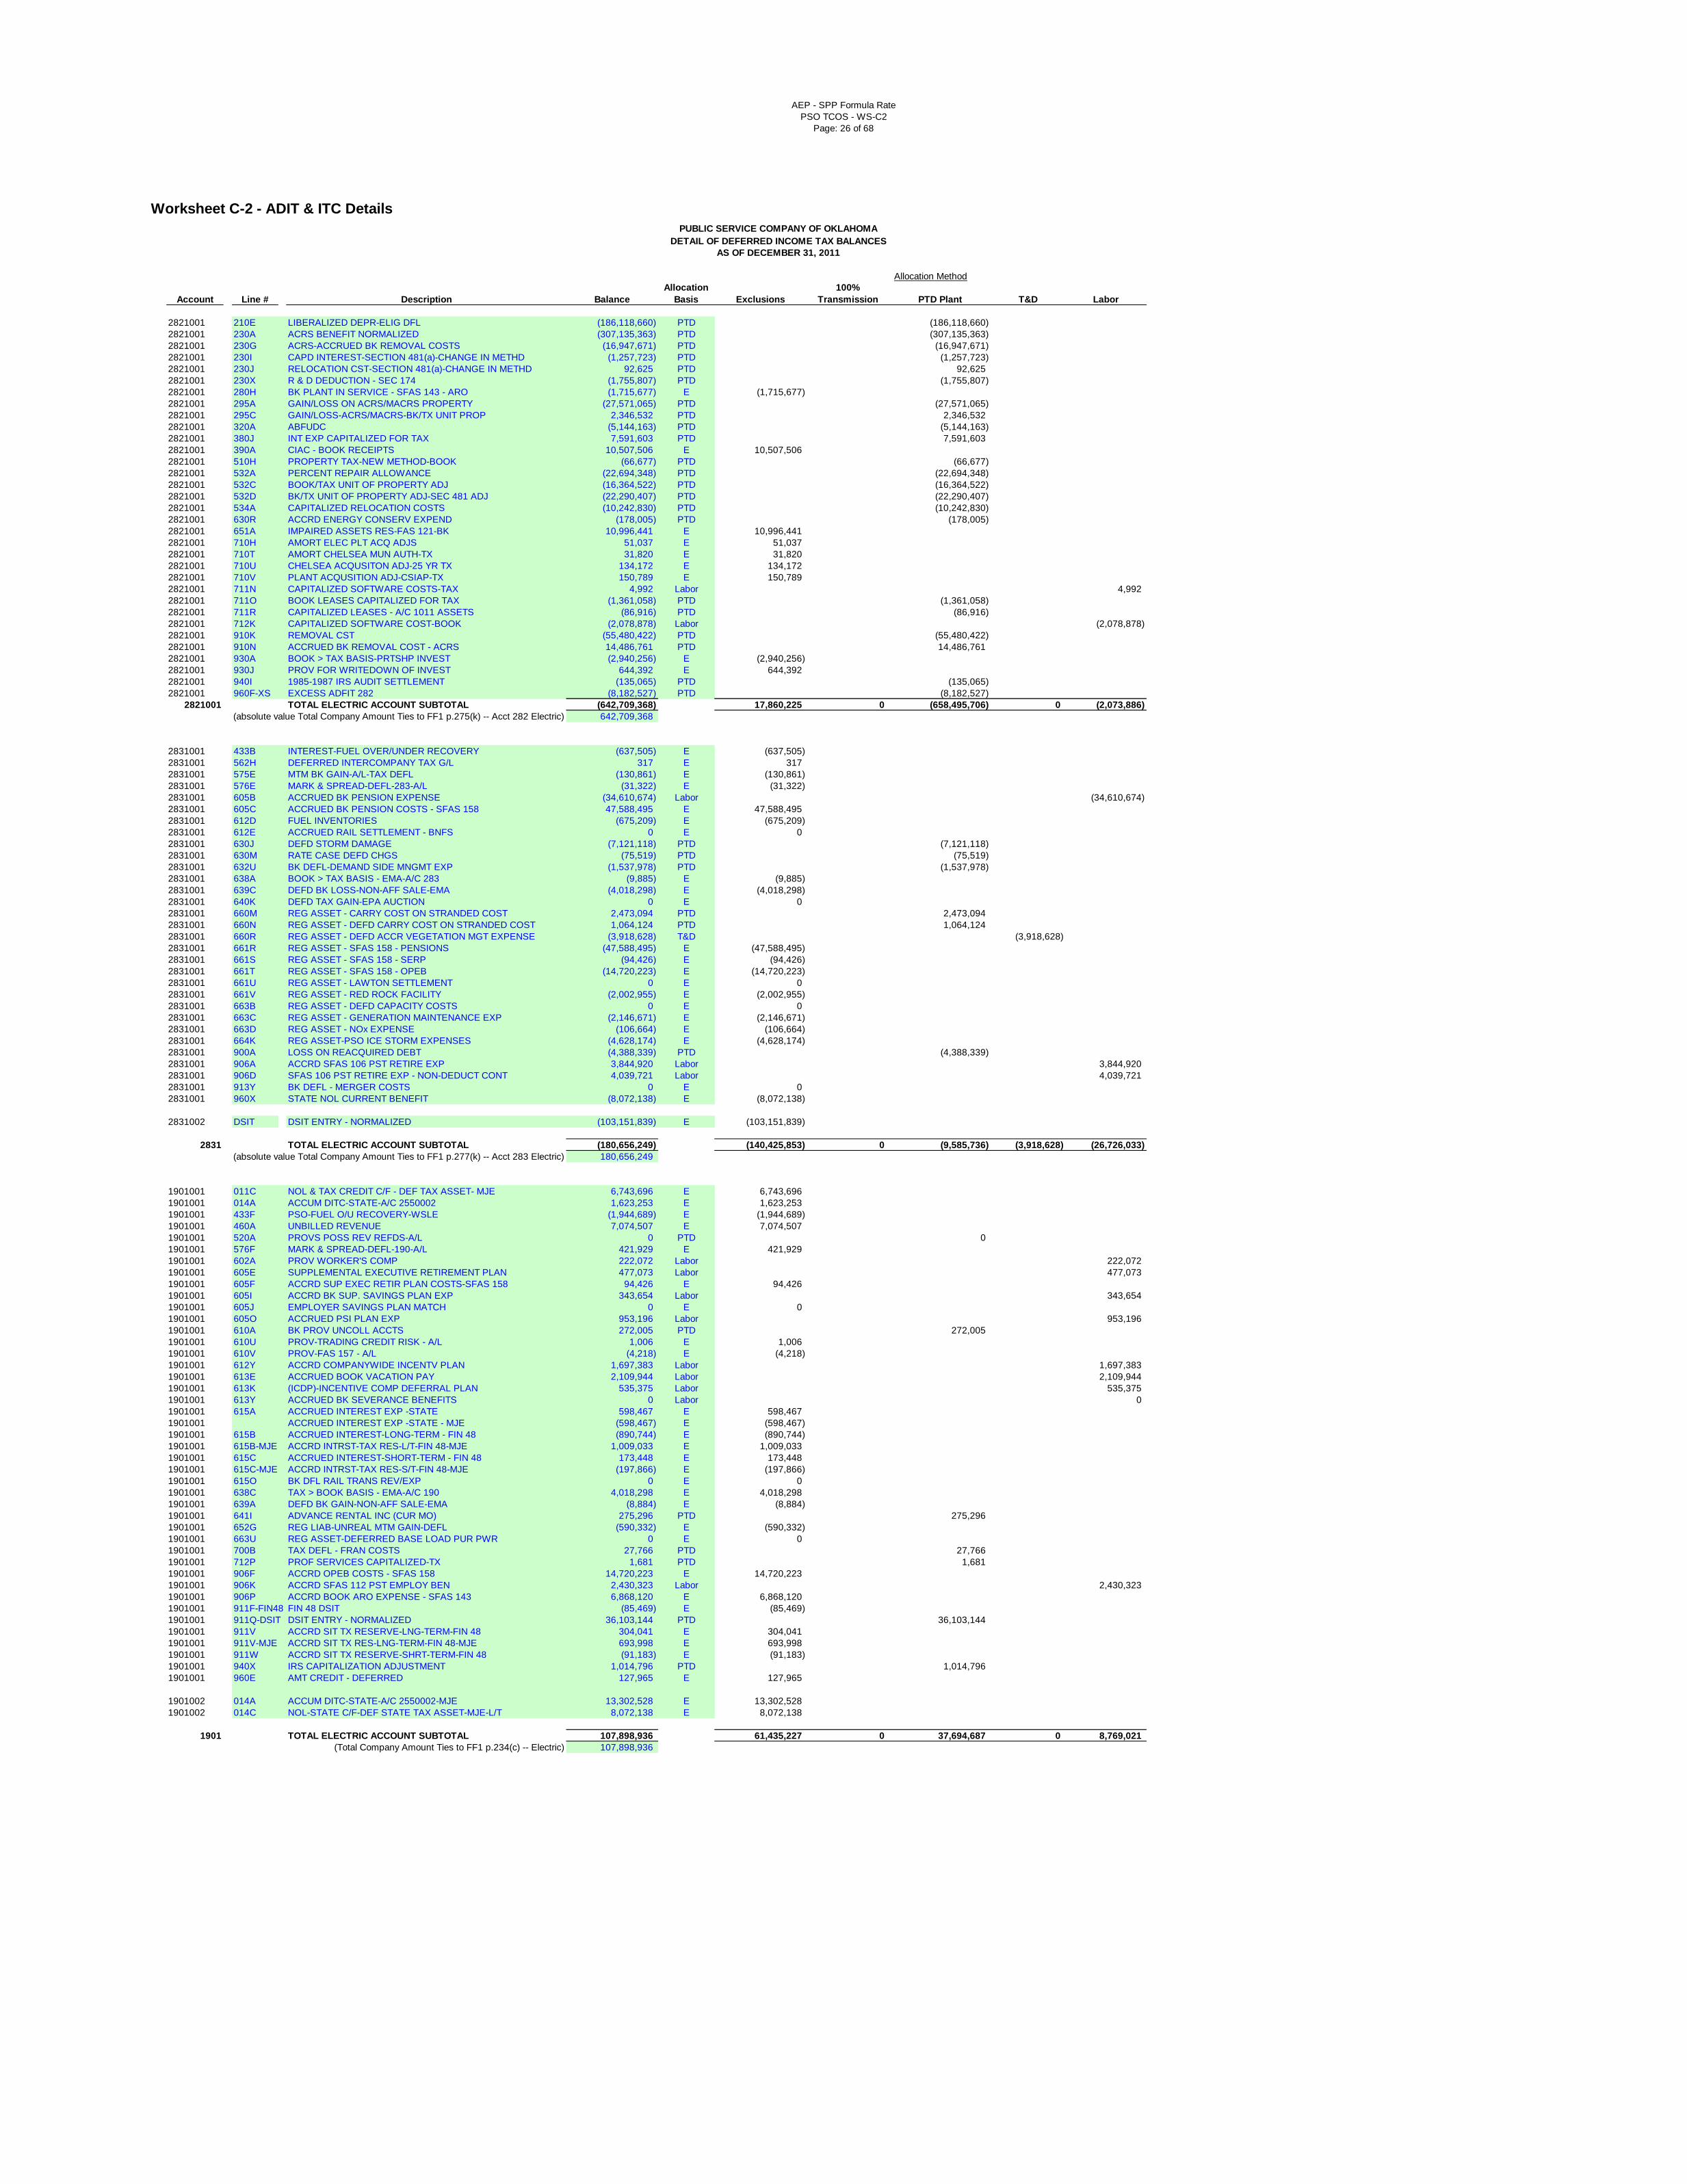
AEP - SPP Formula Rate
PSO TCOS - WS-C2
Page: 26 of 68
Worksheet C-2 - ADIT & ITC Details
Account Line # Description Balance
Allocation
Basis Exclusions
100%
Transmission PTD Plant T&D Labor
2821001 210E LIBERALIZED DEPR-ELIG DFL (186,118,660) PTD (186,118,660)
2821001 230A ACRS BENEFIT NORMALIZED (307,135,363) PTD (307,135,363)
2821001 230G ACRS-ACCRUED BK REMOVAL COSTS (16,947,671) PTD (16,947,671)
2821001 230I CAPD INTEREST-SECTION 481(a)-CHANGE IN METHD (1,257,723) PTD (1,257,723)
2821001 230J RELOCATION CST-SECTION 481(a)-CHANGE IN METHD 92,625 PTD 92,625
2821001 230X R & D DEDUCTION - SEC 174 (1,755,807) PTD (1,755,807)
2821001 280H BK PLANT IN SERVICE - SFAS 143 - ARO (1,715,677) E (1,715,677)
2821001 295A GAIN/LOSS ON ACRS/MACRS PROPERTY (27,571,065) PTD (27,571,065)
2821001 295C GAIN/LOSS-ACRS/MACRS-BK/TX UNIT PROP 2,346,532 PTD 2,346,532
2821001 320A ABFUDC (5,144,163) PTD (5,144,163)
2821001 380J INT EXP CAPITALIZED FOR TAX 7,591,603 PTD 7,591,603
2821001 390A CIAC - BOOK RECEIPTS 10,507,506 E 10,507,506
2821001 510H PROPERTY TAX-NEW METHOD-BOOK (66,677) PTD (66,677)
2821001 532A PERCENT REPAIR ALLOWANCE (22,694,348) PTD (22,694,348)
2821001 532C BOOK/TAX UNIT OF PROPERTY ADJ (16,364,522) PTD (16,364,522)
2821001 532D BK/TX UNIT OF PROPERTY ADJ-SEC 481 ADJ (22,290,407) PTD (22,290,407)
2821001 534A CAPITALIZED RELOCATION COSTS (10,242,830) PTD (10,242,830)
2821001 630R ACCRD ENERGY CONSERV EXPEND (178,005) PTD (178,005)
2821001 651A IMPAIRED ASSETS RES-FAS 121-BK 10,996,441 E 10,996,441
2821001 710H AMORT ELEC PLT ACQ ADJS 51,037 E 51,037
2821001 710T AMORT CHELSEA MUN AUTH-TX 31,820 E 31,820
2821001 710U CHELSEA ACQUSITON ADJ-25 YR TX 134,172 E 134,172
2821001 710V PLANT ACQUSITION ADJ-CSIAP-TX 150,789 E 150,789
2821001 711N CAPITALIZED SOFTWARE COSTS-TAX 4,992 Labor 4,992
2821001 711O BOOK LEASES CAPITALIZED FOR TAX (1,361,058) PTD (1,361,058)
2821001 711R CAPITALIZED LEASES - A/C 1011 ASSETS (86,916) PTD (86,916)
2821001 712K CAPITALIZED SOFTWARE COST-BOOK (2,078,878) Labor (2,078,878)
2821001 910K REMOVAL CST (55,480,422) PTD (55,480,422)
2821001 910N ACCRUED BK REMOVAL COST - ACRS 14,486,761 PTD 14,486,761
2821001 930A BOOK > TAX BASIS-PRTSHP INVEST (2,940,256) E (2,940,256)
2821001 930J PROV FOR WRITEDOWN OF INVEST 644,392 E 644,392
2821001 940I 1985-1987 IRS AUDIT SETTLEMENT (135,065) PTD (135,065)
2821001 960F-XS EXCESS ADFIT 282 (8,182,527) PTD (8,182,527)
2821001 TOTAL ELECTRIC ACCOUNT SUBTOTAL (642,709,368) 17,860,225 0 (658,495,706) 0 (2,073,886)
(absolute value Total Company Amount Ties to FF1 p.275(k) -- Acct 282 Electric) 642,709,368
2831001 433B INTEREST-FUEL OVER/UNDER RECOVERY (637,505) E (637,505)
2831001 562H DEFERRED INTERCOMPANY TAX G/L 317 E 317
2831001 575E MTM BK GAIN-A/L-TAX DEFL (130,861) E (130,861)
2831001 576E MARK & SPREAD-DEFL-283-A/L (31,322) E (31,322)
2831001 605B ACCRUED BK PENSION EXPENSE (34,610,674) Labor (34,610,674)
2831001 605C ACCRUED BK PENSION COSTS - SFAS 158 47,588,495 E 47,588,495
2831001 612D FUEL INVENTORIES (675,209) E (675,209)
2831001 612E ACCRUED RAIL SETTLEMENT - BNFS 0 E 0
2831001 630J DEFD STORM DAMAGE (7,121,118) PTD (7,121,118)
2831001 630M RATE CASE DEFD CHGS (75,519) PTD (75,519)
2831001 632U BK DEFL-DEMAND SIDE MNGMT EXP (1,537,978) PTD (1,537,978)
2831001 638A BOOK > TAX BASIS - EMA-A/C 283 (9,885) E (9,885)
2831001 639C DEFD BK LOSS-NON-AFF SALE-EMA (4,018,298) E (4,018,298)
2831001 640K DEFD TAX GAIN-EPA AUCTION 0 E 0
2831001 660M REG ASSET - CARRY COST ON STRANDED COST 2,473,094 PTD 2,473,094
2831001 660N REG ASSET - DEFD CARRY COST ON STRANDED COST 1,064,124 PTD 1,064,124
2831001 660R REG ASSET - DEFD ACCR VEGETATION MGT EXPENSE (3,918,628) T&D (3,918,628)
2831001 661R REG ASSET - SFAS 158 - PENSIONS (47,588,495) E (47,588,495)
2831001 661S REG ASSET - SFAS 158 - SERP (94,426) E (94,426)
2831001 661T REG ASSET - SFAS 158 - OPEB (14,720,223) E (14,720,223)
2831001 661U REG ASSET - LAWTON SETTLEMENT 0 E 0
2831001 661V REG ASSET - RED ROCK FACILITY (2,002,955) E (2,002,955)
2831001 663B REG ASSET - DEFD CAPACITY COSTS 0 E 0
2831001 663C REG ASSET - GENERATION MAINTENANCE EXP (2,146,671) E (2,146,671)
2831001 663D REG ASSET - NOx EXPENSE (106,664) E (106,664)
2831001 664K REG ASSET-PSO ICE STORM EXPENSES (4,628,174) E (4,628,174)
2831001 900A LOSS ON REACQUIRED DEBT (4,388,339) PTD (4,388,339)
2831001 906A ACCRD SFAS 106 PST RETIRE EXP 3,844,920 Labor 3,844,920
2831001 906D SFAS 106 PST RETIRE EXP - NON-DEDUCT CONT 4,039,721 Labor 4,039,721
2831001 913Y BK DEFL - MERGER COSTS 0 E 0
2831001 960X STATE NOL CURRENT BENEFIT (8,072,138) E (8,072,138)
2831002 DSIT DSIT ENTRY - NORMALIZED (103,151,839) E (103,151,839)
2831 TOTAL ELECTRIC ACCOUNT SUBTOTAL (180,656,249) (140,425,853) 0 (9,585,736) (3,918,628) (26,726,033)
(absolute value Total Company Amount Ties to FF1 p.277(k) -- Acct 283 Electric) 180,656,249
1901001 011C NOL & TAX CREDIT C/F - DEF TAX ASSET- MJE 6,743,696 E 6,743,696
1901001 014A ACCUM DITC-STATE-A/C 2550002 1,623,253 E 1,623,253
1901001 433F PSO-FUEL O/U RECOVERY-WSLE (1,944,689) E (1,944,689)
1901001 460A UNBILLED REVENUE 7,074,507 E 7,074,507
1901001 520A PROVS POSS REV REFDS-A/L 0 PTD 0
1901001 576F MARK & SPREAD-DEFL-190-A/L 421,929 E 421,929
1901001 602A PROV WORKER'S COMP 222,072 Labor 222,072
1901001 605E SUPPLEMENTAL EXECUTIVE RETIREMENT PLAN 477,073 Labor 477,073
1901001 605F ACCRD SUP EXEC RETIR PLAN COSTS-SFAS 158 94,426 E 94,426
1901001 605I ACCRD BK SUP. SAVINGS PLAN EXP 343,654 Labor 343,654
1901001 605J EMPLOYER SAVINGS PLAN MATCH 0 E 0
1901001 605O ACCRUED PSI PLAN EXP 953,196 Labor 953,196
1901001 610A BK PROV UNCOLL ACCTS 272,005 PTD 272,005
1901001 610U PROV-TRADING CREDIT RISK - A/L 1,006 E 1,006
1901001 610V PROV-FAS 157 - A/L (4,218) E (4,218)
1901001 612Y ACCRD COMPANYWIDE INCENTV PLAN 1,697,383 Labor 1,697,383
1901001 613E ACCRUED BOOK VACATION PAY 2,109,944 Labor 2,109,944
1901001 613K (ICDP)-INCENTIVE COMP DEFERRAL PLAN 535,375 Labor 535,375
1901001 613Y ACCRUED BK SEVERANCE BENEFITS 0 Labor 0
1901001 615A ACCRUED INTEREST EXP -STATE 598,467 E 598,467
1901001 ACCRUED INTEREST EXP -STATE - MJE (598,467) E (598,467)
1901001 615B ACCRUED INTEREST-LONG-TERM - FIN 48 (890,744) E (890,744)
1901001 615B-MJE ACCRD INTRST-TAX RES-L/T-FIN 48-MJE 1,009,033 E 1,009,033
1901001 615C ACCRUED INTEREST-SHORT-TERM - FIN 48 173,448 E 173,448
1901001 615C-MJE ACCRD INTRST-TAX RES-S/T-FIN 48-MJE (197,866) E (197,866)
1901001 615O BK DFL RAIL TRANS REV/EXP 0 E 0
1901001 638C TAX > BOOK BASIS - EMA-A/C 190 4,018,298 E 4,018,298
1901001 639A DEFD BK GAIN-NON-AFF SALE-EMA (8,884) E (8,884)
1901001 641I ADVANCE RENTAL INC (CUR MO) 275,296 PTD 275,296
1901001 652G REG LIAB-UNREAL MTM GAIN-DEFL (590,332) E (590,332)
1901001 663U REG ASSET-DEFERRED BASE LOAD PUR PWR 0 E 0
1901001 700B TAX DEFL - FRAN COSTS 27,766 PTD 27,766
1901001 712P PROF SERVICES CAPITALIZED-TX 1,681 PTD 1,681
1901001 906F ACCRD OPEB COSTS - SFAS 158 14,720,223 E 14,720,223
1901001 906K ACCRD SFAS 112 PST EMPLOY BEN 2,430,323 Labor 2,430,323
1901001 906P ACCRD BOOK ARO EXPENSE - SFAS 143 6,868,120 E 6,868,120
1901001 911F-FIN48 FIN 48 DSIT (85,469) E (85,469)
1901001 911Q-DSIT DSIT ENTRY - NORMALIZED 36,103,144 PTD 36,103,144
1901001 911V ACCRD SIT TX RESERVE-LNG-TERM-FIN 48 304,041 E 304,041
1901001 911V-MJE ACCRD SIT TX RES-LNG-TERM-FIN 48-MJE 693,998 E 693,998
1901001 911W ACCRD SIT TX RESERVE-SHRT-TERM-FIN 48 (91,183) E (91,183)
1901001 940X IRS CAPITALIZATION ADJUSTMENT 1,014,796 PTD 1,014,796
1901001 960E AMT CREDIT - DEFERRED 127,965 E 127,965
1901002 014A ACCUM DITC-STATE-A/C 2550002-MJE 13,302,528 E 13,302,528
1901002 014C NOL-STATE C/F-DEF STATE TAX ASSET-MJE-L/T 8,072,138 E 8,072,138
1901 TOTAL ELECTRIC ACCOUNT SUBTOTAL 107,898,936 61,435,227 0 37,694,687 0 8,769,021
(Total Company Amount Ties to FF1 p.234(c) -- Electric) 107,898,936
PUBLIC SERVICE COMPANY OF OKLAHOMA
DETAIL OF DEFERRED INCOME TAX BALANCES
AS OF DECEMBER 31, 2011
Allocation Method

AEP - SPP Formula Rate
PSO TCOS - WS D
Page: 27 of 68
(A) (B) ( C ) (D) (E) (F) (G) (H) (I)
Line
Number Source
FF1, p. 227, Col. (c) FF1, p. 227, Col. (b)
1
2 Transmission Materials & Supplies FF1, p. 227, ln 8, Col. (c & b) 419,745 754,222 586,984
3 General Materials & Supplies FF1, p. 227, ln 11, Col. (c & b) 324,917 489,375 407,146
4 Stores Expense (Undistributed) FF1, p. 227, ln 16, Col. (c & b) 0 0 -
100% Total Included
Average of Excludable Transmission Plant Labor in Rate Base
YE Balance Balances Related Related Related (E)+(F)+(G)
5 Totals as of December 31, 2012 7,087,189 (107,233,277) 0 2,904,855 111,415,611 114,320,466
6 Totals as of December 31, 2011 8,812,637 (101,121,588) 3,490,363 106,443,862 109,934,225
7 Average Balance 7,949,913 (104,177,433) 0 3,197,609 108,929,737 112,127,346
0.548195905 0.451804095
100% Total Included
2012 Excludable Transmission Plant Labor in Rate Base
Acc. No. Description YE Balance Balances Related Related Related (E)+(F)+(G)
8 1650001 Prepaid Insurance 1,047,117 0 574,025 473,092 1,047,117
Plant: Property Ins, Labor Related: Gen Liability
Ins, D&O Ins, Workers Comp Ins.
9 1650004 Prepaid Interest 0 0 0 - Prepaid Executive Life Insurance
10 1650005 Prepaid Employee Benefits 0 0 -
11 1650006 Other Prepayments 528,200 528,200 -
Prepaid Royalty Pmts to Coal Leaseholders, Stall
Prepaid agreement fees & NERC Assessment
fees.
12 1650009 Prepaid Carry Cost-Factored AR 51,080 51,080 - AR Factoring - Excluded because it is retail.
13 1650010 Prepaid Pension Benefits 110,582,517 110,582,517 110,582,517 Prefunded Pension Expense
14 165001112 Prepaid Sales Taxes 1,500,000 1,500,000 1,500,000
15 165001212 Prepaid Use Taxes 150,000 150,000 150,000
16 1650014 FAS 158 Qual Contra Asset (110,582,517) (110,582,517) - Non-Cash Offset Excludable from Rate Base
1650016 FAS 112 ASSETS 0 - SFAS 158 Offset
1650021 Prepaid Insurance - EIS 1,040,832 680,830 360,003 1,040,832
Plant: EIS Property Ins, Labor Related: EIS Gen
Liability Ins.
1650023 Prepaid Leases 1,224,163 1,224,163 -
17 1650028 Trinity Rail Car Lease - Non-current 1,545,797 1,545,797 -
18 Subtotal - Form 1, p 111.57.c 7,087,189 (107,233,277) 0 2,904,855 111,415,611 114,320,466
100% Total Included
2011 Excludable Transmission Plant Labor in Rate Base
19 Acc. No. Description YE Balance Balances Related Related Related (E)+(F)+(G)
20 1650001 Prepaid Insurance 959,827 0 521,562 438,265 959,827
Plant: Property Ins, Labor Related: Gen Liability
Ins, D&O Ins, Workers Comp Ins.
21 165001206 Prepaid Taxes 2,150,000 0 2,150,000 2,150,000 Prepaid Ok State Taxes
22 1650028 Trinity Railcar Lease 2,742,653 2,742,653 - Prepaid Facility Fee on 1.5B Securitization
23 1650005 Prepaid Employee Benefits 2,940 0 2,940 2,940 Executive Life Insurance
24 1650006 Other Prepayments 539,276 539,276 -
OCC Assessment Fees - Retail Only & NERC
Fees
25 1650009 Prepaid Carry Cost-Factored AR 98,184 98,184 - AR Factoring - Retail Only
26 1650010 Prepaid Pension Benefits 105,659,689 0 105,659,689 105,659,689 Prefunded Pension Expense
27 1650014 FAS 158 Qual Contra Asset (105,659,689) (105,659,689) -
28 1650023 Prepaid Leases 1,157,988 1,157,988 -
29 1650021 Prepaid Insurance - EIS 1,161,769 0 818,801 342,968 1,161,769 Excess General Liability & Property Ins.
30 Subtotal - Form 1, p 111.57.c 8,812,637 (101,121,588) 3,490,363 106,443,862 109,934,225
Prepayments Account 165 - Balance @ 12/31/2011
Prepayment Balance Summary
Balance @
December 31, 2012
Average Balance for
Rate Year 2012
Prepayments Account 165 - Balance @ 12/31/2012
Balance @
December 31, 2011
Materials & Supplies
AEP West SPP Member Companies
2013 Cost of Service Formula Rate
Worksheet D - Working Capital Rate Base Adjustments
PUBLIC SERVICE COMPANY OF OKLAHOMA
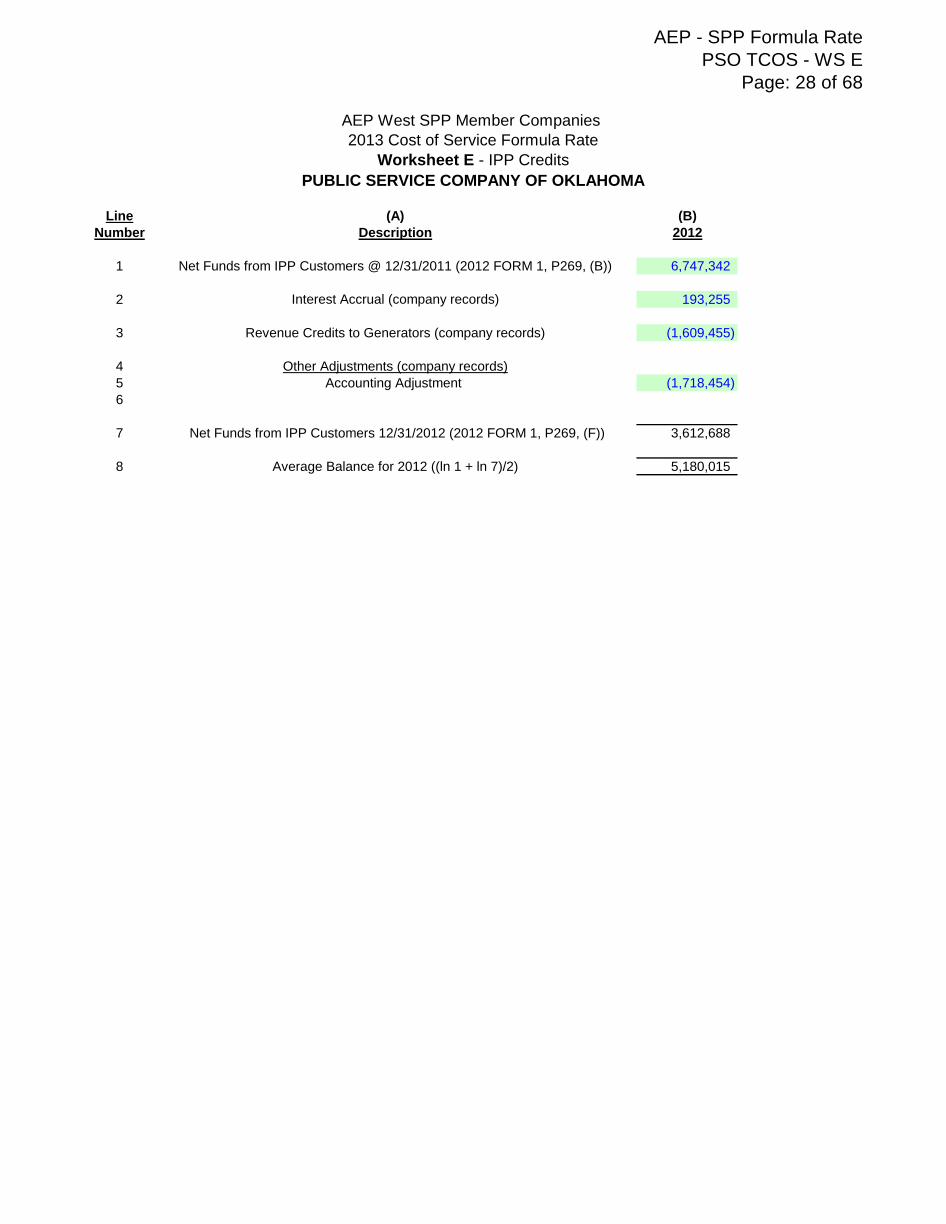
AEP - SPP Formula Rate
PSO TCOS - WS E
Page: 28 of 68
Line (A) (B)
Number Description 2012
1 Net Funds from IPP Customers @ 12/31/2011 (2012 FORM 1, P269, (B)) 6,747,342
2 Interest Accrual (company records) 193,255
3 Revenue Credits to Generators (company records) (1,609,455)
4 Other Adjustments (company records)
5 Accounting Adjustment (1,718,454)
6
7 Net Funds from IPP Customers 12/31/2012 (2012 FORM 1, P269, (F)) 3,612,688
8 Average Balance for 2012 ((ln 1 + ln 7)/2) 5,180,015
AEP West SPP Member Companies
2013 Cost of Service Formula Rate
Worksheet E - IPP Credits
PUBLIC SERVICE COMPANY OF OKLAHOMA
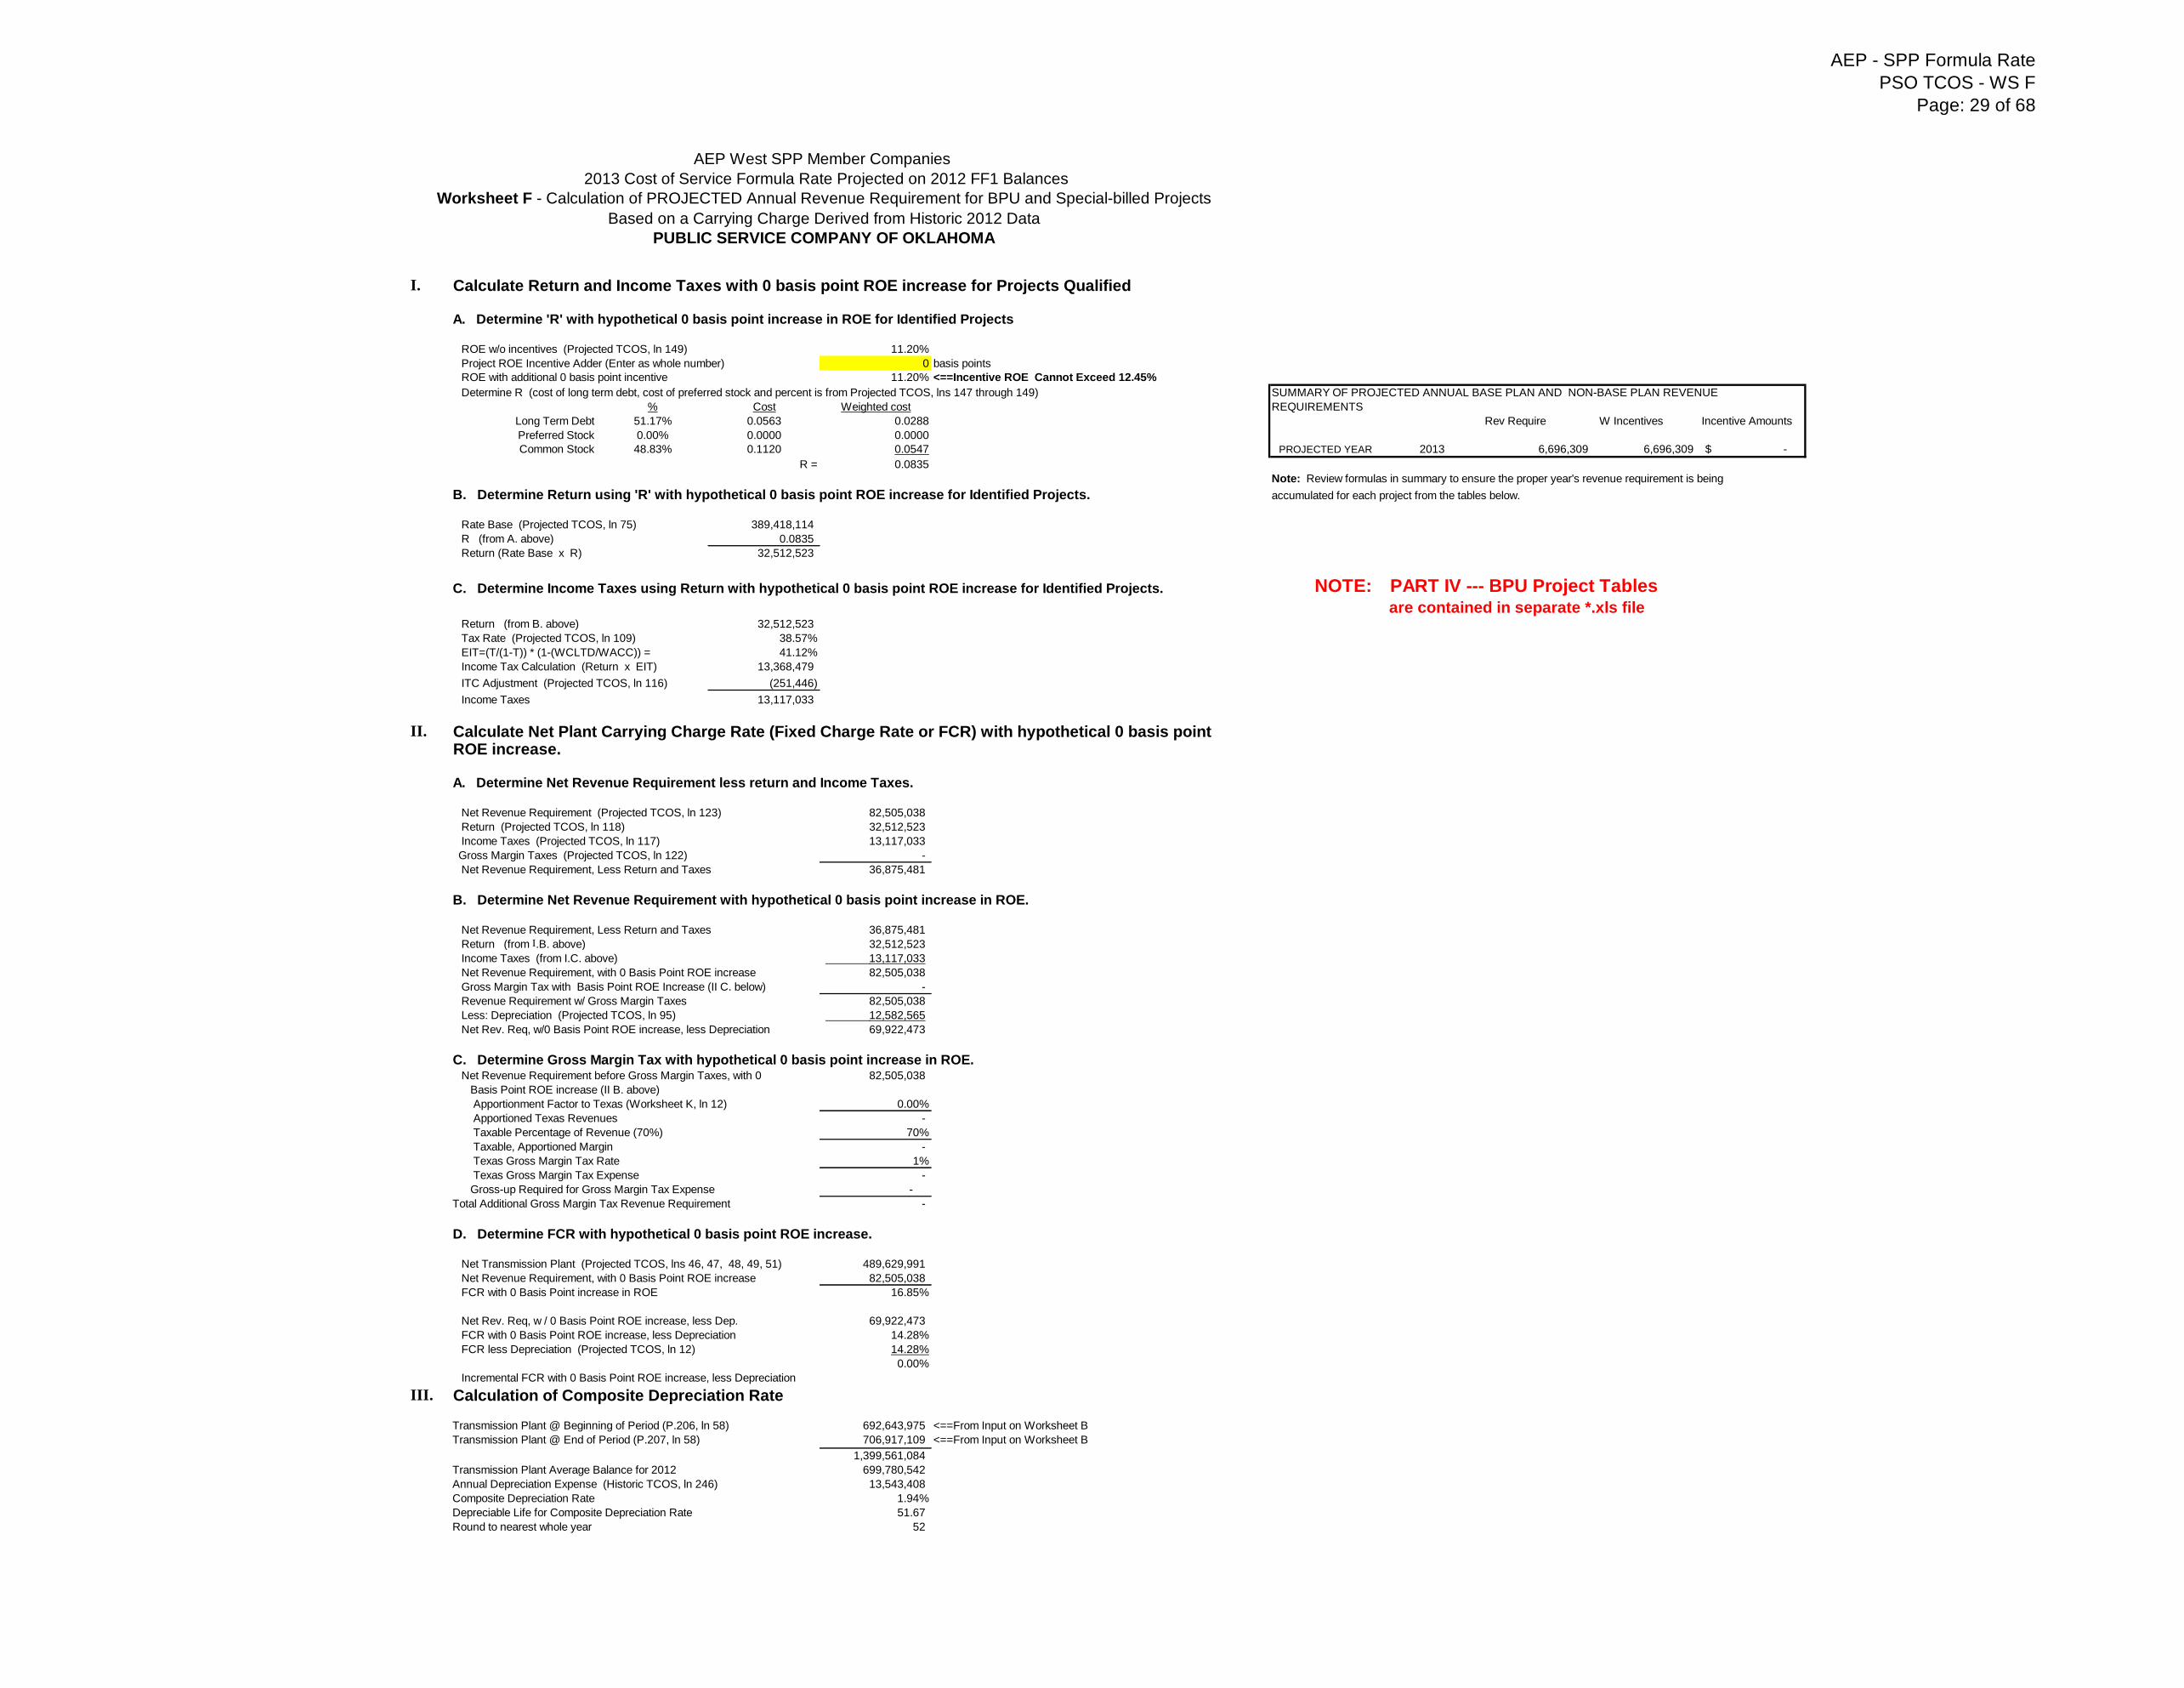
AEP - SPP Formula Rate
PSO TCOS - WS F
Page: 29 of 68
I.
A. Determine 'R' with hypothetical 0 basis point increase in ROE for Identified Projects
ROE w/o incentives (Projected TCOS, ln 149) 11.20%
Project ROE Incentive Adder (Enter as whole number) 0 basis points
ROE with additional 0 basis point incentive 11.20% <==Incentive ROE Cannot Exceed 12.45%
Determine R (cost of long term debt, cost of preferred stock and percent is from Projected TCOS, lns 147 through 149)
% Cost Weighted cost
Long Term Debt 51.17% 0.0563 0.0288 Rev Require W Incentives Incentive Amounts
Preferred Stock 0.00% 0.0000 0.0000
Common Stock 48.83% 0.1120 0.0547 PROJECTED YEAR 2013 6,696,309 6,696,309 -$
R = 0.0835
Note: Review formulas in summary to ensure the proper year's revenue requirement is being
B. Determine Return using 'R' with hypothetical 0 basis point ROE increase for Identified Projects. accumulated for each project from the tables below.
Rate Base (Projected TCOS, ln 75) 389,418,114
R (from A. above) 0.0835
Return (Rate Base x R) 32,512,523
C. Determine Income Taxes using Return with hypothetical 0 basis point ROE increase for Identified Projects. NOTE: PART IV --- BPU Project Tablesare contained in separate *.xls file
Return (from B. above) 32,512,523
Tax Rate (Projected TCOS, ln 109) 38.57%
EIT=(T/(1-T)) * (1-(WCLTD/WACC)) = 41.12%
Income Tax Calculation (Return x EIT) 13,368,479
ITC Adjustment (Projected TCOS, ln 116) (251,446)
Income Taxes 13,117,033
II. Calculate Net Plant Carrying Charge Rate (Fixed Charge Rate or FCR) with hypothetical 0 basis pointROE increase.
A. Determine Net Revenue Requirement less return and Income Taxes.
Net Revenue Requirement (Projected TCOS, ln 123) 82,505,038
Return (Projected TCOS, ln 118) 32,512,523
Income Taxes (Projected TCOS, ln 117) 13,117,033
Gross Margin Taxes (Projected TCOS, ln 122) -
Net Revenue Requirement, Less Return and Taxes 36,875,481
B. Determine Net Revenue Requirement with hypothetical 0 basis point increase in ROE.
Net Revenue Requirement, Less Return and Taxes 36,875,481
Return (from I.B. above) 32,512,523
Income Taxes (from I.C. above) 13,117,033
Net Revenue Requirement, with 0 Basis Point ROE increase 82,505,038
Gross Margin Tax with Basis Point ROE Increase (II C. below) -
Revenue Requirement w/ Gross Margin Taxes 82,505,038
Less: Depreciation (Projected TCOS, ln 95) 12,582,565
Net Rev. Req, w/0 Basis Point ROE increase, less Depreciation 69,922,473
C. Determine Gross Margin Tax with hypothetical 0 basis point increase in ROE. Net Revenue Requirement before Gross Margin Taxes, with 0 82,505,038
Basis Point ROE increase (II B. above)
Apportionment Factor to Texas (Worksheet K, ln 12) 0.00%
Apportioned Texas Revenues -
Taxable Percentage of Revenue (70%) 70%
Taxable, Apportioned Margin -
Texas Gross Margin Tax Rate 1%
Texas Gross Margin Tax Expense -
Gross-up Required for Gross Margin Tax Expense -
Total Additional Gross Margin Tax Revenue Requirement -
D. Determine FCR with hypothetical 0 basis point ROE increase.
Net Transmission Plant (Projected TCOS, lns 46, 47, 48, 49, 51) 489,629,991
Net Revenue Requirement, with 0 Basis Point ROE increase 82,505,038
FCR with 0 Basis Point increase in ROE 16.85%
Net Rev. Req, w / 0 Basis Point ROE increase, less Dep. 69,922,473
FCR with 0 Basis Point ROE increase, less Depreciation 14.28%
FCR less Depreciation (Projected TCOS, ln 12) 14.28%
0.00%
III. Calculation of Composite Depreciation Rate
Transmission Plant @ Beginning of Period (P.206, ln 58) 692,643,975 <==From Input on Worksheet B
Transmission Plant @ End of Period (P.207, ln 58) 706,917,109 <==From Input on Worksheet B
1,399,561,084
Transmission Plant Average Balance for 2012 699,780,542
Annual Depreciation Expense (Historic TCOS, ln 246) 13,543,408
Composite Depreciation Rate 1.94%
Depreciable Life for Composite Depreciation Rate 51.67
Round to nearest whole year 52
SUMMARY OF PROJECTED ANNUAL BASE PLAN AND NON-BASE PLAN REVENUE
REQUIREMENTS
Calculate Return and Income Taxes with 0 basis point ROE increase for Projects Qualified
Incremental FCR with 0 Basis Point ROE increase, less Depreciation
AEP West SPP Member Companies
2013 Cost of Service Formula Rate Projected on 2012 FF1 Balances
Worksheet F - Calculation of PROJECTED Annual Revenue Requirement for BPU and Special-billed Projects
PUBLIC SERVICE COMPANY OF OKLAHOMA
Based on a Carrying Charge Derived from Historic 2012 Data
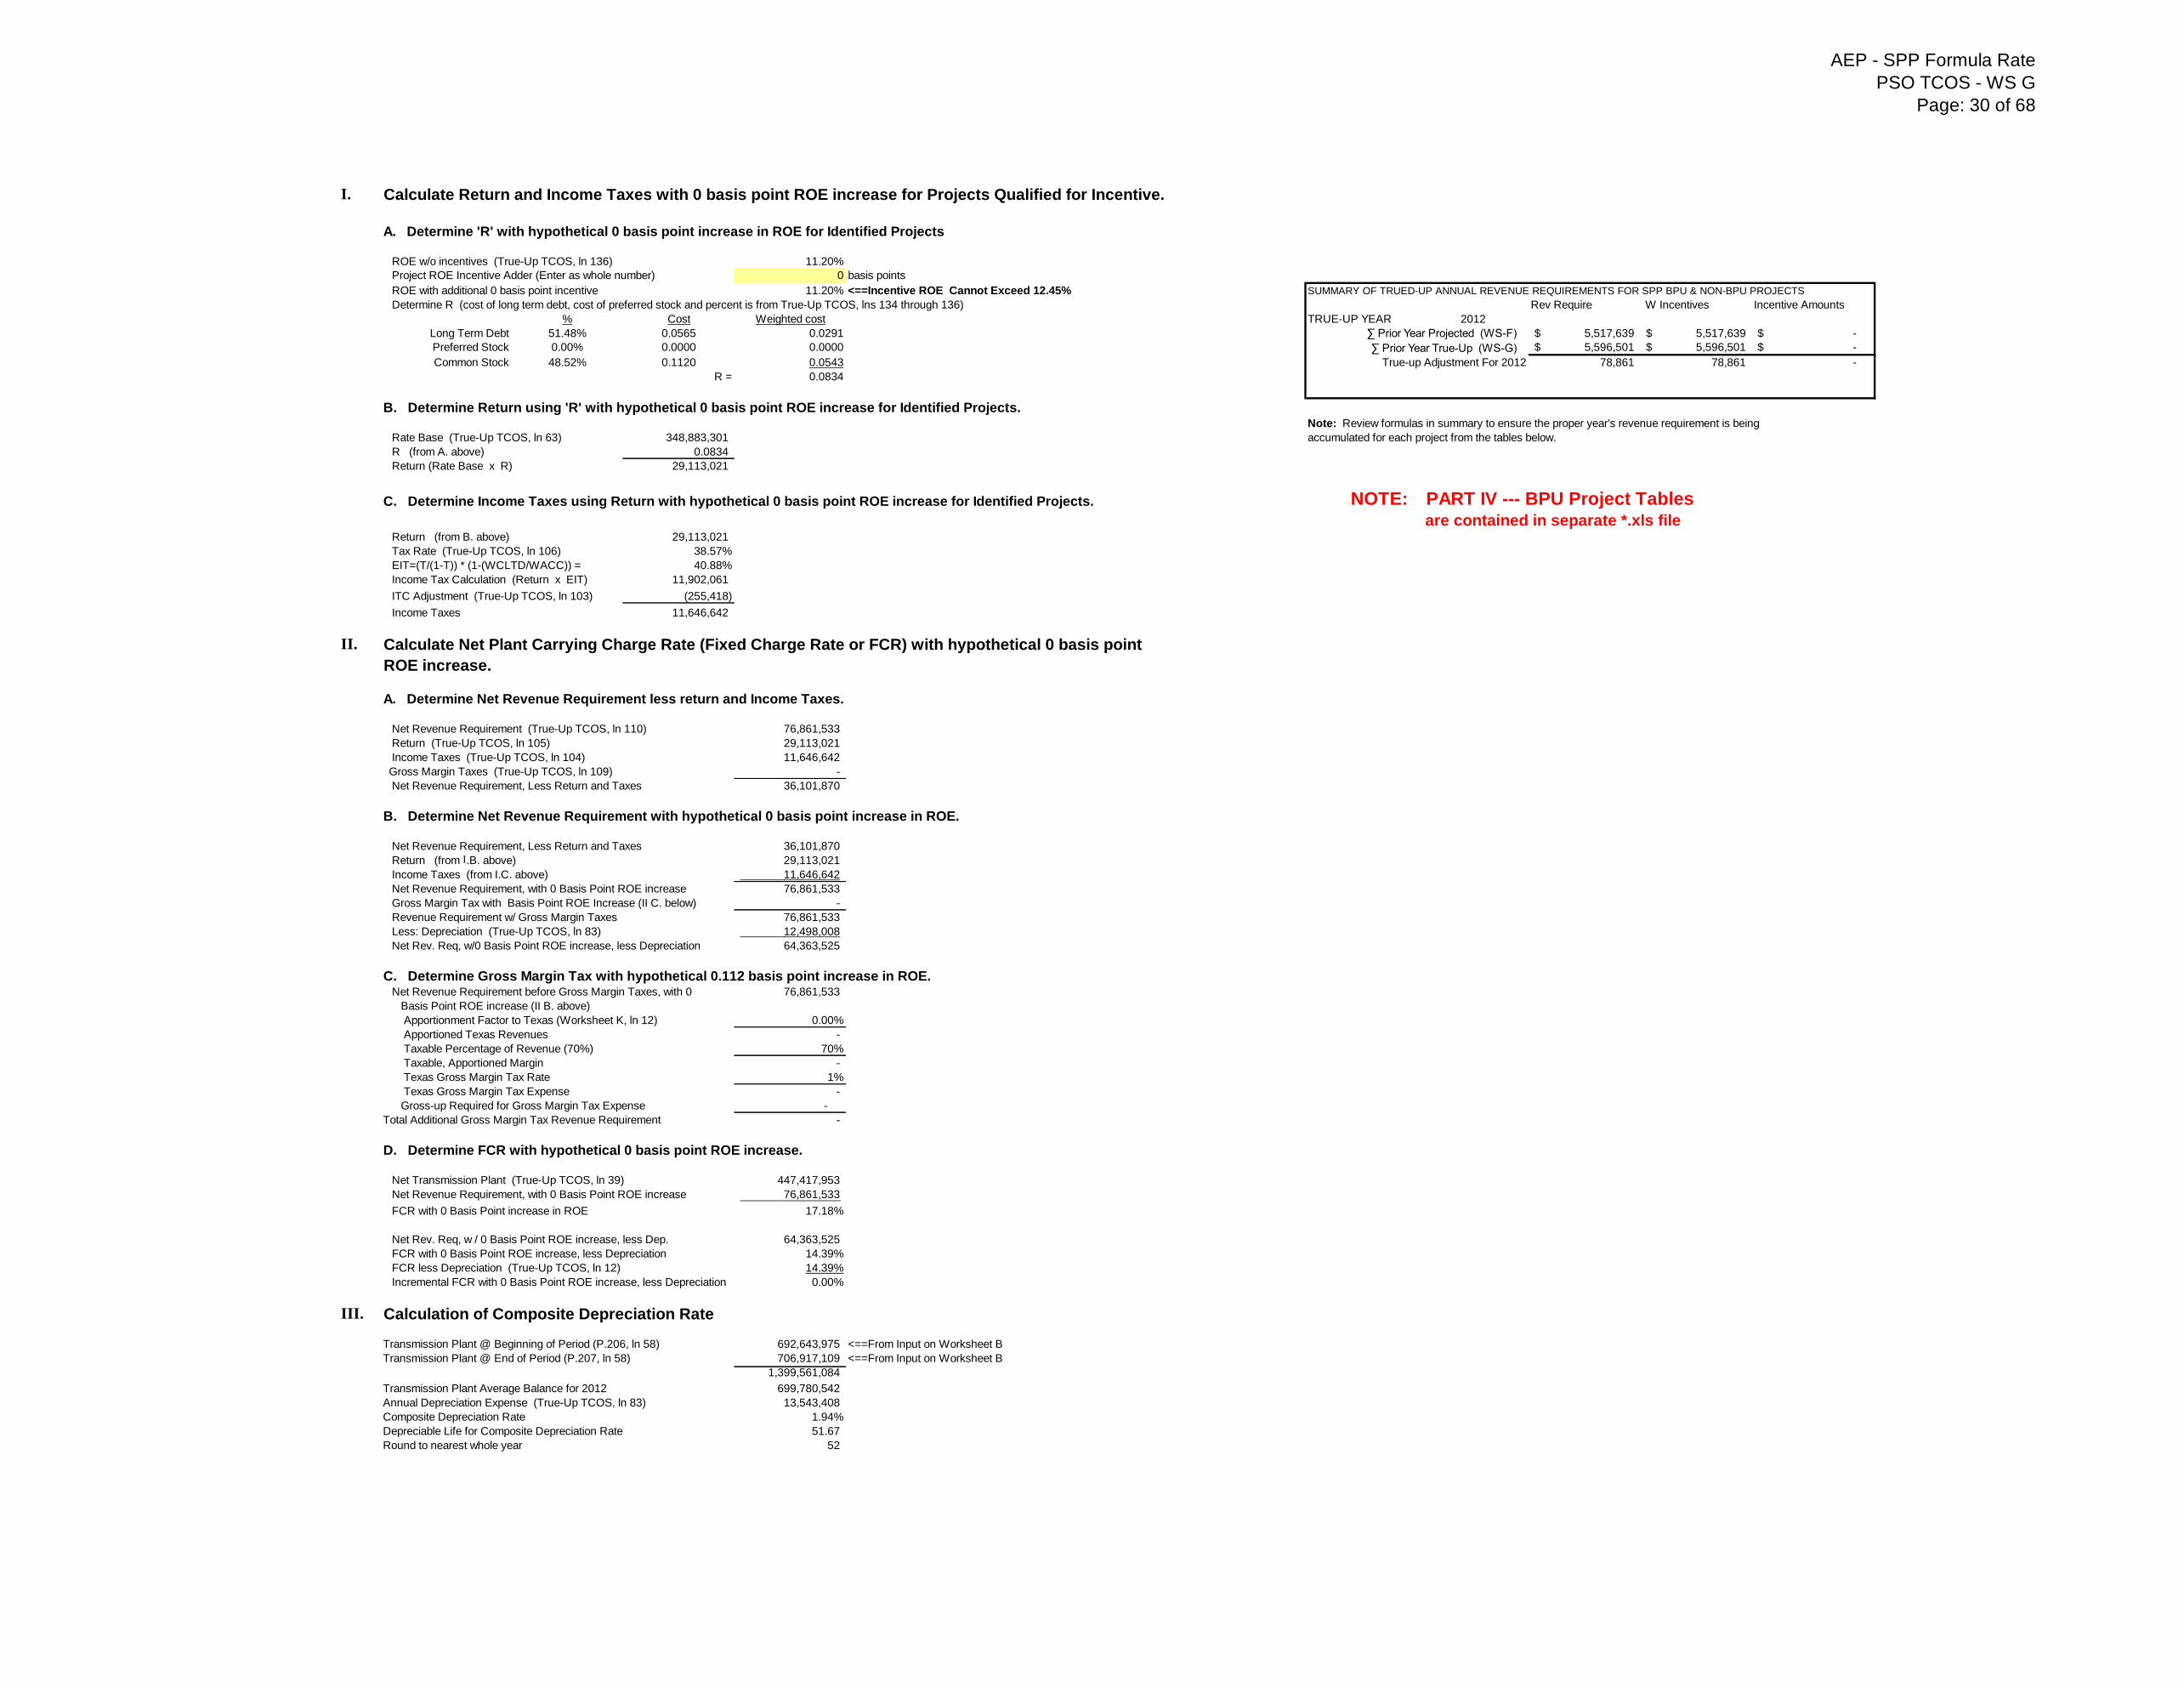
AEP - SPP Formula Rate
PSO TCOS - WS G
Page: 30 of 68
I.
A. Determine 'R' with hypothetical 0 basis point increase in ROE for Identified Projects
ROE w/o incentives (True-Up TCOS, ln 136) 11.20%
Project ROE Incentive Adder (Enter as whole number) 0 basis points
ROE with additional 0 basis point incentive 11.20% <==Incentive ROE Cannot Exceed 12.45% SUMMARY OF TRUED-UP ANNUAL REVENUE REQUIREMENTS FOR SPP BPU & NON-BPU PROJECTS
Determine R (cost of long term debt, cost of preferred stock and percent is from True-Up TCOS, lns 134 through 136) Rev Require W Incentives Incentive Amounts
% Cost Weighted cost TRUE-UP YEAR 2012
Long Term Debt 51.48% 0.0565 0.0291 ∑ Prior Year Projected (WS-F) 5,517,639$ 5,517,639$ -$
Preferred Stock 0.00% 0.0000 0.0000 ∑ Prior Year True-Up (WS-G) 5,596,501$ 5,596,501$ -$
Common Stock 48.52% 0.1120 0.0543 True-up Adjustment For 2012 78,861 78,861 -
R = 0.0834
B. Determine Return using 'R' with hypothetical 0 basis point ROE increase for Identified Projects.Note: Review formulas in summary to ensure the proper year's revenue requirement is being
Rate Base (True-Up TCOS, ln 63) 348,883,301 accumulated for each project from the tables below.
R (from A. above) 0.0834
Return (Rate Base x R) 29,113,021
C. Determine Income Taxes using Return with hypothetical 0 basis point ROE increase for Identified Projects. NOTE: PART IV --- BPU Project Tablesare contained in separate *.xls file
Return (from B. above) 29,113,021
Tax Rate (True-Up TCOS, ln 106) 38.57%
EIT=(T/(1-T)) * (1-(WCLTD/WACC)) = 40.88%
Income Tax Calculation (Return x EIT) 11,902,061
ITC Adjustment (True-Up TCOS, ln 103) (255,418)
Income Taxes 11,646,642
II. Calculate Net Plant Carrying Charge Rate (Fixed Charge Rate or FCR) with hypothetical 0 basis point
ROE increase.
A. Determine Net Revenue Requirement less return and Income Taxes.
Net Revenue Requirement (True-Up TCOS, ln 110) 76,861,533
Return (True-Up TCOS, ln 105) 29,113,021
Income Taxes (True-Up TCOS, ln 104) 11,646,642
Gross Margin Taxes (True-Up TCOS, ln 109) -
Net Revenue Requirement, Less Return and Taxes 36,101,870
B. Determine Net Revenue Requirement with hypothetical 0 basis point increase in ROE.
Net Revenue Requirement, Less Return and Taxes 36,101,870
Return (from I.B. above) 29,113,021
Income Taxes (from I.C. above) 11,646,642
Net Revenue Requirement, with 0 Basis Point ROE increase 76,861,533
Gross Margin Tax with Basis Point ROE Increase (II C. below) -
Revenue Requirement w/ Gross Margin Taxes 76,861,533
Less: Depreciation (True-Up TCOS, ln 83) 12,498,008
Net Rev. Req, w/0 Basis Point ROE increase, less Depreciation 64,363,525
C. Determine Gross Margin Tax with hypothetical 0.112 basis point increase in ROE. Net Revenue Requirement before Gross Margin Taxes, with 0 76,861,533
Basis Point ROE increase (II B. above)
Apportionment Factor to Texas (Worksheet K, ln 12) 0.00%
Apportioned Texas Revenues -
Taxable Percentage of Revenue (70%) 70%
Taxable, Apportioned Margin -
Texas Gross Margin Tax Rate 1%
Texas Gross Margin Tax Expense -
Gross-up Required for Gross Margin Tax Expense -
Total Additional Gross Margin Tax Revenue Requirement -
D. Determine FCR with hypothetical 0 basis point ROE increase.
Net Transmission Plant (True-Up TCOS, ln 39) 447,417,953
Net Revenue Requirement, with 0 Basis Point ROE increase 76,861,533
FCR with 0 Basis Point increase in ROE 17.18%
Net Rev. Req, w / 0 Basis Point ROE increase, less Dep. 64,363,525
FCR with 0 Basis Point ROE increase, less Depreciation 14.39%
FCR less Depreciation (True-Up TCOS, ln 12) 14.39%
Incremental FCR with 0 Basis Point ROE increase, less Depreciation 0.00%
III. Calculation of Composite Depreciation Rate
Transmission Plant @ Beginning of Period (P.206, ln 58) 692,643,975 <==From Input on Worksheet B
Transmission Plant @ End of Period (P.207, ln 58) 706,917,109 <==From Input on Worksheet B
1,399,561,084
Transmission Plant Average Balance for 2012 699,780,542
Annual Depreciation Expense (True-Up TCOS, ln 83) 13,543,408
Composite Depreciation Rate 1.94%
Depreciable Life for Composite Depreciation Rate 51.67
Round to nearest whole year 52
Calculate Return and Income Taxes with 0 basis point ROE increase for Projects Qualified for Incentive.
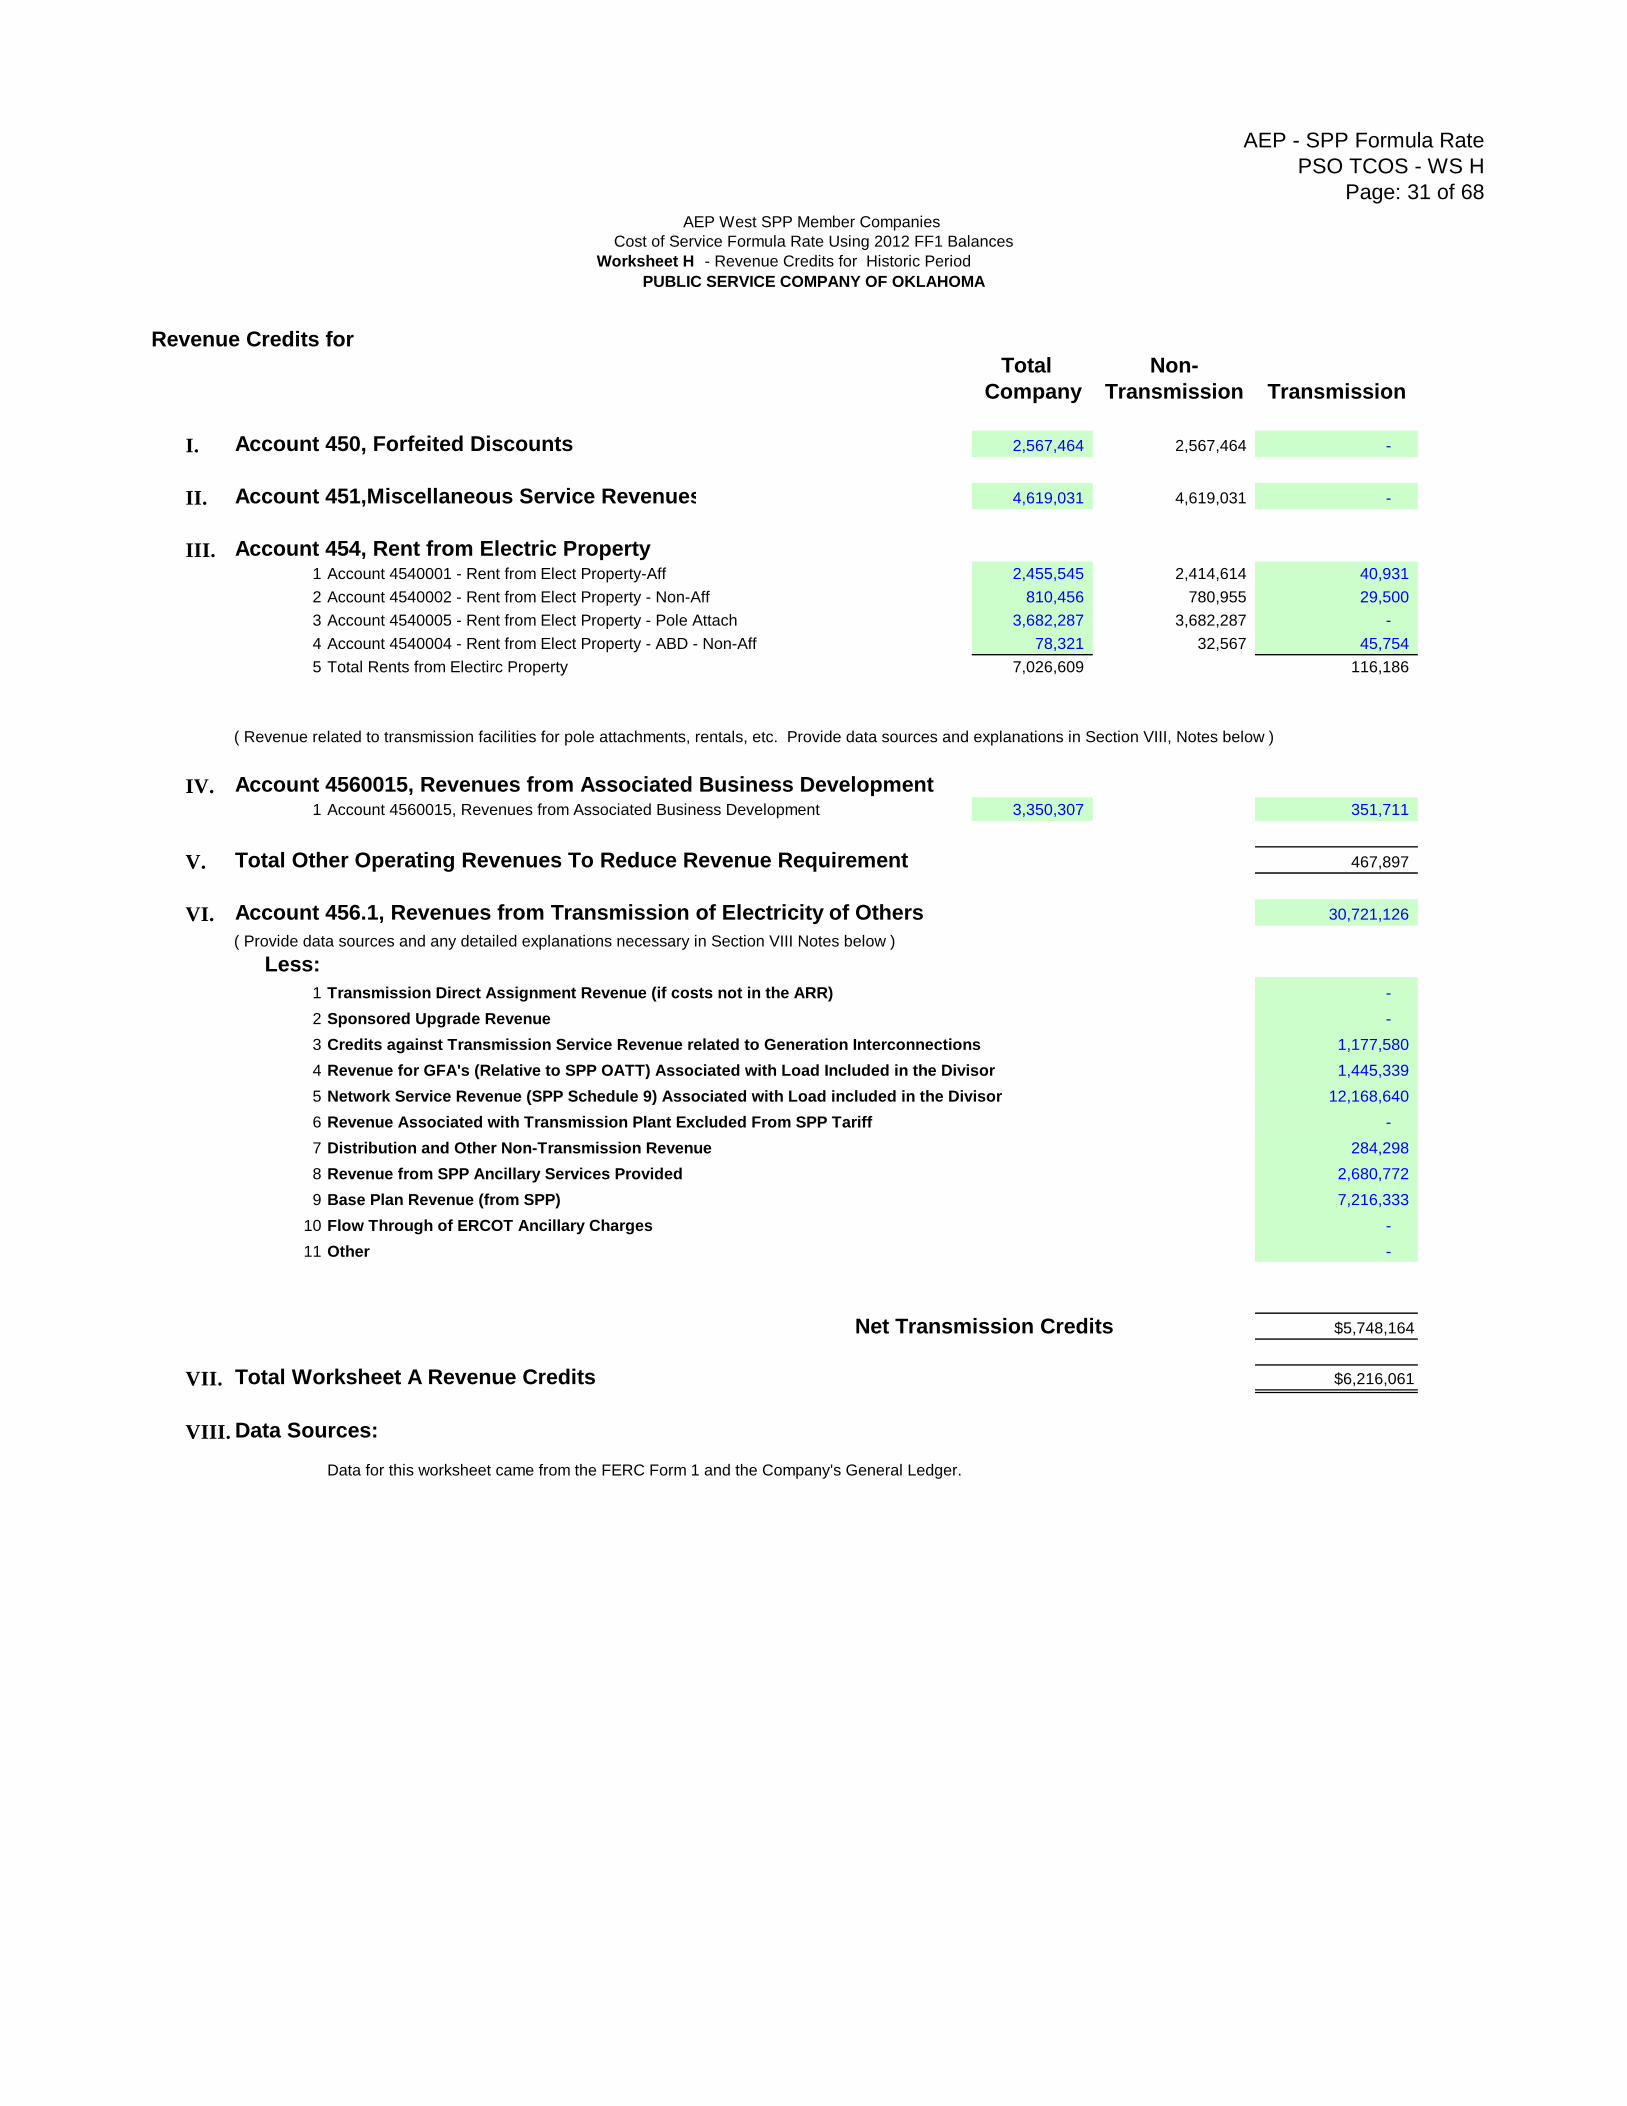
AEP - SPP Formula Rate
PSO TCOS - WS H
Page: 31 of 68
Worksheet H - Revenue Credits for Historic Period
Revenue Credits for
Total Non-
Company Transmission Transmission
I. Account 450, Forfeited Discounts 2,567,464 2,567,464 -
II. Account 451,Miscellaneous Service Revenues 4,619,031 4,619,031 -
III. Account 454, Rent from Electric Property1 Account 4540001 - Rent from Elect Property-Aff 2,455,545 2,414,614 40,931
2 Account 4540002 - Rent from Elect Property - Non-Aff 810,456 780,955 29,500
3 Account 4540005 - Rent from Elect Property - Pole Attach 3,682,287 3,682,287 -
4 Account 4540004 - Rent from Elect Property - ABD - Non-Aff 78,321 32,567 45,754
5 Total Rents from Electirc Property 7,026,609 116,186
( Revenue related to transmission facilities for pole attachments, rentals, etc. Provide data sources and explanations in Section VIII, Notes below )
IV. Account 4560015, Revenues from Associated Business Development1 Account 4560015, Revenues from Associated Business Development 3,350,307 351,711
V. Total Other Operating Revenues To Reduce Revenue Requirement 467,897
VI. Account 456.1, Revenues from Transmission of Electricity of Others 30,721,126
( Provide data sources and any detailed explanations necessary in Section VIII Notes below )
Less:
1 Transmission Direct Assignment Revenue (if costs not in the ARR) -
2 Sponsored Upgrade Revenue -
3 Credits against Transmission Service Revenue related to Generation Interconnections 1,177,580
4 Revenue for GFA's (Relative to SPP OATT) Associated with Load Included in the Divisor 1,445,339
5 Network Service Revenue (SPP Schedule 9) Associated with Load included in the Divisor 12,168,640
6 Revenue Associated with Transmission Plant Excluded From SPP Tariff -
7 Distribution and Other Non-Transmission Revenue 284,298
8 Revenue from SPP Ancillary Services Provided 2,680,772
9 Base Plan Revenue (from SPP) 7,216,333
10 Flow Through of ERCOT Ancillary Charges -
11 Other -
Net Transmission Credits $5,748,164
VII. Total Worksheet A Revenue Credits $6,216,061
VIII. Data Sources:
Data for this worksheet came from the FERC Form 1 and the Company's General Ledger.
AEP West SPP Member Companies
Cost of Service Formula Rate Using 2012 FF1 Balances
PUBLIC SERVICE COMPANY OF OKLAHOMA
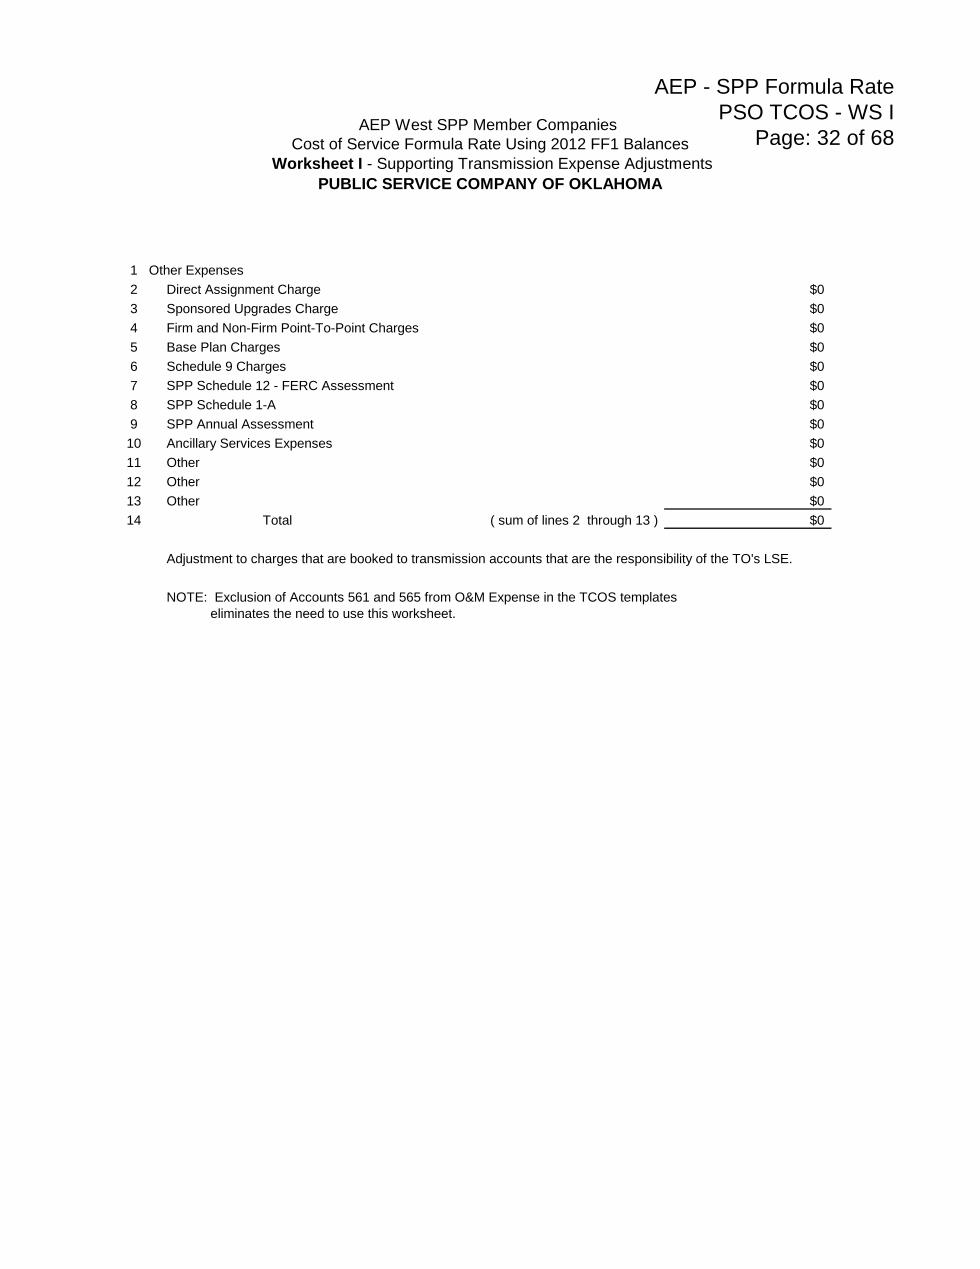
AEP - SPP Formula Rate
PSO TCOS - WS I
Page: 32 of 68
1 Other Expenses
2 Direct Assignment Charge $0
3 Sponsored Upgrades Charge $0
4 Firm and Non-Firm Point-To-Point Charges $0
5 Base Plan Charges $0
6 Schedule 9 Charges $0
7 SPP Schedule 12 - FERC Assessment $0
8 SPP Schedule 1-A $0
9 SPP Annual Assessment $0
10 Ancillary Services Expenses $0
11 Other $0
12 Other $0
13 Other $0
14 Total ( sum of lines 2 through 13 ) $0
Adjustment to charges that are booked to transmission accounts that are the responsibility of the TO's LSE.
NOTE: Exclusion of Accounts 561 and 565 from O&M Expense in the TCOS templates
eliminates the need to use this worksheet.
AEP West SPP Member Companies
Cost of Service Formula Rate Using 2012 FF1 Balances
Worksheet I - Supporting Transmission Expense Adjustments
PUBLIC SERVICE COMPANY OF OKLAHOMA
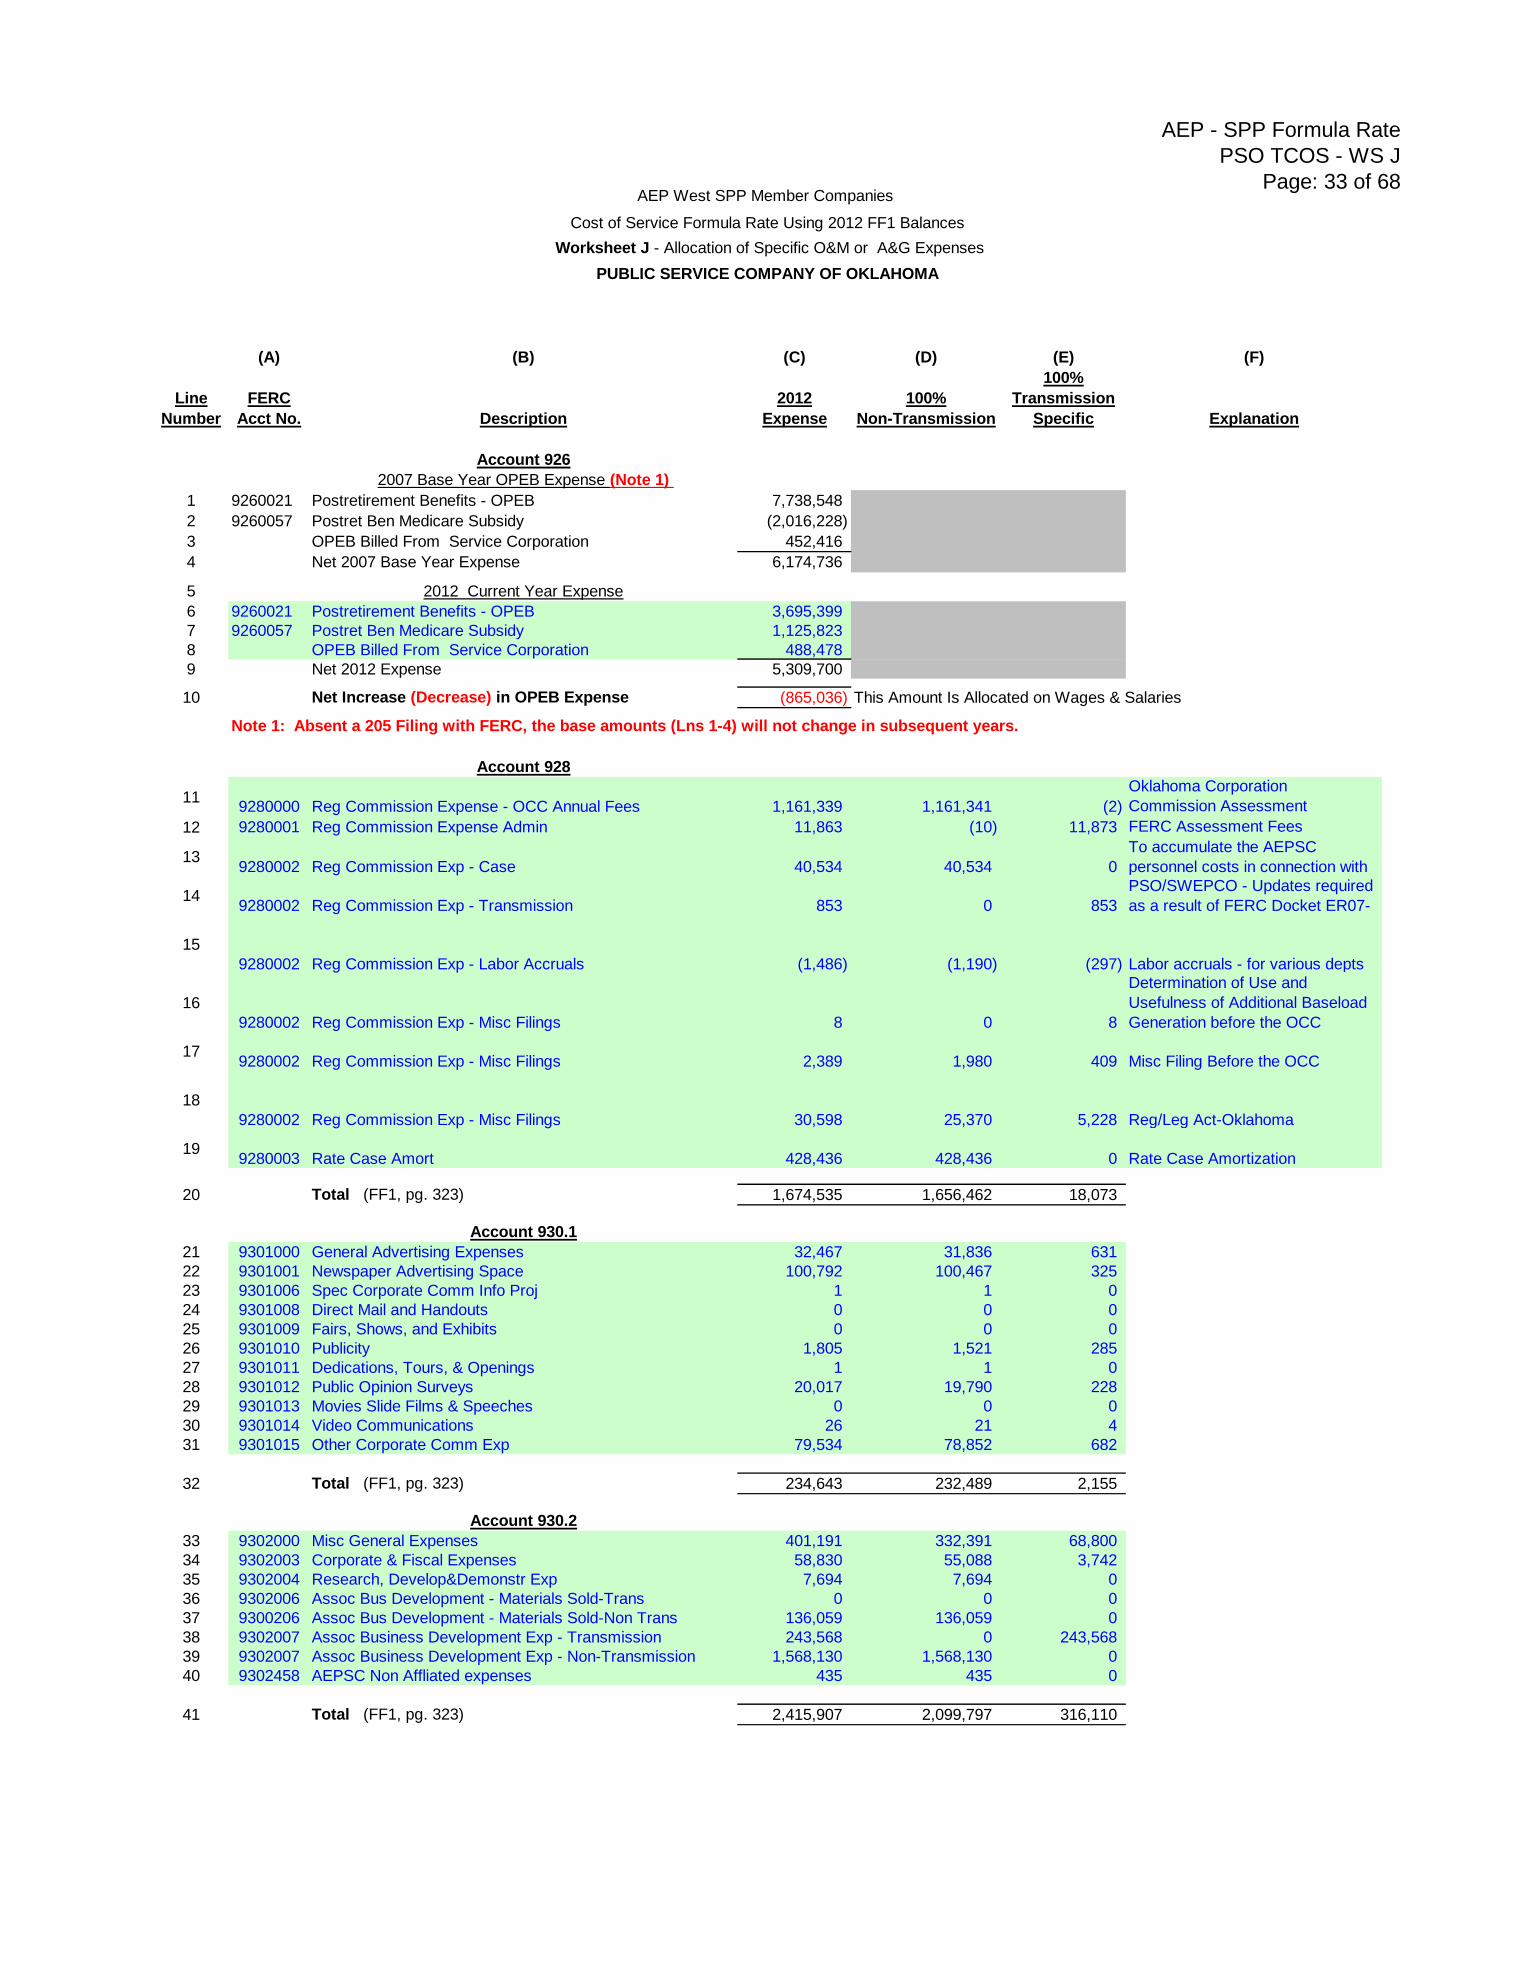
AEP - SPP Formula Rate
PSO TCOS - WS J
Page: 33 of 68
(A) (B) (C) (D) (E) (F)
100%
Line FERC 2012 100% Transmission
Number Acct No. Description Expense Non-Transmission Specific Explanation
Account 926
2007 Base Year OPEB Expense (Note 1)
1 9260021 Postretirement Benefits - OPEB 7,738,548
2 9260057 Postret Ben Medicare Subsidy (2,016,228)
3 OPEB Billed From Service Corporation 452,416
4 Net 2007 Base Year Expense 6,174,736
5 2012 Current Year Expense
6 9260021 Postretirement Benefits - OPEB 3,695,399
7 9260057 Postret Ben Medicare Subsidy 1,125,823
8 OPEB Billed From Service Corporation 488,478
9 Net 2012 Expense 5,309,700
10 Net Increase (Decrease) in OPEB Expense (865,036) This Amount Is Allocated on Wages & Salaries
Note 1: Absent a 205 Filing with FERC, the base amounts (Lns 1-4) will not change in subsequent years.
Account 928
119280000 Reg Commission Expense - OCC Annual Fees 1,161,339 1,161,341 (2)
Oklahoma Corporation
Commission Assessment
12 9280001 Reg Commission Expense Admin 11,863 (10) 11,873 FERC Assessment Fees
139280002 Reg Commission Exp - Case 40,534 40,534 0
To accumulate the AEPSC
personnel costs in connection with
149280002 Reg Commission Exp - Transmission 853 0 853
PSO/SWEPCO - Updates required
as a result of FERC Docket ER07-
15
9280002 Reg Commission Exp - Labor Accruals (1,486) (1,190) (297) Labor accruals - for various depts
16
9280002 Reg Commission Exp - Misc Filings 8 0 8
Determination of Use and
Usefulness of Additional Baseload
Generation before the OCC
179280002 Reg Commission Exp - Misc Filings 2,389 1,980 409 Misc Filing Before the OCC
18
9280002 Reg Commission Exp - Misc Filings 30,598 25,370 5,228 Reg/Leg Act-Oklahoma
199280003 Rate Case Amort 428,436 428,436 0 Rate Case Amortization
20 Total (FF1, pg. 323) 1,674,535 1,656,462 18,073
Account 930.1
21 9301000 General Advertising Expenses 32,467 31,836 631
22 9301001 Newspaper Advertising Space 100,792 100,467 325
23 9301006 Spec Corporate Comm Info Proj 1 1 0
24 9301008 Direct Mail and Handouts 0 0 0
25 9301009 Fairs, Shows, and Exhibits 0 0 0
26 9301010 Publicity 1,805 1,521 285
27 9301011 Dedications, Tours, & Openings 1 1 0
28 9301012 Public Opinion Surveys 20,017 19,790 228
29 9301013 Movies Slide Films & Speeches 0 0 0
30 9301014 Video Communications 26 21 4
31 9301015 Other Corporate Comm Exp 79,534 78,852 682
32 Total (FF1, pg. 323) 234,643 232,489 2,155
Account 930.2
33 9302000 Misc General Expenses 401,191 332,391 68,800
34 9302003 Corporate & Fiscal Expenses 58,830 55,088 3,742
35 9302004 Research, Develop&Demonstr Exp 7,694 7,694 0
36 9302006 Assoc Bus Development - Materials Sold-Trans 0 0 0
37 9300206 Assoc Bus Development - Materials Sold-Non Trans 136,059 136,059 0
38 9302007 Assoc Business Development Exp - Transmission 243,568 0 243,568
39 9302007 Assoc Business Development Exp - Non-Transmission 1,568,130 1,568,130 0
40 9302458 AEPSC Non Affliated expenses 435 435 0
41 Total (FF1, pg. 323) 2,415,907 2,099,797 316,110
AEP West SPP Member Companies
Cost of Service Formula Rate Using 2012 FF1 Balances
Worksheet J - Allocation of Specific O&M or A&G Expenses
PUBLIC SERVICE COMPANY OF OKLAHOMA
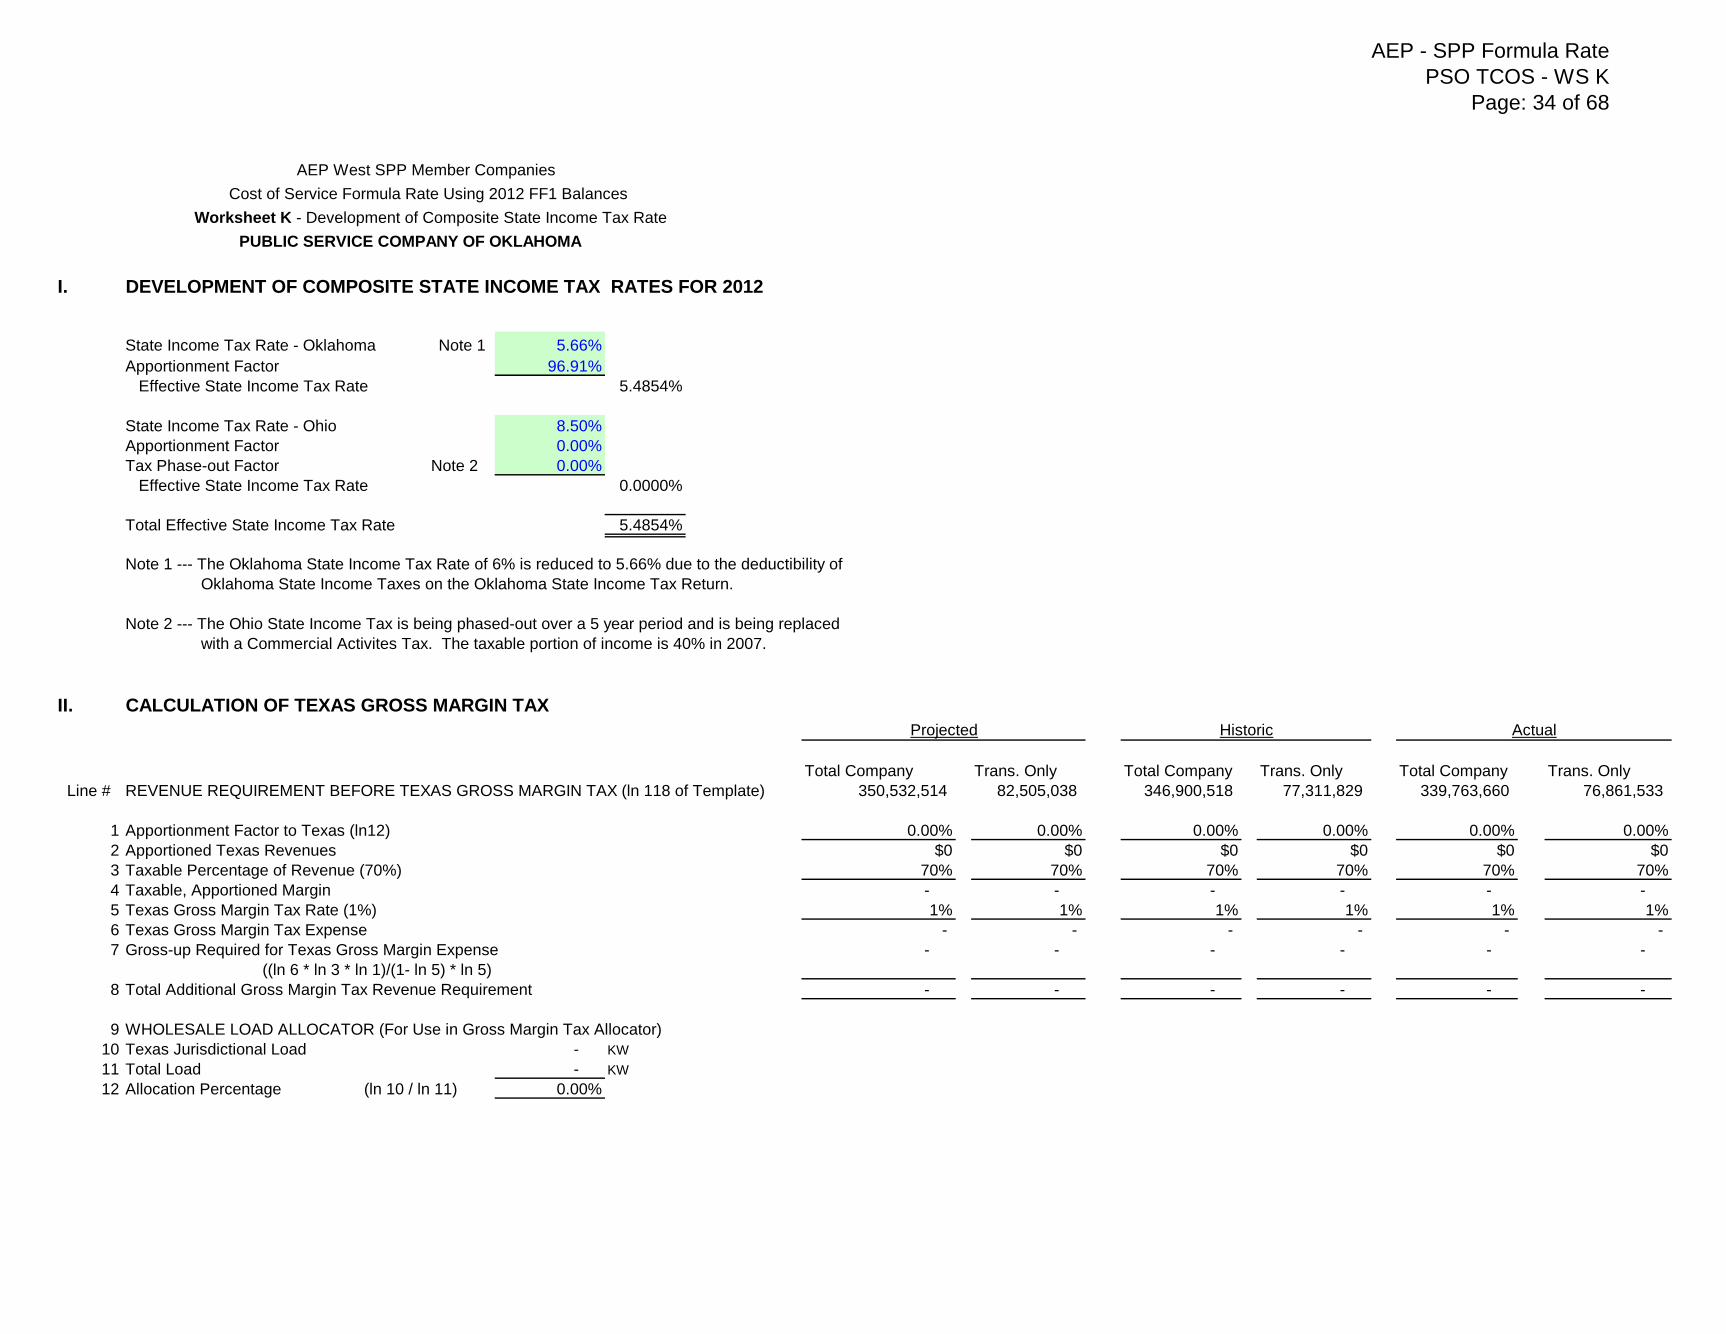
AEP - SPP Formula Rate
PSO TCOS - WS K
Page: 34 of 68
I. DEVELOPMENT OF COMPOSITE STATE INCOME TAX RATES FOR 2012
State Income Tax Rate - Oklahoma Note 1 5.66%
Apportionment Factor 96.91%
Effective State Income Tax Rate 5.4854%
State Income Tax Rate - Ohio 8.50%
Apportionment Factor 0.00%
Tax Phase-out Factor Note 2 0.00%
Effective State Income Tax Rate 0.0000%
Total Effective State Income Tax Rate 5.4854%
Note 1 --- The Oklahoma State Income Tax Rate of 6% is reduced to 5.66% due to the deductibility of
Oklahoma State Income Taxes on the Oklahoma State Income Tax Return.
Note 2 --- The Ohio State Income Tax is being phased-out over a 5 year period and is being replaced
with a Commercial Activites Tax. The taxable portion of income is 40% in 2007.
II. CALCULATION OF TEXAS GROSS MARGIN TAX
Total Company Trans. Only Total Company Trans. Only Total Company Trans. Only
Line # REVENUE REQUIREMENT BEFORE TEXAS GROSS MARGIN TAX (ln 118 of Template) 350,532,514 82,505,038 346,900,518 77,311,829 339,763,660 76,861,533
1 Apportionment Factor to Texas (ln12) 0.00% 0.00% 0.00% 0.00% 0.00% 0.00%
2 Apportioned Texas Revenues $0 $0 $0 $0 $0 $0
3 Taxable Percentage of Revenue (70%) 70% 70% 70% 70% 70% 70%
4 Taxable, Apportioned Margin - - - - - -
5 Texas Gross Margin Tax Rate (1%) 1% 1% 1% 1% 1% 1%
6 Texas Gross Margin Tax Expense - - - - - -
7 Gross-up Required for Texas Gross Margin Expense - - - - - -
((ln 6 * ln 3 * ln 1)/(1- ln 5) * ln 5)
8 Total Additional Gross Margin Tax Revenue Requirement - - - - - -
9 WHOLESALE LOAD ALLOCATOR (For Use in Gross Margin Tax Allocator)
10 Texas Jurisdictional Load - KW
11 Total Load - KW
12 Allocation Percentage (ln 10 / ln 11) 0.00%
ActualProjected
AEP West SPP Member Companies
Cost of Service Formula Rate Using 2012 FF1 Balances
Worksheet K - Development of Composite State Income Tax Rate
PUBLIC SERVICE COMPANY OF OKLAHOMA
Historic
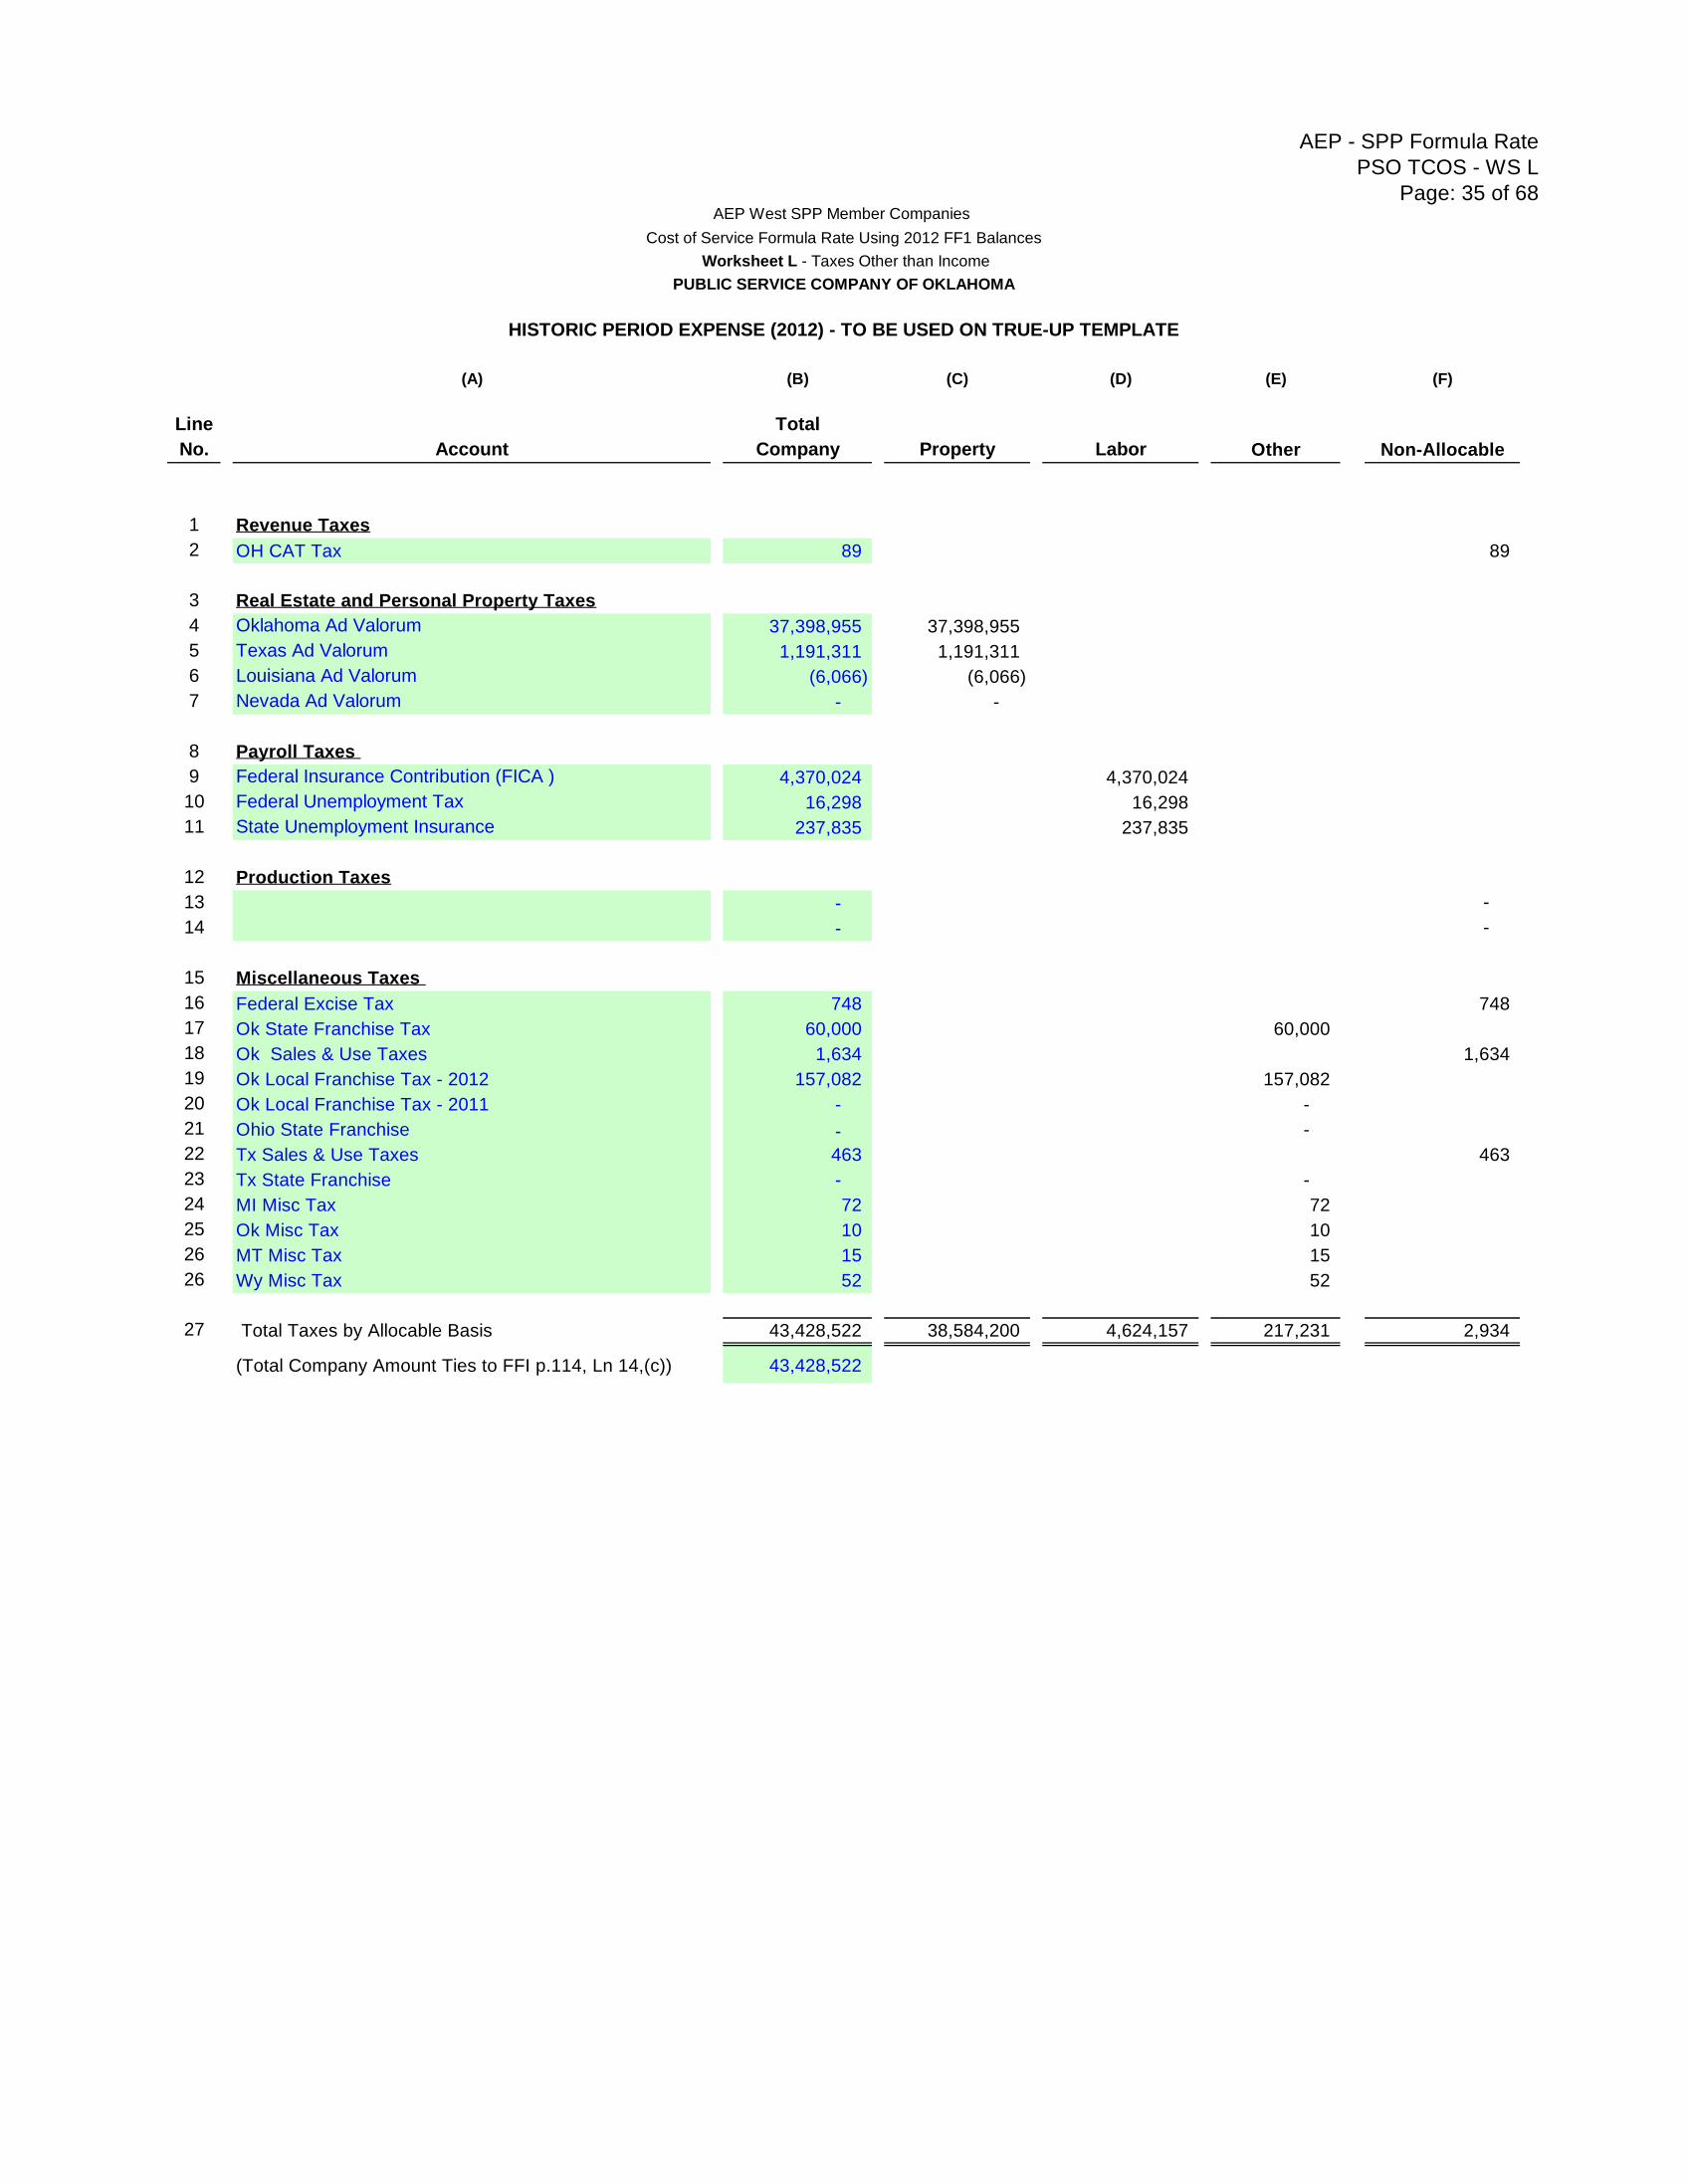
AEP - SPP Formula Rate
PSO TCOS - WS L
Page: 35 of 68
(A) (B) (C) (D) (E) (F)
Line Total
No. Account Company Property Labor Other Non-Allocable
1 Revenue Taxes
2 OH CAT Tax 89 89
3 Real Estate and Personal Property Taxes
4 Oklahoma Ad Valorum 37,398,955 37,398,955
5 Texas Ad Valorum 1,191,311 1,191,311
6 Louisiana Ad Valorum (6,066) (6,066)
7 Nevada Ad Valorum - -
8 Payroll Taxes
9 Federal Insurance Contribution (FICA ) 4,370,024 4,370,024
10 Federal Unemployment Tax 16,298 16,298
11 State Unemployment Insurance 237,835 237,835
12 Production Taxes
13 - -
14 - -
15 Miscellaneous Taxes
16 Federal Excise Tax 748 748
17 Ok State Franchise Tax 60,000 60,000
18 Ok Sales & Use Taxes 1,634 1,634
19 Ok Local Franchise Tax - 2012 157,082 157,082
20 Ok Local Franchise Tax - 2011 - -
21 Ohio State Franchise - -
22 Tx Sales & Use Taxes 463 463
23 Tx State Franchise - -
24 MI Misc Tax 72 72
25 Ok Misc Tax 10 10
26 MT Misc Tax 15 15
26 Wy Misc Tax 52 52
27 Total Taxes by Allocable Basis 43,428,522 38,584,200 4,624,157 217,231 2,934
(Total Company Amount Ties to FFI p.114, Ln 14,(c)) 43,428,522
HISTORIC PERIOD EXPENSE (2012) - TO BE USED ON TRUE-UP TEMPLATE
AEP West SPP Member Companies
Cost of Service Formula Rate Using 2012 FF1 Balances
Worksheet L - Taxes Other than Income
PUBLIC SERVICE COMPANY OF OKLAHOMA
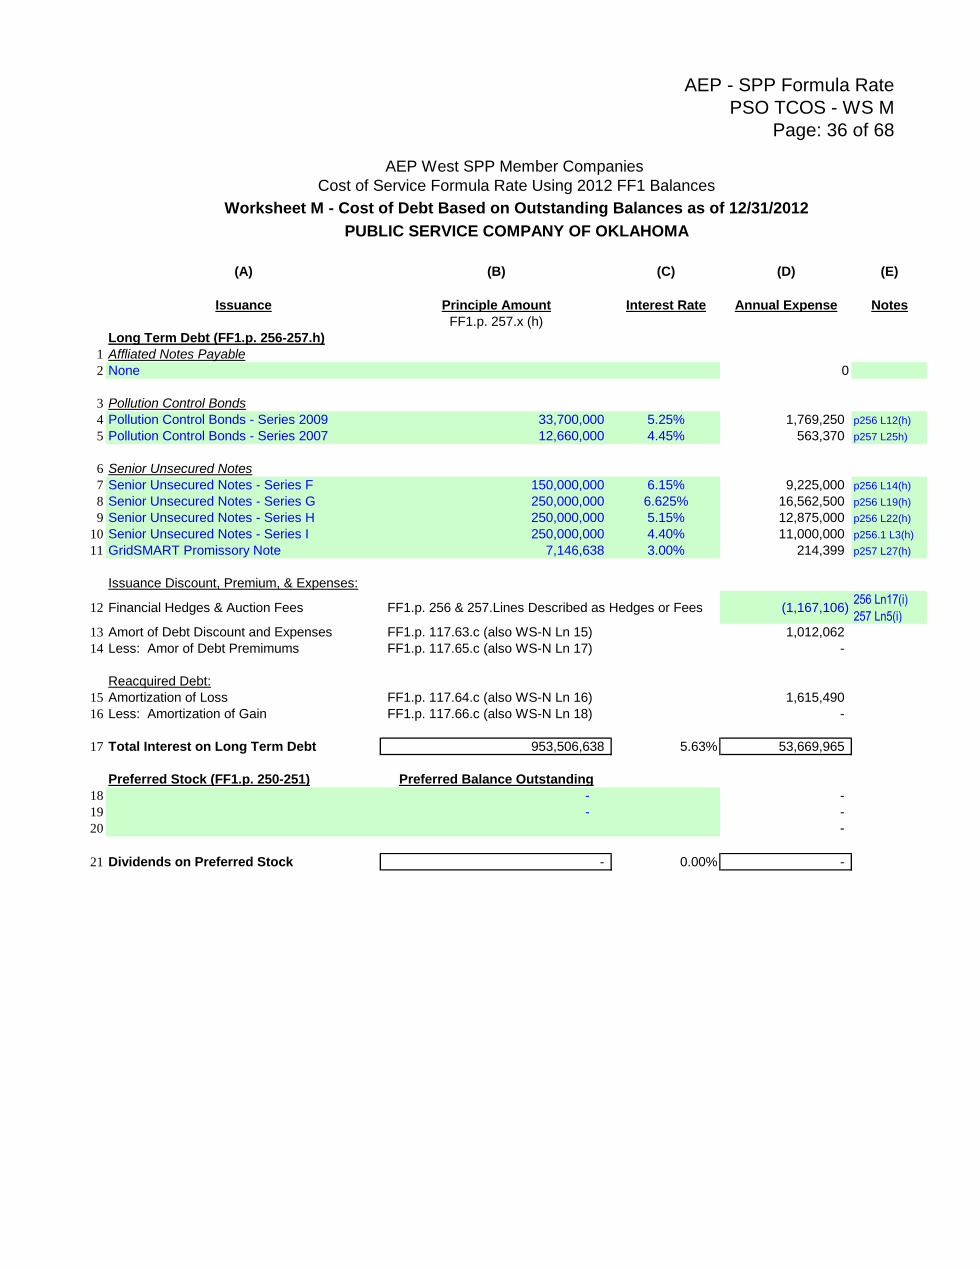
AEP - SPP Formula Rate
PSO TCOS - WS M
Page: 36 of 68
(A) (B) (C) (D) (E)
Issuance Principle Amount Interest Rate Annual Expense Notes
FF1.p. 257.x (h)
Long Term Debt (FF1.p. 256-257.h)
1 Affliated Notes Payable
2 None 0
3 Pollution Control Bonds
4 Pollution Control Bonds - Series 2009 33,700,000 5.25% 1,769,250 p256 L12(h)
5 Pollution Control Bonds - Series 2007 12,660,000 4.45% 563,370 p257 L25h)
6 Senior Unsecured Notes
7 Senior Unsecured Notes - Series F 150,000,000 6.15% 9,225,000 p256 L14(h)
8 Senior Unsecured Notes - Series G 250,000,000 6.625% 16,562,500 p256 L19(h)
9 Senior Unsecured Notes - Series H 250,000,000 5.15% 12,875,000 p256 L22(h)
10 Senior Unsecured Notes - Series I 250,000,000 4.40% 11,000,000 p256.1 L3(h)
11 GridSMART Promissory Note 7,146,638 3.00% 214,399 p257 L27(h)
Issuance Discount, Premium, & Expenses:
12 Financial Hedges & Auction Fees FF1.p. 256 & 257.Lines Described as Hedges or Fees (1,167,106) 256 Ln17(i)
257 Ln5(i)
13 Amort of Debt Discount and Expenses FF1.p. 117.63.c (also WS-N Ln 15) 1,012,062
14 Less: Amor of Debt Premimums FF1.p. 117.65.c (also WS-N Ln 17) -
Reacquired Debt:
15 Amortization of Loss FF1.p. 117.64.c (also WS-N Ln 16) 1,615,490
16 Less: Amortization of Gain FF1.p. 117.66.c (also WS-N Ln 18) -
17 Total Interest on Long Term Debt 953,506,638 5.63% 53,669,965
Preferred Stock (FF1.p. 250-251) Preferred Balance Outstanding
18 - -
19 - -
20 -
21 Dividends on Preferred Stock - 0.00% -
PUBLIC SERVICE COMPANY OF OKLAHOMA
AEP West SPP Member Companies
Cost of Service Formula Rate Using 2012 FF1 Balances
Worksheet M - Cost of Debt Based on Outstanding Balances as of 12/31/2012
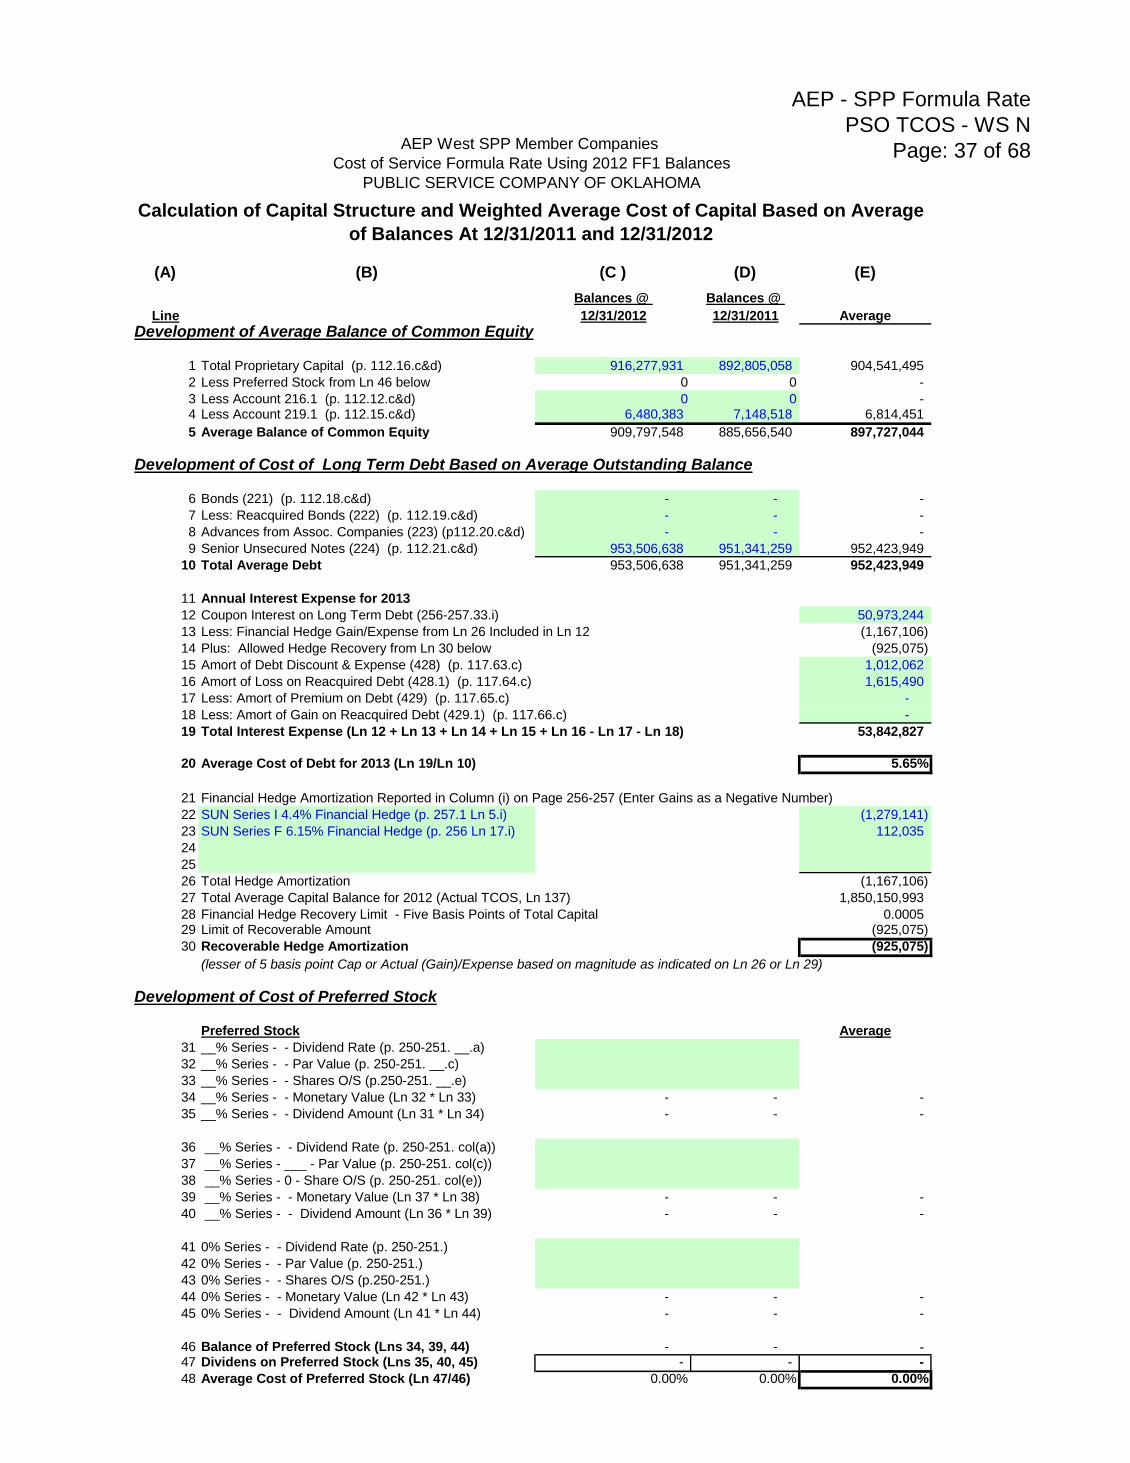
AEP - SPP Formula Rate
PSO TCOS - WS N
Page: 37 of 68
(A) (B) (C ) (D) (E)
Balances @ Balances @
Line 12/31/2012 12/31/2011 Average
Development of Average Balance of Common Equity
1 Total Proprietary Capital (p. 112.16.c&d) 916,277,931 892,805,058 904,541,495
2 Less Preferred Stock from Ln 46 below 0 0 -
3 Less Account 216.1 (p. 112.12.c&d) 0 0 - 4 Less Account 219.1 (p. 112.15.c&d) 6,480,383 7,148,518 6,814,451
5 Average Balance of Common Equity 909,797,548 885,656,540 897,727,044
Development of Cost of Long Term Debt Based on Average Outstanding Balance
6 Bonds (221) (p. 112.18.c&d) - - -
7 Less: Reacquired Bonds (222) (p. 112.19.c&d) - - -
8 Advances from Assoc. Companies (223) (p112.20.c&d) - - -
9 Senior Unsecured Notes (224) (p. 112.21.c&d) 953,506,638 951,341,259 952,423,949
10 Total Average Debt 953,506,638 951,341,259 952,423,949
11 Annual Interest Expense for 2013
12 Coupon Interest on Long Term Debt (256-257.33.i) 50,973,244
13 Less: Financial Hedge Gain/Expense from Ln 26 Included in Ln 12 (1,167,106)
14 Plus: Allowed Hedge Recovery from Ln 30 below (925,075)
15 Amort of Debt Discount & Expense (428) (p. 117.63.c) 1,012,062
16 Amort of Loss on Reacquired Debt (428.1) (p. 117.64.c) 1,615,490
17 Less: Amort of Premium on Debt (429) (p. 117.65.c) -
18 Less: Amort of Gain on Reacquired Debt (429.1) (p. 117.66.c) -
19 Total Interest Expense (Ln 12 + Ln 13 + Ln 14 + Ln 15 + Ln 16 - Ln 17 - Ln 18) 53,842,827
20 Average Cost of Debt for 2013 (Ln 19/Ln 10) 5.65%
21 Financial Hedge Amortization Reported in Column (i) on Page 256-257 (Enter Gains as a Negative Number)
22 SUN Series I 4.4% Financial Hedge (p. 257.1 Ln 5.i) (1,279,141)
23 SUN Series F 6.15% Financial Hedge (p. 256 Ln 17.i) 112,035
24
25
26 Total Hedge Amortization (1,167,106)
27 Total Average Capital Balance for 2012 (Actual TCOS, Ln 137) 1,850,150,993
28 Financial Hedge Recovery Limit - Five Basis Points of Total Capital 0.0005 29 Limit of Recoverable Amount (925,075)
30 Recoverable Hedge Amortization (925,075)
(lesser of 5 basis point Cap or Actual (Gain)/Expense based on magnitude as indicated on Ln 26 or Ln 29)
Development of Cost of Preferred Stock
Preferred Stock Average
31 __% Series - - Dividend Rate (p. 250-251. __.a)
32 __% Series - - Par Value (p. 250-251. __.c)
33 __% Series - - Shares O/S (p.250-251. __.e)
34 __% Series - - Monetary Value (Ln 32 * Ln 33) - - -
35 __% Series - - Dividend Amount (Ln 31 * Ln 34) - - -
36 __% Series - - Dividend Rate (p. 250-251. col(a))
37 __% Series - ___ - Par Value (p. 250-251. col(c))
38 __% Series - 0 - Share O/S (p. 250-251. col(e))
39 __% Series - - Monetary Value (Ln 37 * Ln 38) - - -
40 __% Series - - Dividend Amount (Ln 36 * Ln 39) - - -
41 0% Series - - Dividend Rate (p. 250-251.)
42 0% Series - - Par Value (p. 250-251.)
43 0% Series - - Shares O/S (p.250-251.)
44 0% Series - - Monetary Value (Ln 42 * Ln 43) - - -
45 0% Series - - Dividend Amount (Ln 41 * Ln 44) - - -
46 Balance of Preferred Stock (Lns 34, 39, 44) - - -
47 Dividens on Preferred Stock (Lns 35, 40, 45) - - -
48 Average Cost of Preferred Stock (Ln 47/46) 0.00% 0.00% 0.00%
Calculation of Capital Structure and Weighted Average Cost of Capital Based on Average
of Balances At 12/31/2011 and 12/31/2012
AEP West SPP Member Companies
Cost of Service Formula Rate Using 2012 FF1 Balances
PUBLIC SERVICE COMPANY OF OKLAHOMA

AEP - SPP Formula Rate
SWEPCO TCOS - Projected
Page: 38 of 68
AEP West SPP Member Companies
2013 Transmission Cost of Service Formula Rate
Utilizing Historic Cost Data for 2012 and Projected Net Plant at Year-End 2013
SOUTHWESTERN ELECTRIC POWER COMPANY
Line Transmission
No. Amount
1 REVENUE REQUIREMENT (w/o incentives) (ln 120) $129,004,406
Total Allocator
2 REVENUE CREDITS (Note A)
3 Transmission Credits (Worksheet H) 9,427,721 DA 1.00000 9,427,721$
4 Assoc. Business Development (Worksheet H) 118,729 DA 1.00000 118,729$
5 Total Revenue Credits 9,546,450 9,546,450$
6 REVENUE REQUIREMENT For All Company Facilities (ln 1 less ln 5) $119,457,956
7 33,398,332 DA 1.00000 33,398,332$
8 NET PLANT CARRYING CHARGE (w/o incentives) (Note B)
9 Annual Rate (ln 1/ (Sum of lns 46, 47, 48, 49, 51)) x 100% 17.16%
10 Monthly Rate (ln 9 / 12) 1.43%
11 NET PLANT CARRYING CHARGE ON LINE 9 , W/O DEPRECIATION (w/o incentives) (Note B)
12 Annual Rate ((ln 1 - ln 95) / (Sum of lns 46, 47, 48, 49, 51)) x 100% 14.00%
13 NET PLANT CARRYING CHARGE ON LINE 11, W/O INCOME TAXES, RETURN (Note B)
14 Annual Rate ((ln 1 - ln 95 - ln 117 - ln 118) / (Sum of lns 46, 47, 48, 49, 51)) x 100% 3.99%
15 ADDITIONAL REVENUE REQUIREMENT for projects w/ incentive ROE's (Note C) (Worksheet F) -
MEMO: The Carrying Charge Calculations on lines 9 to 14 below is used in calculating project revenue requirements billed on SPP Schedule 11. The total non-incentive revenue
requirements for these projects shown on line 7 is included in the total on line 6.
Revenue Requirement for SPP BPU Regional Facilities (w/o incentives) (Worksheet F)
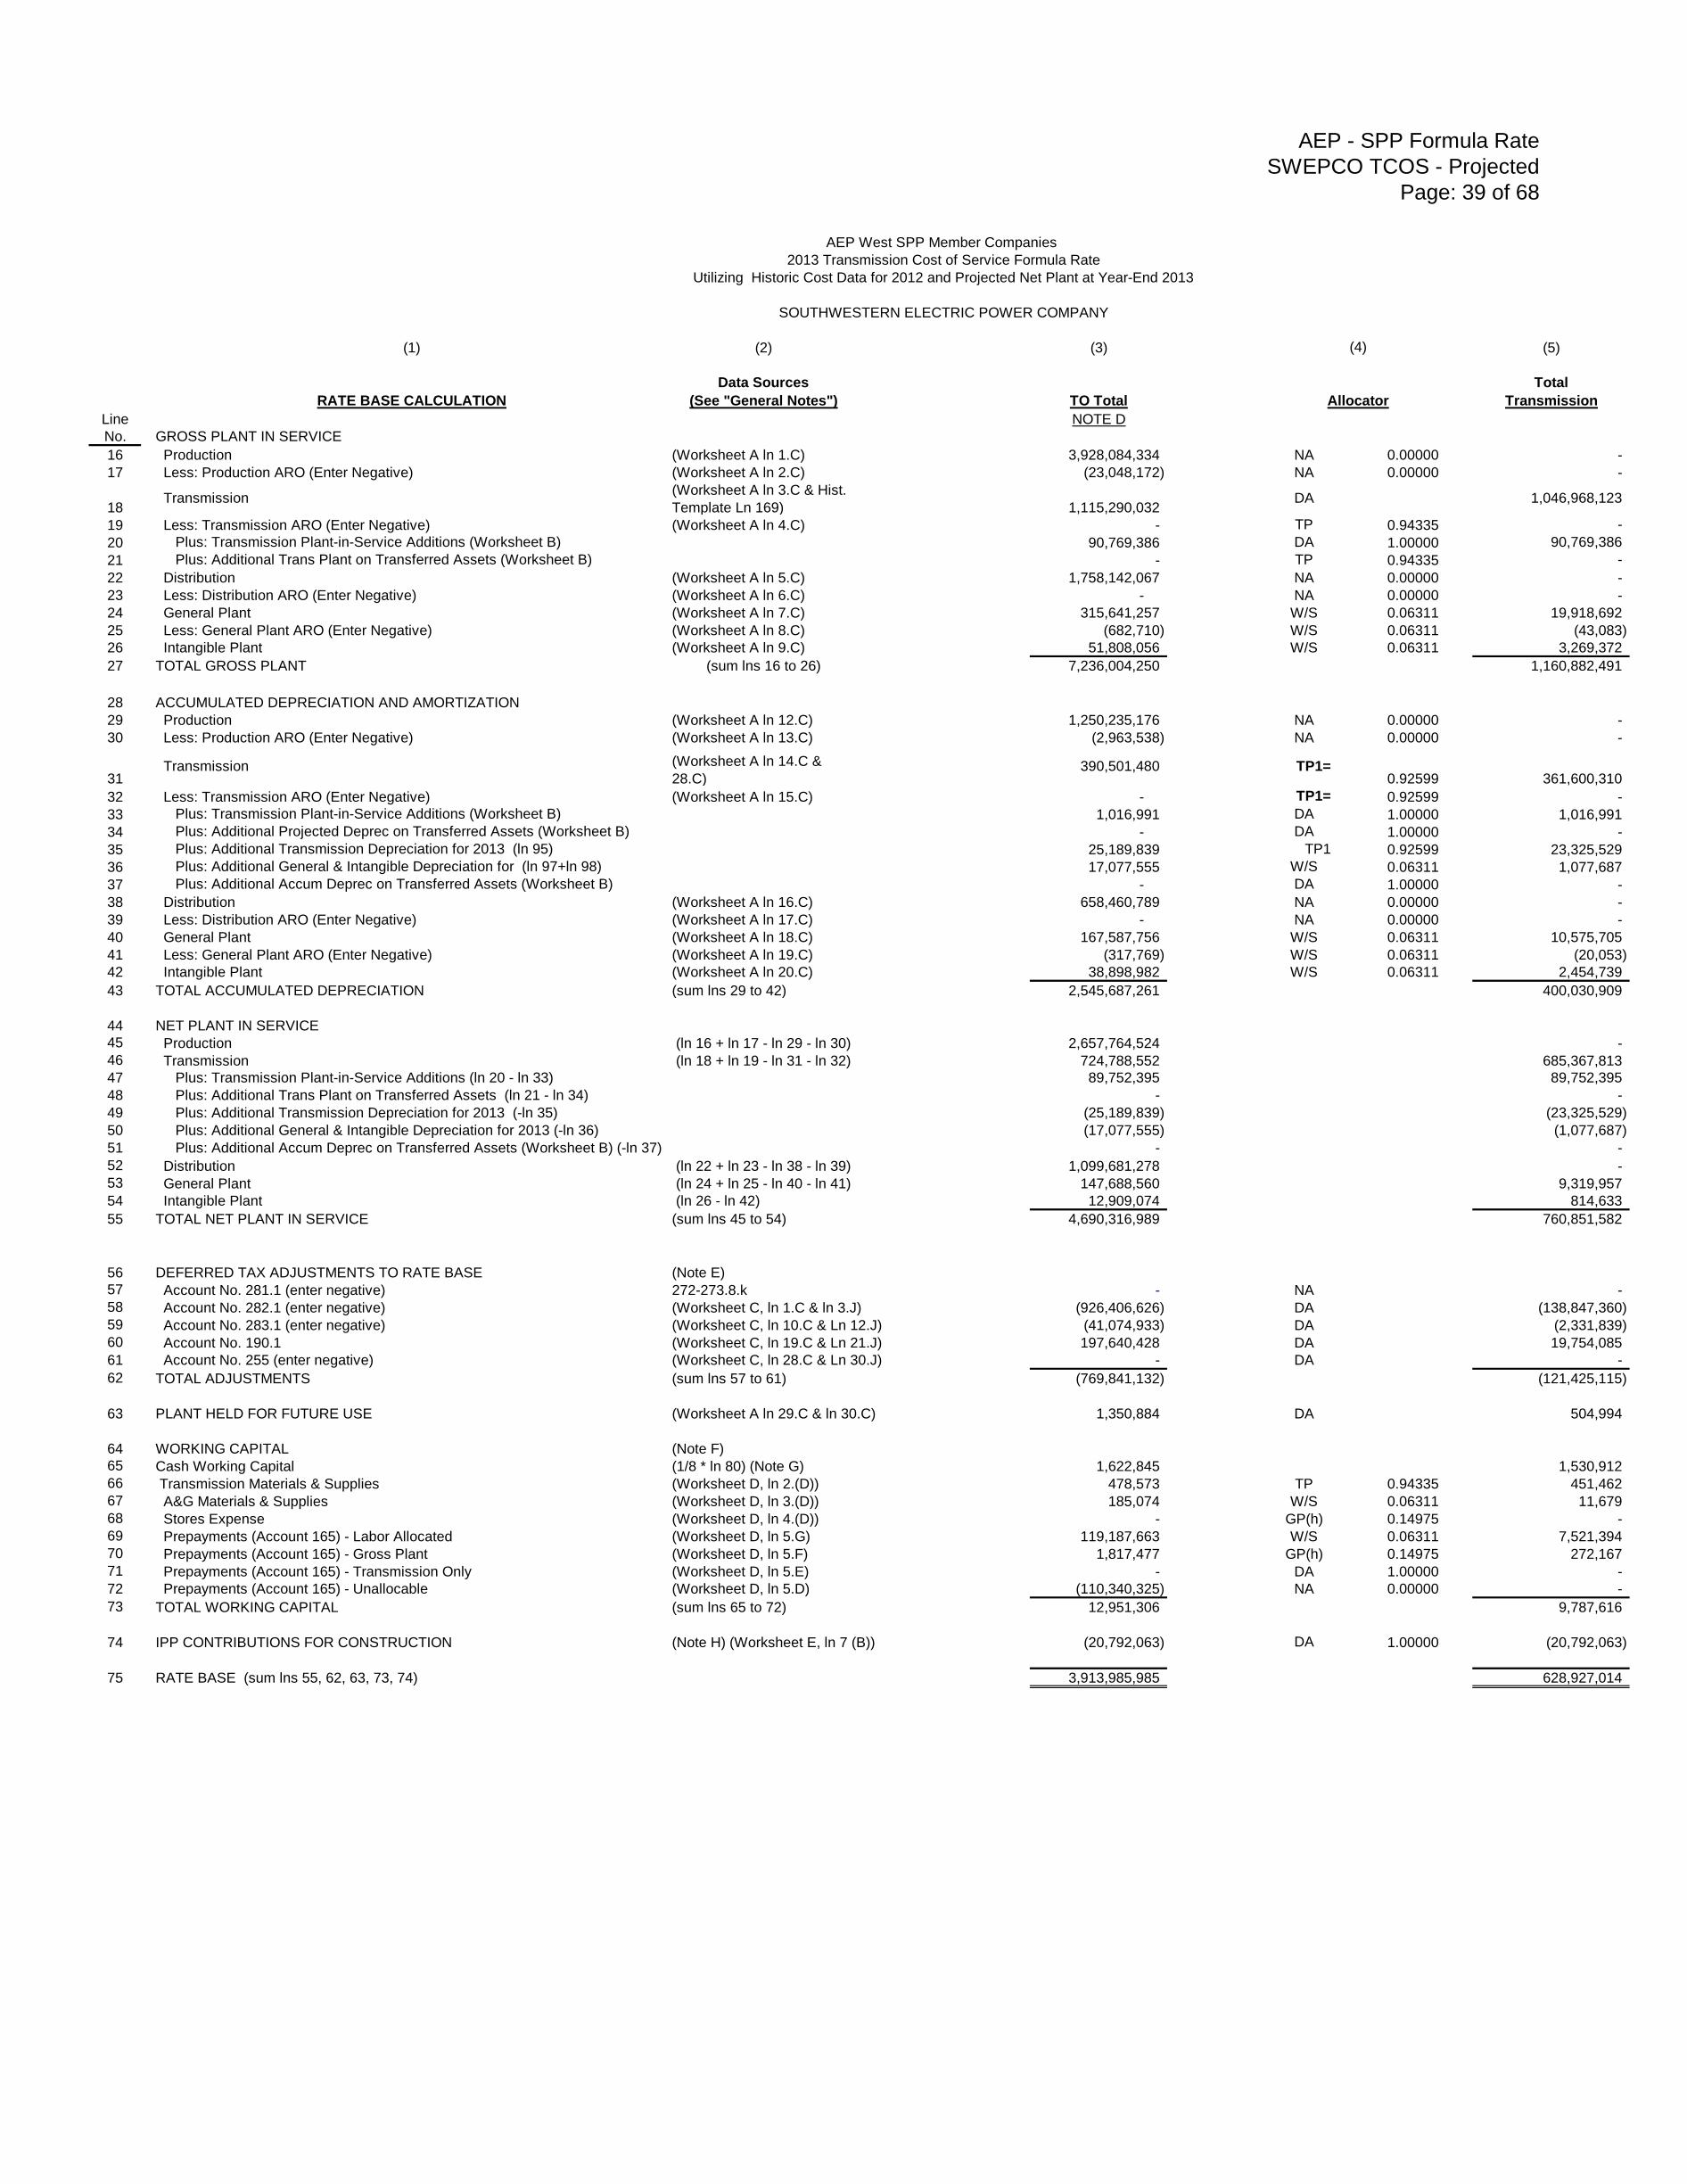
AEP - SPP Formula Rate
SWEPCO TCOS - Projected
Page: 39 of 68
AEP West SPP Member Companies
2013 Transmission Cost of Service Formula Rate
Utilizing Historic Cost Data for 2012 and Projected Net Plant at Year-End 2013
SOUTHWESTERN ELECTRIC POWER COMPANY
(1) (2) (3) (5)
Data Sources Total
RATE BASE CALCULATION (See "General Notes") TO Total Transmission
Line NOTE D
No. GROSS PLANT IN SERVICE
16 Production (Worksheet A ln 1.C) 3,928,084,334 NA 0.00000 -
17 Less: Production ARO (Enter Negative) (Worksheet A ln 2.C) (23,048,172) NA 0.00000 -
18 Transmission
(Worksheet A ln 3.C & Hist.
Template Ln 169) 1,115,290,032 DA 1,046,968,123
19 Less: Transmission ARO (Enter Negative) (Worksheet A ln 4.C) - TP 0.94335 -
20 Plus: Transmission Plant-in-Service Additions (Worksheet B) 90,769,386 DA 1.00000 90,769,386
21 Plus: Additional Trans Plant on Transferred Assets (Worksheet B) - TP 0.94335 -
22 Distribution (Worksheet A ln 5.C) 1,758,142,067 NA 0.00000 -
23 Less: Distribution ARO (Enter Negative) (Worksheet A ln 6.C) - NA 0.00000 -
24 General Plant (Worksheet A ln 7.C) 315,641,257 W/S 0.06311 19,918,692
25 Less: General Plant ARO (Enter Negative) (Worksheet A ln 8.C) (682,710) W/S 0.06311 (43,083)
26 Intangible Plant (Worksheet A ln 9.C) 51,808,056 W/S 0.06311 3,269,372
27 TOTAL GROSS PLANT (sum lns 16 to 26) 7,236,004,250 1,160,882,491
28 ACCUMULATED DEPRECIATION AND AMORTIZATION
29 Production (Worksheet A ln 12.C) 1,250,235,176 NA 0.00000 -
30 Less: Production ARO (Enter Negative) (Worksheet A ln 13.C) (2,963,538) NA 0.00000 -
31 Transmission (Worksheet A ln 14.C &
28.C)390,501,480 TP1=
0.92599 361,600,310
32 Less: Transmission ARO (Enter Negative) (Worksheet A ln 15.C) - TP1= 0.92599 -
33 Plus: Transmission Plant-in-Service Additions (Worksheet B) 1,016,991 DA 1.00000 1,016,991
34 Plus: Additional Projected Deprec on Transferred Assets (Worksheet B) - DA 1.00000 -
35 Plus: Additional Transmission Depreciation for 2013 (ln 95) 25,189,839 TP1 0.92599 23,325,529
36 Plus: Additional General & Intangible Depreciation for (ln 97+ln 98) 17,077,555 W/S 0.06311 1,077,687
37 Plus: Additional Accum Deprec on Transferred Assets (Worksheet B) - DA 1.00000 -
38 Distribution (Worksheet A ln 16.C) 658,460,789 NA 0.00000 -
39 Less: Distribution ARO (Enter Negative) (Worksheet A ln 17.C) - NA 0.00000 -
40 General Plant (Worksheet A ln 18.C) 167,587,756 W/S 0.06311 10,575,705
41 Less: General Plant ARO (Enter Negative) (Worksheet A ln 19.C) (317,769) W/S 0.06311 (20,053)
42 Intangible Plant (Worksheet A ln 20.C) 38,898,982 W/S 0.06311 2,454,739
43 TOTAL ACCUMULATED DEPRECIATION (sum lns 29 to 42) 2,545,687,261 400,030,909
44 NET PLANT IN SERVICE
45 Production (ln 16 + ln 17 - ln 29 - ln 30) 2,657,764,524 -
46 Transmission (ln 18 + ln 19 - ln 31 - ln 32) 724,788,552 685,367,813
47 Plus: Transmission Plant-in-Service Additions (ln 20 - ln 33) 89,752,395 89,752,395
48 Plus: Additional Trans Plant on Transferred Assets (ln 21 - ln 34) - -
49 Plus: Additional Transmission Depreciation for 2013 (-ln 35) (25,189,839) (23,325,529)
50 Plus: Additional General & Intangible Depreciation for 2013 (-ln 36) (17,077,555) (1,077,687)
51 Plus: Additional Accum Deprec on Transferred Assets (Worksheet B) (-ln 37) - -
52 Distribution (ln 22 + ln 23 - ln 38 - ln 39) 1,099,681,278 -
53 General Plant (ln 24 + ln 25 - ln 40 - ln 41) 147,688,560 9,319,957
54 Intangible Plant (ln 26 - ln 42) 12,909,074 814,633
55 TOTAL NET PLANT IN SERVICE (sum lns 45 to 54) 4,690,316,989 760,851,582
56 DEFERRED TAX ADJUSTMENTS TO RATE BASE (Note E)
57 Account No. 281.1 (enter negative) 272-273.8.k - NA -
58 Account No. 282.1 (enter negative) (Worksheet C, ln 1.C & ln 3.J) (926,406,626) DA (138,847,360)
59 Account No. 283.1 (enter negative) (Worksheet C, ln 10.C & Ln 12.J) (41,074,933) DA (2,331,839)
60 Account No. 190.1 (Worksheet C, ln 19.C & Ln 21.J) 197,640,428 DA 19,754,085
61 Account No. 255 (enter negative) (Worksheet C, ln 28.C & Ln 30.J) - DA -
62 TOTAL ADJUSTMENTS (sum lns 57 to 61) (769,841,132) (121,425,115)
63 PLANT HELD FOR FUTURE USE (Worksheet A ln 29.C & ln 30.C) 1,350,884 DA 504,994
64 WORKING CAPITAL (Note F)
65 Cash Working Capital (1/8 * ln 80) (Note G) 1,622,845 1,530,912
66 Transmission Materials & Supplies (Worksheet D, ln 2.(D)) 478,573 TP 0.94335 451,462
67 A&G Materials & Supplies (Worksheet D, ln 3.(D)) 185,074 W/S 0.06311 11,679
68 Stores Expense (Worksheet D, ln 4.(D)) - GP(h) 0.14975 -
69 Prepayments (Account 165) - Labor Allocated (Worksheet D, ln 5.G) 119,187,663 W/S 0.06311 7,521,394
70 Prepayments (Account 165) - Gross Plant (Worksheet D, ln 5.F) 1,817,477 GP(h) 0.14975 272,167
71 Prepayments (Account 165) - Transmission Only (Worksheet D, ln 5.E) - DA 1.00000 -
72 Prepayments (Account 165) - Unallocable (Worksheet D, ln 5.D) (110,340,325) NA 0.00000 -
73 TOTAL WORKING CAPITAL (sum lns 65 to 72) 12,951,306 9,787,616
74 IPP CONTRIBUTIONS FOR CONSTRUCTION (Note H) (Worksheet E, ln 7 (B)) (20,792,063) DA 1.00000 (20,792,063)
75 RATE BASE (sum lns 55, 62, 63, 73, 74) 3,913,985,985 628,927,014
(4)
Allocator

AEP - SPP Formula Rate
SWEPCO TCOS - Projected
Page: 40 of 68
AEP West SPP Member Companies
2013 Transmission Cost of Service Formula Rate
Utilizing Historic Cost Data for 2012 and Projected Net Plant at Year-End 2013
SOUTHWESTERN ELECTRIC POWER COMPANY
(1) (2) (3) (5)
EXPENSE, TAXES, RETURN & REVENUE Data Sources Total
REQUIREMENTS CALCULATION (See "General Notes") TO Total Transmission
Line
No. OPERATION & MAINTENANCE EXPENSE
76 Transmission 321.112.b 44,970,358
77 Less: Total Account 561 (Note I) 321.84-92.b 11,280,135
78 Less: Account 565 (Note J) 321.96.b 20,707,467
79 Less: expenses 100% assigned to TO billed customers (Worksheet I, ln 14) $0
80 Total O&M Allocable to Transmission (lns 76 - 77 - 78 - 79) 12,982,756 TP 0.94335 12,247,297
81 Administrative and General 323.197.b (Note K) 70,056,050
82 Less: Acct. 924, Property Insurance 323.185.b 2,550,069
83 Acct. 928, Reg. Com. Exp. 323.189.b 3,205,062
84 Acct. 930.1, Gen. Advert. Exp. 323.191.b 206,363
85 Acct. 930.2, Misc. Gen. Exp. 323.192.b (2,195,376)
86 Balance of A & G (ln 81 - sum ln 82 to ln 85) 66,289,932 W/S 0.06311 4,183,258
87 Plus: Acct. 924, Property Insurance (ln 82) 2,550,069 GP(h) 0.14975 381,873
88 Acct. 928 - Transmission Specific Worksheet J ln 25.(E) (Note L) 510,464 TP 0.94335 481,547
89 Acct 930.1 - Only safety related ads -Direct Worksheet J ln 39.(E) (Note L) 19,934 TP 0.94335 18,804
90 Acct 930.2 - Misc Gen. Exp. - Trans Worksheet J ln 49.(E) (Note L) 126,425 DA 1.00000 126,425
91 Less: PBOP Expense In Acct. 926 Adjustment Worksheet J ln 10.C (Note M) 468,909 W/S 0.06311 29,591
92 A & G Subtotal (sum lns 86 to 90 less ln 91) 69,027,915 5,162,317
93 TOTAL O & M EXPENSE (ln 80 + ln 92) 82,010,671 17,409,614
94 DEPRECIATION AND AMORTIZATION EXPENSE
95 Transmission 336.7.f 25,189,839 TP 0.94335 23,762,863
96 Plus: Transmission Plant-in-Service Additions (Worksheet B) 1,016,991 DA 1.00000 1,016,991
97 General 336.10.f 8,018,403 W/S 0.06311 506,005
98 Intangible 336.1.f 9,059,152 W/S 0.06311 571,682
99 TOTAL DEPRECIATION AND AMORTIZATI0N (sum lns 95 to 98) 43,284,385 25,857,541
100 TAXES OTHER THAN INCOME (Note N)
101 Labor Related
102 Payroll Worksheet L, Col. D 5,866,598 W/S 0.06311 370,214
103 Plant Related
104 Property Worksheet L, Col. C 39,769,319 GP(h) 0.14975 5,955,461
105 Gross Receipts/Sales & Use Worksheet L, Col. F 5,048,397 NA 0.00000 -
106 Other Worksheet L, Col. E 21,326,802 GP(h) 0.14975 3,193,692
107 TOTAL OTHER TAXES (sum lns 102 to 106) 72,011,116 9,519,368
108 INCOME TAXES (Note O)
109 T=1 - {[(1 - SIT) * (1 - FIT)] / (1 - SIT * FIT * p)} = 37.75%
110 EIT=(T/(1-T)) * (1-(WCLTD/WACC)) = 40.36%
111 where WCLTD=(ln 147) and WACC = (ln 150)
112 and FIT, SIT & p are as given in Note O.
113 GRCF=1 / (1 - T) = (from ln 109) 1.6064
114 Amortized Investment Tax Credit (enter negative) (FF1 p.114, ln 19.c) (549,547)
115 Income Tax Calculation (ln 110 * ln 118) 134,911,526 21,678,540
116 ITC adjustment (ln 113 * ln 114) (882,807) NP(h) 0.14979 (132,236)
117 TOTAL INCOME TAXES (sum lns 115 to 116) 134,028,719 21,546,304
118 RETURN ON RATE BASE (Rate Base*WACC) (ln 75 * ln 150) 334,259,482 53,711,183
119 INTEREST ON IPP CONTRIBUTION FOR CONST. (Note E) (Worksheet E, ln 2) 657,290 DA 1.00000 657,290
120 REVENUE REQUIREMENT BEFORE TEXAS GROSS MARGIN TAX 666,251,663 128,701,300
121 (sum lns 93, 99, 107, 117, 118, 119)
122 TEXAS GROSS MARGIN TAX (Note P) (Worksheet K) 1,569,095 DA 303,106
123 REVENUE REQUIREMENT INCLUDING GROSS MARGIN TAX 667,820,758 129,004,406
Allocator
(4)
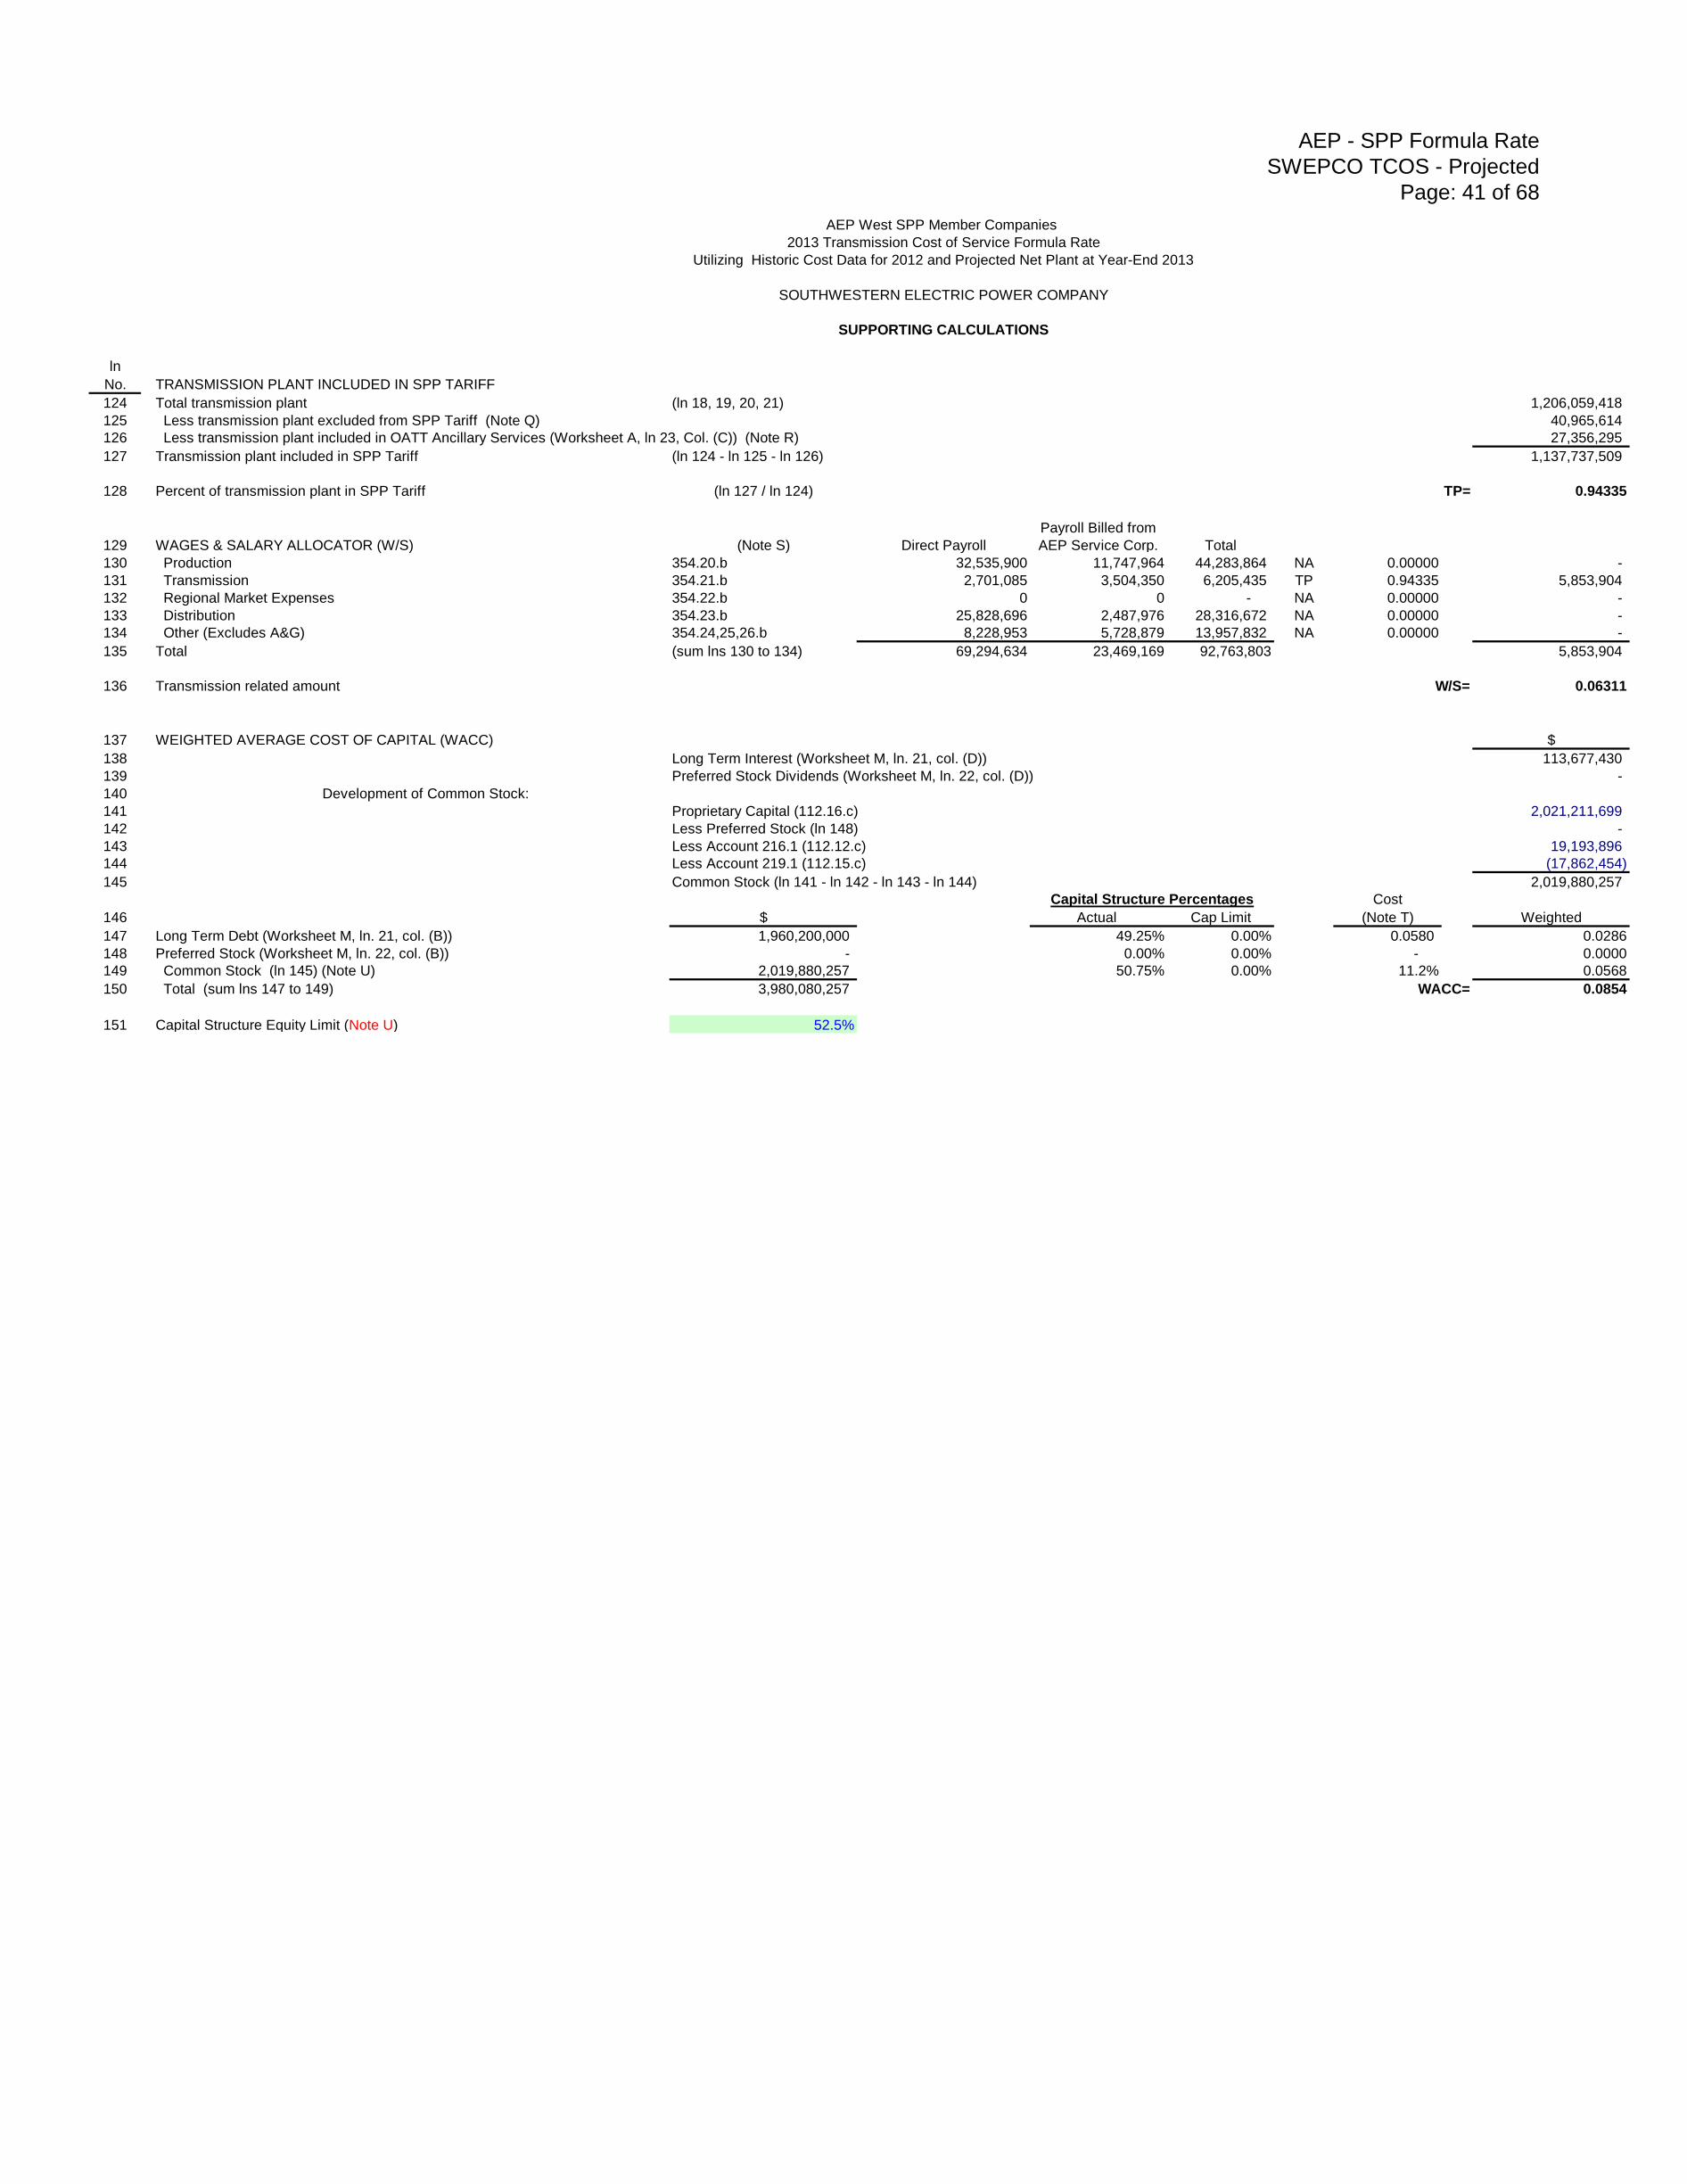
AEP - SPP Formula Rate
SWEPCO TCOS - Projected
Page: 41 of 68
AEP West SPP Member Companies
2013 Transmission Cost of Service Formula Rate
Utilizing Historic Cost Data for 2012 and Projected Net Plant at Year-End 2013
SOUTHWESTERN ELECTRIC POWER COMPANY
SUPPORTING CALCULATIONS
ln
No. TRANSMISSION PLANT INCLUDED IN SPP TARIFF
124 Total transmission plant (ln 18, 19, 20, 21) 1,206,059,418
125 Less transmission plant excluded from SPP Tariff (Note Q) 40,965,614
126 Less transmission plant included in OATT Ancillary Services (Worksheet A, ln 23, Col. (C)) (Note R) 27,356,295
127 Transmission plant included in SPP Tariff (ln 124 - ln 125 - ln 126) 1,137,737,509
128 Percent of transmission plant in SPP Tariff (ln 127 / ln 124) TP= 0.94335
129 WAGES & SALARY ALLOCATOR (W/S) (Note S) Direct Payroll
Payroll Billed from
AEP Service Corp. Total
130 Production 354.20.b 32,535,900 11,747,964 44,283,864 NA 0.00000 -
131 Transmission 354.21.b 2,701,085 3,504,350 6,205,435 TP 0.94335 5,853,904
132 Regional Market Expenses 354.22.b 0 0 - NA 0.00000 -
133 Distribution 354.23.b 25,828,696 2,487,976 28,316,672 NA 0.00000 -
134 Other (Excludes A&G) 354.24,25,26.b 8,228,953 5,728,879 13,957,832 NA 0.00000 -
135 Total (sum lns 130 to 134) 69,294,634 23,469,169 92,763,803 5,853,904
136 Transmission related amount W/S= 0.06311
137 WEIGHTED AVERAGE COST OF CAPITAL (WACC) $
138 Long Term Interest (Worksheet M, ln. 21, col. (D)) 113,677,430
139 Preferred Stock Dividends (Worksheet M, ln. 22, col. (D)) -
140 Development of Common Stock:
141 Proprietary Capital (112.16.c) 2,021,211,699
142 Less Preferred Stock (ln 148) -
143 Less Account 216.1 (112.12.c) 19,193,896
144 Less Account 219.1 (112.15.c) (17,862,454)
145 Common Stock (ln 141 - ln 142 - ln 143 - ln 144) 2,019,880,257
Cost
146 $ Actual Cap Limit (Note T) Weighted
147 Long Term Debt (Worksheet M, ln. 21, col. (B)) 1,960,200,000 49.25% 0.00% 0.0580 0.0286
148 Preferred Stock (Worksheet M, ln. 22, col. (B)) - 0.00% 0.00% - 0.0000
149 Common Stock (ln 145) (Note U) 2,019,880,257 50.75% 0.00% 11.2% 0.0568
150 Total (sum lns 147 to 149) 3,980,080,257 WACC= 0.0854
151 Capital Structure Equity Limit (Note U) 52.5%
Capital Structure Percentages
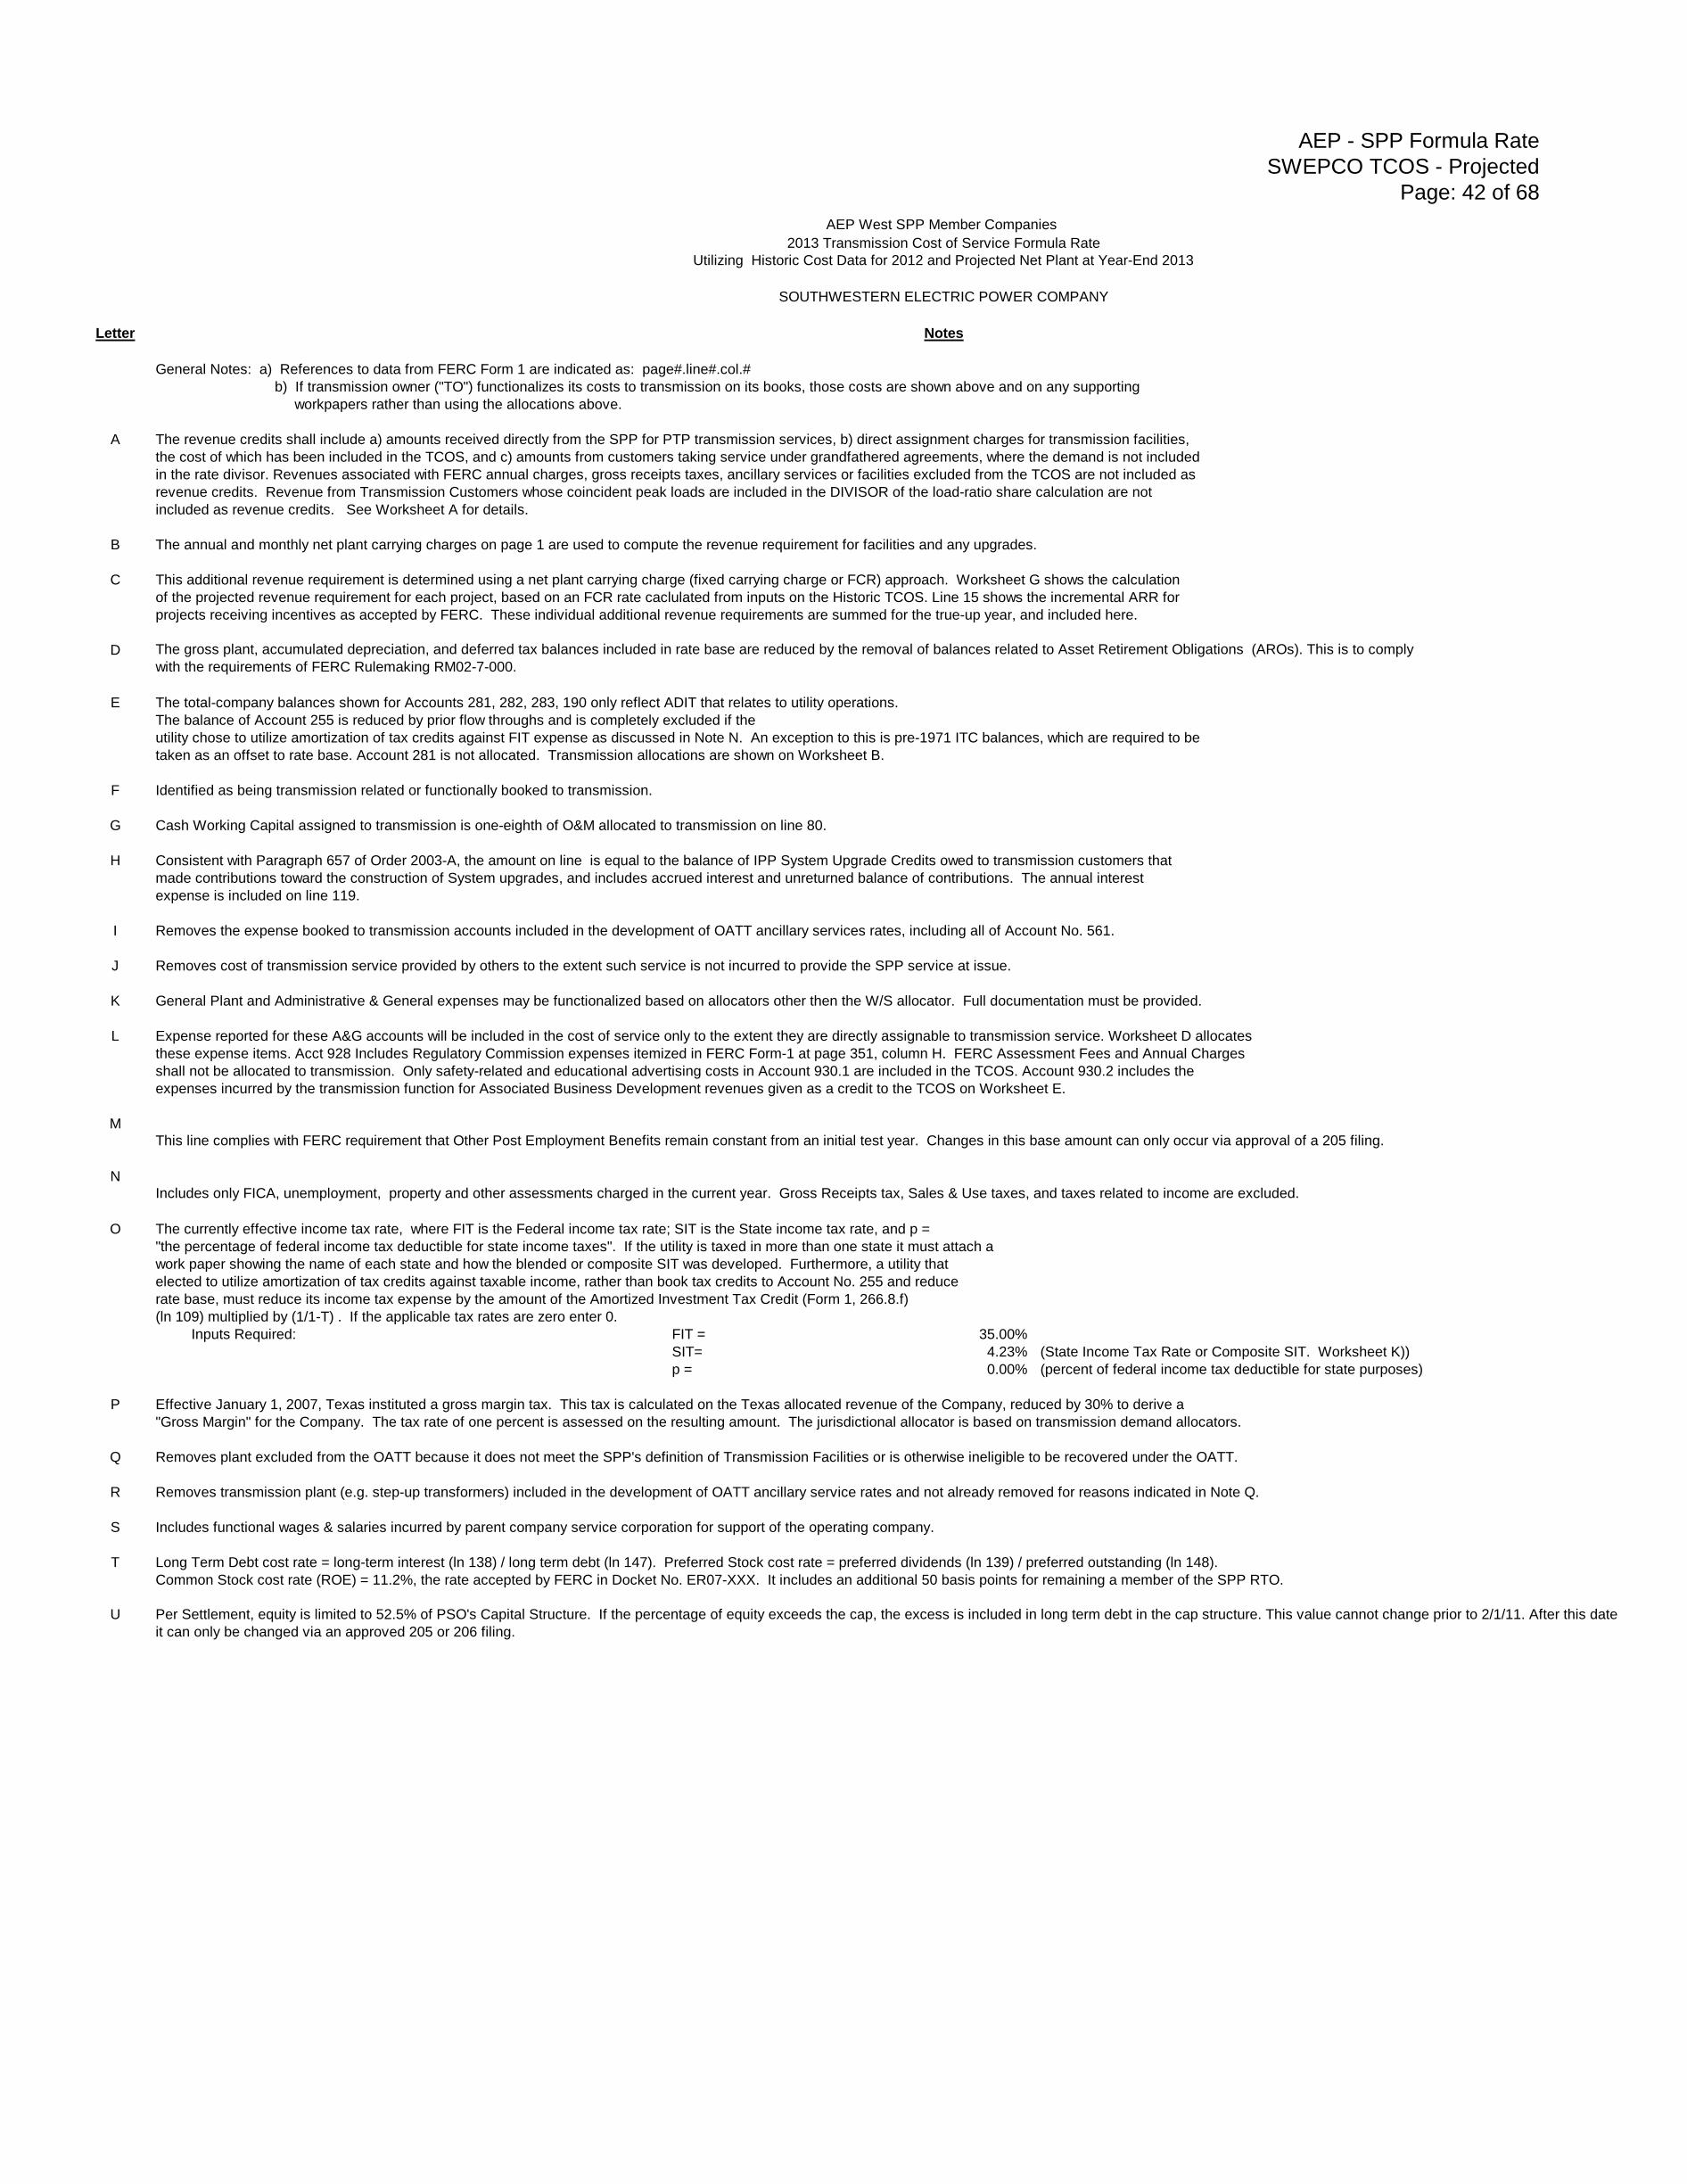
AEP - SPP Formula Rate
SWEPCO TCOS - Projected
Page: 42 of 68
AEP West SPP Member Companies
2013 Transmission Cost of Service Formula Rate
Utilizing Historic Cost Data for 2012 and Projected Net Plant at Year-End 2013
SOUTHWESTERN ELECTRIC POWER COMPANY
Letter Notes
General Notes: a) References to data from FERC Form 1 are indicated as: page#.line#.col.#
b) If transmission owner ("TO") functionalizes its costs to transmission on its books, those costs are shown above and on any supporting
workpapers rather than using the allocations above.
A The revenue credits shall include a) amounts received directly from the SPP for PTP transmission services, b) direct assignment charges for transmission facilities,
the cost of which has been included in the TCOS, and c) amounts from customers taking service under grandfathered agreements, where the demand is not included
in the rate divisor. Revenues associated with FERC annual charges, gross receipts taxes, ancillary services or facilities excluded from the TCOS are not included as
revenue credits. Revenue from Transmission Customers whose coincident peak loads are included in the DIVISOR of the load-ratio share calculation are not
included as revenue credits. See Worksheet A for details.
B The annual and monthly net plant carrying charges on page 1 are used to compute the revenue requirement for facilities and any upgrades.
C This additional revenue requirement is determined using a net plant carrying charge (fixed carrying charge or FCR) approach. Worksheet G shows the calculation
of the projected revenue requirement for each project, based on an FCR rate caclulated from inputs on the Historic TCOS. Line 15 shows the incremental ARR for
projects receiving incentives as accepted by FERC. These individual additional revenue requirements are summed for the true-up year, and included here.
D
E The total-company balances shown for Accounts 281, 282, 283, 190 only reflect ADIT that relates to utility operations.
The balance of Account 255 is reduced by prior flow throughs and is completely excluded if the
utility chose to utilize amortization of tax credits against FIT expense as discussed in Note N. An exception to this is pre-1971 ITC balances, which are required to be
taken as an offset to rate base. Account 281 is not allocated. Transmission allocations are shown on Worksheet B.
F Identified as being transmission related or functionally booked to transmission.
G Cash Working Capital assigned to transmission is one-eighth of O&M allocated to transmission on line 80.
H Consistent with Paragraph 657 of Order 2003-A, the amount on line is equal to the balance of IPP System Upgrade Credits owed to transmission customers that
made contributions toward the construction of System upgrades, and includes accrued interest and unreturned balance of contributions. The annual interest
expense is included on line 119.
I Removes the expense booked to transmission accounts included in the development of OATT ancillary services rates, including all of Account No. 561.
J Removes cost of transmission service provided by others to the extent such service is not incurred to provide the SPP service at issue.
K General Plant and Administrative & General expenses may be functionalized based on allocators other then the W/S allocator. Full documentation must be provided.
L Expense reported for these A&G accounts will be included in the cost of service only to the extent they are directly assignable to transmission service. Worksheet D allocates
these expense items. Acct 928 Includes Regulatory Commission expenses itemized in FERC Form-1 at page 351, column H. FERC Assessment Fees and Annual Charges
shall not be allocated to transmission. Only safety-related and educational advertising costs in Account 930.1 are included in the TCOS. Account 930.2 includes the
expenses incurred by the transmission function for Associated Business Development revenues given as a credit to the TCOS on Worksheet E.
M
N
O The currently effective income tax rate, where FIT is the Federal income tax rate; SIT is the State income tax rate, and p =
"the percentage of federal income tax deductible for state income taxes". If the utility is taxed in more than one state it must attach a
work paper showing the name of each state and how the blended or composite SIT was developed. Furthermore, a utility that
elected to utilize amortization of tax credits against taxable income, rather than book tax credits to Account No. 255 and reduce
rate base, must reduce its income tax expense by the amount of the Amortized Investment Tax Credit (Form 1, 266.8.f)
(ln 109) multiplied by (1/1-T) . If the applicable tax rates are zero enter 0.
Inputs Required: FIT = 35.00%
SIT= 4.23% (State Income Tax Rate or Composite SIT. Worksheet K))
p = 0.00% (percent of federal income tax deductible for state purposes)
P Effective January 1, 2007, Texas instituted a gross margin tax. This tax is calculated on the Texas allocated revenue of the Company, reduced by 30% to derive a
"Gross Margin" for the Company. The tax rate of one percent is assessed on the resulting amount. The jurisdictional allocator is based on transmission demand allocators.
Q Removes plant excluded from the OATT because it does not meet the SPP's definition of Transmission Facilities or is otherwise ineligible to be recovered under the OATT.
R Removes transmission plant (e.g. step-up transformers) included in the development of OATT ancillary service rates and not already removed for reasons indicated in Note Q.
S Includes functional wages & salaries incurred by parent company service corporation for support of the operating company.
T Long Term Debt cost rate = long-term interest (ln 138) / long term debt (ln 147). Preferred Stock cost rate = preferred dividends (ln 139) / preferred outstanding (ln 148).
Common Stock cost rate (ROE) = 11.2%, the rate accepted by FERC in Docket No. ER07-XXX. It includes an additional 50 basis points for remaining a member of the SPP RTO.
U
The gross plant, accumulated depreciation, and deferred tax balances included in rate base are reduced by the removal of balances related to Asset Retirement Obligations (AROs). This is to comply
with the requirements of FERC Rulemaking RM02-7-000.
This line complies with FERC requirement that Other Post Employment Benefits remain constant from an initial test year. Changes in this base amount can only occur via approval of a 205 filing.
Per Settlement, equity is limited to 52.5% of PSO's Capital Structure. If the percentage of equity exceeds the cap, the excess is included in long term debt in the cap structure. This value cannot change prior to 2/1/11. After this date
it can only be changed via an approved 205 or 206 filing.
Includes only FICA, unemployment, property and other assessments charged in the current year. Gross Receipts tax, Sales & Use taxes, and taxes related to income are excluded.
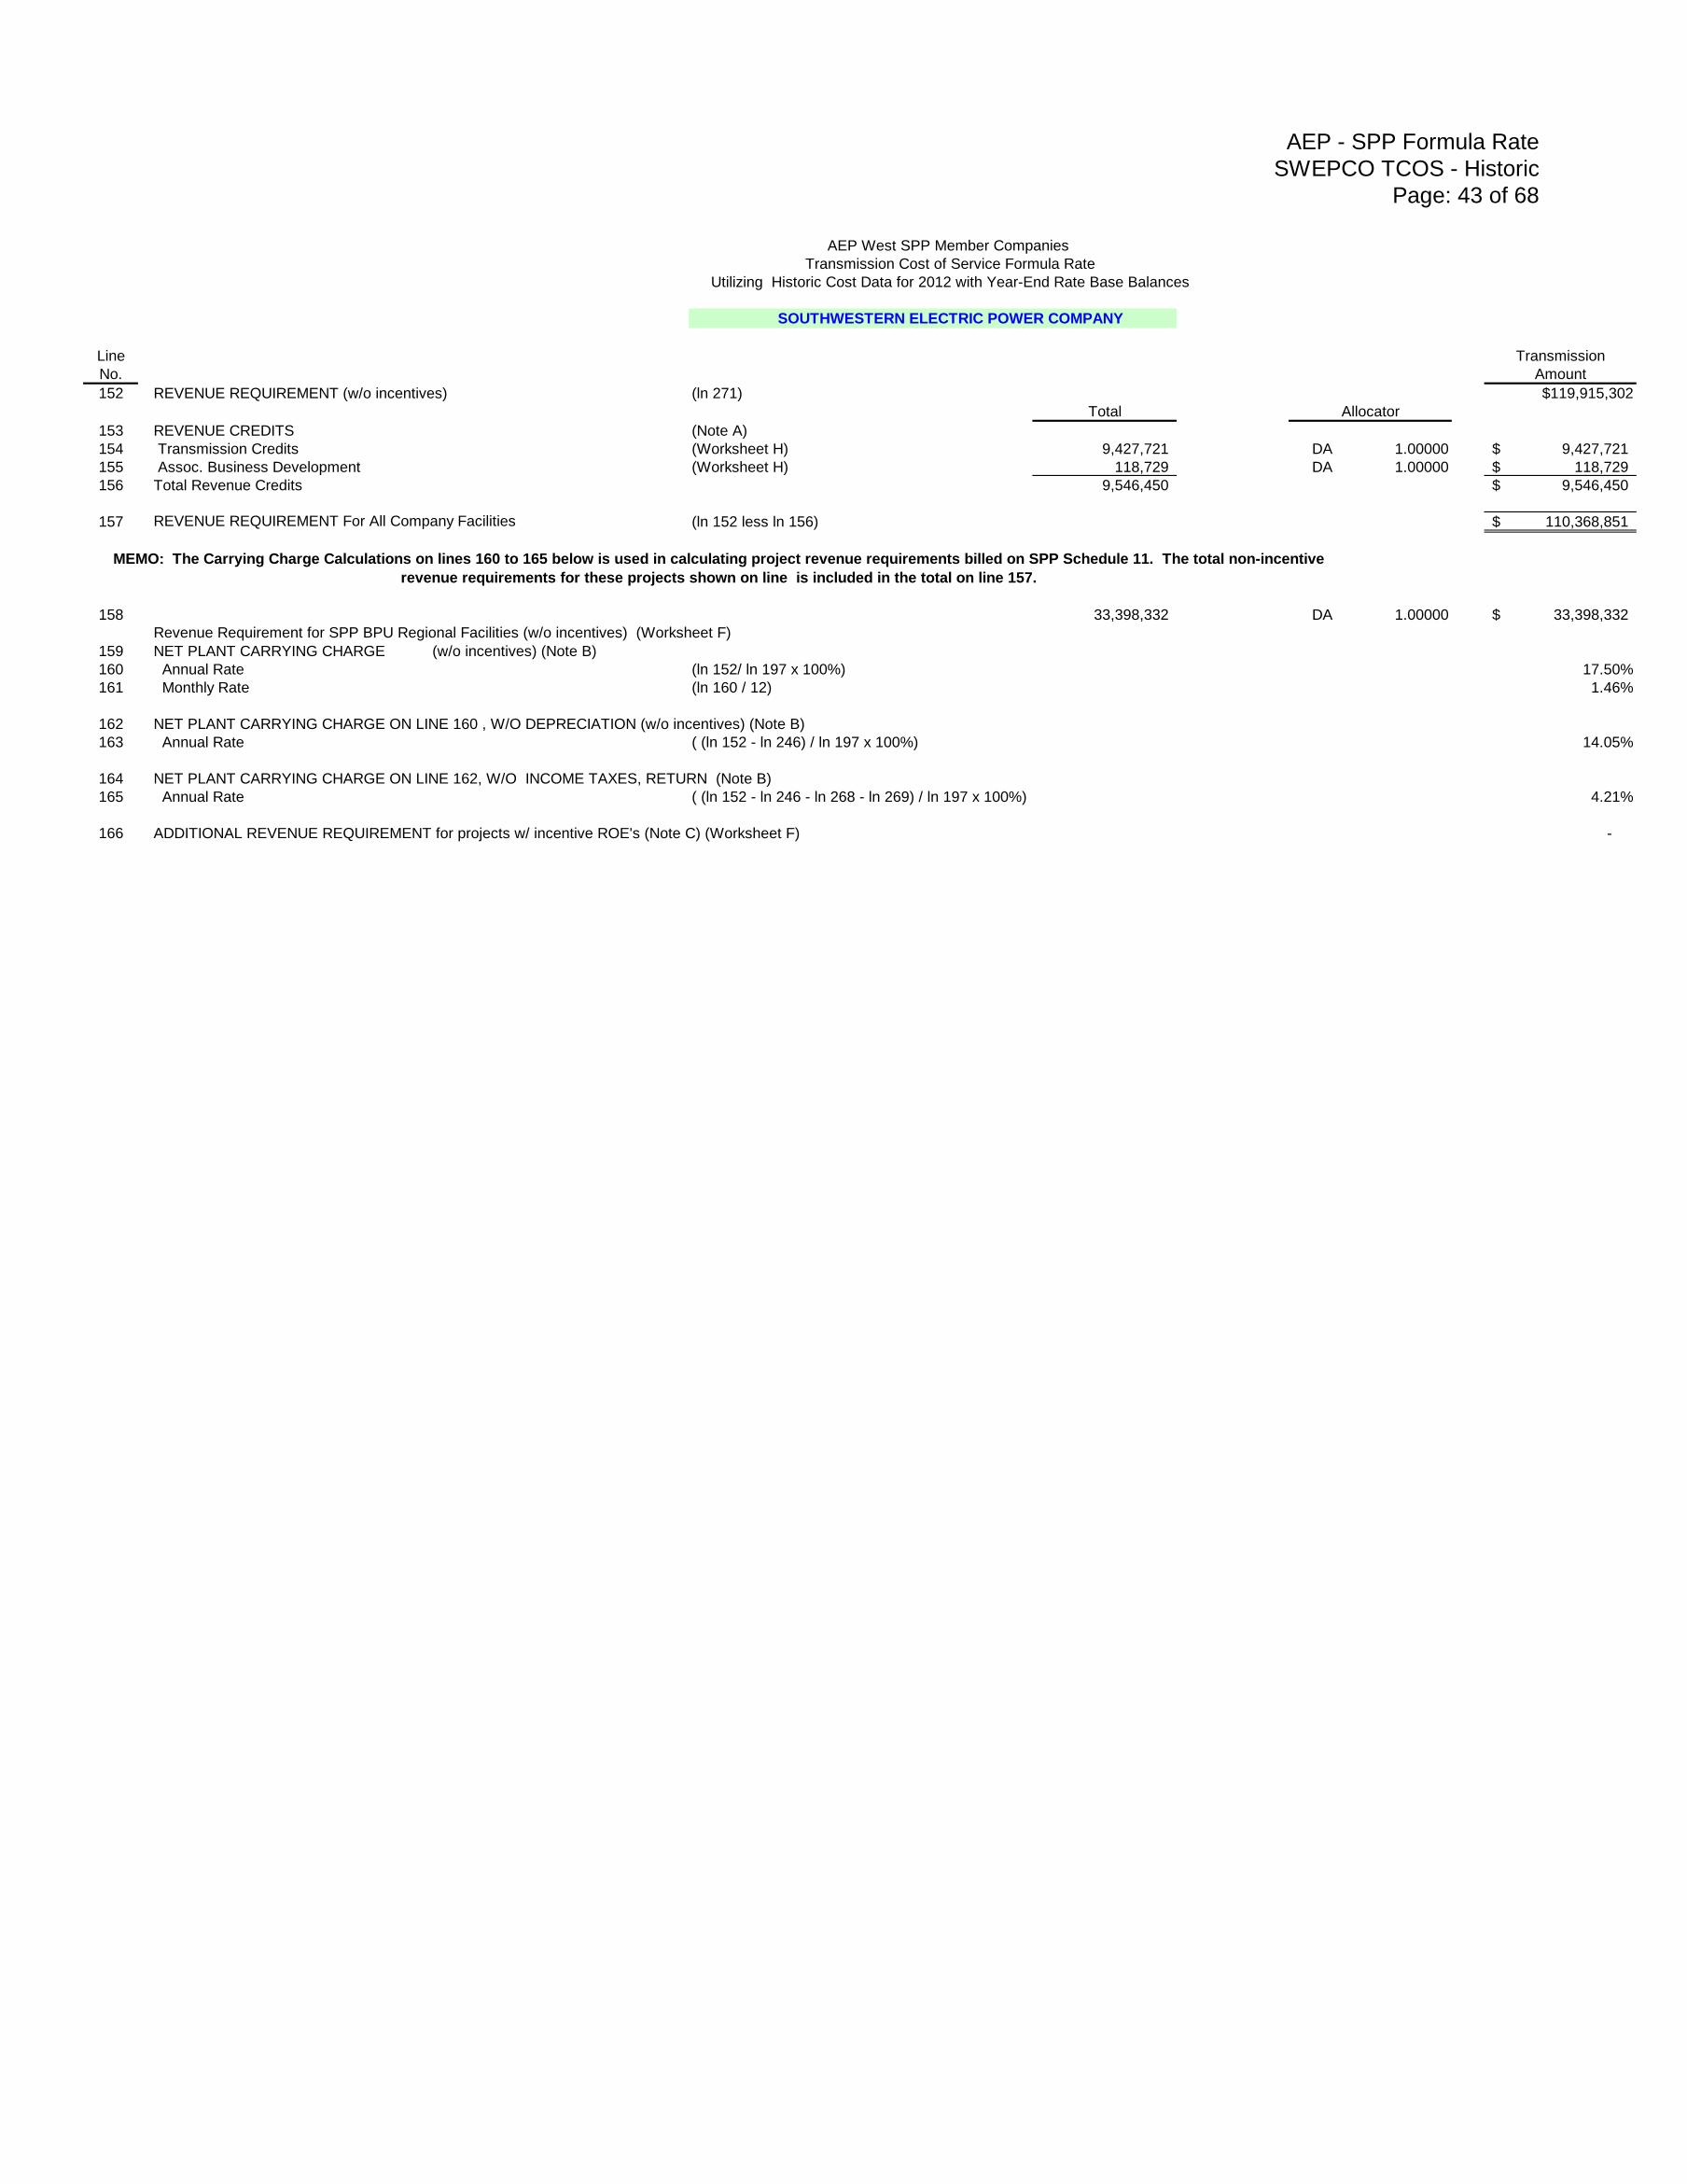
AEP - SPP Formula Rate
SWEPCO TCOS - Historic
Page: 43 of 68
AEP West SPP Member Companies
Transmission Cost of Service Formula Rate
Utilizing Historic Cost Data for 2012 with Year-End Rate Base Balances
SOUTHWESTERN ELECTRIC POWER COMPANY
Line Transmission
No. Amount
152 REVENUE REQUIREMENT (w/o incentives) (ln 271) $119,915,302
Total Allocator
153 REVENUE CREDITS (Note A)
154 Transmission Credits (Worksheet H) 9,427,721 DA 1.00000 9,427,721$
155 Assoc. Business Development (Worksheet H) 118,729 DA 1.00000 118,729$
156 Total Revenue Credits 9,546,450 9,546,450$
157 REVENUE REQUIREMENT For All Company Facilities (ln 152 less ln 156) 110,368,851$
158 33,398,332 DA 1.00000 33,398,332$
159 NET PLANT CARRYING CHARGE (w/o incentives) (Note B)
160 Annual Rate (ln 152/ ln 197 x 100%) 17.50%
161 Monthly Rate (ln 160 / 12) 1.46%
162 NET PLANT CARRYING CHARGE ON LINE 160 , W/O DEPRECIATION (w/o incentives) (Note B)
163 Annual Rate ( (ln 152 - ln 246) / ln 197 x 100%) 14.05%
164 NET PLANT CARRYING CHARGE ON LINE 162, W/O INCOME TAXES, RETURN (Note B)
165 Annual Rate ( (ln 152 - ln 246 - ln 268 - ln 269) / ln 197 x 100%) 4.21%
166 ADDITIONAL REVENUE REQUIREMENT for projects w/ incentive ROE's (Note C) (Worksheet F) -
MEMO: The Carrying Charge Calculations on lines 160 to 165 below is used in calculating project revenue requirements billed on SPP Schedule 11. The total non-incentive
revenue requirements for these projects shown on line is included in the total on line 157.
Revenue Requirement for SPP BPU Regional Facilities (w/o incentives) (Worksheet F)
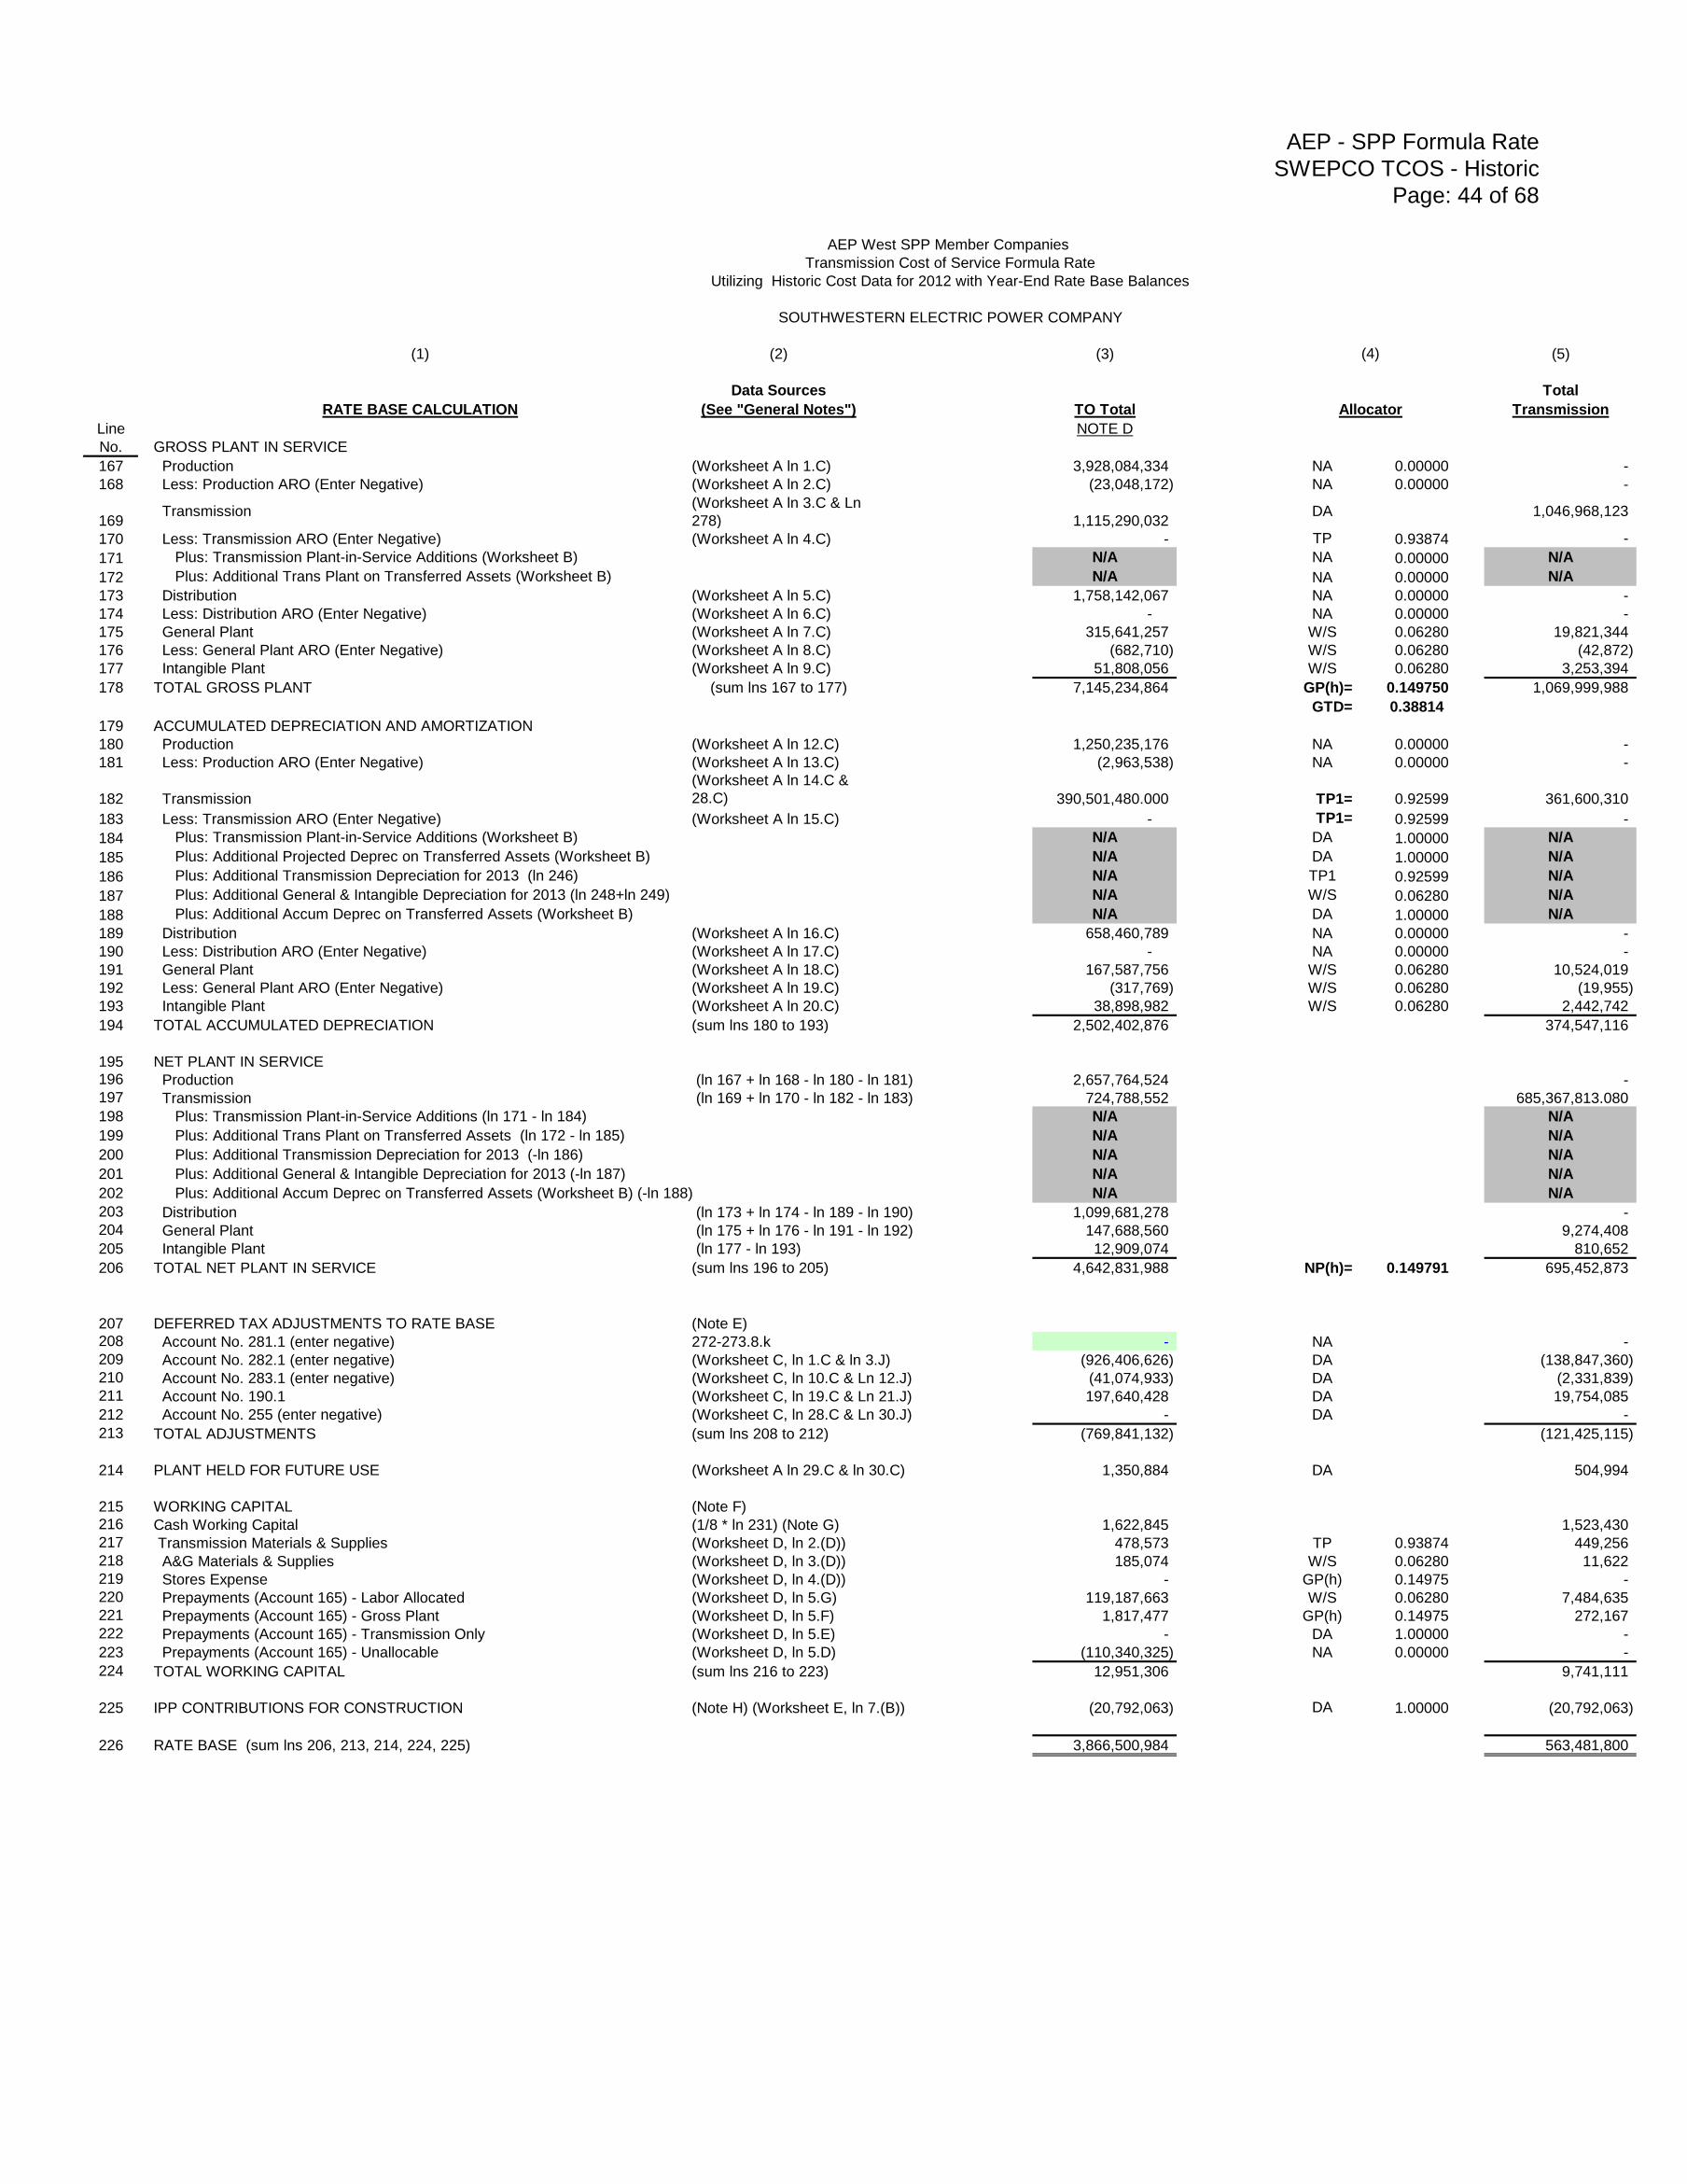
AEP - SPP Formula Rate
SWEPCO TCOS - Historic
Page: 44 of 68
AEP West SPP Member Companies
Transmission Cost of Service Formula Rate
Utilizing Historic Cost Data for 2012 with Year-End Rate Base Balances
SOUTHWESTERN ELECTRIC POWER COMPANY
(1) (2) (3) (5)
Data Sources Total
RATE BASE CALCULATION (See "General Notes") TO Total Transmission
Line NOTE D
No. GROSS PLANT IN SERVICE
167 Production (Worksheet A ln 1.C) 3,928,084,334 NA 0.00000 -
168 Less: Production ARO (Enter Negative) (Worksheet A ln 2.C) (23,048,172) NA 0.00000 -
169 Transmission
(Worksheet A ln 3.C & Ln
278) 1,115,290,032 DA 1,046,968,123
170 Less: Transmission ARO (Enter Negative) (Worksheet A ln 4.C) - TP 0.93874 -
171 Plus: Transmission Plant-in-Service Additions (Worksheet B) N/A NA 0.00000 N/A
172 Plus: Additional Trans Plant on Transferred Assets (Worksheet B) N/A NA 0.00000 N/A
173 Distribution (Worksheet A ln 5.C) 1,758,142,067 NA 0.00000 -
174 Less: Distribution ARO (Enter Negative) (Worksheet A ln 6.C) - NA 0.00000 -
175 General Plant (Worksheet A ln 7.C) 315,641,257 W/S 0.06280 19,821,344
176 Less: General Plant ARO (Enter Negative) (Worksheet A ln 8.C) (682,710) W/S 0.06280 (42,872)
177 Intangible Plant (Worksheet A ln 9.C) 51,808,056 W/S 0.06280 3,253,394
178 TOTAL GROSS PLANT (sum lns 167 to 177) 7,145,234,864 GP(h)= 0.149750 1,069,999,988
GTD= 0.38814
179 ACCUMULATED DEPRECIATION AND AMORTIZATION
180 Production (Worksheet A ln 12.C) 1,250,235,176 NA 0.00000 -
181 Less: Production ARO (Enter Negative) (Worksheet A ln 13.C) (2,963,538) NA 0.00000 -
182 Transmission
(Worksheet A ln 14.C &
28.C) 390,501,480.000 TP1= 0.92599 361,600,310
183 Less: Transmission ARO (Enter Negative) (Worksheet A ln 15.C) - TP1= 0.92599 -
184 Plus: Transmission Plant-in-Service Additions (Worksheet B) N/A DA 1.00000 N/A
185 Plus: Additional Projected Deprec on Transferred Assets (Worksheet B) N/A DA 1.00000 N/A
186 Plus: Additional Transmission Depreciation for 2013 (ln 246) N/A TP1 0.92599 N/A
187 Plus: Additional General & Intangible Depreciation for 2013 (ln 248+ln 249) N/A W/S 0.06280 N/A
188 Plus: Additional Accum Deprec on Transferred Assets (Worksheet B) N/A DA 1.00000 N/A
189 Distribution (Worksheet A ln 16.C) 658,460,789 NA 0.00000 -
190 Less: Distribution ARO (Enter Negative) (Worksheet A ln 17.C) - NA 0.00000 -
191 General Plant (Worksheet A ln 18.C) 167,587,756 W/S 0.06280 10,524,019
192 Less: General Plant ARO (Enter Negative) (Worksheet A ln 19.C) (317,769) W/S 0.06280 (19,955)
193 Intangible Plant (Worksheet A ln 20.C) 38,898,982 W/S 0.06280 2,442,742
194 TOTAL ACCUMULATED DEPRECIATION (sum lns 180 to 193) 2,502,402,876 374,547,116
195 NET PLANT IN SERVICE
196 Production (ln 167 + ln 168 - ln 180 - ln 181) 2,657,764,524 -
197 Transmission (ln 169 + ln 170 - ln 182 - ln 183) 724,788,552 685,367,813.080
198 Plus: Transmission Plant-in-Service Additions (ln 171 - ln 184) N/A N/A
199 Plus: Additional Trans Plant on Transferred Assets (ln 172 - ln 185) N/A N/A
200 Plus: Additional Transmission Depreciation for 2013 (-ln 186) N/A N/A
201 Plus: Additional General & Intangible Depreciation for 2013 (-ln 187) N/A N/A
202 Plus: Additional Accum Deprec on Transferred Assets (Worksheet B) (-ln 188) N/A N/A
203 Distribution (ln 173 + ln 174 - ln 189 - ln 190) 1,099,681,278 -
204 General Plant (ln 175 + ln 176 - ln 191 - ln 192) 147,688,560 9,274,408
205 Intangible Plant (ln 177 - ln 193) 12,909,074 810,652
206 TOTAL NET PLANT IN SERVICE (sum lns 196 to 205) 4,642,831,988 NP(h)= 0.149791 695,452,873
207 DEFERRED TAX ADJUSTMENTS TO RATE BASE (Note E)
208 Account No. 281.1 (enter negative) 272-273.8.k - NA -
209 Account No. 282.1 (enter negative) (Worksheet C, ln 1.C & ln 3.J) (926,406,626) DA (138,847,360)
210 Account No. 283.1 (enter negative) (Worksheet C, ln 10.C & Ln 12.J) (41,074,933) DA (2,331,839)
211 Account No. 190.1 (Worksheet C, ln 19.C & Ln 21.J) 197,640,428 DA 19,754,085
212 Account No. 255 (enter negative) (Worksheet C, ln 28.C & Ln 30.J) - DA -
213 TOTAL ADJUSTMENTS (sum lns 208 to 212) (769,841,132) (121,425,115)
214 PLANT HELD FOR FUTURE USE (Worksheet A ln 29.C & ln 30.C) 1,350,884 DA 504,994
215 WORKING CAPITAL (Note F)
216 Cash Working Capital (1/8 * ln 231) (Note G) 1,622,845 1,523,430
217 Transmission Materials & Supplies (Worksheet D, ln 2.(D)) 478,573 TP 0.93874 449,256
218 A&G Materials & Supplies (Worksheet D, ln 3.(D)) 185,074 W/S 0.06280 11,622
219 Stores Expense (Worksheet D, ln 4.(D)) - GP(h) 0.14975 -
220 Prepayments (Account 165) - Labor Allocated (Worksheet D, ln 5.G) 119,187,663 W/S 0.06280 7,484,635
221 Prepayments (Account 165) - Gross Plant (Worksheet D, ln 5.F) 1,817,477 GP(h) 0.14975 272,167
222 Prepayments (Account 165) - Transmission Only (Worksheet D, ln 5.E) - DA 1.00000 -
223 Prepayments (Account 165) - Unallocable (Worksheet D, ln 5.D) (110,340,325) NA 0.00000 -
224 TOTAL WORKING CAPITAL (sum lns 216 to 223) 12,951,306 9,741,111
225 IPP CONTRIBUTIONS FOR CONSTRUCTION (Note H) (Worksheet E, ln 7.(B)) (20,792,063) DA 1.00000 (20,792,063)
226 RATE BASE (sum lns 206, 213, 214, 224, 225) 3,866,500,984 563,481,800
(4)
Allocator

AEP - SPP Formula Rate
SWEPCO TCOS - Historic
Page: 45 of 68
AEP West SPP Member Companies
Transmission Cost of Service Formula Rate
Utilizing Historic Cost Data for 2012 with Year-End Rate Base Balances
SOUTHWESTERN ELECTRIC POWER COMPANY
(1) (2) (3) (5)
EXPENSE, TAXES, RETURN & REVENUE Data Sources Total
REQUIREMENTS CALCULATION (See "General Notes") TO Total Transmission
Line
No. OPERATION & MAINTENANCE EXPENSE
227 Transmission 321.112.b 44,970,358
228 Less: Total Account 561 (Note I) 321.84-92.b 11,280,135
229 Less: Account 565 (Note J) 321.96.b 20,707,467
230 Less: expenses 100% assigned to TO billed customers (Worksheet I, ln 14) $0
231 Total O&M Allocable to Transmission (lns 227 - 228 - 229 - 230) 12,982,756 TP 0.93874 12,187,441
232 Administrative and General 323.197.b (Note K) 70,056,050
233 Less: Acct. 924, Property Insurance 323.185.b 2,550,069
234 Acct. 928, Reg. Com. Exp. 323.189.b 3,205,062
235 Acct. 930.1, Gen. Advert. Exp. 323.191.b 206,363
236 Acct. 930.2, Misc. Gen. Exp. 323.192.b (2,195,376)
237 Balance of A & G (ln 232 - sum ln 233 to ln 236) 66,289,932 W/S 0.06280 4,162,813
238 Plus: Acct. 924, Property Insurance (ln 233) 2,550,069 GP(h) 0.14975 381,873
239 Acct. 928 - Transmission Specific Worksheet J ln 25.(E) (Note L) 510,464 TP 0.93874 479,193
240 Acct 930.1 - Only safety related ads -Direct Worksheet J ln 39.(E) (Note L) 19,934 TP 0.93874 18,713
241 Acct 930.2 - Misc Gen. Exp. - Trans Worksheet J ln 49.(E) (Note L) 126,425 DA 1.00000 126,425
242 Less: PBOP Expense In Acct. 926 Adjustment Worksheet J ln 10.C (Note M) 468,909 W/S 0.06280 29,446
243 A & G Subtotal (sum lns 237 to 241 less ln 242) 69,027,915 5,139,571
244 TOTAL O & M EXPENSE (ln 231 + ln 243) 82,010,671 17,327,013
245 DEPRECIATION AND AMORTIZATION EXPENSE
246 Transmission 336.7.f 25,189,839 TP 0.93874 23,646,727
247 Plus: Transmission Plant-in-Service Additions (Worksheet B) N/A N/A
248 General 336.10.f 8,018,403 W/S 0.06280 503,532
249 Intangible 336.1.f 9,059,152 W/S 0.06280 568,888
250 TOTAL DEPRECIATION AND AMORTIZATI0N (sum lns 246 to 249) 42,267,394 24,719,147
251 TAXES OTHER THAN INCOME (Note N)
252 Labor Related
253 Payroll Worksheet L, Col. D 5,866,598 W/S 0.06280 368,405
254 Plant Related
255 Property Worksheet L, Col. C 39,769,319 GP(h) 0.14975 5,955,461
256 Gross Receipts/Sales & Use Worksheet L, Col. F 5,048,397 NA 0.00000 -
257 Other Worksheet L, Col. E 21,326,802 GP(h) 0.14975 3,193,692
258 TOTAL OTHER TAXES (sum lns 253 to 257) 72,011,116 9,517,558
259 INCOME TAXES (Note O)
260 T=1 - {[(1 - SIT) * (1 - FIT)] / (1 - SIT * FIT * p)} = 37.75%
261 EIT=(T/(1-T)) * (1-(WCLTD/WACC)) = 40.36%
262 where WCLTD=(ln 298) and WACC = (ln 301)
263 and FIT, SIT & p are as given in Note O.
264 GRCF=1 / (1 - T) = (from ln 260) 1.6064
265 Amortized Investment Tax Credit (enter negative) (FF1 p.114, ln 19.c) (549,547)
266 Income Tax Calculation (ln 261 * ln 269) 133,274,761 19,422,703
267 ITC adjustment (ln 264 * ln 265) (882,807) NP(h) 0.14979 (132,236)
268 TOTAL INCOME TAXES (sum lns 266 to 267) 132,391,954 19,290,467
269 RETURN ON RATE BASE (Rate Base*WACC) (ln 226 * ln 301) 330,204,201 48,122,077
270 INTEREST ON IPP CONTRIBUTION FOR CONST. (Note E) (Worksheet E, ln 2) 657,290 DA 1.00000 657,290
271 REVENUE REQUIREMENT BEFORE TEXAS GROSS MARGIN TAX 659,542,627 119,633,552
272 (sum lns 244, 250, 258, 268, 269, 270)
273 TEXAS GROSS MARGIN TAX (Note P) (Worksheet K) 1,553,295 DA 281,750
274 REVENUE REQUIREMENT INCLUDING GROSS MARGIN TAX 661,095,922 119,915,302
Allocator
(4)
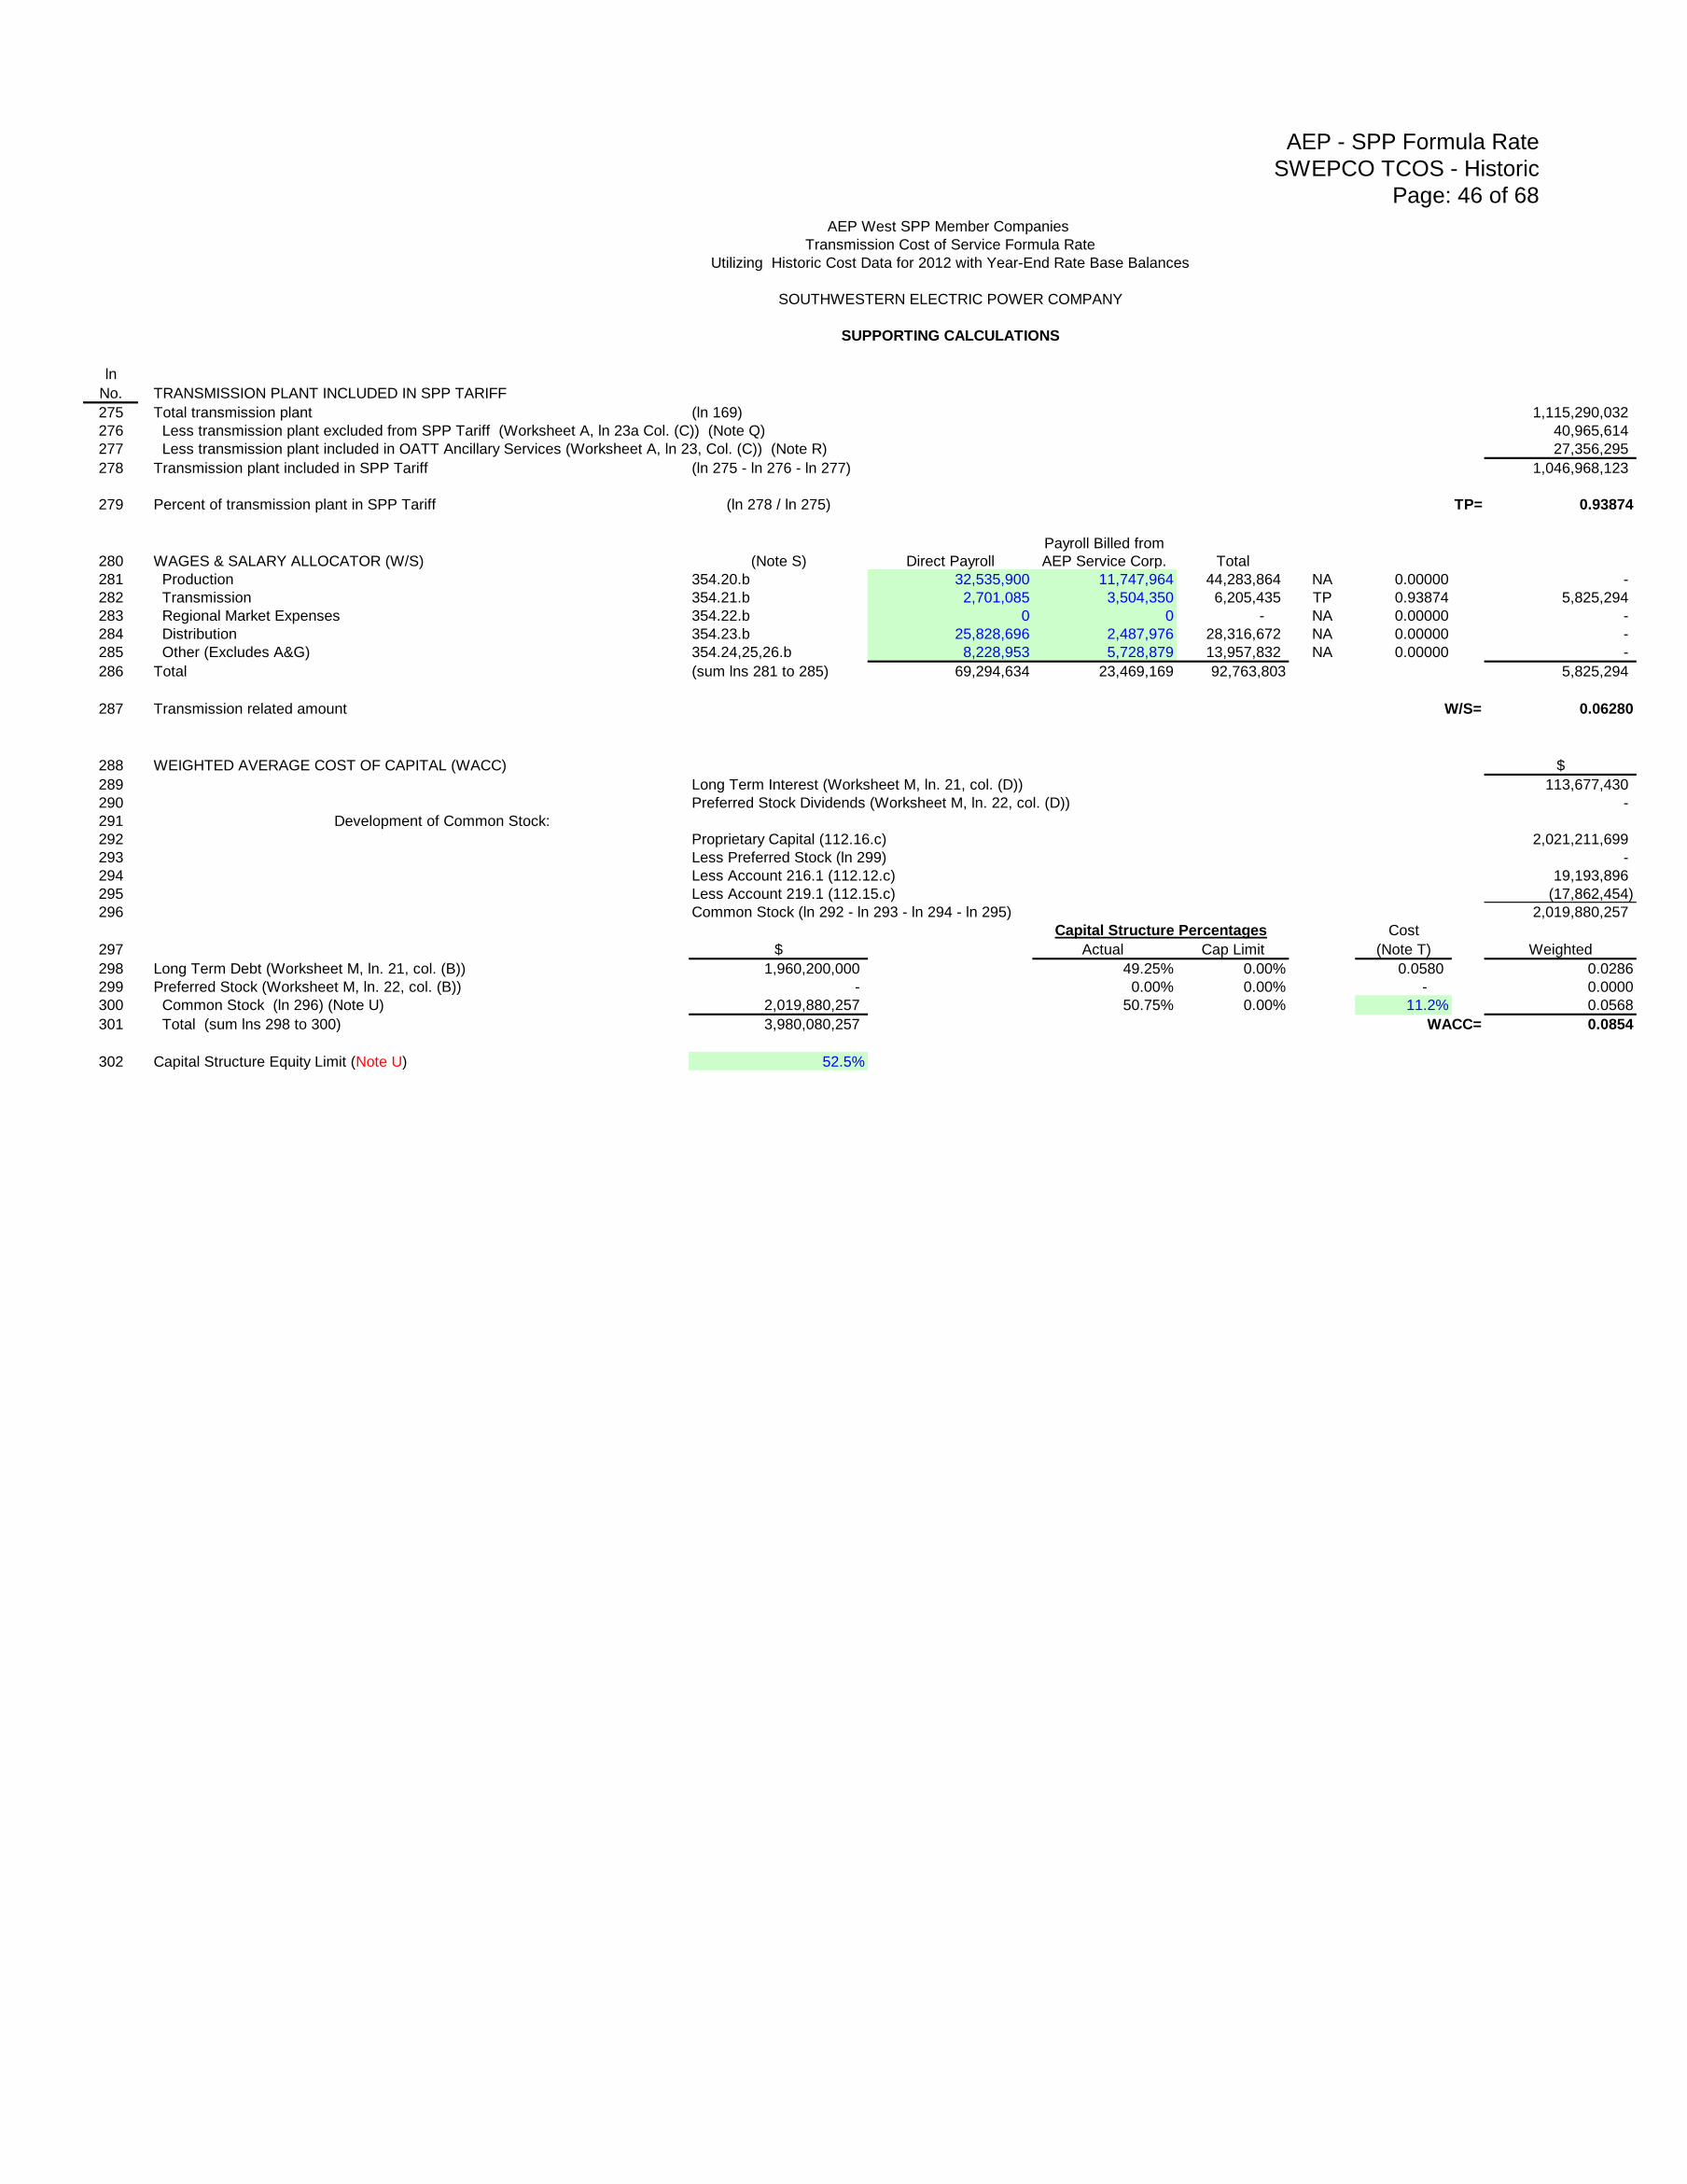
AEP - SPP Formula Rate
SWEPCO TCOS - Historic
Page: 46 of 68
AEP West SPP Member Companies
Transmission Cost of Service Formula Rate
Utilizing Historic Cost Data for 2012 with Year-End Rate Base Balances
SOUTHWESTERN ELECTRIC POWER COMPANY
SUPPORTING CALCULATIONS
ln
No. TRANSMISSION PLANT INCLUDED IN SPP TARIFF
275 Total transmission plant (ln 169) 1,115,290,032
276 Less transmission plant excluded from SPP Tariff (Worksheet A, ln 23a Col. (C)) (Note Q) 40,965,614
277 Less transmission plant included in OATT Ancillary Services (Worksheet A, ln 23, Col. (C)) (Note R) 27,356,295
278 Transmission plant included in SPP Tariff (ln 275 - ln 276 - ln 277) 1,046,968,123
279 Percent of transmission plant in SPP Tariff (ln 278 / ln 275) TP= 0.93874
280 WAGES & SALARY ALLOCATOR (W/S) (Note S) Direct Payroll
Payroll Billed from
AEP Service Corp. Total
281 Production 354.20.b 32,535,900 11,747,964 44,283,864 NA 0.00000 -
282 Transmission 354.21.b 2,701,085 3,504,350 6,205,435 TP 0.93874 5,825,294
283 Regional Market Expenses 354.22.b 0 0 - NA 0.00000 -
284 Distribution 354.23.b 25,828,696 2,487,976 28,316,672 NA 0.00000 -
285 Other (Excludes A&G) 354.24,25,26.b 8,228,953 5,728,879 13,957,832 NA 0.00000 -
286 Total (sum lns 281 to 285) 69,294,634 23,469,169 92,763,803 5,825,294
287 Transmission related amount W/S= 0.06280
288 WEIGHTED AVERAGE COST OF CAPITAL (WACC) $
289 Long Term Interest (Worksheet M, ln. 21, col. (D)) 113,677,430
290 Preferred Stock Dividends (Worksheet M, ln. 22, col. (D)) -
291 Development of Common Stock:
292 Proprietary Capital (112.16.c) 2,021,211,699
293 Less Preferred Stock (ln 299) -
294 Less Account 216.1 (112.12.c) 19,193,896
295 Less Account 219.1 (112.15.c) (17,862,454)
296 Common Stock (ln 292 - ln 293 - ln 294 - ln 295) 2,019,880,257
Cost
297 $ Actual Cap Limit (Note T) Weighted
298 Long Term Debt (Worksheet M, ln. 21, col. (B)) 1,960,200,000 49.25% 0.00% 0.0580 0.0286
299 Preferred Stock (Worksheet M, ln. 22, col. (B)) - 0.00% 0.00% - 0.0000
300 Common Stock (ln 296) (Note U) 2,019,880,257 50.75% 0.00% 11.2% 0.0568
301 Total (sum lns 298 to 300) 3,980,080,257 WACC= 0.0854
302 Capital Structure Equity Limit (Note U) 52.5%
Capital Structure Percentages

AEP - SPP Formula Rate
SWEPCO TCOS - Historic
Page: 47 of 68
AEP West SPP Member Companies
Transmission Cost of Service Formula Rate
Utilizing Historic Cost Data for 2012 with Year-End Rate Base Balances
SOUTHWESTERN ELECTRIC POWER COMPANY
Letter Notes
General Notes: a) References to data from FERC Form 1 are indicated as: page#.line#.col.#
b) If transmission owner ("TO") functionalizes its costs to transmission on its books, those costs are shown above and on any supporting
workpapers rather than using the allocations above.
A The revenue credits shall include a) amounts received directly from the SPP for PTP transmission services, b) direct assignment charges for transmission facilities,
the cost of which has been included in the TCOS, and c) amounts from customers taking service under grandfathered agreements, where the demand is not included
in the rate divisor. Revenues associated with FERC annual charges, gross receipts taxes, ancillary services or facilities excluded from the TCOS are not included as
revenue credits. Revenue from Transmission Customers whose coincident peak loads are included in the DIVISOR of the load-ratio share calculation are not
included as revenue credits. See Worksheet A for details.
B The annual and monthly net plant carrying charges on page 1 are used to compute the revenue requirement for facilities and any upgrades.
C This additional revenue requirement is determined using a net plant carrying charge (fixed carrying charge or FCR) approach. Worksheet G shows the calculation
of the projected revenue requirement for each project, based on an FCR rate caclulated from inputs on this TCOS. Line 166 shows the incremental ARR for
projects receiving incentives as accepted by FERC. These individual additional revenue requirements are summed for the true-up year, and included here.
D
E The total-company balances shown for Accounts 281, 282, 283, 190 only reflect ADIT that relates to utility operations.
The balance of Account 255 is reduced by prior flow throughs and is completely excluded if the
utility chose to utilize amortization of tax credits against FIT expense as discussed in Note N. An exception to this is pre-1971 ITC balances, which are required to be
taken as an offset to rate base. Account 281 is not allocated. Transmission allocations are shown on Worksheet B.
F Identified as being transmission related or functionally booked to transmission.
G Cash Working Capital assigned to transmission is one-eighth of O&M allocated to transmission on line 231.
H Consistent with Paragraph 657 of Order 2003-A, the amount on line is equal to the balance of IPP System Upgrade Credits owed to transmission customers that
made contributions toward the construction of System upgrades, and includes accrued interest and unreturned balance of contributions. The annual interest
expense is included on line 270.
I Removes the expense booked to transmission accounts included in the development of OATT ancillary services rates, including all of Account No. 561.
J Removes cost of transmission service provided by others to the extent such service is not incurred to provide the SPP service at issue.
K General Plant and Administrative & General expenses may be functionalized based on allocators other then the W/S allocator. Full documentation must be provided.
L Expense reported for these A&G accounts will be included in the cost of service only to the extent they are directly assignable to transmission service. Worksheet D allocates
these expense items. Acct 928 Includes Regulatory Commission expenses itemized in FERC Form-1 at page 351, column H. FERC Assessment Fees and Annual Charges
shall not be allocated to transmission. Only safety-related and educational advertising costs in Account 930.1 are included in the TCOS. Account 930.2 includes the
expenses incurred by the transmission function for Associated Business Development revenues given as a credit to the TCOS on Worksheet E.
M
N
O The currently effective income tax rate, where FIT is the Federal income tax rate; SIT is the State income tax rate, and p =
"the percentage of federal income tax deductible for state income taxes". If the utility is taxed in more than one state it must attach a
work paper showing the name of each state and how the blended or composite SIT was developed. Furthermore, a utility that
elected to utilize amortization of tax credits against taxable income, rather than book tax credits to Account No. 255 and reduce
rate base, must reduce its income tax expense by the amount of the Amortized Investment Tax Credit (Form 1, 266.8.f)
(ln 260) multiplied by (1/1-T) . If the applicable tax rates are zero enter 0.
Inputs Required: FIT = 35.00%
SIT= 4.23% (State Income Tax Rate or Composite SIT. Worksheet K)
p = 0.00% (percent of federal income tax deductible for state purposes)
P Effective January 1, 2007, Texas instituted a gross margin tax. This tax is calculated on the Texas allocated revenue of the Company, reduced by 30% to derive a
"Gross Margin" for the Company. The tax rate of one percent is assessed on the resulting amount. The jurisdictional allocator is based on transmission demand allocators.
Q Removes plant excluded from the OATT because it does not meet the SPP's definition of Transmission Facilities or is otherwise ineligible to be recovered under the OATT.
R Removes transmission plant (e.g. step-up transformers) included in the development of OATT ancillary service rates and not already removed for reasons indicated in Note Q.
S Includes functional wages & salaries incurred by parent company service corporation for support of the operating company.
T Long Term Debt cost rate = long-term interest (ln 289) / long term debt (ln 298). Preferred Stock cost rate = preferred dividends (ln 290) / preferred outstanding (ln 299).
Common Stock cost rate (ROE) = 11.2%, the rate accepted by FERC in Docket No. ER07-XXX. It includes an additional 50 basis points for remaining a member of the SPP RTO.
U
The gross plant, accumulated depreciation, and deferred tax balances included in rate base are reduced by the removal of balances related to Asset Retirement Obligations (AROs). This is to
comply with the requirements of FERC Rulemaking RM02-7-000.
This line complies with FERC requirement that Other Post Employment Benefits remain constant from an initial test year. Changes in this base amount can only occur via approval of a 205 filing.
Per Settlement, equity is limited to 52.5% of PSO's Capital Structure. If the percentage of equity exceeds the cap, the excess is included in long term debt in the cap structure. This value cannot change prior to 2/1/11. After
this date it can only be changed via an approved 205 or 206 filing.
Includes only FICA, unemployment, property and other assessments charged in the current year. Gross Receipts tax, Sales & Use taxes, and taxes related to income are excluded.
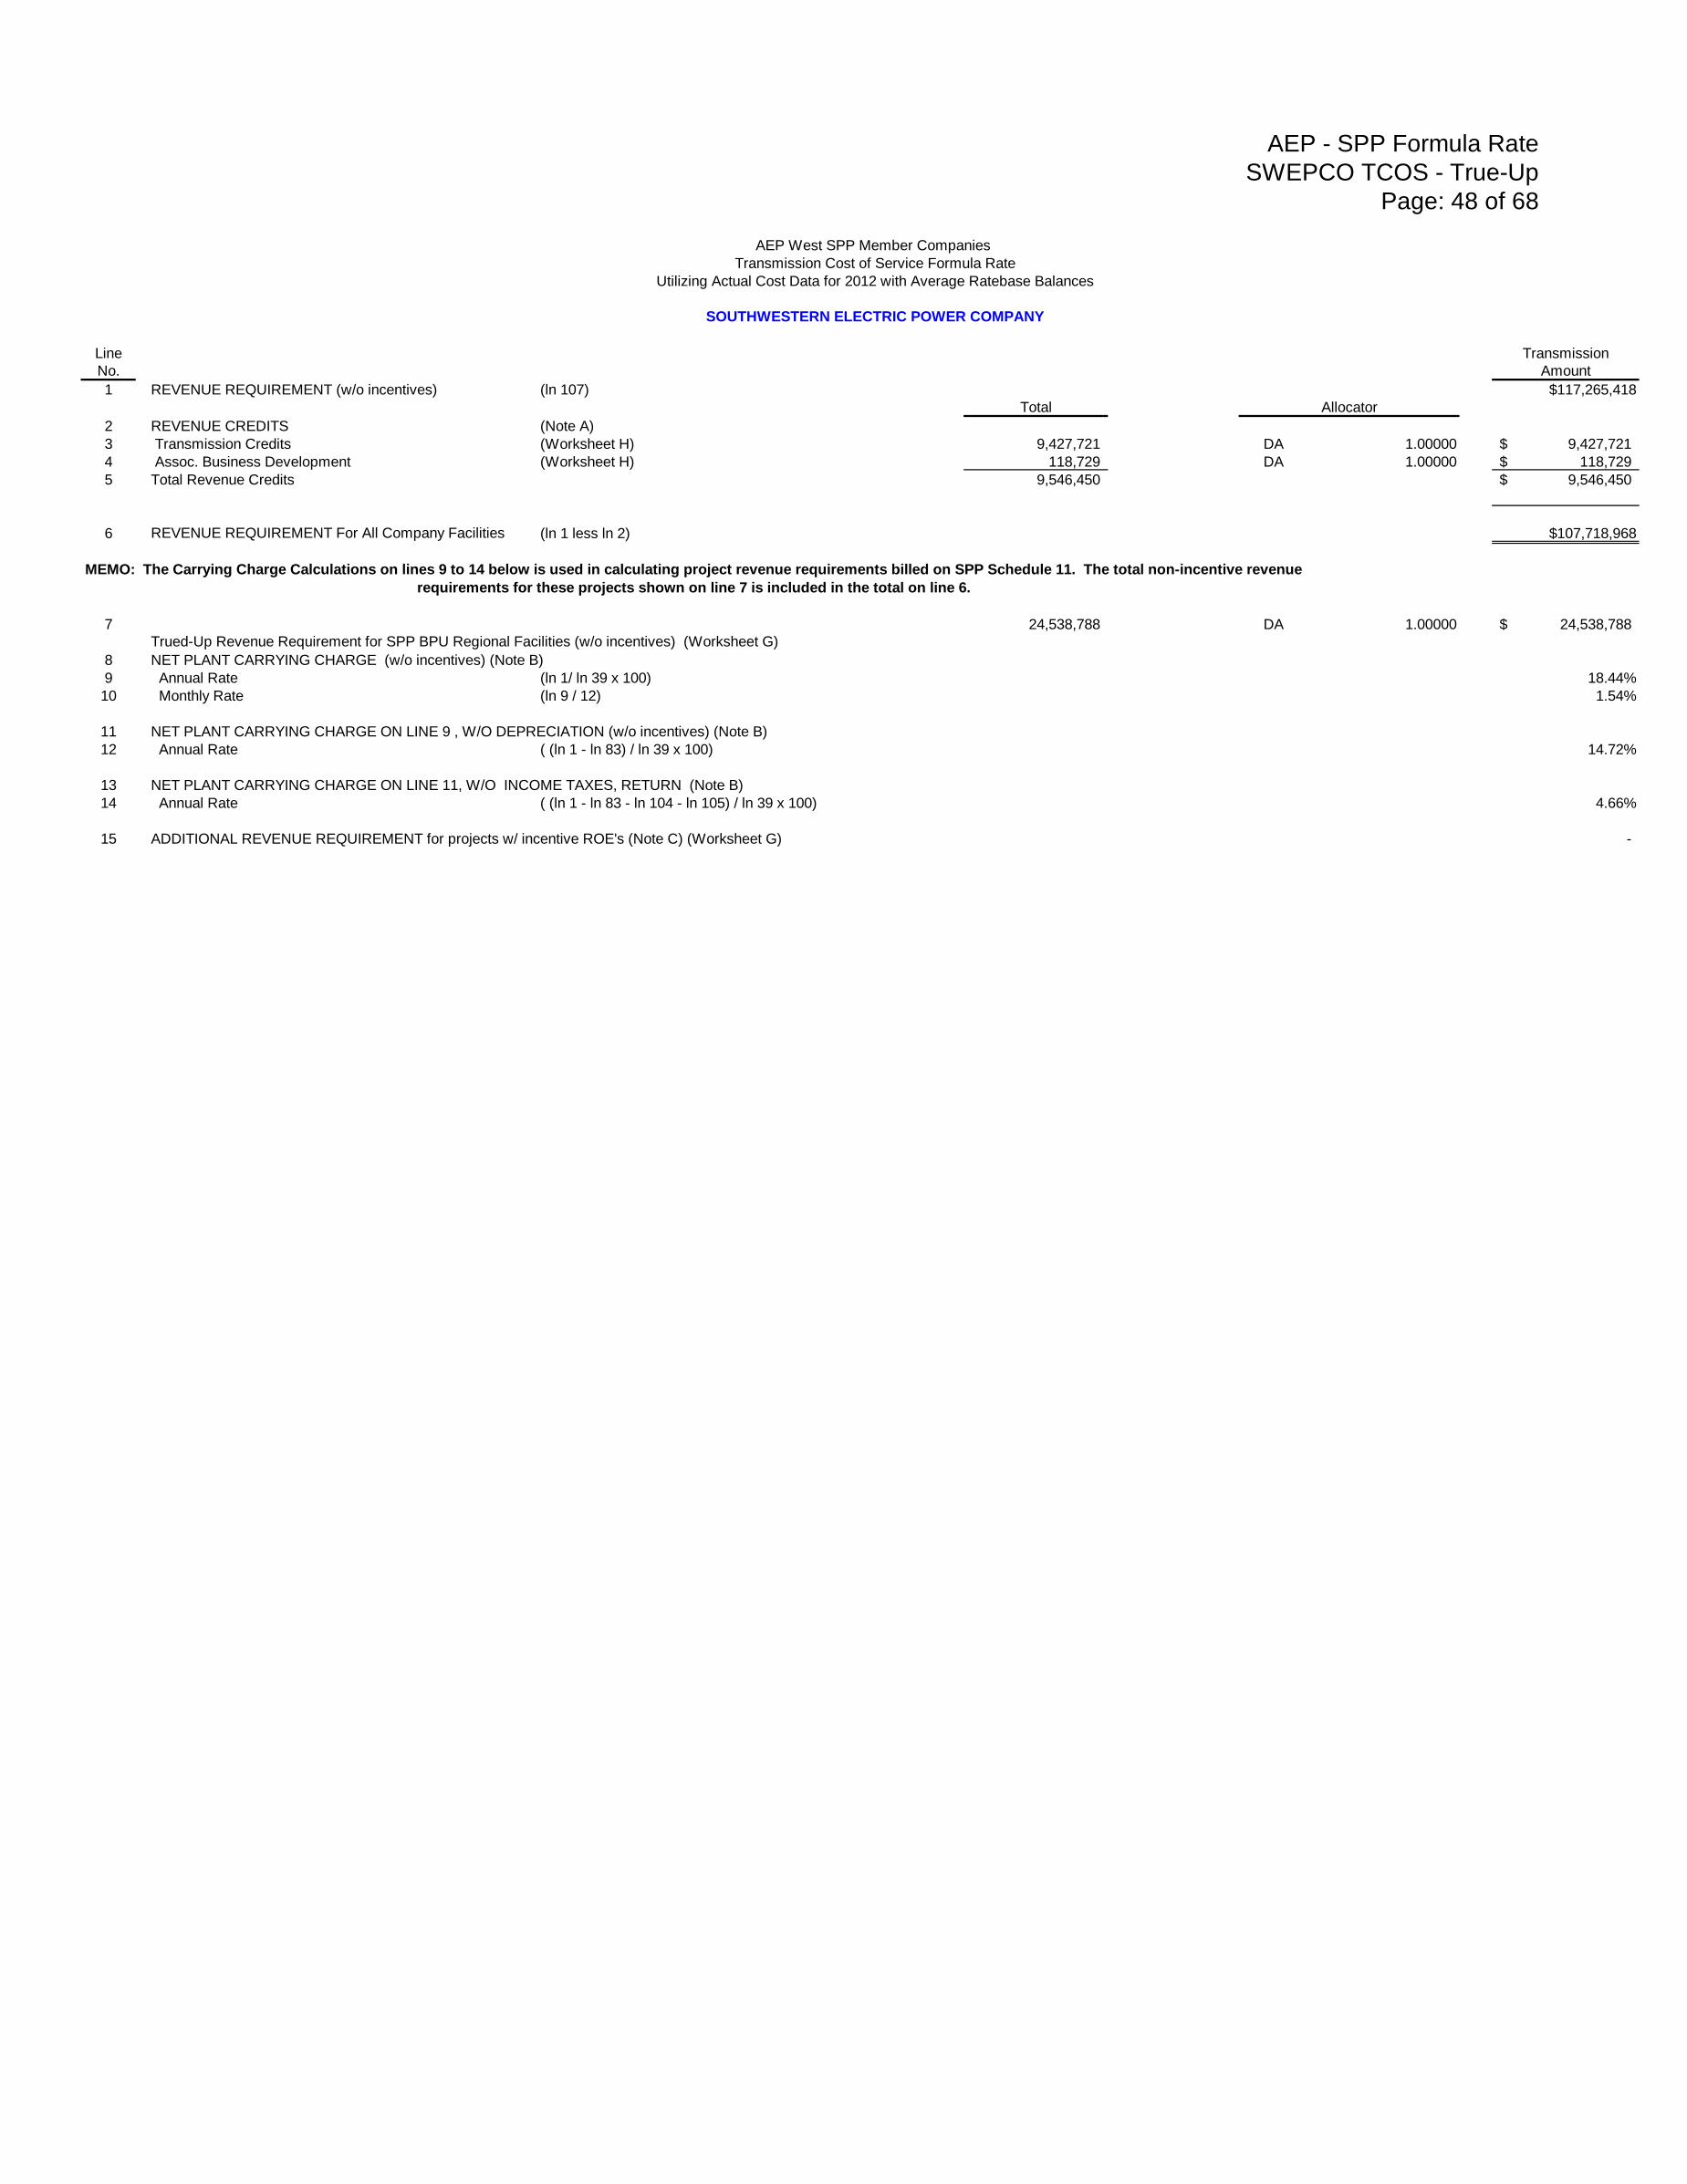
AEP - SPP Formula Rate
SWEPCO TCOS - True-Up
Page: 48 of 68
AEP West SPP Member Companies
Transmission Cost of Service Formula Rate
Utilizing Actual Cost Data for 2012 with Average Ratebase Balances
SOUTHWESTERN ELECTRIC POWER COMPANY
Line Transmission
No. Amount
1 REVENUE REQUIREMENT (w/o incentives) (ln 107) $117,265,418
Total Allocator
2 REVENUE CREDITS (Note A)
3 Transmission Credits (Worksheet H) 9,427,721 DA 1.00000 9,427,721$
4 Assoc. Business Development (Worksheet H) 118,729 DA 1.00000 118,729$
5 Total Revenue Credits 9,546,450 9,546,450$
6 REVENUE REQUIREMENT For All Company Facilities (ln 1 less ln 2) $107,718,968
7 24,538,788 DA 1.00000 24,538,788$
8 NET PLANT CARRYING CHARGE (w/o incentives) (Note B)
9 Annual Rate (ln 1/ ln 39 x 100) 18.44%
10 Monthly Rate (ln 9 / 12) 1.54%
11 NET PLANT CARRYING CHARGE ON LINE 9 , W/O DEPRECIATION (w/o incentives) (Note B)
12 Annual Rate ( (ln 1 - ln 83) / ln 39 x 100) 14.72%
13 NET PLANT CARRYING CHARGE ON LINE 11, W/O INCOME TAXES, RETURN (Note B)
14 Annual Rate ( (ln 1 - ln 83 - ln 104 - ln 105) / ln 39 x 100) 4.66%
15 ADDITIONAL REVENUE REQUIREMENT for projects w/ incentive ROE's (Note C) (Worksheet G) -
MEMO: The Carrying Charge Calculations on lines 9 to 14 below is used in calculating project revenue requirements billed on SPP Schedule 11. The total non-incentive revenue
requirements for these projects shown on line 7 is included in the total on line 6.
Trued-Up Revenue Requirement for SPP BPU Regional Facilities (w/o incentives) (Worksheet G)
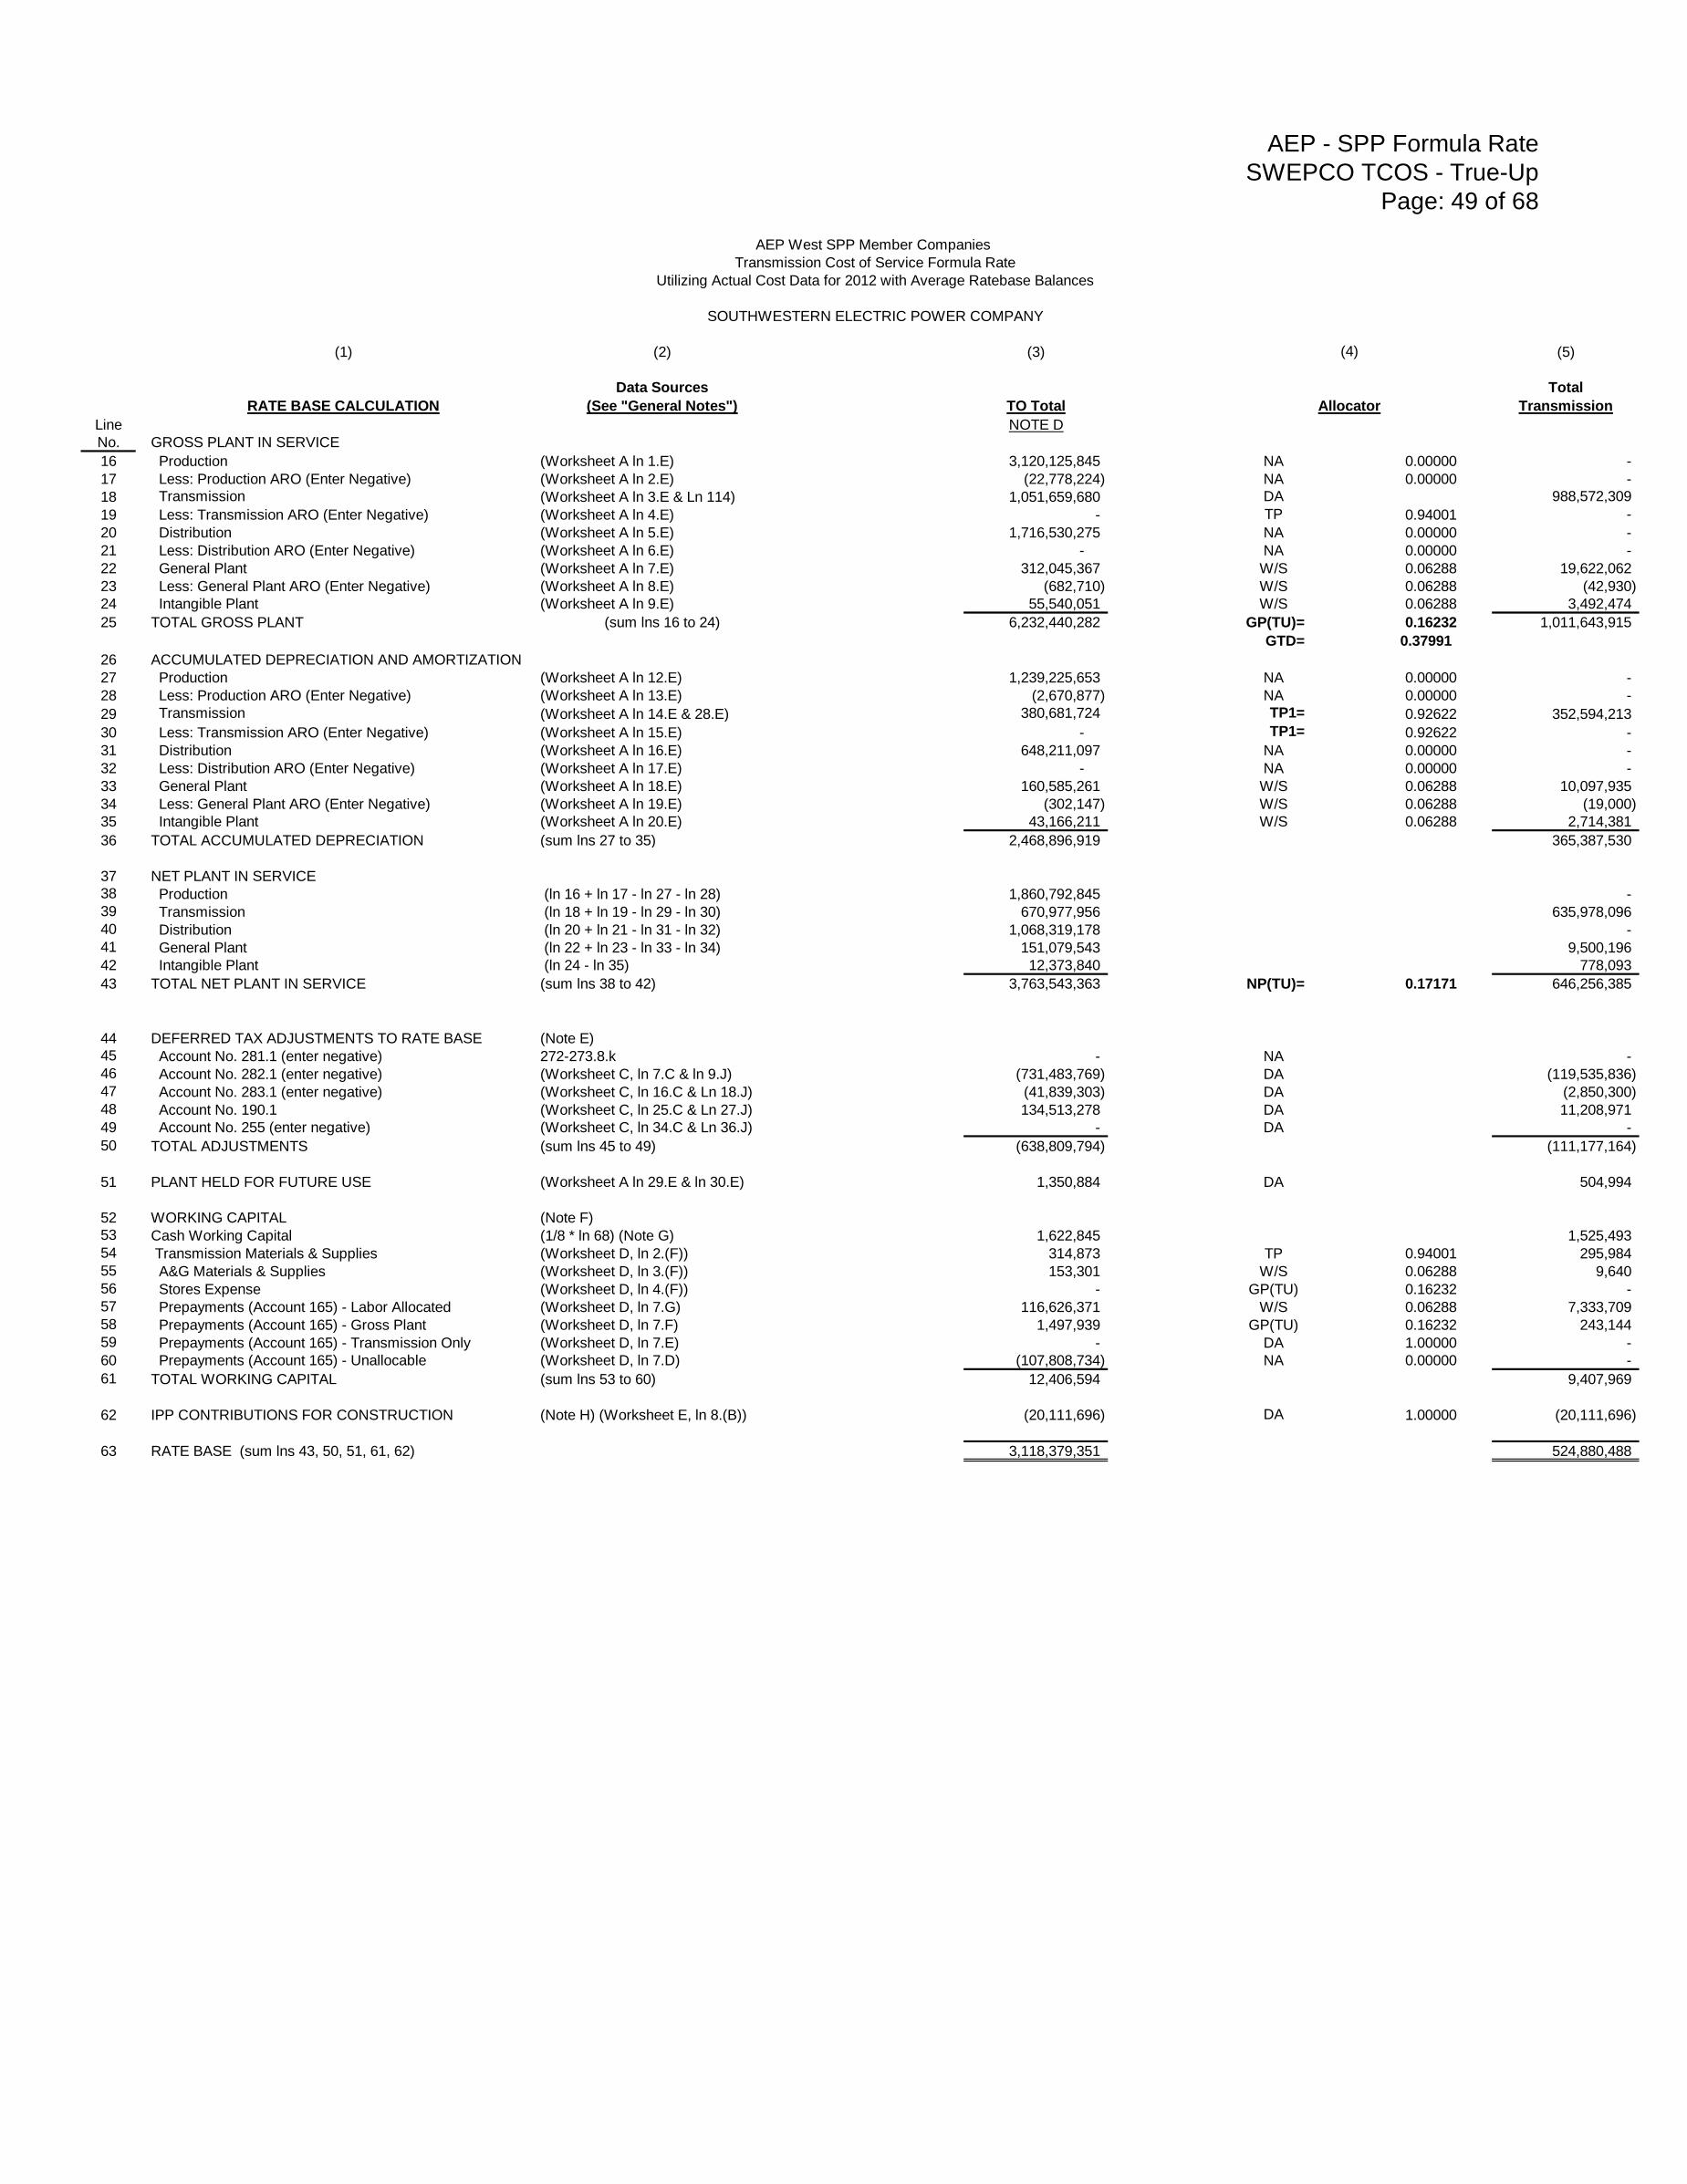
AEP - SPP Formula Rate
SWEPCO TCOS - True-Up
Page: 49 of 68
AEP West SPP Member Companies
Transmission Cost of Service Formula Rate
Utilizing Actual Cost Data for 2012 with Average Ratebase Balances
SOUTHWESTERN ELECTRIC POWER COMPANY
(1) (2) (3) (5)
Data Sources Total
RATE BASE CALCULATION (See "General Notes") TO Total Transmission
Line NOTE D
No. GROSS PLANT IN SERVICE
16 Production (Worksheet A ln 1.E) 3,120,125,845 NA 0.00000 -
17 Less: Production ARO (Enter Negative) (Worksheet A ln 2.E) (22,778,224) NA 0.00000 -
18 Transmission (Worksheet A ln 3.E & Ln 114) 1,051,659,680 DA 988,572,309
19 Less: Transmission ARO (Enter Negative) (Worksheet A ln 4.E) - TP 0.94001 -
20 Distribution (Worksheet A ln 5.E) 1,716,530,275 NA 0.00000 -
21 Less: Distribution ARO (Enter Negative) (Worksheet A ln 6.E) - NA 0.00000 -
22 General Plant (Worksheet A ln 7.E) 312,045,367 W/S 0.06288 19,622,062
23 Less: General Plant ARO (Enter Negative) (Worksheet A ln 8.E) (682,710) W/S 0.06288 (42,930)
24 Intangible Plant (Worksheet A ln 9.E) 55,540,051 W/S 0.06288 3,492,474
25 TOTAL GROSS PLANT (sum lns 16 to 24) 6,232,440,282 GP(TU)= 0.16232 1,011,643,915
GTD= 0.37991
26 ACCUMULATED DEPRECIATION AND AMORTIZATION
27 Production (Worksheet A ln 12.E) 1,239,225,653 NA 0.00000 -
28 Less: Production ARO (Enter Negative) (Worksheet A ln 13.E) (2,670,877) NA 0.00000 -
29 Transmission (Worksheet A ln 14.E & 28.E) 380,681,724 TP1= 0.92622 352,594,213
30 Less: Transmission ARO (Enter Negative) (Worksheet A ln 15.E) - TP1= 0.92622 -
31 Distribution (Worksheet A ln 16.E) 648,211,097 NA 0.00000 -
32 Less: Distribution ARO (Enter Negative) (Worksheet A ln 17.E) - NA 0.00000 -
33 General Plant (Worksheet A ln 18.E) 160,585,261 W/S 0.06288 10,097,935
34 Less: General Plant ARO (Enter Negative) (Worksheet A ln 19.E) (302,147) W/S 0.06288 (19,000)
35 Intangible Plant (Worksheet A ln 20.E) 43,166,211 W/S 0.06288 2,714,381
36 TOTAL ACCUMULATED DEPRECIATION (sum lns 27 to 35) 2,468,896,919 365,387,530
37 NET PLANT IN SERVICE
38 Production (ln 16 + ln 17 - ln 27 - ln 28) 1,860,792,845 -
39 Transmission (ln 18 + ln 19 - ln 29 - ln 30) 670,977,956 635,978,096
40 Distribution (ln 20 + ln 21 - ln 31 - ln 32) 1,068,319,178 -
41 General Plant (ln 22 + ln 23 - ln 33 - ln 34) 151,079,543 9,500,196
42 Intangible Plant (ln 24 - ln 35) 12,373,840 778,093
43 TOTAL NET PLANT IN SERVICE (sum lns 38 to 42) 3,763,543,363 NP(TU)= 0.17171 646,256,385
44 DEFERRED TAX ADJUSTMENTS TO RATE BASE (Note E)
45 Account No. 281.1 (enter negative) 272-273.8.k - NA -
46 Account No. 282.1 (enter negative) (Worksheet C, ln 7.C & ln 9.J) (731,483,769) DA (119,535,836)
47 Account No. 283.1 (enter negative) (Worksheet C, ln 16.C & Ln 18.J) (41,839,303) DA (2,850,300)
48 Account No. 190.1 (Worksheet C, ln 25.C & Ln 27.J) 134,513,278 DA 11,208,971
49 Account No. 255 (enter negative) (Worksheet C, ln 34.C & Ln 36.J) - DA -
50 TOTAL ADJUSTMENTS (sum lns 45 to 49) (638,809,794) (111,177,164)
51 PLANT HELD FOR FUTURE USE (Worksheet A ln 29.E & ln 30.E) 1,350,884 DA 504,994
52 WORKING CAPITAL (Note F)
53 Cash Working Capital (1/8 * ln 68) (Note G) 1,622,845 1,525,493
54 Transmission Materials & Supplies (Worksheet D, ln 2.(F)) 314,873 TP 0.94001 295,984
55 A&G Materials & Supplies (Worksheet D, ln 3.(F)) 153,301 W/S 0.06288 9,640
56 Stores Expense (Worksheet D, ln 4.(F)) - GP(TU) 0.16232 -
57 Prepayments (Account 165) - Labor Allocated (Worksheet D, ln 7.G) 116,626,371 W/S 0.06288 7,333,709
58 Prepayments (Account 165) - Gross Plant (Worksheet D, ln 7.F) 1,497,939 GP(TU) 0.16232 243,144
59 Prepayments (Account 165) - Transmission Only (Worksheet D, ln 7.E) - DA 1.00000 -
60 Prepayments (Account 165) - Unallocable (Worksheet D, ln 7.D) (107,808,734) NA 0.00000 -
61 TOTAL WORKING CAPITAL (sum lns 53 to 60) 12,406,594 9,407,969
62 IPP CONTRIBUTIONS FOR CONSTRUCTION (Note H) (Worksheet E, ln 8.(B)) (20,111,696) DA 1.00000 (20,111,696)
63 RATE BASE (sum lns 43, 50, 51, 61, 62) 3,118,379,351 524,880,488
(4)
Allocator
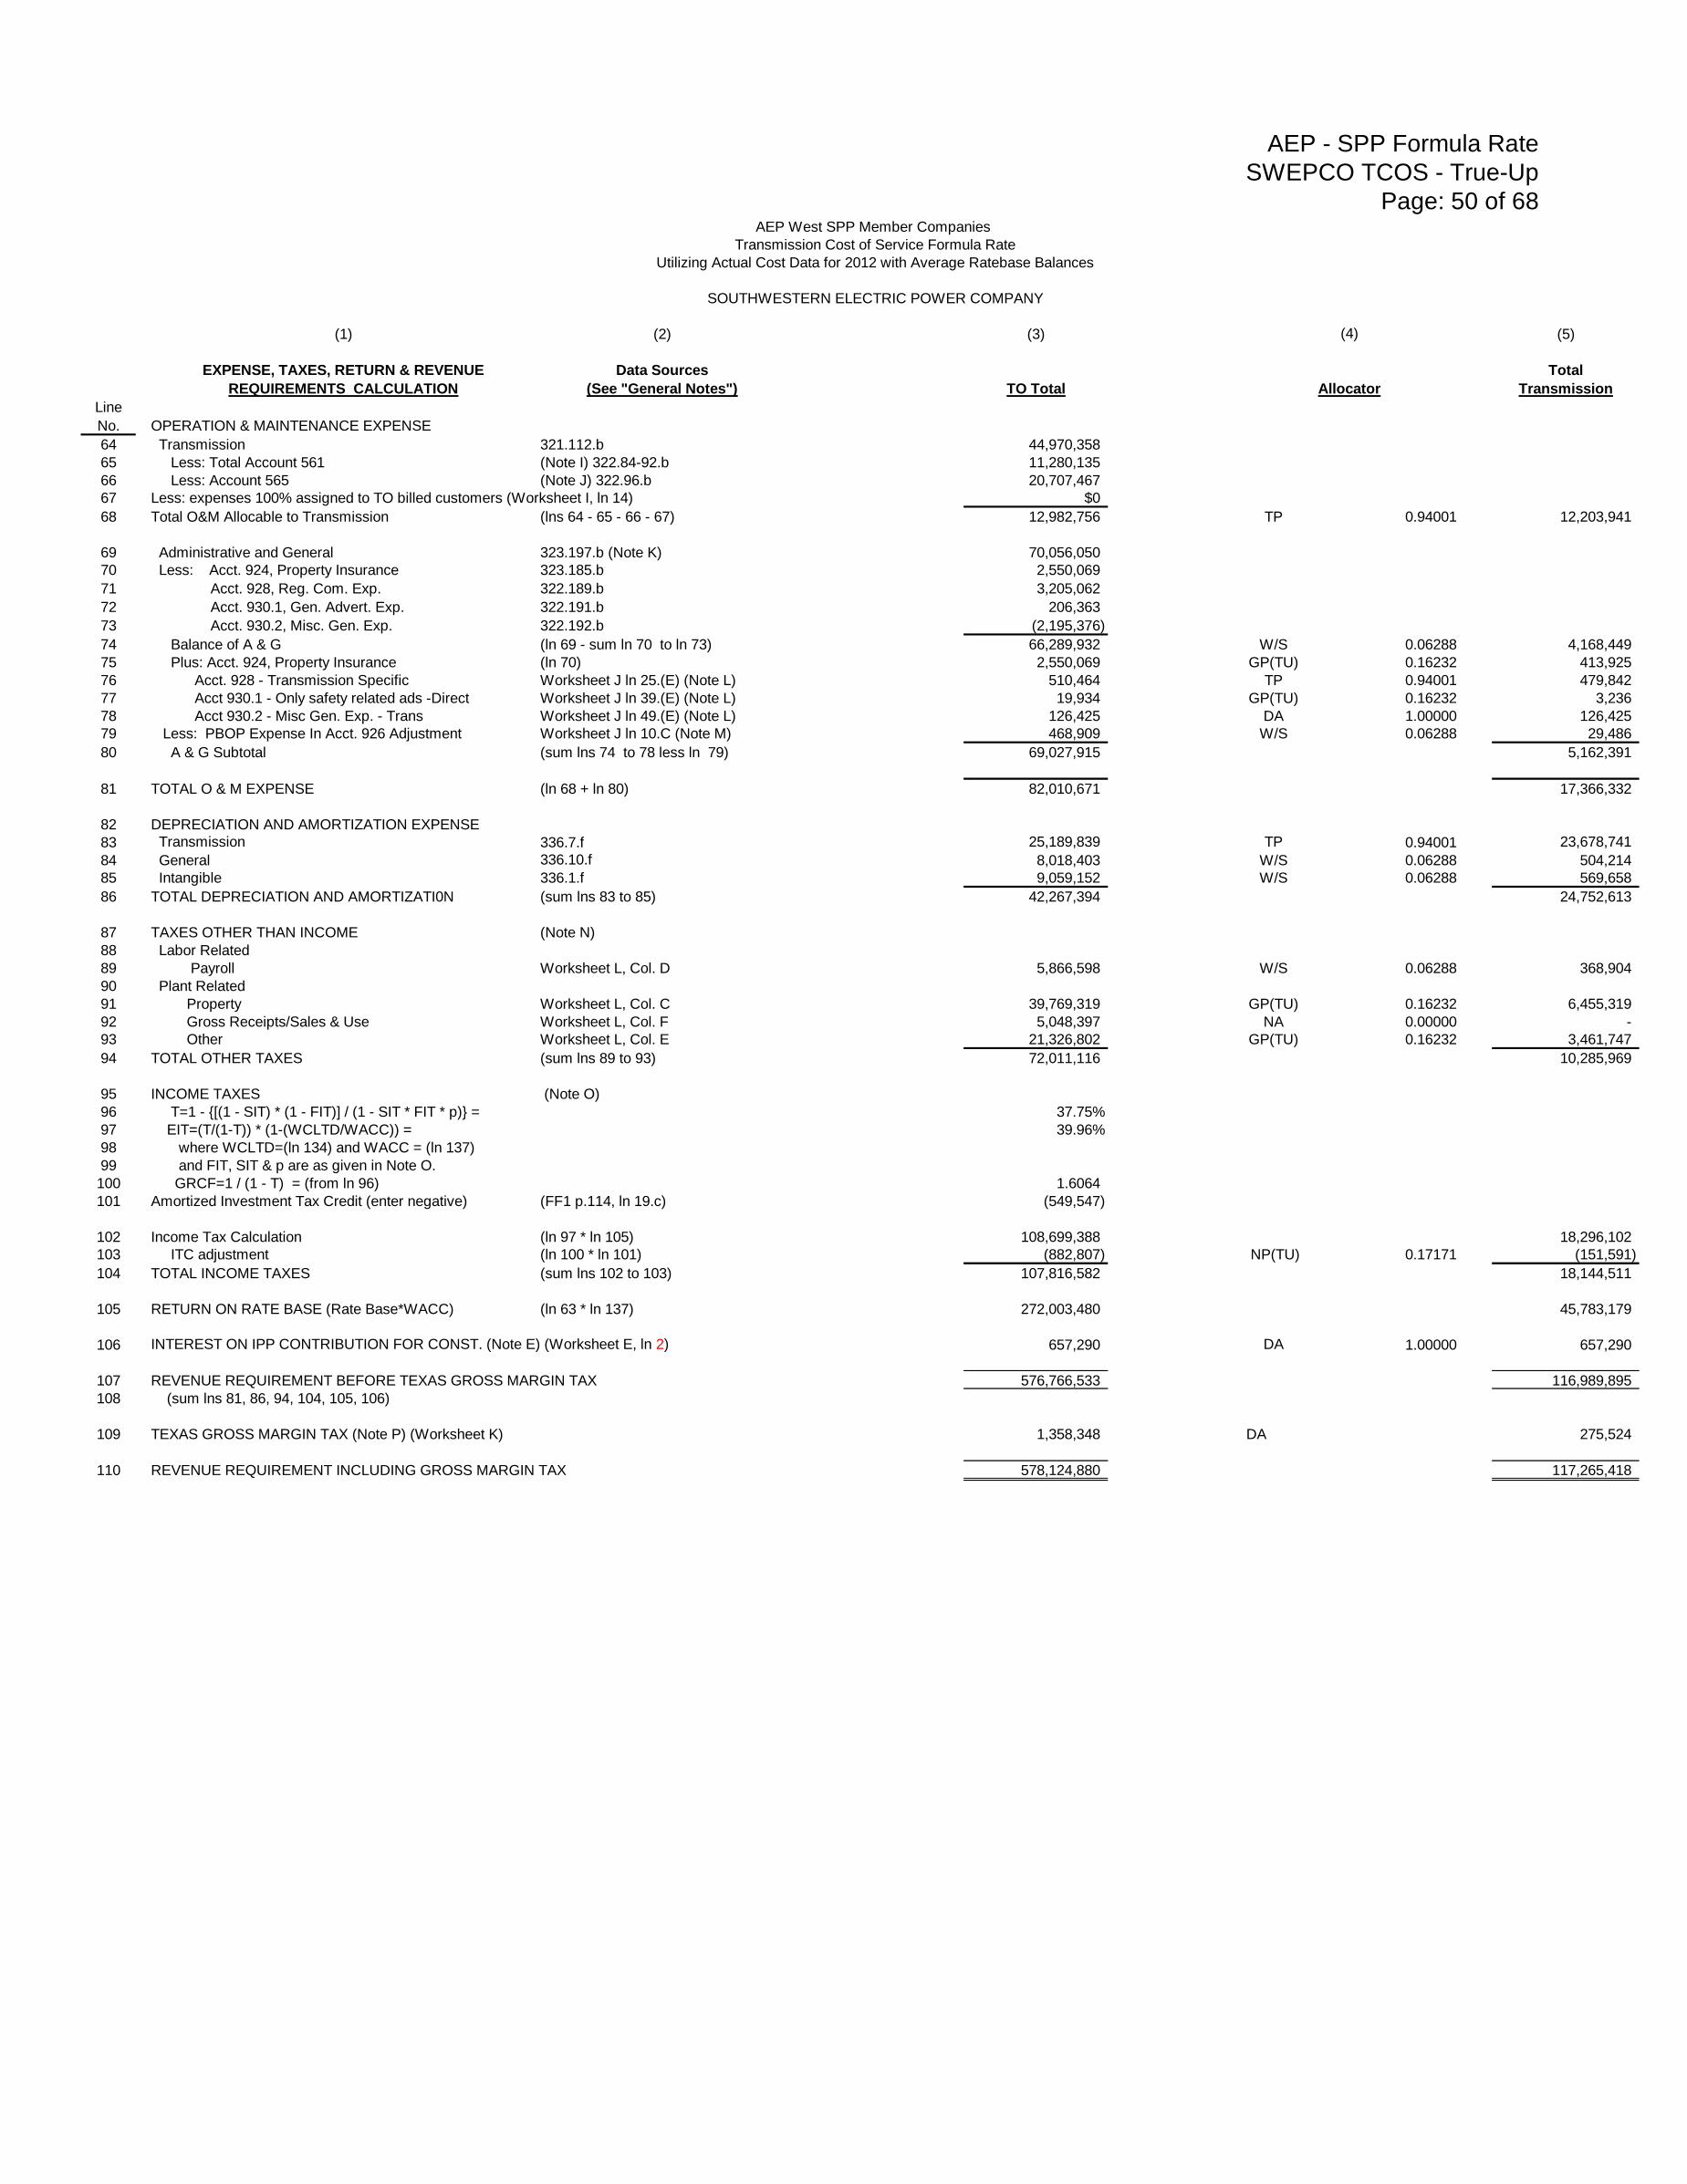
AEP - SPP Formula Rate
SWEPCO TCOS - True-Up
Page: 50 of 68AEP West SPP Member Companies
Transmission Cost of Service Formula Rate
Utilizing Actual Cost Data for 2012 with Average Ratebase Balances
SOUTHWESTERN ELECTRIC POWER COMPANY
(1) (2) (3) (5)
EXPENSE, TAXES, RETURN & REVENUE Data Sources Total
REQUIREMENTS CALCULATION (See "General Notes") TO Total Transmission
Line
No. OPERATION & MAINTENANCE EXPENSE
64 Transmission 321.112.b 44,970,358
65 Less: Total Account 561 (Note I) 322.84-92.b 11,280,135
66 Less: Account 565 (Note J) 322.96.b 20,707,467
67 Less: expenses 100% assigned to TO billed customers (Worksheet I, ln 14) $0
68 Total O&M Allocable to Transmission (lns 64 - 65 - 66 - 67) 12,982,756 TP 0.94001 12,203,941
69 Administrative and General 323.197.b (Note K) 70,056,050
70 Less: Acct. 924, Property Insurance 323.185.b 2,550,069
71 Acct. 928, Reg. Com. Exp. 322.189.b 3,205,062
72 Acct. 930.1, Gen. Advert. Exp. 322.191.b 206,363
73 Acct. 930.2, Misc. Gen. Exp. 322.192.b (2,195,376)
74 Balance of A & G (ln 69 - sum ln 70 to ln 73) 66,289,932 W/S 0.06288 4,168,449
75 Plus: Acct. 924, Property Insurance (ln 70) 2,550,069 GP(TU) 0.16232 413,925
76 Acct. 928 - Transmission Specific Worksheet J ln 25.(E) (Note L) 510,464 TP 0.94001 479,842
77 Acct 930.1 - Only safety related ads -Direct Worksheet J ln 39.(E) (Note L) 19,934 GP(TU) 0.16232 3,236
78 Acct 930.2 - Misc Gen. Exp. - Trans Worksheet J ln 49.(E) (Note L) 126,425 DA 1.00000 126,425
79 Less: PBOP Expense In Acct. 926 Adjustment Worksheet J ln 10.C (Note M) 468,909 W/S 0.06288 29,486
80 A & G Subtotal (sum lns 74 to 78 less ln 79) 69,027,915 5,162,391
81 TOTAL O & M EXPENSE (ln 68 + ln 80) 82,010,671 17,366,332
82 DEPRECIATION AND AMORTIZATION EXPENSE
83 Transmission 336.7.f 25,189,839 TP 0.94001 23,678,741
84 General 336.10.f 8,018,403 W/S 0.06288 504,214
85 Intangible 336.1.f 9,059,152 W/S 0.06288 569,658
86 TOTAL DEPRECIATION AND AMORTIZATI0N (sum lns 83 to 85) 42,267,394 24,752,613
87 TAXES OTHER THAN INCOME (Note N)
88 Labor Related
89 Payroll Worksheet L, Col. D 5,866,598 W/S 0.06288 368,904
90 Plant Related
91 Property Worksheet L, Col. C 39,769,319 GP(TU) 0.16232 6,455,319
92 Gross Receipts/Sales & Use Worksheet L, Col. F 5,048,397 NA 0.00000 -
93 Other Worksheet L, Col. E 21,326,802 GP(TU) 0.16232 3,461,747
94 TOTAL OTHER TAXES (sum lns 89 to 93) 72,011,116 10,285,969
95 INCOME TAXES (Note O)
96 T=1 - {[(1 - SIT) * (1 - FIT)] / (1 - SIT * FIT * p)} = 37.75%
97 EIT=(T/(1-T)) * (1-(WCLTD/WACC)) = 39.96%
98 where WCLTD=(ln 134) and WACC = (ln 137)
99 and FIT, SIT & p are as given in Note O.
100 GRCF=1 / (1 - T) = (from ln 96) 1.6064
101 Amortized Investment Tax Credit (enter negative) (FF1 p.114, ln 19.c) (549,547)
102 Income Tax Calculation (ln 97 * ln 105) 108,699,388 18,296,102
103 ITC adjustment (ln 100 * ln 101) (882,807) NP(TU) 0.17171 (151,591)
104 TOTAL INCOME TAXES (sum lns 102 to 103) 107,816,582 18,144,511
105 RETURN ON RATE BASE (Rate Base*WACC) (ln 63 * ln 137) 272,003,480 45,783,179
106 INTEREST ON IPP CONTRIBUTION FOR CONST. (Note E) (Worksheet E, ln 2) 657,290 DA 1.00000 657,290
107 REVENUE REQUIREMENT BEFORE TEXAS GROSS MARGIN TAX 576,766,533 116,989,895
108 (sum lns 81, 86, 94, 104, 105, 106)
109 TEXAS GROSS MARGIN TAX (Note P) (Worksheet K) 1,358,348 DA 275,524
110 REVENUE REQUIREMENT INCLUDING GROSS MARGIN TAX 578,124,880 117,265,418
(4)
Allocator

AEP - SPP Formula Rate
SWEPCO TCOS - True-Up
Page: 51 of 68AEP West SPP Member Companies
Transmission Cost of Service Formula Rate
Utilizing Actual Cost Data for 2012 with Average Ratebase Balances
SOUTHWESTERN ELECTRIC POWER COMPANY
SUPPORTING CALCULATIONS
ln
No. TRANSMISSION PLANT INCLUDED IN SPP TARIFF
111 Total transmission plant (ln 18) 1,051,659,680
112 Less transmission plant excluded from SPP Tariff (Worksheet A, ln 23a Col. (E)) (Note Q) 38,778,145
113 Less transmission plant included in OATT Ancillary Services (Worksheet A, ln 23, Col. (E)) (Note R) 24,309,226
114 Transmission plant included in SPP Tariff (ln 111 - ln 112 - ln 113) 988,572,309
115 Percent of transmission plant in SPP Tariff (ln 114 / ln 111) TP= 0.94001
116 WAGES & SALARY ALLOCATOR (W/S) (Note S) Direct Payroll
Payroll Billed from
AEP Service Corp. Total
117 Production 354.20.b 32,535,900 11,747,964 44,283,864 NA 0.00000 -
118 Transmission 354.21.b 2,701,085 3,504,350 6,205,435 TP 0.94001 5,833,181
119 Regional Market Expenses 354.22.b 0 0 - NA 0.00000 -
120 Distribution 354.23.b 25,828,696 2,487,976 28,316,672 NA 0.00000 -
121 Other (Excludes A&G) 0 8,228,953 5,728,879 13,957,832 NA 0.00000 -
122 Total (sum lns 117 to 121) 69,294,634 23,469,169 92,763,803 5,833,181
123 Transmission related amount W/S= 0.06288
124 WEIGHTED AVERAGE COST OF CAPITAL (WACC) $
125 Long Term Interest Long Term Interest (Worksheet N, ln. 19, col. (E)) 111,378,570
126 Preferred Dividends Preferred Stock Dividends (Worksheet N, ln. 47, col. (E)) -
127 Development of Common Stock: Average
128 Proprietary Capital (Worksheet N, ln. 1, col. (E)) 1,917,288,612
129 Less Preferred Stock (ln 135) (Worksheet N, ln. 2, col. (E)) -
130 Less Account 216.1 (Worksheet N, ln. 3, col. (E)) 17,939,246
131 Less Account 219 (Worksheet N, ln. 4, col. (E)) (22,339,798)
132 Common Stock (ln 128 - ln 129 - ln 130 - ln 131) 1,921,689,164
Cost
133 2012 Avg Balances Actual Cap Limit (Note S) Weighted
134 Avg Long Term Debt (Worksheet N, ln. 10, col. (E)) 1,822,700,000 48.68% 0.00% 6.11% 0.0297
135 Avg Preferred Stock (Worksheet N, ln. 46, col. (E)) - 0.00% 0.00% 0.00% 0.0000
136 Avg Common Stock (ln 132) (Note U) 1,921,689,164 51.32% 0.00% 11.20% 0.0575
137 Total (sum lns 134 to 136) 3,744,389,164 WACC= 0.0872
138 Capital Structure Equity Limit (Note U) 52.5%
Capital Structure Percentages

AEP - SPP Formula Rate
SWEPCO TCOS - True-Up
Page: 52 of 68AEP West SPP Member Companies
Transmission Cost of Service Formula Rate
Utilizing Actual Cost Data for 2012 with Average Ratebase Balances
SOUTHWESTERN ELECTRIC POWER COMPANY
Letter Notes
General Notes: a) References to data from FERC Form 1 are indicated as: page#.line#.col.#
b) If transmission owner ("TO") functionalizes its costs to transmission on its books, those costs are shown above and on any supporting
workpapers rather than using the allocations above.
A The revenue credits shall include a) amounts received directly from the SPP for PTP transmission services, b) direct assignment charges for transmission facilities,
the cost of which has been included in the TCOS, and c) amounts from customers taking service under grandfathered agreements, where the demand is not included
in the rate divisor. Revenues associated with FERC annual charges, gross receipts taxes, ancillary services or facilities excluded from the TCOS are not included as
revenue credits. Revenue from Transmission Customers whose coincident peak loads are included in the DIVISOR of the load-ratio share calculation are not
included as revenue credits. See Worksheet A for details.
B The annual and monthly net plant carrying charges on page 1 are used to compute the revenue requirement for facilities and any upgrades.
C This additional revenue requirement is determined using a net plant carrying charge (fixed carrying charge or FCR) approach. Worksheet G shows the calculation
of the trued-up revenue requirement for each project, based on an FCR rate caclulated from inputs on this TCOS. Line 15 shows the incremental ARR for
projects receiving incentives as accepted by FERC. These individual additional revenue requirements are summed for the true-up year, and included here.
D
E The total-company balances shown for Accounts 281, 282, 283, 190 only reflect ADIT that relates to utility operations. The balance of Account 255 is reduced by
prior flow throughs and is completely excluded if the utility chose to utilize amortization of tax credits against FIT expense as discussed in Note N. An exception to
this is pre-1971 ITC balances, which are required to be taken as an offset to rate base. Account 281 is not allocated. Transmission allocations are shown on
Worksheet C.
F Identified as being transmission related or functionally booked to transmission.
G Cash Working Capital assigned to transmission is one-eighth of O&M allocated to transmission on line 68.
H Consistent with Paragraph 657 of Order 2003-A, the amount on line is equal to the balance of IPP System Upgrade Credits owed to transmission customers that
made contributions toward the construction of System upgrades, and includes accrued interest and unreturned balance of contributions. The annual interest
expense is included on line 106.
I Removes the expense booked to transmission accounts included in the development of OATT ancillary services rates, including all of Account No. 561.
J Removes cost of transmission service provided by others to the extent such service is not incurred to provide the SPP service at issue.
K General Plant and Administrative & General expenses may be functionalized based on allocators other then the W/S allocator. Full documentation must be provided.
L Expense reported for these A&G accounts will be included in the cost of service only to the extent they are directly assignable to transmission service. Worksheet D allocates
these expense items. Acct 928 Includes Regulatory Commission expenses itemized in FERC Form-1 at page 351, column H. FERC Assessment Fees and Annual Charges
shall not be allocated to transmission. Only safety-related and educational advertising costs in Account 930.1 are included in the TCOS. Account 930.2 includes the
expenses incurred by the transmission function for Associated Business Development revenues given as a credit to the TCOS on Worksheet E.
M
N
O The currently effective income tax rate, where FIT is the Federal income tax rate; SIT is the State income tax rate, and p =
"the percentage of federal income tax deductible for state income taxes". If the utility is taxed in more than one state it must attach a
work paper showing the name of each state and how the blended or composite SIT was developed. Furthermore, a utility that
elected to utilize amortization of tax credits against taxable income, rather than book tax credits to Account No. 255 and reduce
rate base, must reduce its income tax expense by the amount of the Amortized Investment Tax Credit (Form 1, 266.8.f)
(ln 96) multiplied by (1/1-T) . If the applicable tax rates are zero enter 0.
Inputs Required: FIT = 35.00%
SIT= 4.23% (State Income Tax Rate or Composite SIT. Worksheet K)
p = 0.00% (percent of federal income tax deductible for state purposes)
P Effective January 1, 2007, Texas instituted a gross margin tax. This tax is calculated on the Texas allocated revenue of the Company, reduced by 30% to derive a
"Gross Margin" for the Company. The tax rate of one percent is assessed on the resulting amount. The jurisdictional allocator is based on transmission demand allocators.
Q Removes plant excluded from the OATT because it does not meet the SPP's definition of Transmission Facilities or is otherwise ineligible to be recovered under the OATT.
R Removes transmission plant (e.g. step-up transformers) included in the development of OATT ancillary service rates and not already removed for reasons indicated in Note Q.
S Includes functional wages & salaries incurred by parent company service corporation for support of the operating company.
T Long Term Debt cost rate = long-term interest (ln 125) / long term debt (ln 134). Preferred Stock cost rate = preferred dividends (ln 126) / preferred outstanding (ln 135).
Common Stock cost rate (ROE) = 11.2%, the rate accepted by FERC in Docket No. ER07-XXX. It includes an additional 50 basis points for remaining a member of the SPP RTO.
U
The gross plant, accumulated depreciation, and deferred tax balances included in rate base are reduced by the removal of balances related to Asset Retirement Obligations (AROs). This is to comply with
the requirements of FERC Rulemaking RM02-7-000.
This line complies with FERC requirement that Other Post Employment Benefits remain constant from an initial test year. Changes in this base amount can only occur via approval of a 205 filing.
Includes only FICA, unemployment, property and other assessments charged in the current year. Gross Receipts tax, Sales & Use taxes, and taxes related to income are excluded.
Per Settlement, equity is limited to 52.5% of PSO's Capital Structure. If the percentage of equity exceeds the cap, the excess is included in long term debt in the cap structure. This value cannot change prior to 2/1/11. After this date it
can only be changed via an approved 205 or 206 filing.
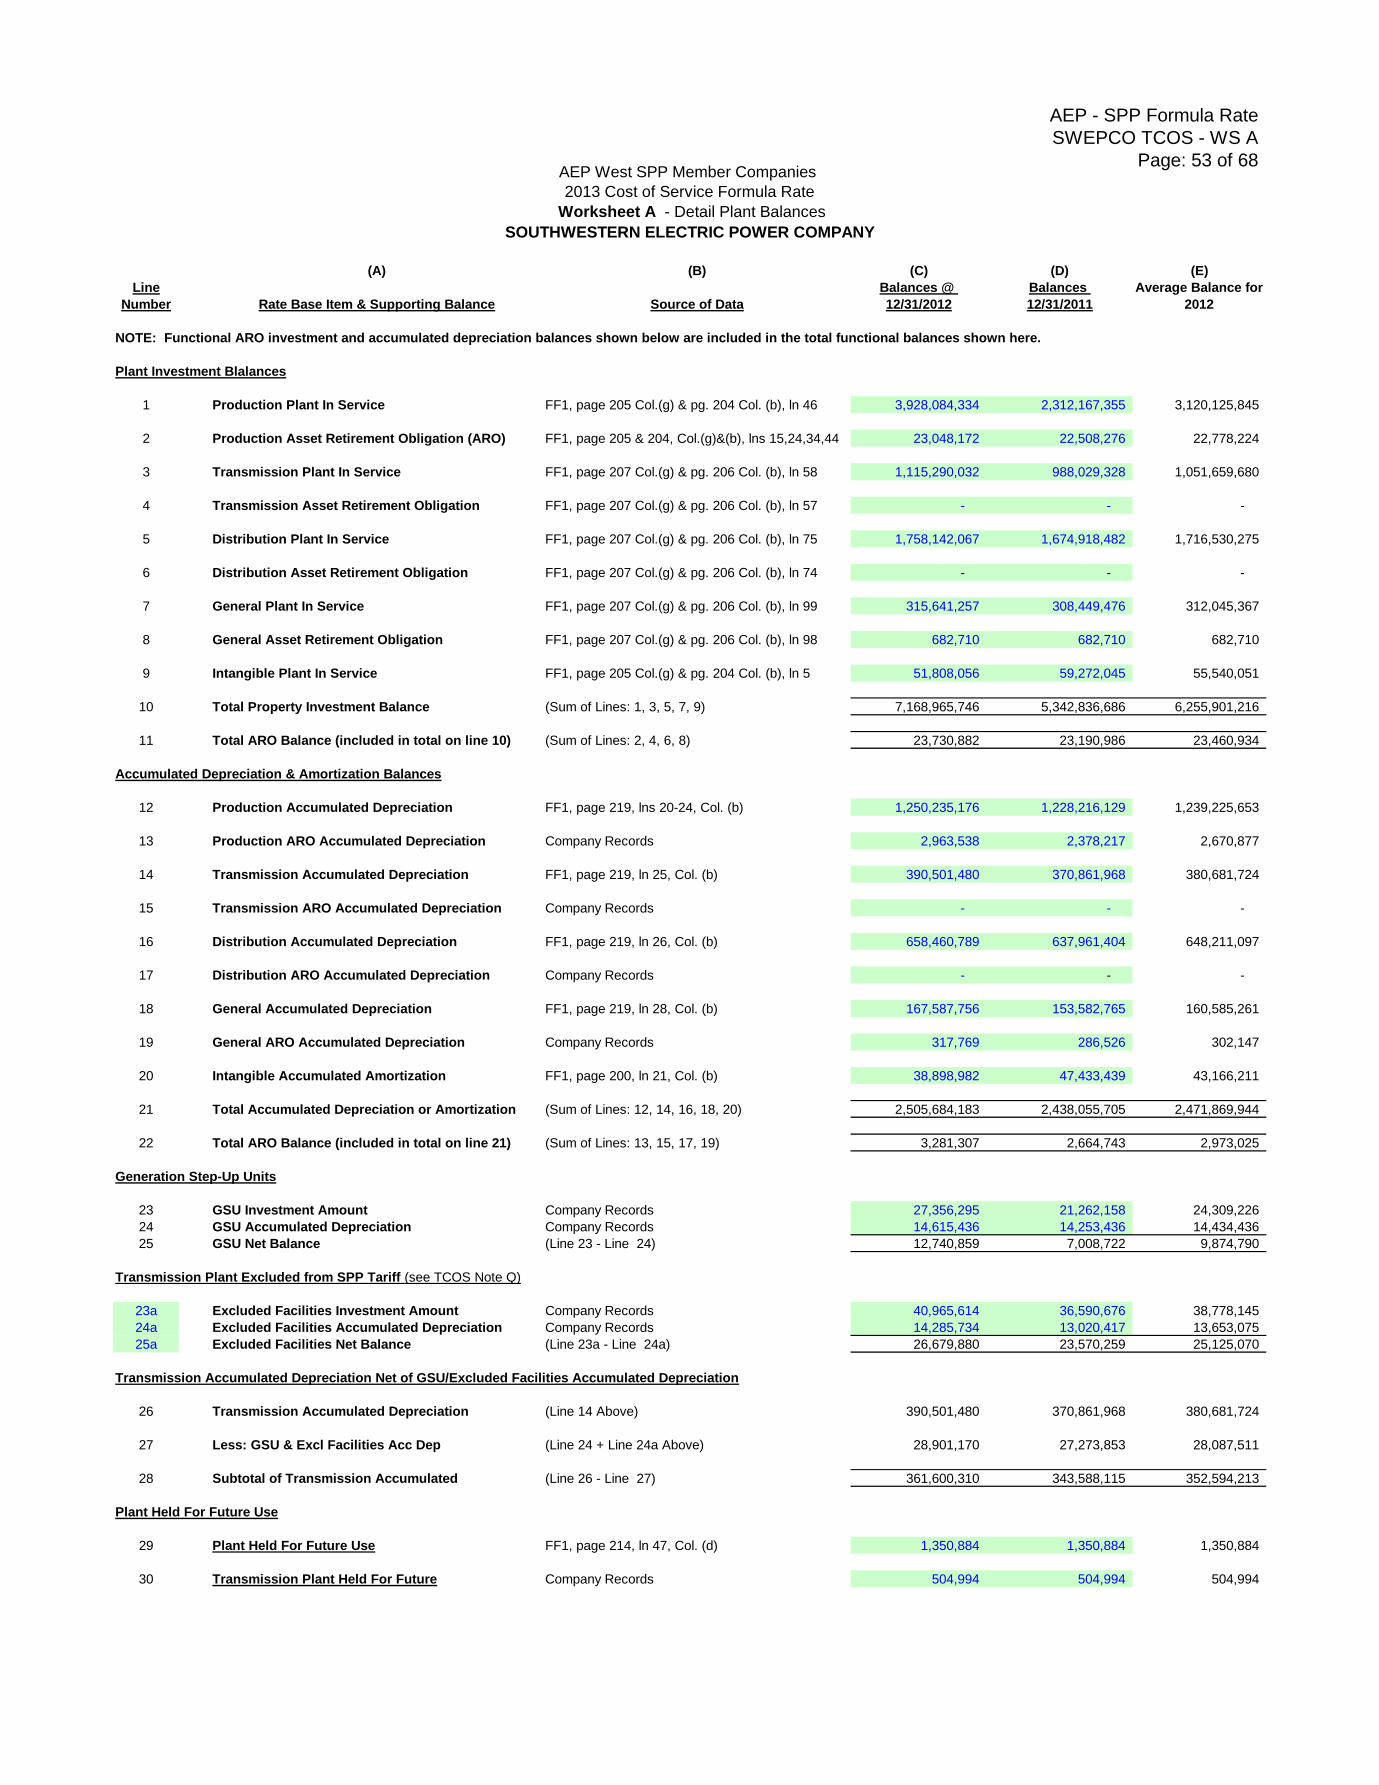
AEP - SPP Formula Rate
SWEPCO TCOS - WS A
Page: 53 of 68
(A) (B) (C) (D) (E)
Line Balances @ Balances
Number Rate Base Item & Supporting Balance Source of Data 12/31/2012 12/31/2011
NOTE: Functional ARO investment and accumulated depreciation balances shown below are included in the total functional balances shown here.
Plant Investment Blalances
1 Production Plant In Service FF1, page 205 Col.(g) & pg. 204 Col. (b), ln 46 3,928,084,334 2,312,167,355 3,120,125,845
2 Production Asset Retirement Obligation (ARO) FF1, page 205 & 204, Col.(g)&(b), lns 15,24,34,44 23,048,172 22,508,276 22,778,224
3 Transmission Plant In Service FF1, page 207 Col.(g) & pg. 206 Col. (b), ln 58 1,115,290,032 988,029,328 1,051,659,680
4 Transmission Asset Retirement Obligation FF1, page 207 Col.(g) & pg. 206 Col. (b), ln 57 - - -
5 Distribution Plant In Service FF1, page 207 Col.(g) & pg. 206 Col. (b), ln 75 1,758,142,067 1,674,918,482 1,716,530,275
6 Distribution Asset Retirement Obligation FF1, page 207 Col.(g) & pg. 206 Col. (b), ln 74 - - -
7 General Plant In Service FF1, page 207 Col.(g) & pg. 206 Col. (b), ln 99 315,641,257 308,449,476 312,045,367
8 General Asset Retirement Obligation FF1, page 207 Col.(g) & pg. 206 Col. (b), ln 98 682,710 682,710 682,710
9 Intangible Plant In Service FF1, page 205 Col.(g) & pg. 204 Col. (b), ln 5 51,808,056 59,272,045 55,540,051
10 Total Property Investment Balance (Sum of Lines: 1, 3, 5, 7, 9) 7,168,965,746 5,342,836,686 6,255,901,216
11 Total ARO Balance (included in total on line 10) (Sum of Lines: 2, 4, 6, 8) 23,730,882 23,190,986 23,460,934
Accumulated Depreciation & Amortization Balances
12 Production Accumulated Depreciation FF1, page 219, lns 20-24, Col. (b) 1,250,235,176 1,228,216,129 1,239,225,653
13 Production ARO Accumulated Depreciation Company Records 2,963,538 2,378,217 2,670,877
14 Transmission Accumulated Depreciation FF1, page 219, ln 25, Col. (b) 390,501,480 370,861,968 380,681,724
15 Transmission ARO Accumulated Depreciation Company Records - - -
16 Distribution Accumulated Depreciation FF1, page 219, ln 26, Col. (b) 658,460,789 637,961,404 648,211,097
17 Distribution ARO Accumulated Depreciation Company Records - - -
18 General Accumulated Depreciation FF1, page 219, ln 28, Col. (b) 167,587,756 153,582,765 160,585,261
19 General ARO Accumulated Depreciation Company Records 317,769 286,526 302,147
20 Intangible Accumulated Amortization FF1, page 200, ln 21, Col. (b) 38,898,982 47,433,439 43,166,211
21 Total Accumulated Depreciation or Amortization (Sum of Lines: 12, 14, 16, 18, 20) 2,505,684,183 2,438,055,705 2,471,869,944
22 Total ARO Balance (included in total on line 21) (Sum of Lines: 13, 15, 17, 19) 3,281,307 2,664,743 2,973,025
Generation Step-Up Units
23 GSU Investment Amount Company Records 27,356,295 21,262,158 24,309,226
24 GSU Accumulated Depreciation Company Records 14,615,436 14,253,436 14,434,436
25 GSU Net Balance (Line 23 - Line 24) 12,740,859 7,008,722 9,874,790
Transmission Plant Excluded from SPP Tariff (see TCOS Note Q)
23a Excluded Facilities Investment Amount Company Records 40,965,614 36,590,676 38,778,145
24a Excluded Facilities Accumulated Depreciation Company Records 14,285,734 13,020,417 13,653,075
25a Excluded Facilities Net Balance (Line 23a - Line 24a) 26,679,880 23,570,259 25,125,070
Transmission Accumulated Depreciation Net of GSU/Excluded Facilities Accumulated Depreciation
26 Transmission Accumulated Depreciation (Line 14 Above) 390,501,480 370,861,968 380,681,724
27 Less: GSU & Excl Facilities Acc Dep (Line 24 + Line 24a Above) 28,901,170 27,273,853 28,087,511
28 Subtotal of Transmission Accumulated (Line 26 - Line 27) 361,600,310 343,588,115 352,594,213
Plant Held For Future Use
29 Plant Held For Future Use FF1, page 214, ln 47, Col. (d) 1,350,884 1,350,884 1,350,884
30 Transmission Plant Held For Future Company Records 504,994 504,994 504,994
Average Balance for
2012
2013 Cost of Service Formula Rate
AEP West SPP Member Companies
Worksheet A - Detail Plant Balances
SOUTHWESTERN ELECTRIC POWER COMPANY
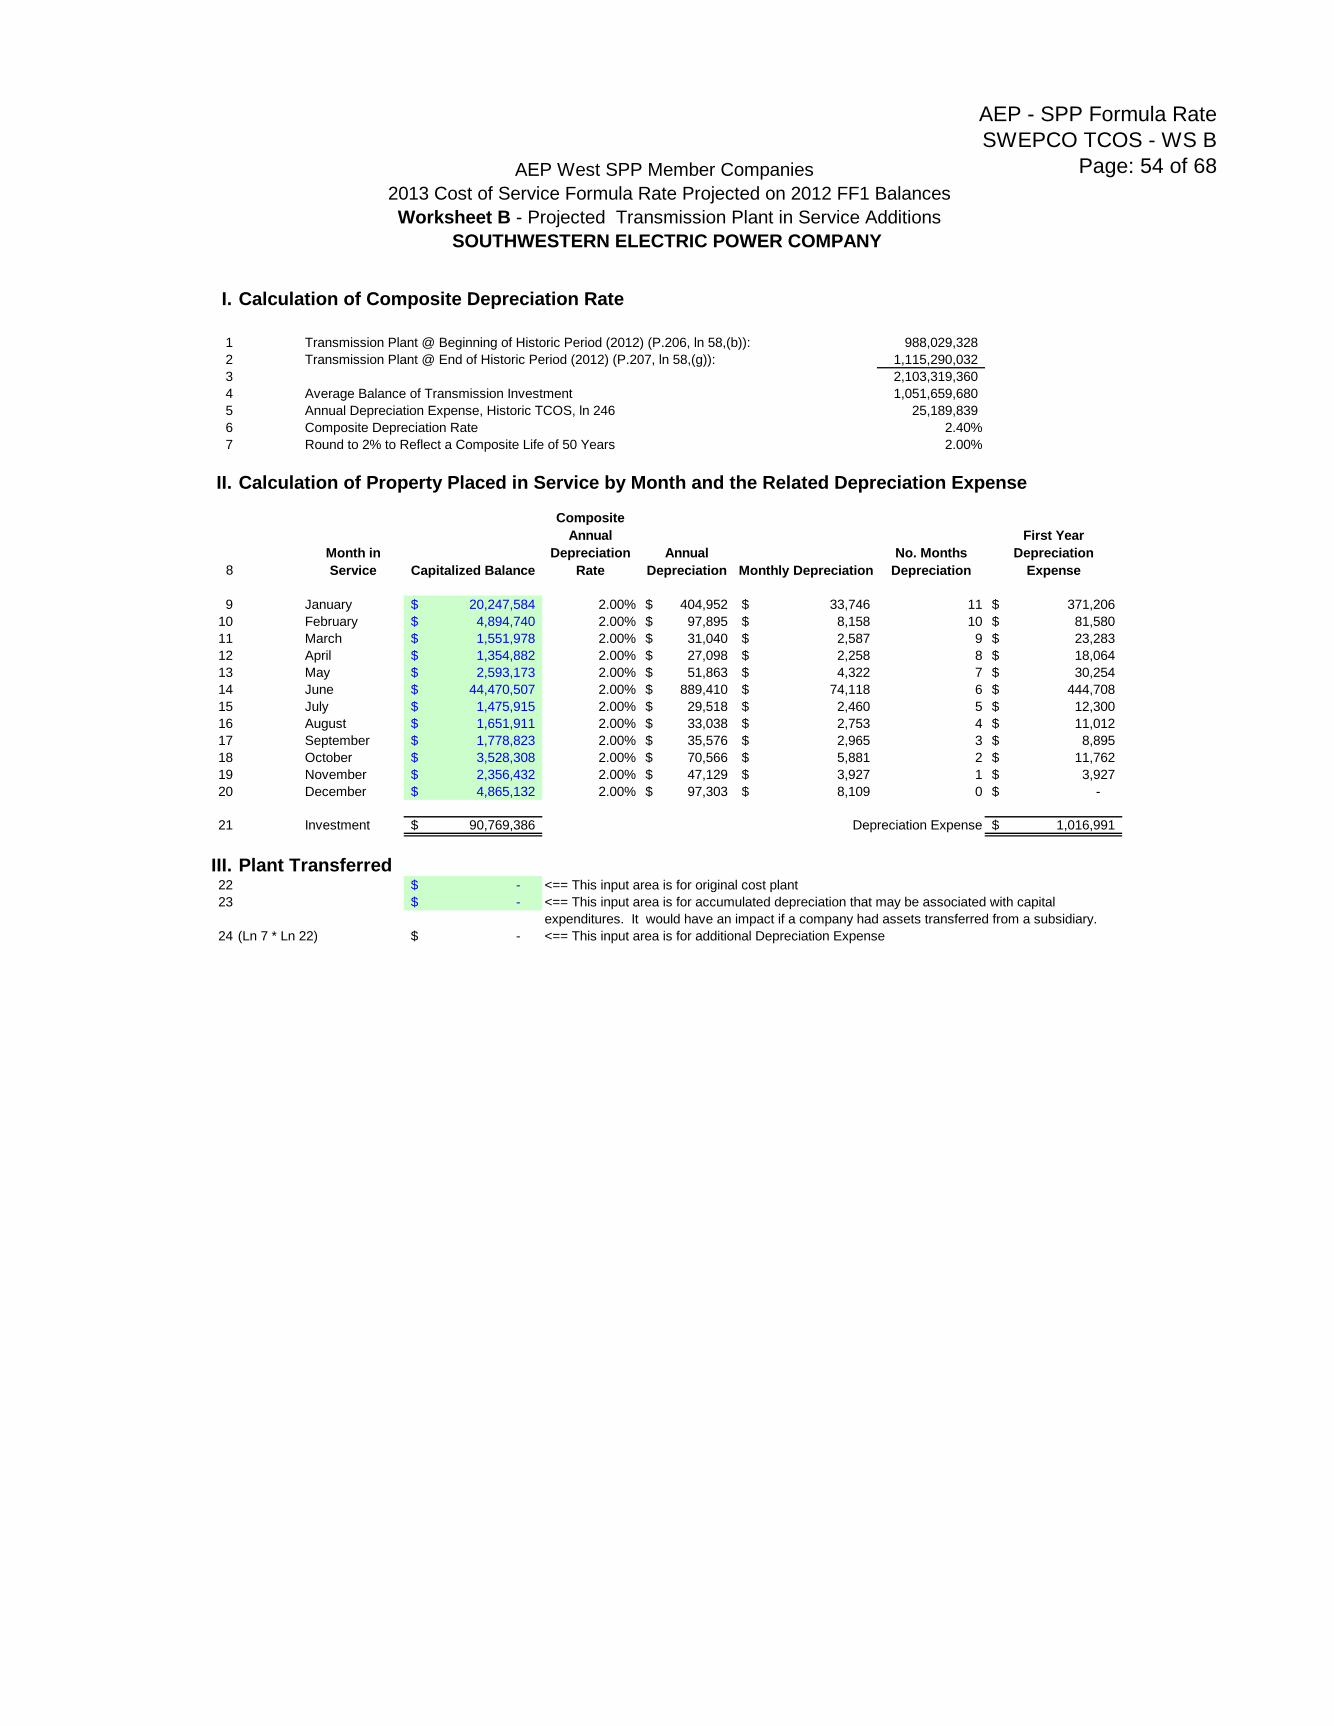
AEP - SPP Formula Rate
SWEPCO TCOS - WS B
Page: 54 of 68
I. Calculation of Composite Depreciation Rate
1 Transmission Plant @ Beginning of Historic Period (2012) (P.206, ln 58,(b)): 988,029,328
2 Transmission Plant @ End of Historic Period (2012) (P.207, ln 58,(g)): 1,115,290,032
3 2,103,319,360
4 Average Balance of Transmission Investment 1,051,659,680
5 Annual Depreciation Expense, Historic TCOS, ln 246 25,189,839
6 Composite Depreciation Rate 2.40%
7 Round to 2% to Reflect a Composite Life of 50 Years 2.00%
II. Calculation of Property Placed in Service by Month and the Related Depreciation Expense
8
Month in
Service Capitalized Balance
Composite
Annual
Depreciation
Rate
Annual
Depreciation Monthly Depreciation
No. Months
Depreciation
First Year
Depreciation
Expense
9 January 20,247,584$ 2.00% 404,952$ 33,746$ 11 371,206$
10 February 4,894,740$ 2.00% 97,895$ 8,158$ 10 81,580$
11 March 1,551,978$ 2.00% 31,040$ 2,587$ 9 23,283$
12 April 1,354,882$ 2.00% 27,098$ 2,258$ 8 18,064$
13 May 2,593,173$ 2.00% 51,863$ 4,322$ 7 30,254$
14 June 44,470,507$ 2.00% 889,410$ 74,118$ 6 444,708$
15 July 1,475,915$ 2.00% 29,518$ 2,460$ 5 12,300$
16 August 1,651,911$ 2.00% 33,038$ 2,753$ 4 11,012$
17 September 1,778,823$ 2.00% 35,576$ 2,965$ 3 8,895$
18 October 3,528,308$ 2.00% 70,566$ 5,881$ 2 11,762$
19 November 2,356,432$ 2.00% 47,129$ 3,927$ 1 3,927$
20 December 4,865,132$ 2.00% 97,303$ 8,109$ 0 -$
21 Investment 90,769,386$ Depreciation Expense 1,016,991$
III. Plant Transferred 22 -$ <== This input area is for original cost plant
23 -$ <== This input area is for accumulated depreciation that may be associated with capital
expenditures. It would have an impact if a company had assets transferred from a subsidiary.
24 (Ln 7 * Ln 22) -$ <== This input area is for additional Depreciation Expense
2013 Cost of Service Formula Rate Projected on 2012 FF1 Balances
AEP West SPP Member Companies
SOUTHWESTERN ELECTRIC POWER COMPANY
Worksheet B - Projected Transmission Plant in Service Additions

AEP - SPP Formula Rate
SWEPCO TCOS - WS C
Page: 55 of 68
(A) (B) (C) (E) (F) (G) (H) (I) (J)
100% PTD Transmission & Total Included
Line Transmission Plant Distribution Labor in Ratebase
No. Acc. No. Description YE Balance Exclusions * Related Related Plant Related Related (E)+(F)+(G)+(H)
Account 282 - Form-1 page 274-275, Ln 2 Col. (k)
282 Balance to Use in Projection1 282.1 2012 Year End Tax Deferrals - Ws C-1 (926,406,626) 786,842 - (927,193,469) - -
2 282.1 Transmission Allocator from Historic TCOS [GP or W/S] 0.0000% 100.0000% 14.9750% 38.8139% 6.2797%
3 282.1 Allocated Total 0 0 (138,847,360) 0 0 (138,847,360)
282 Balance to Use in True-Up4 282.1 2012 Year End Tax Deferrals - Ws C-1 (926,406,626) 786,842 - (927,193,469) - -
5 282.1 2011 Year End Tax Deferrals - Ws C-2 (536,560,912) 10,621,531 - (544,691,859) - (2,490,584)
6 Subtotal (1,462,967,538) 11,408,373 - (1,471,885,328) - (2,490,584)
7 Average Balance (731,483,769) 5,704,186 0 (735,942,664) 0 (1,245,292)8 Transmission Allocator from True-Up TCOS [GP or W/S] 0.0000% 100.0000% 16.2319% 37.9909% 6.2882%
9 Allocated Total 0 0 (119,457,529) 0 (78,307) (119,535,836)
Account 283 - Form-1 page 276-277, Ln 9, Col (k)
283 Balance to Use in Projection10 283.1 2012 Year End Tax Deferrals - Ws C-1 (41,074,933) (9,441,923) - (3,972,018) - (27,660,992)
11 283.1 Transmission Allocator from Historic TCOS [GP or W/S] 0.0000% 100.0000% 14.9750% 38.8139% 6.2797%
12 283.1 Allocated Total 0 0 (594,810) 0 (1,737,029) (2,331,839)
283 Balance to Use in True-Up13 283.1 2012 Year End Tax Deferrals - Ws C-1 (41,074,933) (9,441,923) - (3,972,018) - (27,660,992)
14 283.1 2011 Year End Tax Deferrals - Ws C-2 (42,603,672) (6,255,903) - (10,366,986) - (25,980,783)
15 Subtotal (83,678,605) (15,697,826) - (14,339,004) - (53,641,775)
16 Average Balance (41,839,303) (7,848,913) 0 (7,169,502) 0 (26,820,888)17 Transmission Allocator from True-Up TCOS [GP or W/S] 0.0000% 100.0000% 16.2319% 37.9909% 6.2882%
18 Allocated Total 0 0 (1,163,747) 0 (1,686,553) (2,850,300)
Account 190 - Form-1 page 234, Ln 8, Col. ( c)
190 Balance to Use in Projection19 190.1 2012 Year End Tax Deferrals - Ws C-1 197,640,428 60,880,786 - 128,413,855 - 8,345,787
20 190.1 Transmission Allocator from Historic TCOS [GP or W/S] 0.0000% 100.0000% 14.9750% 38.8139% 6.2797%
21 190.1 Allocated Total 0 0 19,229,994 0 524,091 19,754,085
190 Balance to Use in True-Up22 190.1 2012 Year End Tax Deferrals - Ws C-1 197,640,428 60,880,786 - 128,413,855 - 8,345,787
23 190.1 2011 Year End Tax Deferrals - Ws C-2 71,386,128 60,977,171 - 3,968,222 - 6,440,734
24 Subtotal 269,026,556 121,857,957 - 132,382,077 - 14,786,521
25 Average Balance 134,513,278 60,928,979 0 66,191,039 0 7,393,26026 Transmission Allocator from True-Up TCOS [GP or W/S] 0.0000% 100.0000% 16.2319% 37.9909% 6.2882%
27 Allocated Total 0 0 10,744,068 0 464,904 11,208,971
Account 255 - Form-1 page 266-267
255 Balance to Use in Projection28 255 Acc Defrd ITC - Federal - 12/31/2012 (FF1 p. 267, Ln 2.h) - -
29 255 Transmission Allocator from Historic TCOS [GP or W/S] 14.9750%
30 255 Allocated Total N/A N/A 0 N/A N/A 0
255 Balance to Use in True-Up31 255 Acc Defrd ITC - Federal - 12/31/2012 (FF1 p. 267, Ln 2.h) - -
32 255 Acc Defrd ITC - Federal - 12/31/2011 (FF1 p. 266, Ln 2.b) - -
33 Subtotal - -
34 Average Balance 0 035 Transmission Allocator from True-Up TCOS [GP or W/S] 16.2319%
36 Allocated Total N/A N/A 0 N/A N/A 0
* Exclusions: Non-utility, fuel supply, off-system sales and other items as specified related to costs not included in rates.
Pre 1971 ITC
Includeable in Rate
Base
AEP West SPP Member Companies
2013 Cost of Service Formula Rate
Worksheet C - ADIT Balances used in Projection & True-Up
SOUTHWESTERN ELECTRIC POWER COMPANY
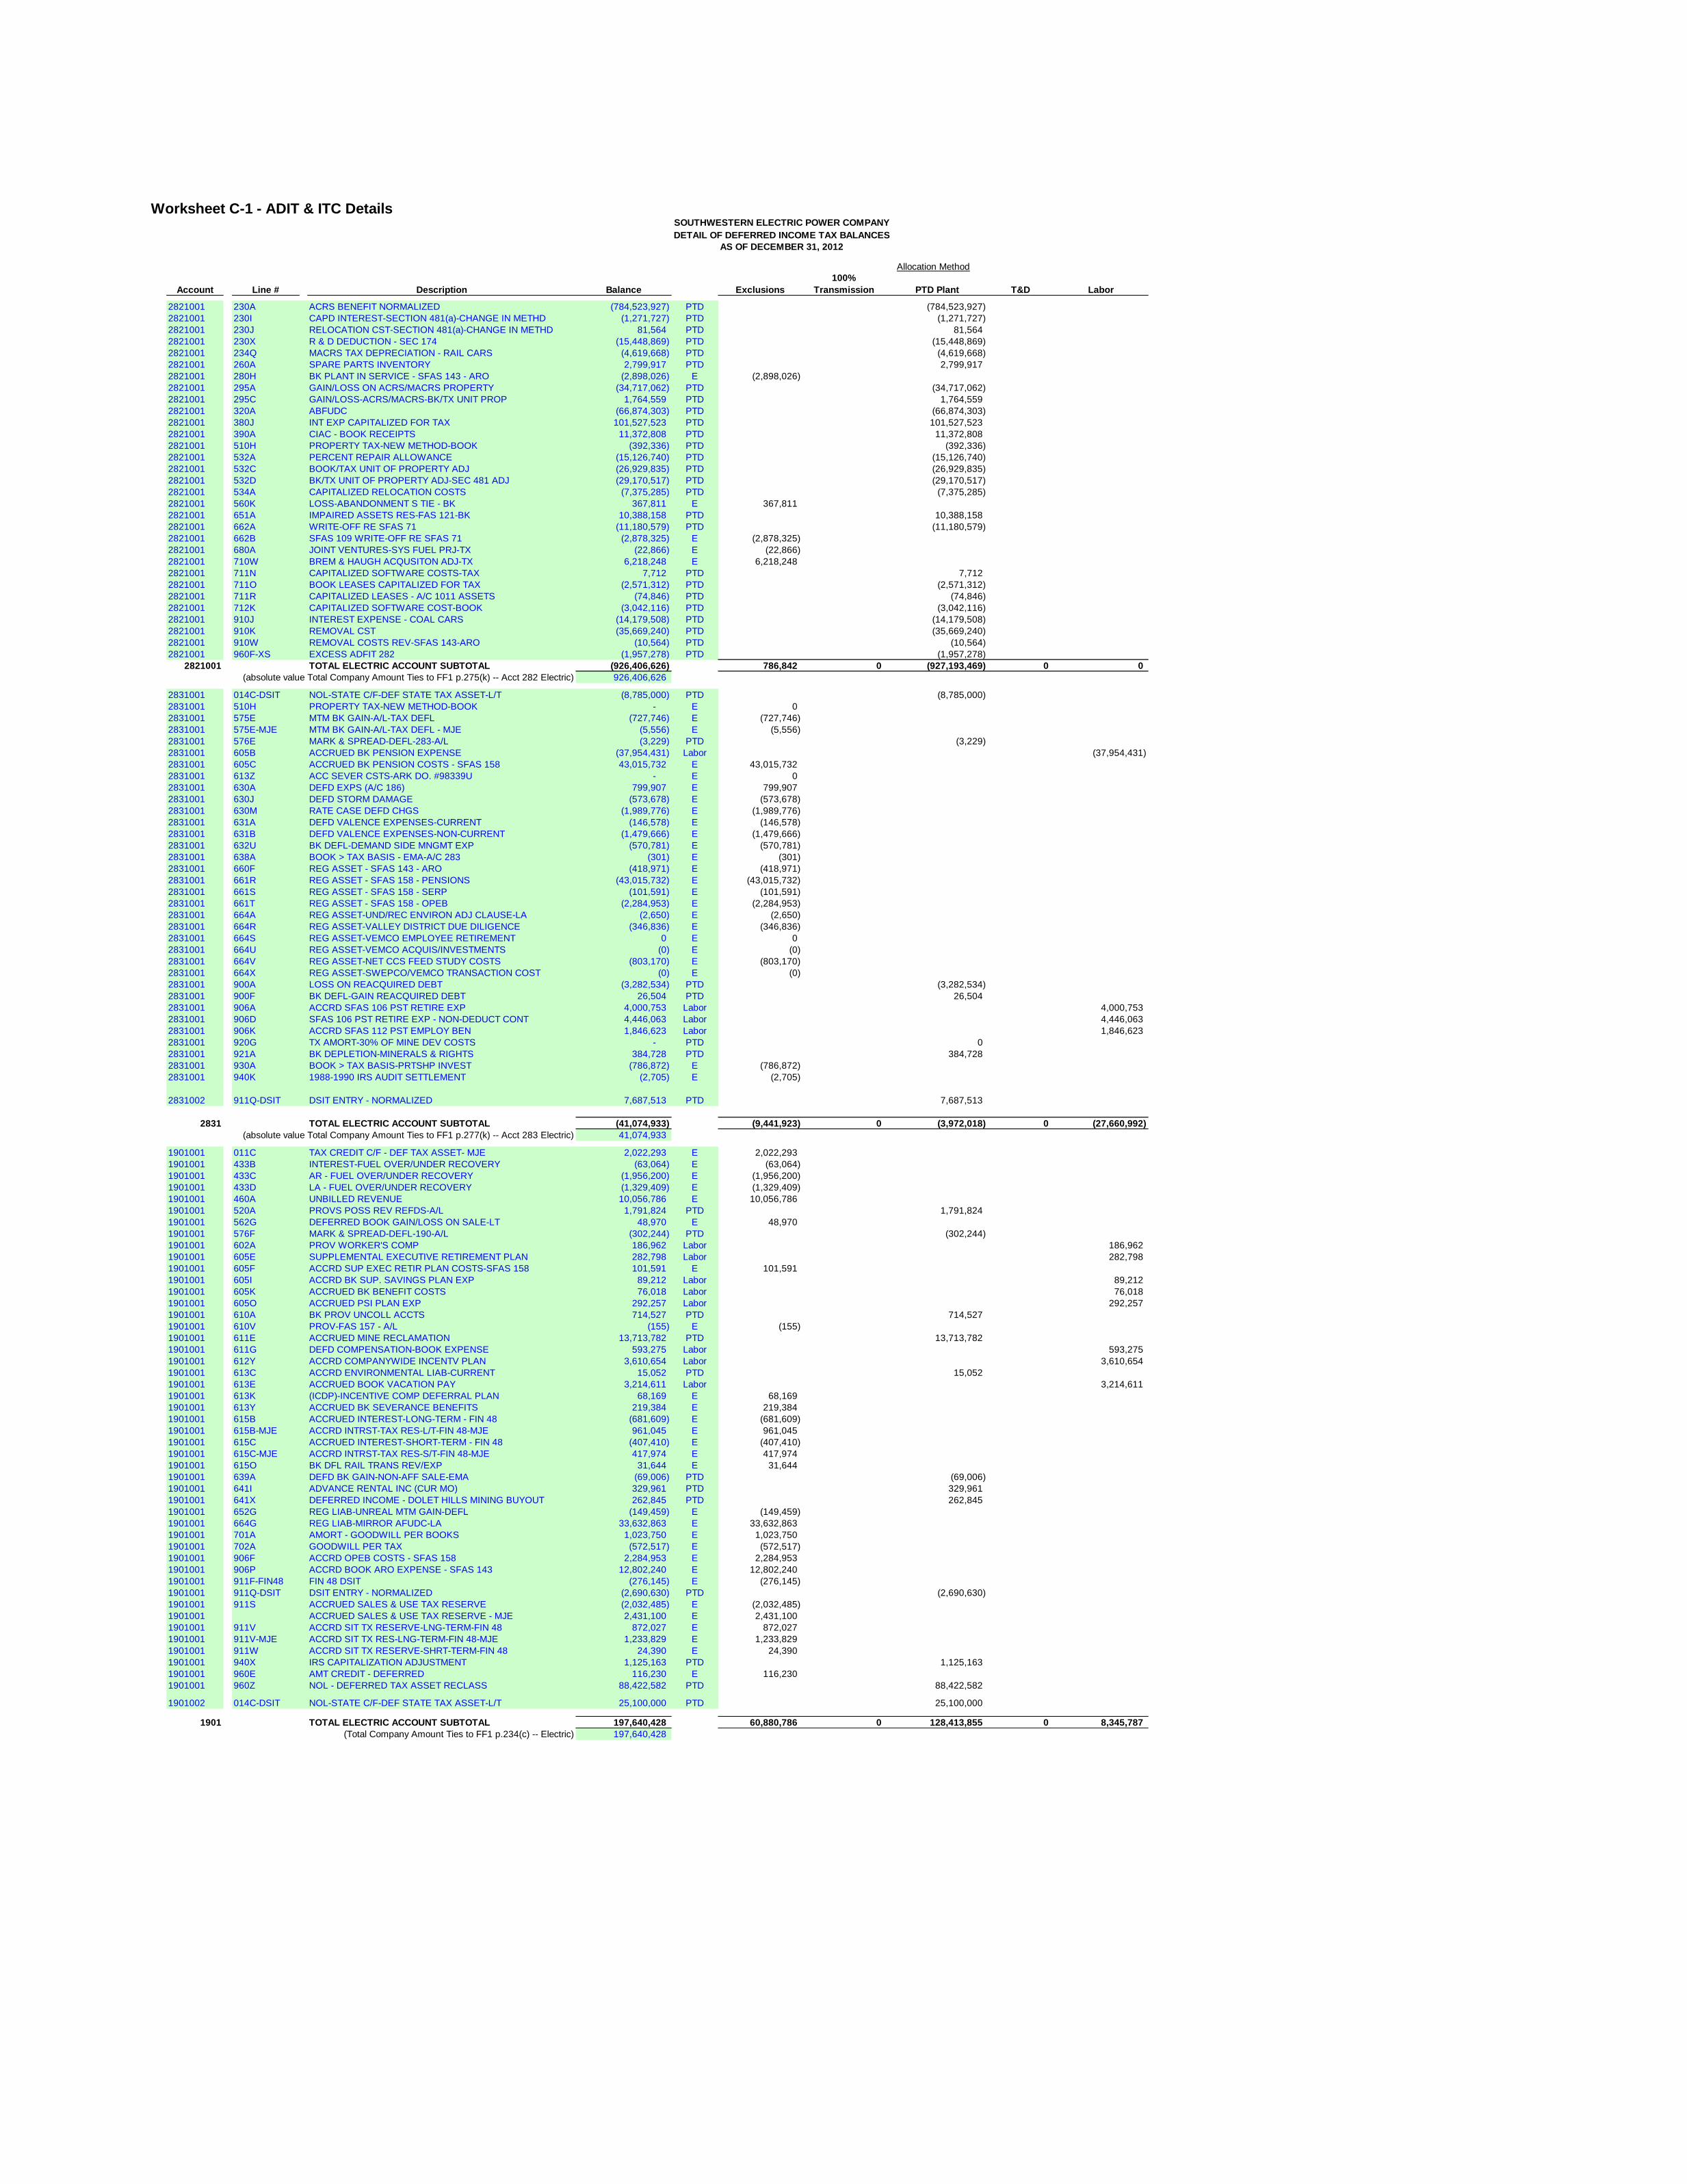
Worksheet C-1 - ADIT & ITC Details
Account Line # Description Balance Exclusions
100%
Transmission PTD Plant T&D Labor
2821001 230A ACRS BENEFIT NORMALIZED (784,523,927) PTD (784,523,927)
2821001 230I CAPD INTEREST-SECTION 481(a)-CHANGE IN METHD (1,271,727) PTD (1,271,727)
2821001 230J RELOCATION CST-SECTION 481(a)-CHANGE IN METHD 81,564 PTD 81,564
2821001 230X R & D DEDUCTION - SEC 174 (15,448,869) PTD (15,448,869)
2821001 234Q MACRS TAX DEPRECIATION - RAIL CARS (4,619,668) PTD (4,619,668)
2821001 260A SPARE PARTS INVENTORY 2,799,917 PTD 2,799,917
2821001 280H BK PLANT IN SERVICE - SFAS 143 - ARO (2,898,026) E (2,898,026)
2821001 295A GAIN/LOSS ON ACRS/MACRS PROPERTY (34,717,062) PTD (34,717,062)
2821001 295C GAIN/LOSS-ACRS/MACRS-BK/TX UNIT PROP 1,764,559 PTD 1,764,559
2821001 320A ABFUDC (66,874,303) PTD (66,874,303)
2821001 380J INT EXP CAPITALIZED FOR TAX 101,527,523 PTD 101,527,523
2821001 390A CIAC - BOOK RECEIPTS 11,372,808 PTD 11,372,808
2821001 510H PROPERTY TAX-NEW METHOD-BOOK (392,336) PTD (392,336)
2821001 532A PERCENT REPAIR ALLOWANCE (15,126,740) PTD (15,126,740)
2821001 532C BOOK/TAX UNIT OF PROPERTY ADJ (26,929,835) PTD (26,929,835)
2821001 532D BK/TX UNIT OF PROPERTY ADJ-SEC 481 ADJ (29,170,517) PTD (29,170,517)
2821001 534A CAPITALIZED RELOCATION COSTS (7,375,285) PTD (7,375,285)
2821001 560K LOSS-ABANDONMENT S TIE - BK 367,811 E 367,811
2821001 651A IMPAIRED ASSETS RES-FAS 121-BK 10,388,158 PTD 10,388,158
2821001 662A WRITE-OFF RE SFAS 71 (11,180,579) PTD (11,180,579)
2821001 662B SFAS 109 WRITE-OFF RE SFAS 71 (2,878,325) E (2,878,325)
2821001 680A JOINT VENTURES-SYS FUEL PRJ-TX (22,866) E (22,866)
2821001 710W BREM & HAUGH ACQUSITON ADJ-TX 6,218,248 E 6,218,248
2821001 711N CAPITALIZED SOFTWARE COSTS-TAX 7,712 PTD 7,712
2821001 711O BOOK LEASES CAPITALIZED FOR TAX (2,571,312) PTD (2,571,312)
2821001 711R CAPITALIZED LEASES - A/C 1011 ASSETS (74,846) PTD (74,846)
2821001 712K CAPITALIZED SOFTWARE COST-BOOK (3,042,116) PTD (3,042,116)
2821001 910J INTEREST EXPENSE - COAL CARS (14,179,508) PTD (14,179,508)
2821001 910K REMOVAL CST (35,669,240) PTD (35,669,240)
2821001 910W REMOVAL COSTS REV-SFAS 143-ARO (10,564) PTD (10,564)
2821001 960F-XS EXCESS ADFIT 282 (1,957,278) PTD (1,957,278)
2821001 TOTAL ELECTRIC ACCOUNT SUBTOTAL (926,406,626) 786,842 0 (927,193,469) 0 0
(absolute value Total Company Amount Ties to FF1 p.275(k) -- Acct 282 Electric) 926,406,626
2831001 014C-DSIT NOL-STATE C/F-DEF STATE TAX ASSET-L/T (8,785,000) PTD (8,785,000)
2831001 510H PROPERTY TAX-NEW METHOD-BOOK - E 0
2831001 575E MTM BK GAIN-A/L-TAX DEFL (727,746) E (727,746)
2831001 575E-MJE MTM BK GAIN-A/L-TAX DEFL - MJE (5,556) E (5,556)
2831001 576E MARK & SPREAD-DEFL-283-A/L (3,229) PTD (3,229)
2831001 605B ACCRUED BK PENSION EXPENSE (37,954,431) Labor (37,954,431)
2831001 605C ACCRUED BK PENSION COSTS - SFAS 158 43,015,732 E 43,015,732
2831001 613Z ACC SEVER CSTS-ARK DO. #98339U - E 0
2831001 630A DEFD EXPS (A/C 186) 799,907 E 799,907
2831001 630J DEFD STORM DAMAGE (573,678) E (573,678)
2831001 630M RATE CASE DEFD CHGS (1,989,776) E (1,989,776)
2831001 631A DEFD VALENCE EXPENSES-CURRENT (146,578) E (146,578)
2831001 631B DEFD VALENCE EXPENSES-NON-CURRENT (1,479,666) E (1,479,666)
2831001 632U BK DEFL-DEMAND SIDE MNGMT EXP (570,781) E (570,781)
2831001 638A BOOK > TAX BASIS - EMA-A/C 283 (301) E (301)
2831001 660F REG ASSET - SFAS 143 - ARO (418,971) E (418,971)
2831001 661R REG ASSET - SFAS 158 - PENSIONS (43,015,732) E (43,015,732)
2831001 661S REG ASSET - SFAS 158 - SERP (101,591) E (101,591)
2831001 661T REG ASSET - SFAS 158 - OPEB (2,284,953) E (2,284,953)
2831001 664A REG ASSET-UND/REC ENVIRON ADJ CLAUSE-LA (2,650) E (2,650)
2831001 664R REG ASSET-VALLEY DISTRICT DUE DILIGENCE (346,836) E (346,836)
2831001 664S REG ASSET-VEMCO EMPLOYEE RETIREMENT 0 E 0
2831001 664U REG ASSET-VEMCO ACQUIS/INVESTMENTS (0) E (0)
2831001 664V REG ASSET-NET CCS FEED STUDY COSTS (803,170) E (803,170)
2831001 664X REG ASSET-SWEPCO/VEMCO TRANSACTION COST (0) E (0)
2831001 900A LOSS ON REACQUIRED DEBT (3,282,534) PTD (3,282,534)
2831001 900F BK DEFL-GAIN REACQUIRED DEBT 26,504 PTD 26,504
2831001 906A ACCRD SFAS 106 PST RETIRE EXP 4,000,753 Labor 4,000,753
2831001 906D SFAS 106 PST RETIRE EXP - NON-DEDUCT CONT 4,446,063 Labor 4,446,063
2831001 906K ACCRD SFAS 112 PST EMPLOY BEN 1,846,623 Labor 1,846,623
2831001 920G TX AMORT-30% OF MINE DEV COSTS - PTD 0
2831001 921A BK DEPLETION-MINERALS & RIGHTS 384,728 PTD 384,728
2831001 930A BOOK > TAX BASIS-PRTSHP INVEST (786,872) E (786,872)
2831001 940K 1988-1990 IRS AUDIT SETTLEMENT (2,705) E (2,705)
2831002 911Q-DSIT DSIT ENTRY - NORMALIZED 7,687,513 PTD 7,687,513
2831 TOTAL ELECTRIC ACCOUNT SUBTOTAL (41,074,933) (9,441,923) 0 (3,972,018) 0 (27,660,992)
(absolute value Total Company Amount Ties to FF1 p.277(k) -- Acct 283 Electric) 41,074,933
1901001 011C TAX CREDIT C/F - DEF TAX ASSET- MJE 2,022,293 E 2,022,293
1901001 433B INTEREST-FUEL OVER/UNDER RECOVERY (63,064) E (63,064)
1901001 433C AR - FUEL OVER/UNDER RECOVERY (1,956,200) E (1,956,200)
1901001 433D LA - FUEL OVER/UNDER RECOVERY (1,329,409) E (1,329,409)
1901001 460A UNBILLED REVENUE 10,056,786 E 10,056,786
1901001 520A PROVS POSS REV REFDS-A/L 1,791,824 PTD 1,791,824
1901001 562G DEFERRED BOOK GAIN/LOSS ON SALE-LT 48,970 E 48,970
1901001 576F MARK & SPREAD-DEFL-190-A/L (302,244) PTD (302,244)
1901001 602A PROV WORKER'S COMP 186,962 Labor 186,962
1901001 605E SUPPLEMENTAL EXECUTIVE RETIREMENT PLAN 282,798 Labor 282,798
1901001 605F ACCRD SUP EXEC RETIR PLAN COSTS-SFAS 158 101,591 E 101,591
1901001 605I ACCRD BK SUP. SAVINGS PLAN EXP 89,212 Labor 89,212
1901001 605K ACCRUED BK BENEFIT COSTS 76,018 Labor 76,018
1901001 605O ACCRUED PSI PLAN EXP 292,257 Labor 292,257
1901001 610A BK PROV UNCOLL ACCTS 714,527 PTD 714,527
1901001 610V PROV-FAS 157 - A/L (155) E (155)
1901001 611E ACCRUED MINE RECLAMATION 13,713,782 PTD 13,713,782
1901001 611G DEFD COMPENSATION-BOOK EXPENSE 593,275 Labor 593,275
1901001 612Y ACCRD COMPANYWIDE INCENTV PLAN 3,610,654 Labor 3,610,654
1901001 613C ACCRD ENVIRONMENTAL LIAB-CURRENT 15,052 PTD 15,052
1901001 613E ACCRUED BOOK VACATION PAY 3,214,611 Labor 3,214,611
1901001 613K (ICDP)-INCENTIVE COMP DEFERRAL PLAN 68,169 E 68,169
1901001 613Y ACCRUED BK SEVERANCE BENEFITS 219,384 E 219,384
1901001 615B ACCRUED INTEREST-LONG-TERM - FIN 48 (681,609) E (681,609)
1901001 615B-MJE ACCRD INTRST-TAX RES-L/T-FIN 48-MJE 961,045 E 961,045
1901001 615C ACCRUED INTEREST-SHORT-TERM - FIN 48 (407,410) E (407,410)
1901001 615C-MJE ACCRD INTRST-TAX RES-S/T-FIN 48-MJE 417,974 E 417,974
1901001 615O BK DFL RAIL TRANS REV/EXP 31,644 E 31,644
1901001 639A DEFD BK GAIN-NON-AFF SALE-EMA (69,006) PTD (69,006)
1901001 641I ADVANCE RENTAL INC (CUR MO) 329,961 PTD 329,961
1901001 641X DEFERRED INCOME - DOLET HILLS MINING BUYOUT 262,845 PTD 262,845
1901001 652G REG LIAB-UNREAL MTM GAIN-DEFL (149,459) E (149,459)
1901001 664G REG LIAB-MIRROR AFUDC-LA 33,632,863 E 33,632,863
1901001 701A AMORT - GOODWILL PER BOOKS 1,023,750 E 1,023,750
1901001 702A GOODWILL PER TAX (572,517) E (572,517)
1901001 906F ACCRD OPEB COSTS - SFAS 158 2,284,953 E 2,284,953
1901001 906P ACCRD BOOK ARO EXPENSE - SFAS 143 12,802,240 E 12,802,240
1901001 911F-FIN48 FIN 48 DSIT (276,145) E (276,145)
1901001 911Q-DSIT DSIT ENTRY - NORMALIZED (2,690,630) PTD (2,690,630)
1901001 911S ACCRUED SALES & USE TAX RESERVE (2,032,485) E (2,032,485)
1901001 ACCRUED SALES & USE TAX RESERVE - MJE 2,431,100 E 2,431,100
1901001 911V ACCRD SIT TX RESERVE-LNG-TERM-FIN 48 872,027 E 872,027
1901001 911V-MJE ACCRD SIT TX RES-LNG-TERM-FIN 48-MJE 1,233,829 E 1,233,829
1901001 911W ACCRD SIT TX RESERVE-SHRT-TERM-FIN 48 24,390 E 24,390
1901001 940X IRS CAPITALIZATION ADJUSTMENT 1,125,163 PTD 1,125,163
1901001 960E AMT CREDIT - DEFERRED 116,230 E 116,230
1901001 960Z NOL - DEFERRED TAX ASSET RECLASS 88,422,582 PTD 88,422,582
1901002 014C-DSIT NOL-STATE C/F-DEF STATE TAX ASSET-L/T 25,100,000 PTD 25,100,000
1901 TOTAL ELECTRIC ACCOUNT SUBTOTAL 197,640,428 60,880,786 0 128,413,855 0 8,345,787
(Total Company Amount Ties to FF1 p.234(c) -- Electric) 197,640,428
SOUTHWESTERN ELECTRIC POWER COMPANY
DETAIL OF DEFERRED INCOME TAX BALANCES
AS OF DECEMBER 31, 2012
Allocation Method
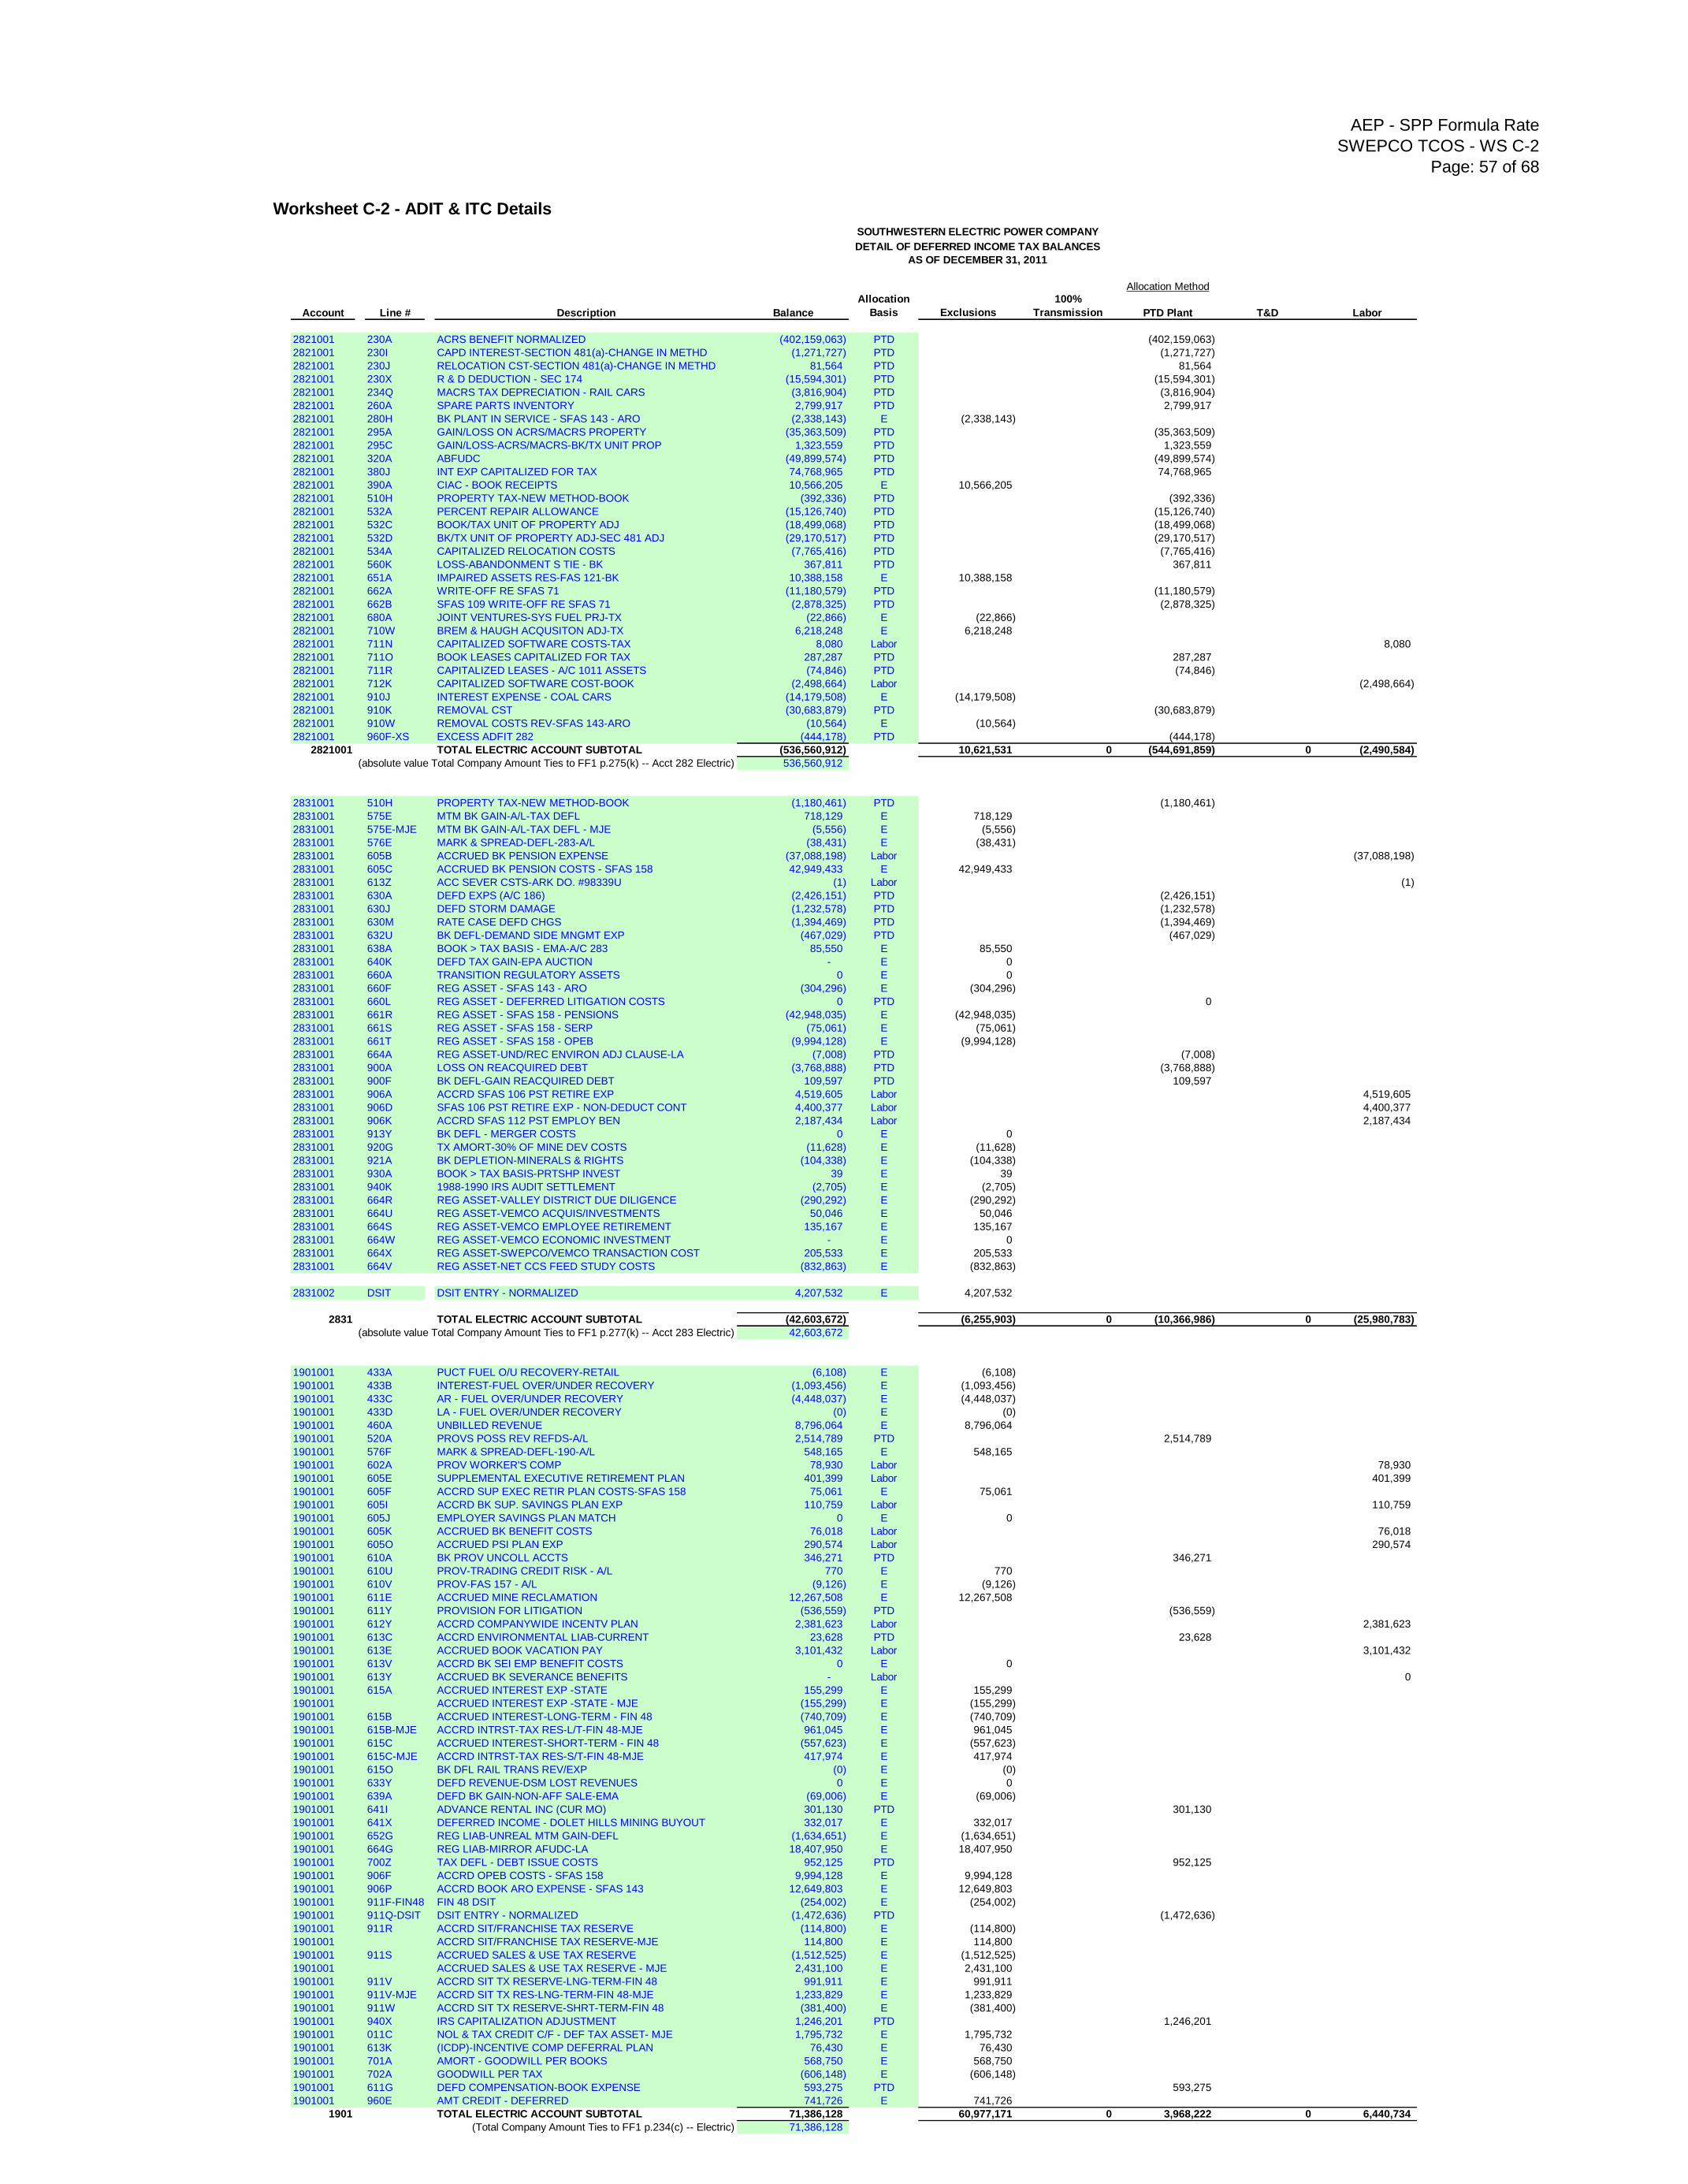
AEP - SPP Formula Rate
SWEPCO TCOS - WS C-2
Page: 57 of 68
Worksheet C-2 - ADIT & ITC Details
Account Line # Description Balance
Allocation
Basis Exclusions
100%
Transmission PTD Plant T&D Labor
2821001 230A ACRS BENEFIT NORMALIZED (402,159,063) PTD (402,159,063)
2821001 230I CAPD INTEREST-SECTION 481(a)-CHANGE IN METHD (1,271,727) PTD (1,271,727)
2821001 230J RELOCATION CST-SECTION 481(a)-CHANGE IN METHD 81,564 PTD 81,564
2821001 230X R & D DEDUCTION - SEC 174 (15,594,301) PTD (15,594,301)
2821001 234Q MACRS TAX DEPRECIATION - RAIL CARS (3,816,904) PTD (3,816,904)
2821001 260A SPARE PARTS INVENTORY 2,799,917 PTD 2,799,917
2821001 280H BK PLANT IN SERVICE - SFAS 143 - ARO (2,338,143) E (2,338,143)
2821001 295A GAIN/LOSS ON ACRS/MACRS PROPERTY (35,363,509) PTD (35,363,509)
2821001 295C GAIN/LOSS-ACRS/MACRS-BK/TX UNIT PROP 1,323,559 PTD 1,323,559
2821001 320A ABFUDC (49,899,574) PTD (49,899,574)
2821001 380J INT EXP CAPITALIZED FOR TAX 74,768,965 PTD 74,768,965
2821001 390A CIAC - BOOK RECEIPTS 10,566,205 E 10,566,205
2821001 510H PROPERTY TAX-NEW METHOD-BOOK (392,336) PTD (392,336)
2821001 532A PERCENT REPAIR ALLOWANCE (15,126,740) PTD (15,126,740)
2821001 532C BOOK/TAX UNIT OF PROPERTY ADJ (18,499,068) PTD (18,499,068)
2821001 532D BK/TX UNIT OF PROPERTY ADJ-SEC 481 ADJ (29,170,517) PTD (29,170,517)
2821001 534A CAPITALIZED RELOCATION COSTS (7,765,416) PTD (7,765,416)
2821001 560K LOSS-ABANDONMENT S TIE - BK 367,811 PTD 367,811
2821001 651A IMPAIRED ASSETS RES-FAS 121-BK 10,388,158 E 10,388,158
2821001 662A WRITE-OFF RE SFAS 71 (11,180,579) PTD (11,180,579)
2821001 662B SFAS 109 WRITE-OFF RE SFAS 71 (2,878,325) PTD (2,878,325)
2821001 680A JOINT VENTURES-SYS FUEL PRJ-TX (22,866) E (22,866)
2821001 710W BREM & HAUGH ACQUSITON ADJ-TX 6,218,248 E 6,218,248
2821001 711N CAPITALIZED SOFTWARE COSTS-TAX 8,080 Labor 8,080
2821001 711O BOOK LEASES CAPITALIZED FOR TAX 287,287 PTD 287,287
2821001 711R CAPITALIZED LEASES - A/C 1011 ASSETS (74,846) PTD (74,846)
2821001 712K CAPITALIZED SOFTWARE COST-BOOK (2,498,664) Labor (2,498,664)
2821001 910J INTEREST EXPENSE - COAL CARS (14,179,508) E (14,179,508)
2821001 910K REMOVAL CST (30,683,879) PTD (30,683,879)
2821001 910W REMOVAL COSTS REV-SFAS 143-ARO (10,564) E (10,564)
2821001 960F-XS EXCESS ADFIT 282 (444,178) PTD (444,178)
2821001 TOTAL ELECTRIC ACCOUNT SUBTOTAL (536,560,912) 10,621,531 0 (544,691,859) 0 (2,490,584)
(absolute value Total Company Amount Ties to FF1 p.275(k) -- Acct 282 Electric) 536,560,912
2831001 510H PROPERTY TAX-NEW METHOD-BOOK (1,180,461) PTD (1,180,461)
2831001 575E MTM BK GAIN-A/L-TAX DEFL 718,129 E 718,129
2831001 575E-MJE MTM BK GAIN-A/L-TAX DEFL - MJE (5,556) E (5,556)
2831001 576E MARK & SPREAD-DEFL-283-A/L (38,431) E (38,431)
2831001 605B ACCRUED BK PENSION EXPENSE (37,088,198) Labor (37,088,198)
2831001 605C ACCRUED BK PENSION COSTS - SFAS 158 42,949,433 E 42,949,433
2831001 613Z ACC SEVER CSTS-ARK DO. #98339U (1) Labor (1)
2831001 630A DEFD EXPS (A/C 186) (2,426,151) PTD (2,426,151)
2831001 630J DEFD STORM DAMAGE (1,232,578) PTD (1,232,578)
2831001 630M RATE CASE DEFD CHGS (1,394,469) PTD (1,394,469)
2831001 632U BK DEFL-DEMAND SIDE MNGMT EXP (467,029) PTD (467,029)
2831001 638A BOOK > TAX BASIS - EMA-A/C 283 85,550 E 85,550
2831001 640K DEFD TAX GAIN-EPA AUCTION - E 0
2831001 660A TRANSITION REGULATORY ASSETS 0 E 0
2831001 660F REG ASSET - SFAS 143 - ARO (304,296) E (304,296)
2831001 660L REG ASSET - DEFERRED LITIGATION COSTS 0 PTD 0
2831001 661R REG ASSET - SFAS 158 - PENSIONS (42,948,035) E (42,948,035)
2831001 661S REG ASSET - SFAS 158 - SERP (75,061) E (75,061)
2831001 661T REG ASSET - SFAS 158 - OPEB (9,994,128) E (9,994,128)
2831001 664A REG ASSET-UND/REC ENVIRON ADJ CLAUSE-LA (7,008) PTD (7,008)
2831001 900A LOSS ON REACQUIRED DEBT (3,768,888) PTD (3,768,888)
2831001 900F BK DEFL-GAIN REACQUIRED DEBT 109,597 PTD 109,597
2831001 906A ACCRD SFAS 106 PST RETIRE EXP 4,519,605 Labor 4,519,605
2831001 906D SFAS 106 PST RETIRE EXP - NON-DEDUCT CONT 4,400,377 Labor 4,400,377
2831001 906K ACCRD SFAS 112 PST EMPLOY BEN 2,187,434 Labor 2,187,434
2831001 913Y BK DEFL - MERGER COSTS 0 E 0
2831001 920G TX AMORT-30% OF MINE DEV COSTS (11,628) E (11,628)
2831001 921A BK DEPLETION-MINERALS & RIGHTS (104,338) E (104,338)
2831001 930A BOOK > TAX BASIS-PRTSHP INVEST 39 E 39
2831001 940K 1988-1990 IRS AUDIT SETTLEMENT (2,705) E (2,705)
2831001 664R REG ASSET-VALLEY DISTRICT DUE DILIGENCE (290,292) E (290,292)
2831001 664U REG ASSET-VEMCO ACQUIS/INVESTMENTS 50,046 E 50,046
2831001 664S REG ASSET-VEMCO EMPLOYEE RETIREMENT 135,167 E 135,167
2831001 664W REG ASSET-VEMCO ECONOMIC INVESTMENT - E 0
2831001 664X REG ASSET-SWEPCO/VEMCO TRANSACTION COST 205,533 E 205,533
2831001 664V REG ASSET-NET CCS FEED STUDY COSTS (832,863) E (832,863)
2831002 DSIT DSIT ENTRY - NORMALIZED 4,207,532 E 4,207,532
2831 TOTAL ELECTRIC ACCOUNT SUBTOTAL (42,603,672) (6,255,903) 0 (10,366,986) 0 (25,980,783)
(absolute value Total Company Amount Ties to FF1 p.277(k) -- Acct 283 Electric) 42,603,672
1901001 433A PUCT FUEL O/U RECOVERY-RETAIL (6,108) E (6,108)
1901001 433B INTEREST-FUEL OVER/UNDER RECOVERY (1,093,456) E (1,093,456)
1901001 433C AR - FUEL OVER/UNDER RECOVERY (4,448,037) E (4,448,037)
1901001 433D LA - FUEL OVER/UNDER RECOVERY (0) E (0)
1901001 460A UNBILLED REVENUE 8,796,064 E 8,796,064
1901001 520A PROVS POSS REV REFDS-A/L 2,514,789 PTD 2,514,789
1901001 576F MARK & SPREAD-DEFL-190-A/L 548,165 E 548,165
1901001 602A PROV WORKER'S COMP 78,930 Labor 78,930
1901001 605E SUPPLEMENTAL EXECUTIVE RETIREMENT PLAN 401,399 Labor 401,399
1901001 605F ACCRD SUP EXEC RETIR PLAN COSTS-SFAS 158 75,061 E 75,061
1901001 605I ACCRD BK SUP. SAVINGS PLAN EXP 110,759 Labor 110,759
1901001 605J EMPLOYER SAVINGS PLAN MATCH 0 E 0
1901001 605K ACCRUED BK BENEFIT COSTS 76,018 Labor 76,018
1901001 605O ACCRUED PSI PLAN EXP 290,574 Labor 290,574
1901001 610A BK PROV UNCOLL ACCTS 346,271 PTD 346,271
1901001 610U PROV-TRADING CREDIT RISK - A/L 770 E 770
1901001 610V PROV-FAS 157 - A/L (9,126) E (9,126)
1901001 611E ACCRUED MINE RECLAMATION 12,267,508 E 12,267,508
1901001 611Y PROVISION FOR LITIGATION (536,559) PTD (536,559)
1901001 612Y ACCRD COMPANYWIDE INCENTV PLAN 2,381,623 Labor 2,381,623
1901001 613C ACCRD ENVIRONMENTAL LIAB-CURRENT 23,628 PTD 23,628
1901001 613E ACCRUED BOOK VACATION PAY 3,101,432 Labor 3,101,432
1901001 613V ACCRD BK SEI EMP BENEFIT COSTS 0 E 0
1901001 613Y ACCRUED BK SEVERANCE BENEFITS - Labor 0
1901001 615A ACCRUED INTEREST EXP -STATE 155,299 E 155,299
1901001 ACCRUED INTEREST EXP -STATE - MJE (155,299) E (155,299)
1901001 615B ACCRUED INTEREST-LONG-TERM - FIN 48 (740,709) E (740,709)
1901001 615B-MJE ACCRD INTRST-TAX RES-L/T-FIN 48-MJE 961,045 E 961,045
1901001 615C ACCRUED INTEREST-SHORT-TERM - FIN 48 (557,623) E (557,623)
1901001 615C-MJE ACCRD INTRST-TAX RES-S/T-FIN 48-MJE 417,974 E 417,974
1901001 615O BK DFL RAIL TRANS REV/EXP (0) E (0)
1901001 633Y DEFD REVENUE-DSM LOST REVENUES 0 E 0
1901001 639A DEFD BK GAIN-NON-AFF SALE-EMA (69,006) E (69,006)
1901001 641I ADVANCE RENTAL INC (CUR MO) 301,130 PTD 301,130
1901001 641X DEFERRED INCOME - DOLET HILLS MINING BUYOUT 332,017 E 332,017
1901001 652G REG LIAB-UNREAL MTM GAIN-DEFL (1,634,651) E (1,634,651)
1901001 664G REG LIAB-MIRROR AFUDC-LA 18,407,950 E 18,407,950
1901001 700Z TAX DEFL - DEBT ISSUE COSTS 952,125 PTD 952,125
1901001 906F ACCRD OPEB COSTS - SFAS 158 9,994,128 E 9,994,128
1901001 906P ACCRD BOOK ARO EXPENSE - SFAS 143 12,649,803 E 12,649,803
1901001 911F-FIN48 FIN 48 DSIT (254,002) E (254,002)
1901001 911Q-DSIT DSIT ENTRY - NORMALIZED (1,472,636) PTD (1,472,636)
1901001 911R ACCRD SIT/FRANCHISE TAX RESERVE (114,800) E (114,800)
1901001 ACCRD SIT/FRANCHISE TAX RESERVE-MJE 114,800 E 114,800
1901001 911S ACCRUED SALES & USE TAX RESERVE (1,512,525) E (1,512,525)
1901001 ACCRUED SALES & USE TAX RESERVE - MJE 2,431,100 E 2,431,100
1901001 911V ACCRD SIT TX RESERVE-LNG-TERM-FIN 48 991,911 E 991,911
1901001 911V-MJE ACCRD SIT TX RES-LNG-TERM-FIN 48-MJE 1,233,829 E 1,233,829
1901001 911W ACCRD SIT TX RESERVE-SHRT-TERM-FIN 48 (381,400) E (381,400)
1901001 940X IRS CAPITALIZATION ADJUSTMENT 1,246,201 PTD 1,246,201
1901001 011C NOL & TAX CREDIT C/F - DEF TAX ASSET- MJE 1,795,732 E 1,795,732
1901001 613K (ICDP)-INCENTIVE COMP DEFERRAL PLAN 76,430 E 76,430
1901001 701A AMORT - GOODWILL PER BOOKS 568,750 E 568,750
1901001 702A GOODWILL PER TAX (606,148) E (606,148)
1901001 611G DEFD COMPENSATION-BOOK EXPENSE 593,275 PTD 593,275
1901001 960E AMT CREDIT - DEFERRED 741,726 E 741,726
1901 TOTAL ELECTRIC ACCOUNT SUBTOTAL 71,386,128 60,977,171 0 3,968,222 0 6,440,734
(Total Company Amount Ties to FF1 p.234(c) -- Electric) 71,386,128
SOUTHWESTERN ELECTRIC POWER COMPANY
DETAIL OF DEFERRED INCOME TAX BALANCES
AS OF DECEMBER 31, 2011
Allocation Method
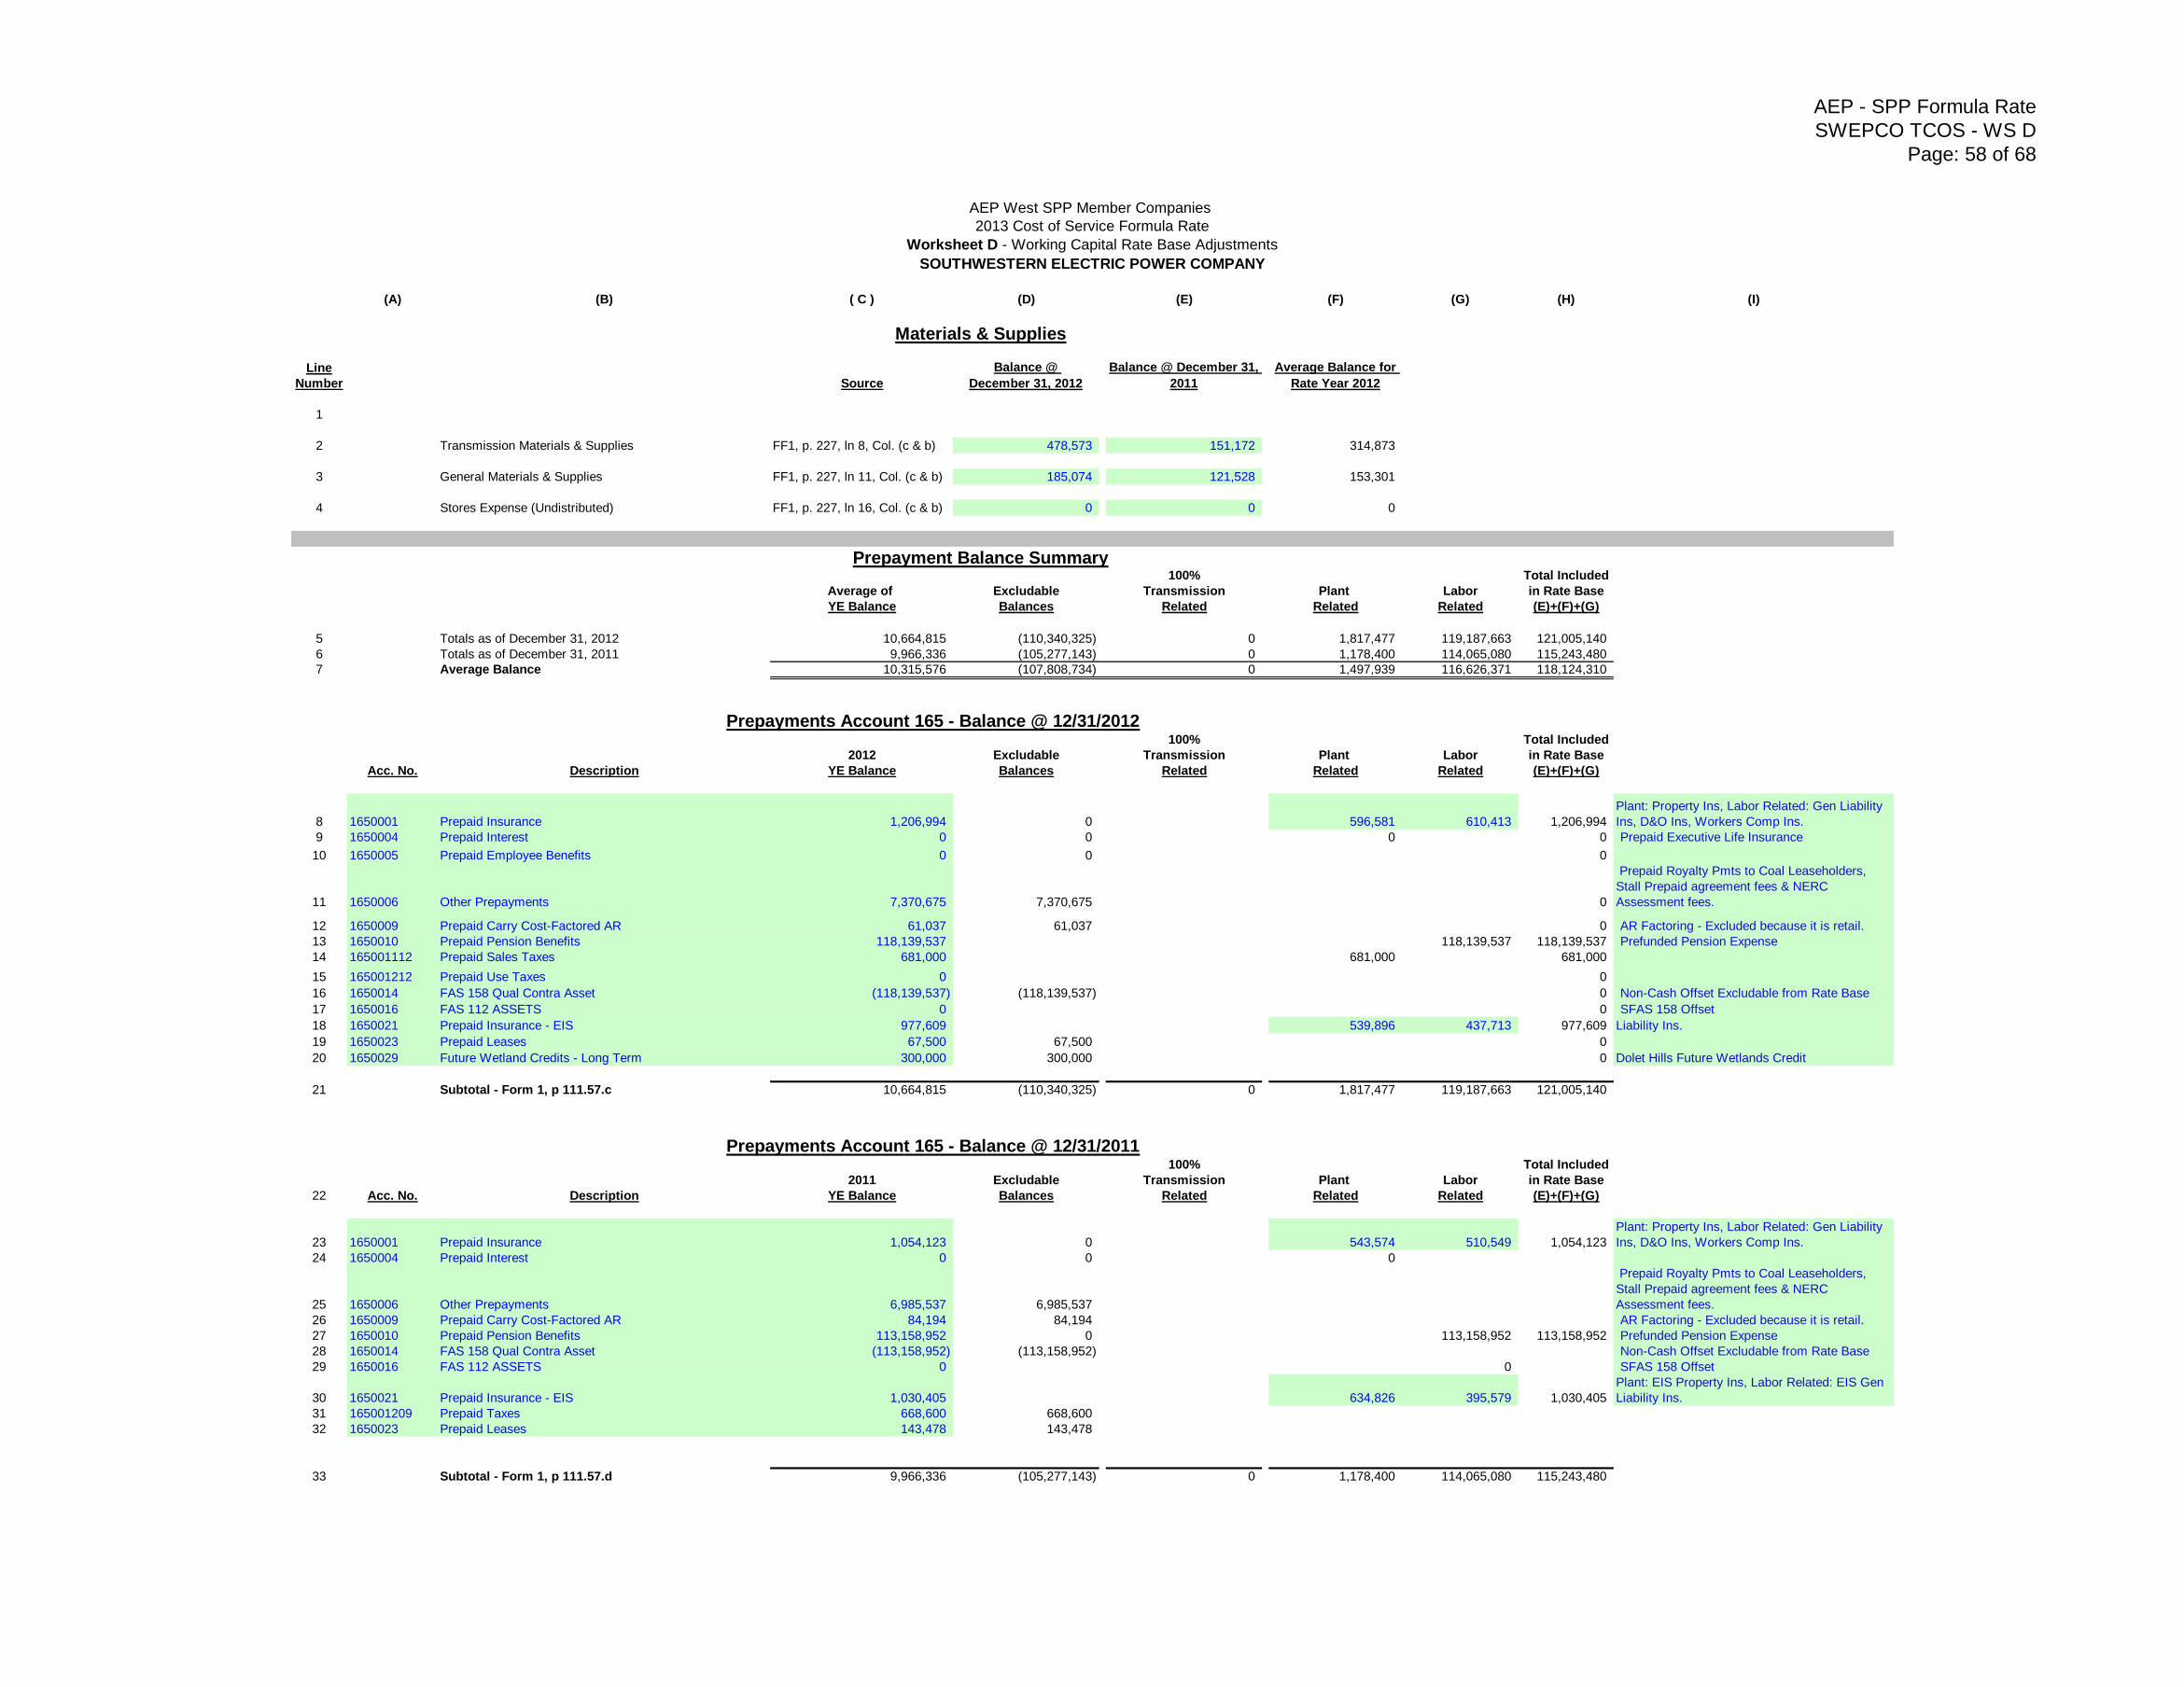
AEP - SPP Formula Rate
SWEPCO TCOS - WS D
Page: 58 of 68
(A) (B) ( C ) (D) (E) (F) (G) (H) (I)
Line
Number Source
1
2 Transmission Materials & Supplies FF1, p. 227, ln 8, Col. (c & b) 478,573 151,172 314,873
3 General Materials & Supplies FF1, p. 227, ln 11, Col. (c & b) 185,074 121,528 153,301
4 Stores Expense (Undistributed) FF1, p. 227, ln 16, Col. (c & b) 0 0 0
100% Total Included
Average of Excludable Transmission Plant Labor in Rate Base
YE Balance Balances Related Related Related (E)+(F)+(G)
5 Totals as of December 31, 2012 10,664,815 (110,340,325) 0 1,817,477 119,187,663 121,005,140
6 Totals as of December 31, 2011 9,966,336 (105,277,143) 0 1,178,400 114,065,080 115,243,480
7 Average Balance 10,315,576 (107,808,734) 0 1,497,939 116,626,371 118,124,310
100% Total Included
2012 Excludable Transmission Plant Labor in Rate Base
Acc. No. Description YE Balance Balances Related Related Related (E)+(F)+(G)
8 1650001 Prepaid Insurance 1,206,994 0 596,581 610,413 1,206,994
Plant: Property Ins, Labor Related: Gen Liability
Ins, D&O Ins, Workers Comp Ins.
9 1650004 Prepaid Interest 0 0 0 0 Prepaid Executive Life Insurance
10 1650005 Prepaid Employee Benefits 0 0 0
11 1650006 Other Prepayments 7,370,675 7,370,675 0
Prepaid Royalty Pmts to Coal Leaseholders,
Stall Prepaid agreement fees & NERC
Assessment fees.
12 1650009 Prepaid Carry Cost-Factored AR 61,037 61,037 0 AR Factoring - Excluded because it is retail.
13 1650010 Prepaid Pension Benefits 118,139,537 118,139,537 118,139,537 Prefunded Pension Expense
14 165001112 Prepaid Sales Taxes 681,000 681,000 681,000
15 165001212 Prepaid Use Taxes 0 0
16 1650014 FAS 158 Qual Contra Asset (118,139,537) (118,139,537) 0 Non-Cash Offset Excludable from Rate Base
17 1650016 FAS 112 ASSETS 0 0 SFAS 158 Offset
18 1650021 Prepaid Insurance - EIS 977,609 539,896 437,713 977,609
Plant: EIS Property Ins, Labor Related: EIS Gen
Liability Ins.
19 1650023 Prepaid Leases 67,500 67,500 0
20 1650029 Future Wetland Credits - Long Term 300,000 300,000 0 Dolet Hills Future Wetlands Credit
21 Subtotal - Form 1, p 111.57.c 10,664,815 (110,340,325) 0 1,817,477 119,187,663 121,005,140
100% Total Included
2011 Excludable Transmission Plant Labor in Rate Base
22 Acc. No. Description YE Balance Balances Related Related Related (E)+(F)+(G)
23 1650001 Prepaid Insurance 1,054,123 0 543,574 510,549 1,054,123
Plant: Property Ins, Labor Related: Gen Liability
Ins, D&O Ins, Workers Comp Ins.
24 1650004 Prepaid Interest 0 0 0
25 1650006 Other Prepayments 6,985,537 6,985,537
Prepaid Royalty Pmts to Coal Leaseholders,
Stall Prepaid agreement fees & NERC
Assessment fees.
26 1650009 Prepaid Carry Cost-Factored AR 84,194 84,194 AR Factoring - Excluded because it is retail.
27 1650010 Prepaid Pension Benefits 113,158,952 0 113,158,952 113,158,952 Prefunded Pension Expense
28 1650014 FAS 158 Qual Contra Asset (113,158,952) (113,158,952) Non-Cash Offset Excludable from Rate Base
29 1650016 FAS 112 ASSETS 0 0 SFAS 158 Offset
30 1650021 Prepaid Insurance - EIS 1,030,405 634,826 395,579 1,030,405
Plant: EIS Property Ins, Labor Related: EIS Gen
Liability Ins.
31 165001209 Prepaid Taxes 668,600 668,600
32 1650023 Prepaid Leases 143,478 143,478
33 Subtotal - Form 1, p 111.57.d 9,966,336 (105,277,143) 0 1,178,400 114,065,080 115,243,480
Prepayments Account 165 - Balance @ 12/31/2011
Prepayment Balance Summary
Balance @
December 31, 2012
Average Balance for
Rate Year 2012
Prepayments Account 165 - Balance @ 12/31/2012
Balance @ December 31,
2011
Materials & Supplies
AEP West SPP Member Companies
2013 Cost of Service Formula Rate
Worksheet D - Working Capital Rate Base Adjustments
SOUTHWESTERN ELECTRIC POWER COMPANY
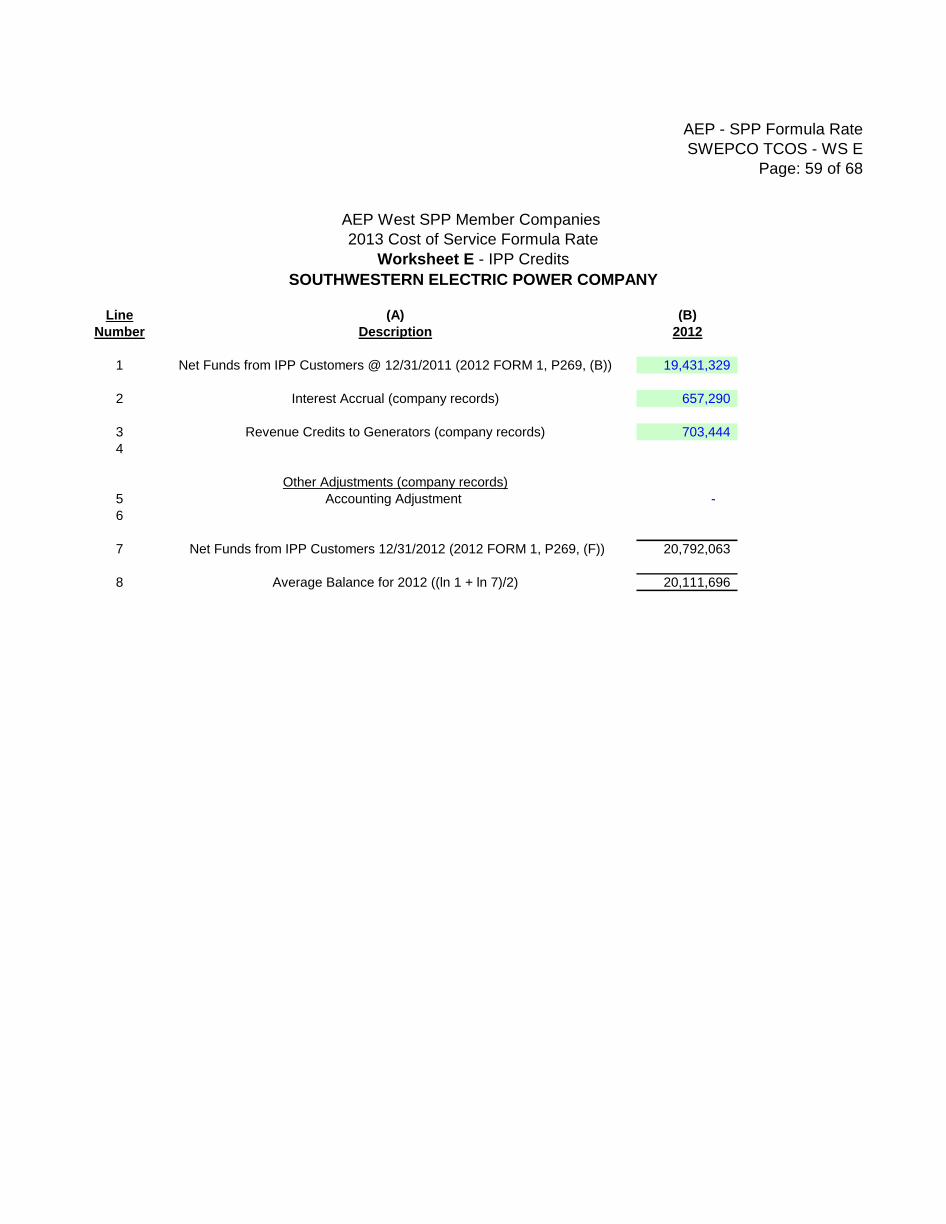
AEP - SPP Formula Rate
SWEPCO TCOS - WS E
Page: 59 of 68
Line (A) (B)
Number Description 2012
1 Net Funds from IPP Customers @ 12/31/2011 (2012 FORM 1, P269, (B)) 19,431,329
2 Interest Accrual (company records) 657,290
3 Revenue Credits to Generators (company records) 703,444
4
Other Adjustments (company records)
5 Accounting Adjustment -
6
7 Net Funds from IPP Customers 12/31/2012 (2012 FORM 1, P269, (F)) 20,792,063
8 Average Balance for 2012 ((ln 1 + ln 7)/2) 20,111,696
AEP West SPP Member Companies
2013 Cost of Service Formula Rate
Worksheet E - IPP Credits
SOUTHWESTERN ELECTRIC POWER COMPANY
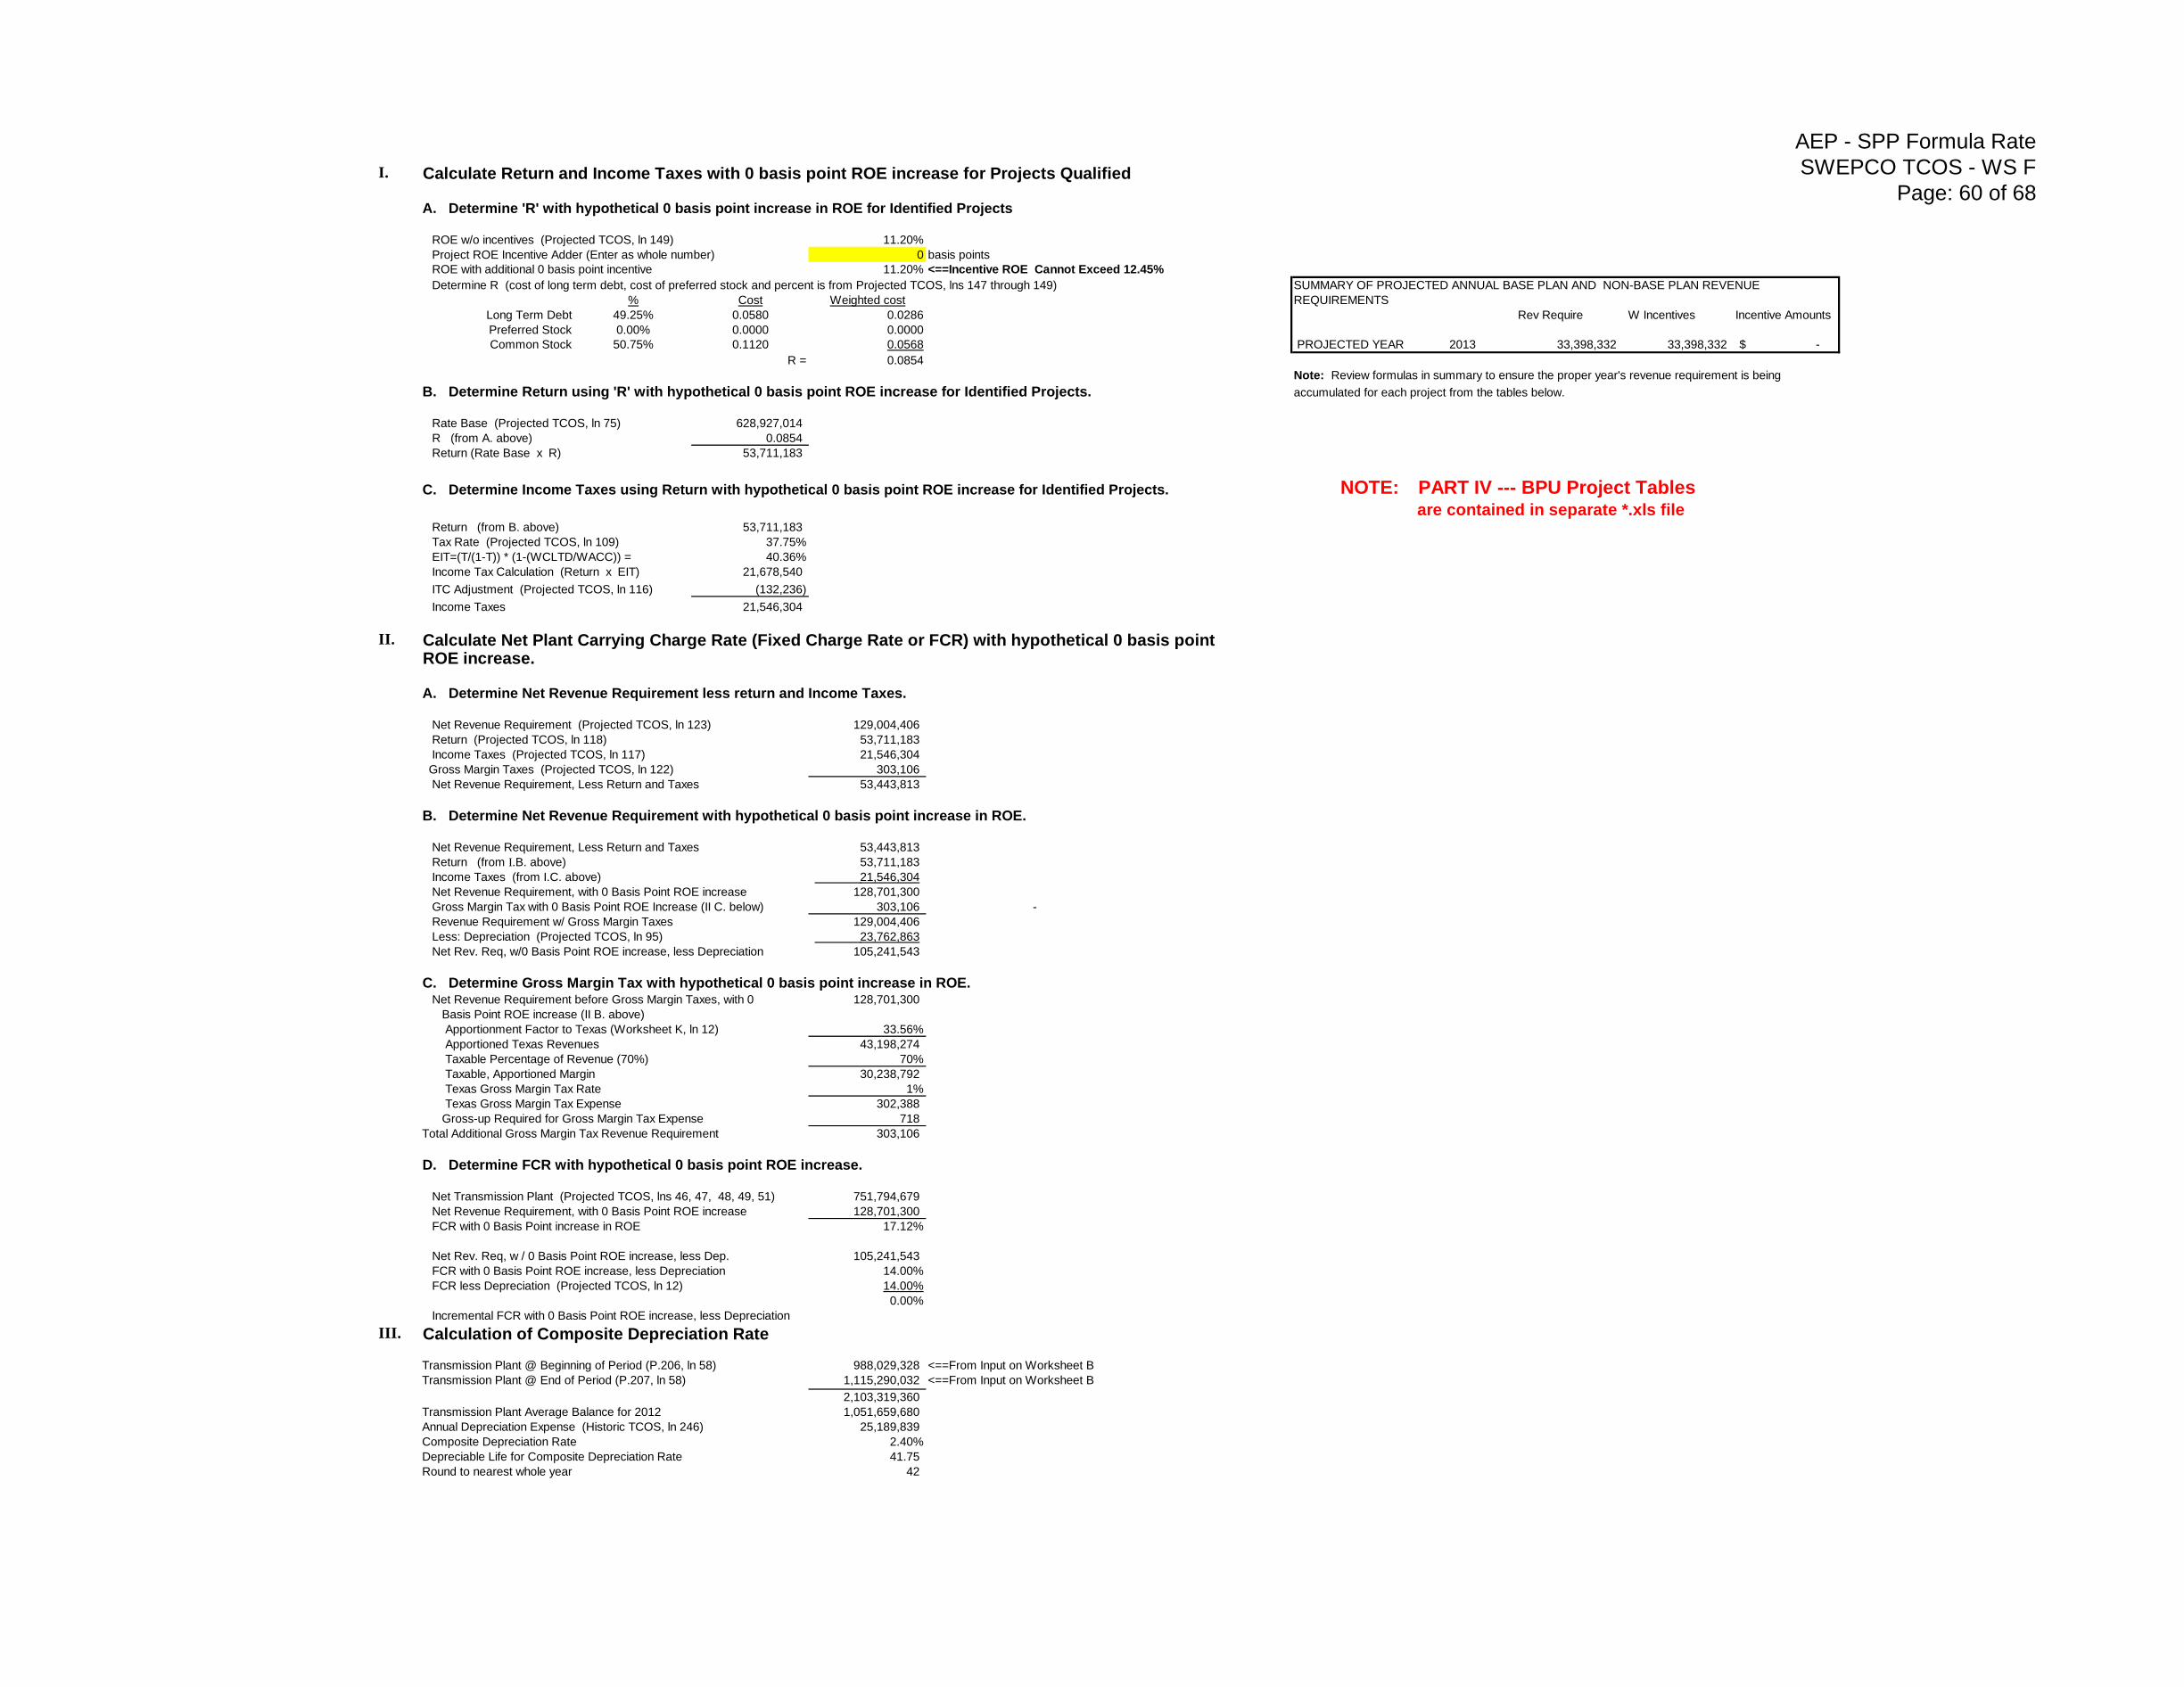
AEP - SPP Formula Rate
SWEPCO TCOS - WS F
Page: 60 of 68I.
A. Determine 'R' with hypothetical 0 basis point increase in ROE for Identified Projects
ROE w/o incentives (Projected TCOS, ln 149) 11.20%
Project ROE Incentive Adder (Enter as whole number) 0 basis points
ROE with additional 0 basis point incentive 11.20% <==Incentive ROE Cannot Exceed 12.45%
Determine R (cost of long term debt, cost of preferred stock and percent is from Projected TCOS, lns 147 through 149)
% Cost Weighted cost
Long Term Debt 49.25% 0.0580 0.0286 Rev Require W Incentives Incentive Amounts
Preferred Stock 0.00% 0.0000 0.0000
Common Stock 50.75% 0.1120 0.0568 PROJECTED YEAR 2013 33,398,332 33,398,332 -$
R = 0.0854
Note: Review formulas in summary to ensure the proper year's revenue requirement is being
B. Determine Return using 'R' with hypothetical 0 basis point ROE increase for Identified Projects. accumulated for each project from the tables below.
Rate Base (Projected TCOS, ln 75) 628,927,014
R (from A. above) 0.0854
Return (Rate Base x R) 53,711,183
C. Determine Income Taxes using Return with hypothetical 0 basis point ROE increase for Identified Projects. NOTE: PART IV --- BPU Project Tablesare contained in separate *.xls file
Return (from B. above) 53,711,183
Tax Rate (Projected TCOS, ln 109) 37.75%
EIT=(T/(1-T)) * (1-(WCLTD/WACC)) = 40.36%
Income Tax Calculation (Return x EIT) 21,678,540
ITC Adjustment (Projected TCOS, ln 116) (132,236)
Income Taxes 21,546,304
II. Calculate Net Plant Carrying Charge Rate (Fixed Charge Rate or FCR) with hypothetical 0 basis pointROE increase.
A. Determine Net Revenue Requirement less return and Income Taxes.
Net Revenue Requirement (Projected TCOS, ln 123) 129,004,406
Return (Projected TCOS, ln 118) 53,711,183
Income Taxes (Projected TCOS, ln 117) 21,546,304
Gross Margin Taxes (Projected TCOS, ln 122) 303,106
Net Revenue Requirement, Less Return and Taxes 53,443,813
B. Determine Net Revenue Requirement with hypothetical 0 basis point increase in ROE.
Net Revenue Requirement, Less Return and Taxes 53,443,813
Return (from I.B. above) 53,711,183
Income Taxes (from I.C. above) 21,546,304
Net Revenue Requirement, with 0 Basis Point ROE increase 128,701,300
Gross Margin Tax with 0 Basis Point ROE Increase (II C. below) 303,106 -
Revenue Requirement w/ Gross Margin Taxes 129,004,406
Less: Depreciation (Projected TCOS, ln 95) 23,762,863
Net Rev. Req, w/0 Basis Point ROE increase, less Depreciation 105,241,543
C. Determine Gross Margin Tax with hypothetical 0 basis point increase in ROE. Net Revenue Requirement before Gross Margin Taxes, with 0 128,701,300
Basis Point ROE increase (II B. above)
Apportionment Factor to Texas (Worksheet K, ln 12) 33.56%
Apportioned Texas Revenues 43,198,274
Taxable Percentage of Revenue (70%) 70%
Taxable, Apportioned Margin 30,238,792
Texas Gross Margin Tax Rate 1%
Texas Gross Margin Tax Expense 302,388
Gross-up Required for Gross Margin Tax Expense 718
Total Additional Gross Margin Tax Revenue Requirement 303,106
D. Determine FCR with hypothetical 0 basis point ROE increase.
Net Transmission Plant (Projected TCOS, lns 46, 47, 48, 49, 51) 751,794,679
Net Revenue Requirement, with 0 Basis Point ROE increase 128,701,300
FCR with 0 Basis Point increase in ROE 17.12%
Net Rev. Req, w / 0 Basis Point ROE increase, less Dep. 105,241,543
FCR with 0 Basis Point ROE increase, less Depreciation 14.00%
FCR less Depreciation (Projected TCOS, ln 12) 14.00%
0.00%
III. Calculation of Composite Depreciation Rate
Transmission Plant @ Beginning of Period (P.206, ln 58) 988,029,328 <==From Input on Worksheet B
Transmission Plant @ End of Period (P.207, ln 58) 1,115,290,032 <==From Input on Worksheet B
2,103,319,360
Transmission Plant Average Balance for 2012 1,051,659,680
Annual Depreciation Expense (Historic TCOS, ln 246) 25,189,839
Composite Depreciation Rate 2.40%
Depreciable Life for Composite Depreciation Rate 41.75
Round to nearest whole year 42
SUMMARY OF PROJECTED ANNUAL BASE PLAN AND NON-BASE PLAN REVENUE
REQUIREMENTS
Calculate Return and Income Taxes with 0 basis point ROE increase for Projects Qualified
Incremental FCR with 0 Basis Point ROE increase, less Depreciation
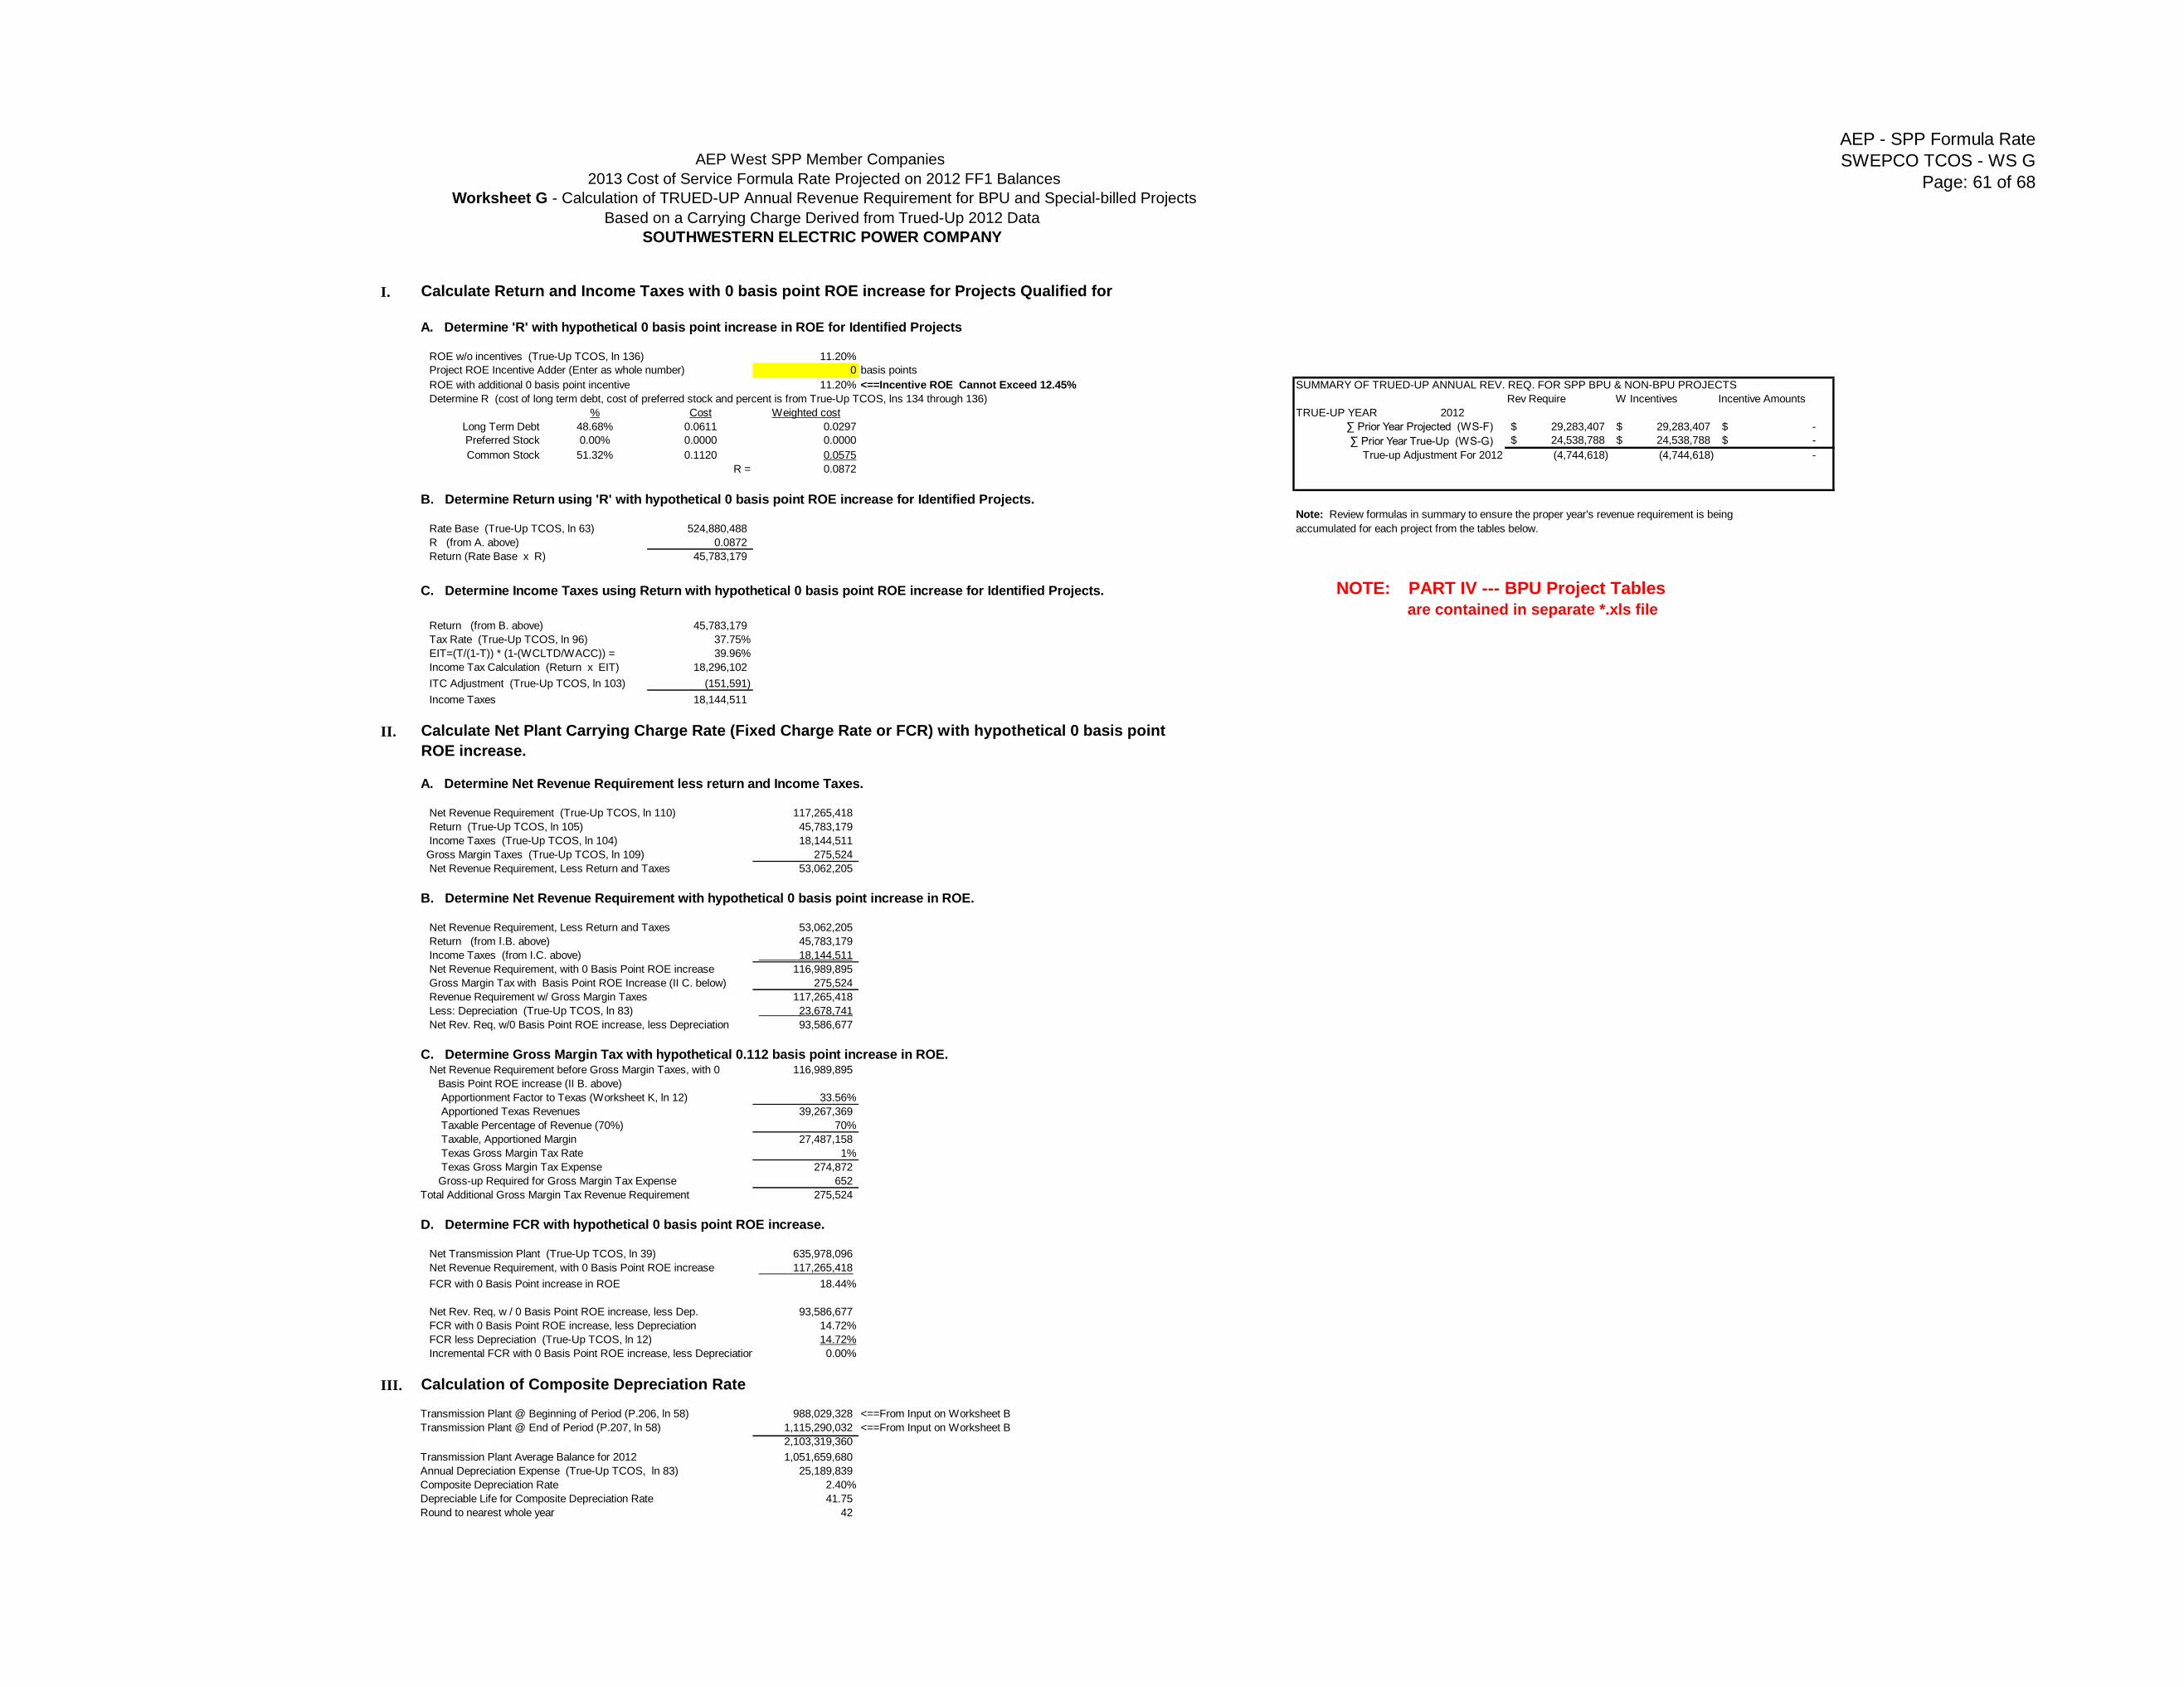
AEP - SPP Formula Rate
SWEPCO TCOS - WS G
Page: 61 of 68
I.
A. Determine 'R' with hypothetical 0 basis point increase in ROE for Identified Projects
ROE w/o incentives (True-Up TCOS, ln 136) 11.20%
Project ROE Incentive Adder (Enter as whole number) 0 basis points
ROE with additional 0 basis point incentive 11.20% <==Incentive ROE Cannot Exceed 12.45% SUMMARY OF TRUED-UP ANNUAL REV. REQ. FOR SPP BPU & NON-BPU PROJECTS
Determine R (cost of long term debt, cost of preferred stock and percent is from True-Up TCOS, lns 134 through 136) Rev Require W Incentives Incentive Amounts
% Cost Weighted cost TRUE-UP YEAR 2012
Long Term Debt 48.68% 0.0611 0.0297 ∑ Prior Year Projected (WS-F) 29,283,407$ 29,283,407$ -$
Preferred Stock 0.00% 0.0000 0.0000 ∑ Prior Year True-Up (WS-G) 24,538,788$ 24,538,788$ -$
Common Stock 51.32% 0.1120 0.0575 True-up Adjustment For 2012 (4,744,618) (4,744,618) -
R = 0.0872
B. Determine Return using 'R' with hypothetical 0 basis point ROE increase for Identified Projects.Note: Review formulas in summary to ensure the proper year's revenue requirement is being
Rate Base (True-Up TCOS, ln 63) 524,880,488 accumulated for each project from the tables below.
R (from A. above) 0.0872
Return (Rate Base x R) 45,783,179
C. Determine Income Taxes using Return with hypothetical 0 basis point ROE increase for Identified Projects. NOTE: PART IV --- BPU Project Tablesare contained in separate *.xls file
Return (from B. above) 45,783,179
Tax Rate (True-Up TCOS, ln 96) 37.75%
EIT=(T/(1-T)) * (1-(WCLTD/WACC)) = 39.96%
Income Tax Calculation (Return x EIT) 18,296,102
ITC Adjustment (True-Up TCOS, ln 103) (151,591)
Income Taxes 18,144,511
II. Calculate Net Plant Carrying Charge Rate (Fixed Charge Rate or FCR) with hypothetical 0 basis point
ROE increase.
A. Determine Net Revenue Requirement less return and Income Taxes.
Net Revenue Requirement (True-Up TCOS, ln 110) 117,265,418
Return (True-Up TCOS, ln 105) 45,783,179
Income Taxes (True-Up TCOS, ln 104) 18,144,511
Gross Margin Taxes (True-Up TCOS, ln 109) 275,524
Net Revenue Requirement, Less Return and Taxes 53,062,205
B. Determine Net Revenue Requirement with hypothetical 0 basis point increase in ROE.
Net Revenue Requirement, Less Return and Taxes 53,062,205
Return (from I.B. above) 45,783,179
Income Taxes (from I.C. above) 18,144,511
Net Revenue Requirement, with 0 Basis Point ROE increase 116,989,895
Gross Margin Tax with Basis Point ROE Increase (II C. below) 275,524
Revenue Requirement w/ Gross Margin Taxes 117,265,418
Less: Depreciation (True-Up TCOS, ln 83) 23,678,741
Net Rev. Req, w/0 Basis Point ROE increase, less Depreciation 93,586,677
C. Determine Gross Margin Tax with hypothetical 0.112 basis point increase in ROE. Net Revenue Requirement before Gross Margin Taxes, with 0 116,989,895
Basis Point ROE increase (II B. above)
Apportionment Factor to Texas (Worksheet K, ln 12) 33.56%
Apportioned Texas Revenues 39,267,369
Taxable Percentage of Revenue (70%) 70%
Taxable, Apportioned Margin 27,487,158
Texas Gross Margin Tax Rate 1%
Texas Gross Margin Tax Expense 274,872
Gross-up Required for Gross Margin Tax Expense 652
Total Additional Gross Margin Tax Revenue Requirement 275,524
D. Determine FCR with hypothetical 0 basis point ROE increase.
Net Transmission Plant (True-Up TCOS, ln 39) 635,978,096
Net Revenue Requirement, with 0 Basis Point ROE increase 117,265,418
FCR with 0 Basis Point increase in ROE 18.44%
Net Rev. Req, w / 0 Basis Point ROE increase, less Dep. 93,586,677
FCR with 0 Basis Point ROE increase, less Depreciation 14.72%
FCR less Depreciation (True-Up TCOS, ln 12) 14.72%
Incremental FCR with 0 Basis Point ROE increase, less Depreciation 0.00%
III. Calculation of Composite Depreciation Rate
Transmission Plant @ Beginning of Period (P.206, ln 58) 988,029,328 <==From Input on Worksheet B
Transmission Plant @ End of Period (P.207, ln 58) 1,115,290,032 <==From Input on Worksheet B
2,103,319,360
Transmission Plant Average Balance for 2012 1,051,659,680
Annual Depreciation Expense (True-Up TCOS, ln 83) 25,189,839
Composite Depreciation Rate 2.40%
Depreciable Life for Composite Depreciation Rate 41.75
Round to nearest whole year 42
Calculate Return and Income Taxes with 0 basis point ROE increase for Projects Qualified for
AEP West SPP Member Companies
2013 Cost of Service Formula Rate Projected on 2012 FF1 Balances
Worksheet G - Calculation of TRUED-UP Annual Revenue Requirement for BPU and Special-billed Projects
Based on a Carrying Charge Derived from Trued-Up 2012 Data
SOUTHWESTERN ELECTRIC POWER COMPANY
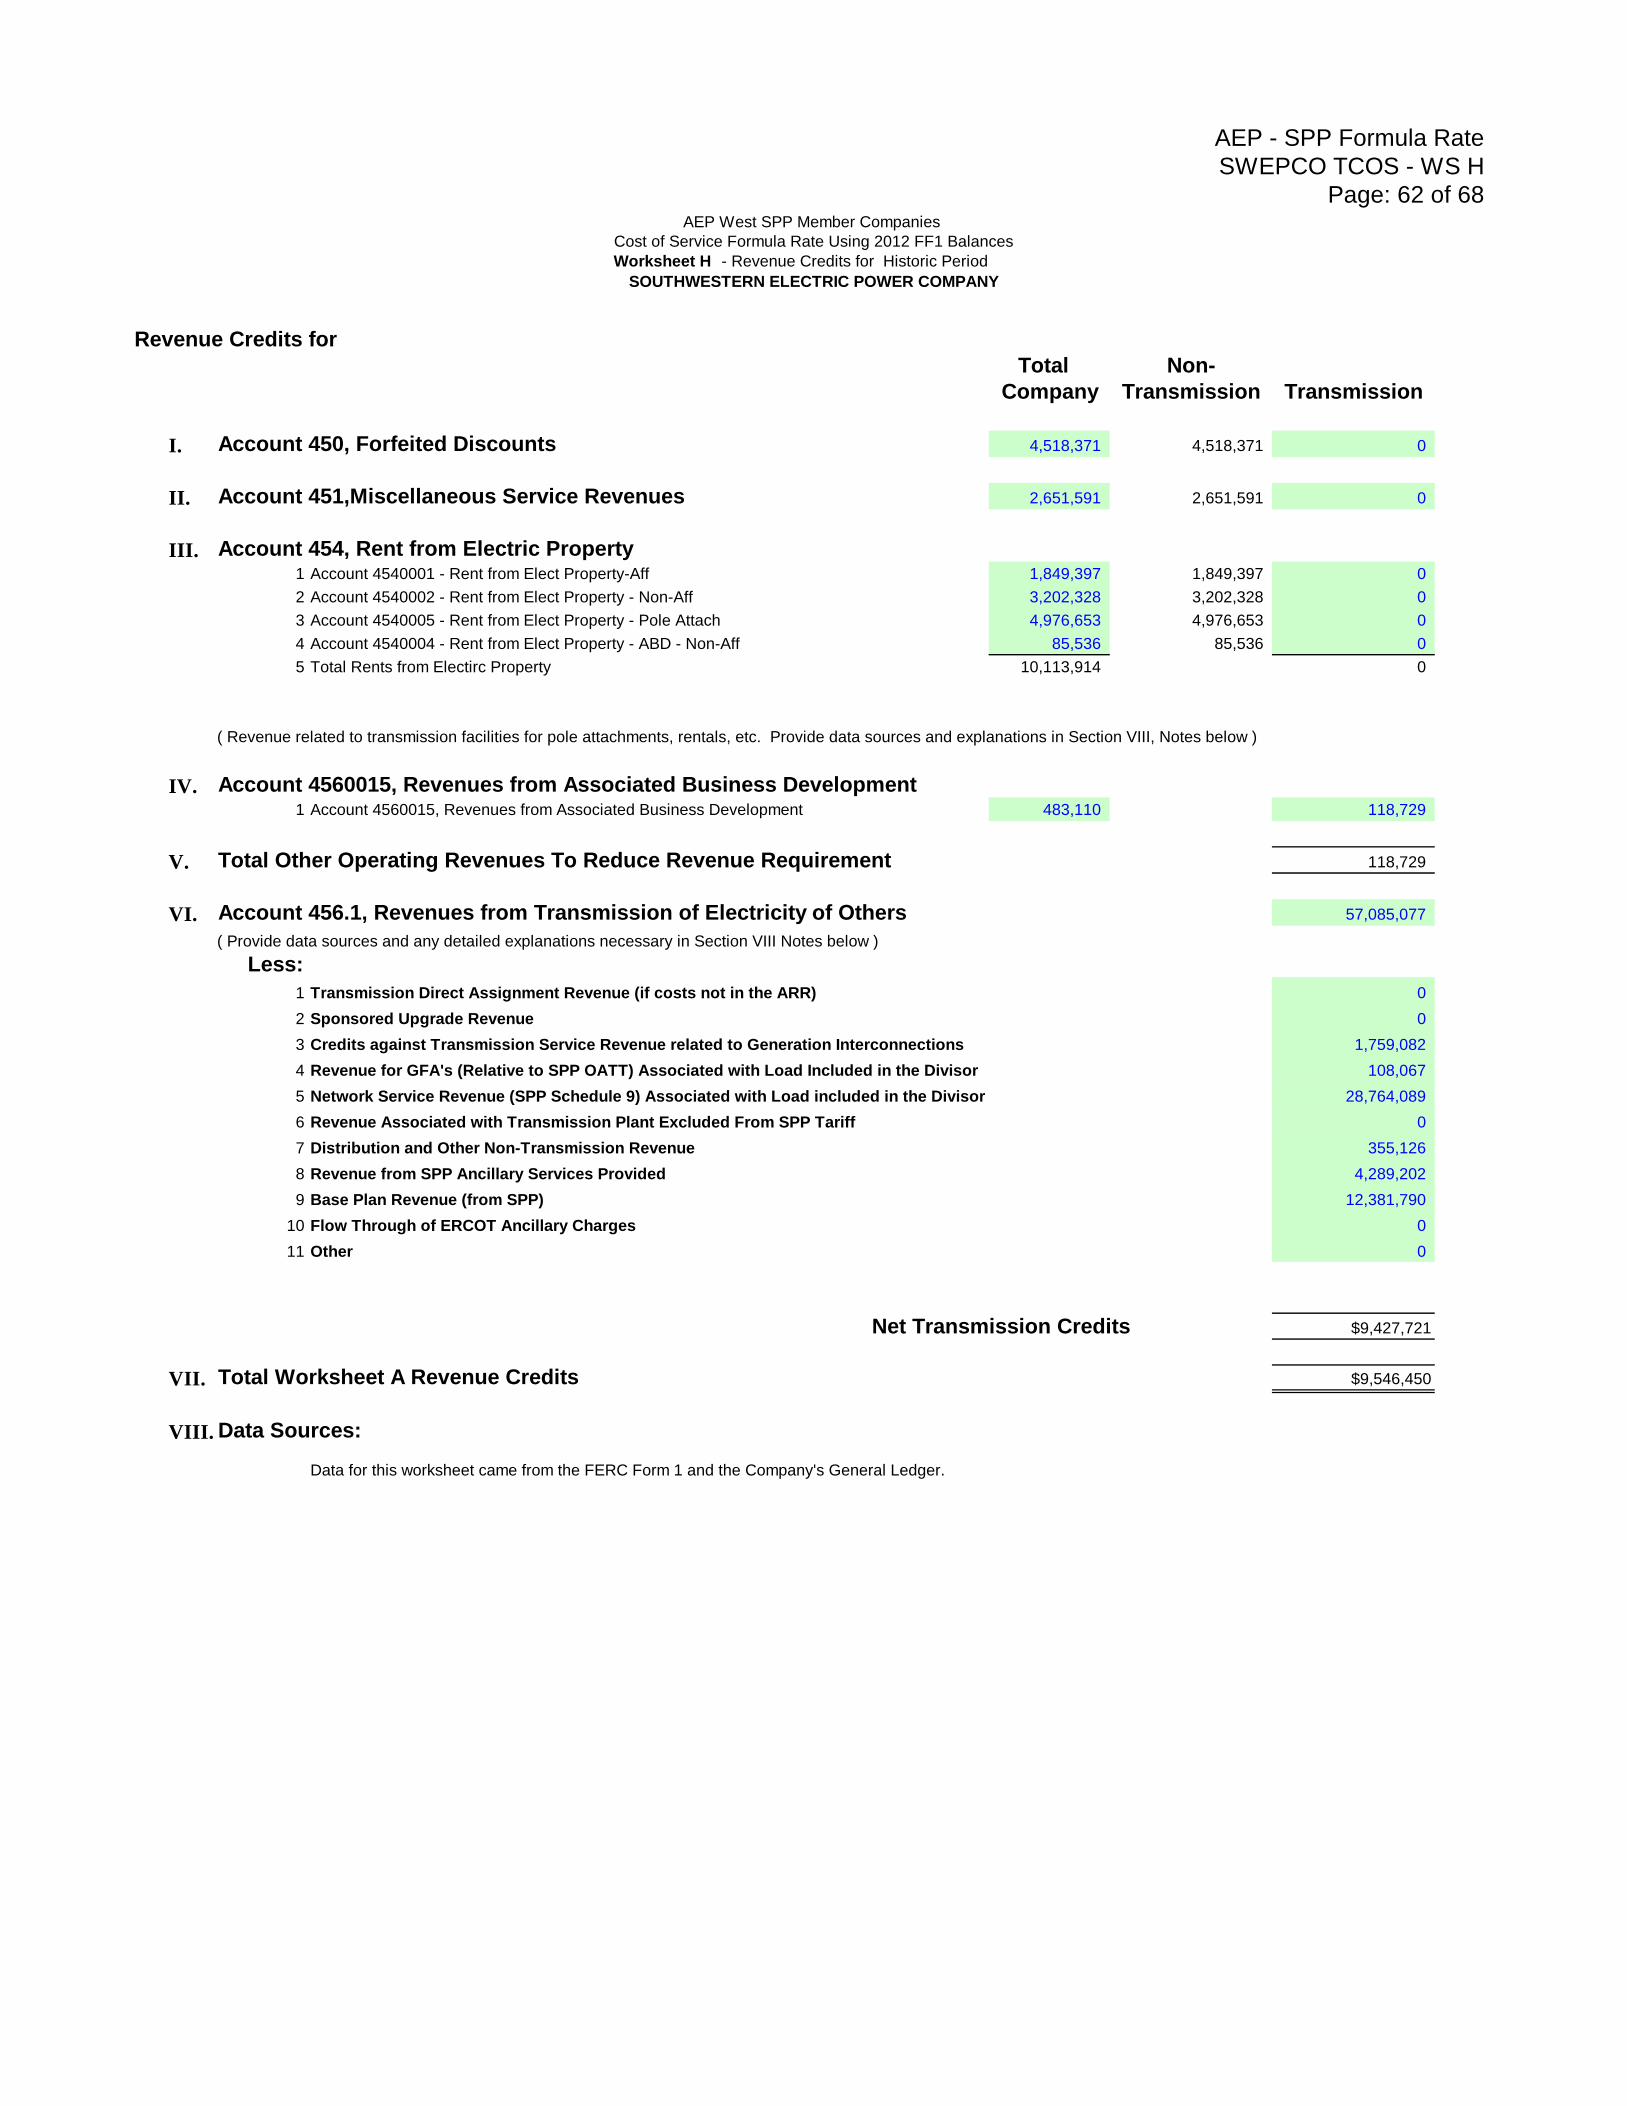
AEP - SPP Formula Rate
SWEPCO TCOS - WS H
Page: 62 of 68
Worksheet H - Revenue Credits for Historic Period
Revenue Credits for
Total Non-
Company Transmission Transmission
I. Account 450, Forfeited Discounts 4,518,371 4,518,371 0
II. Account 451,Miscellaneous Service Revenues 2,651,591 2,651,591 0
III. Account 454, Rent from Electric Property1 Account 4540001 - Rent from Elect Property-Aff 1,849,397 1,849,397 0
2 Account 4540002 - Rent from Elect Property - Non-Aff 3,202,328 3,202,328 0
3 Account 4540005 - Rent from Elect Property - Pole Attach 4,976,653 4,976,653 0
4 Account 4540004 - Rent from Elect Property - ABD - Non-Aff 85,536 85,536 0
5 Total Rents from Electirc Property 10,113,914 0
( Revenue related to transmission facilities for pole attachments, rentals, etc. Provide data sources and explanations in Section VIII, Notes below )
IV. Account 4560015, Revenues from Associated Business Development1 Account 4560015, Revenues from Associated Business Development 483,110 118,729
V. Total Other Operating Revenues To Reduce Revenue Requirement 118,729
VI. Account 456.1, Revenues from Transmission of Electricity of Others 57,085,077
( Provide data sources and any detailed explanations necessary in Section VIII Notes below )
Less:
1 Transmission Direct Assignment Revenue (if costs not in the ARR) 0
2 Sponsored Upgrade Revenue 0
3 Credits against Transmission Service Revenue related to Generation Interconnections 1,759,082
4 Revenue for GFA's (Relative to SPP OATT) Associated with Load Included in the Divisor 108,067
5 Network Service Revenue (SPP Schedule 9) Associated with Load included in the Divisor 28,764,089
6 Revenue Associated with Transmission Plant Excluded From SPP Tariff 0
7 Distribution and Other Non-Transmission Revenue 355,126
8 Revenue from SPP Ancillary Services Provided 4,289,202
9 Base Plan Revenue (from SPP) 12,381,790
10 Flow Through of ERCOT Ancillary Charges 0
11 Other 0
Net Transmission Credits $9,427,721
VII. Total Worksheet A Revenue Credits $9,546,450
VIII. Data Sources:
Data for this worksheet came from the FERC Form 1 and the Company's General Ledger.
AEP West SPP Member Companies
Cost of Service Formula Rate Using 2012 FF1 Balances
SOUTHWESTERN ELECTRIC POWER COMPANY
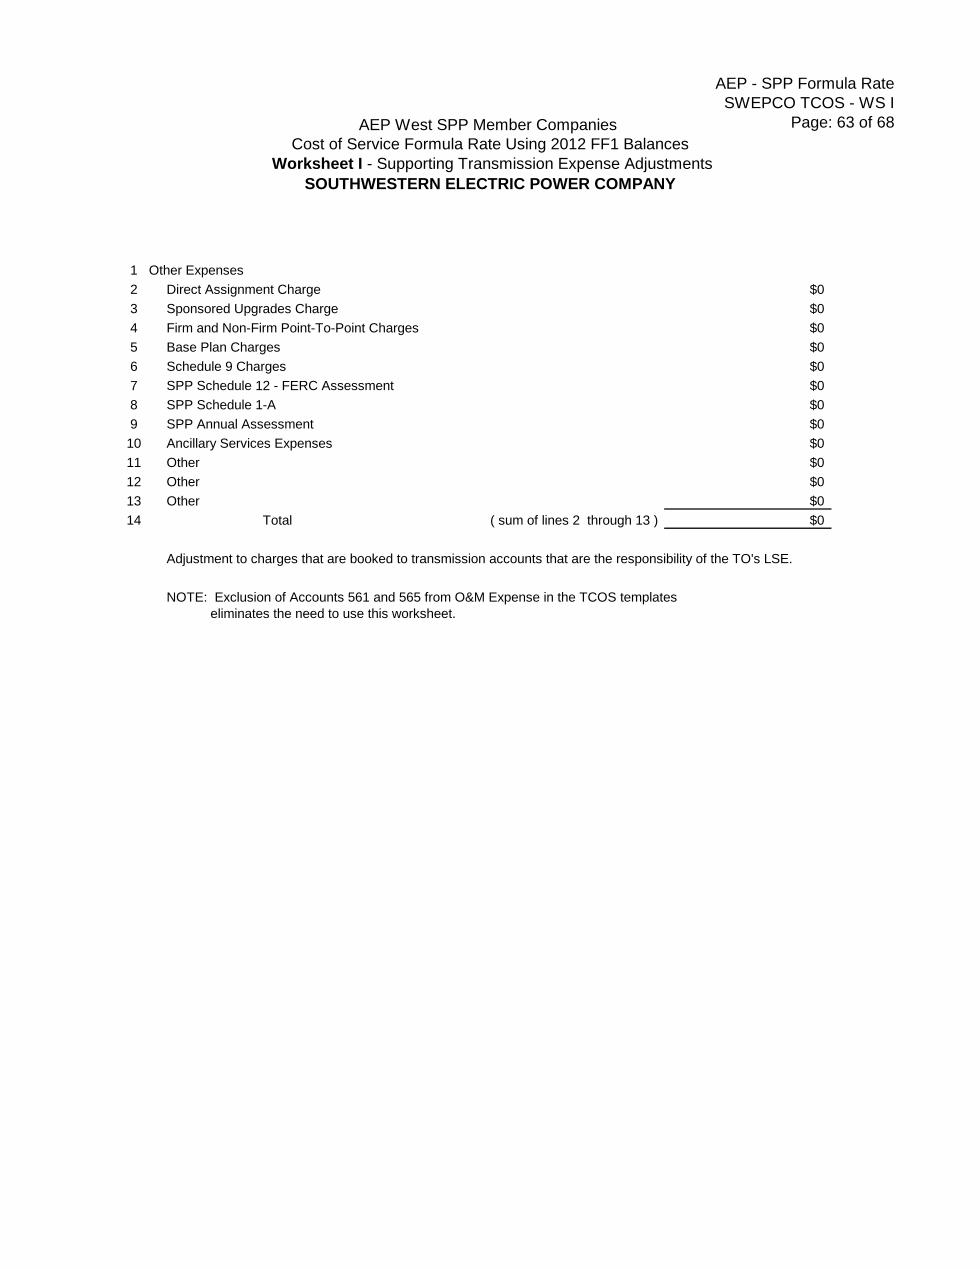
AEP - SPP Formula Rate
SWEPCO TCOS - WS I
Page: 63 of 68
1 Other Expenses
2 Direct Assignment Charge $0
3 Sponsored Upgrades Charge $0
4 Firm and Non-Firm Point-To-Point Charges $0
5 Base Plan Charges $0
6 Schedule 9 Charges $0
7 SPP Schedule 12 - FERC Assessment $0
8 SPP Schedule 1-A $0
9 SPP Annual Assessment $0
10 Ancillary Services Expenses $0
11 Other $0
12 Other $0
13 Other $0
14 Total ( sum of lines 2 through 13 ) $0
Adjustment to charges that are booked to transmission accounts that are the responsibility of the TO's LSE.
NOTE: Exclusion of Accounts 561 and 565 from O&M Expense in the TCOS templates
eliminates the need to use this worksheet.
AEP West SPP Member Companies
Cost of Service Formula Rate Using 2012 FF1 Balances
Worksheet I - Supporting Transmission Expense Adjustments
SOUTHWESTERN ELECTRIC POWER COMPANY
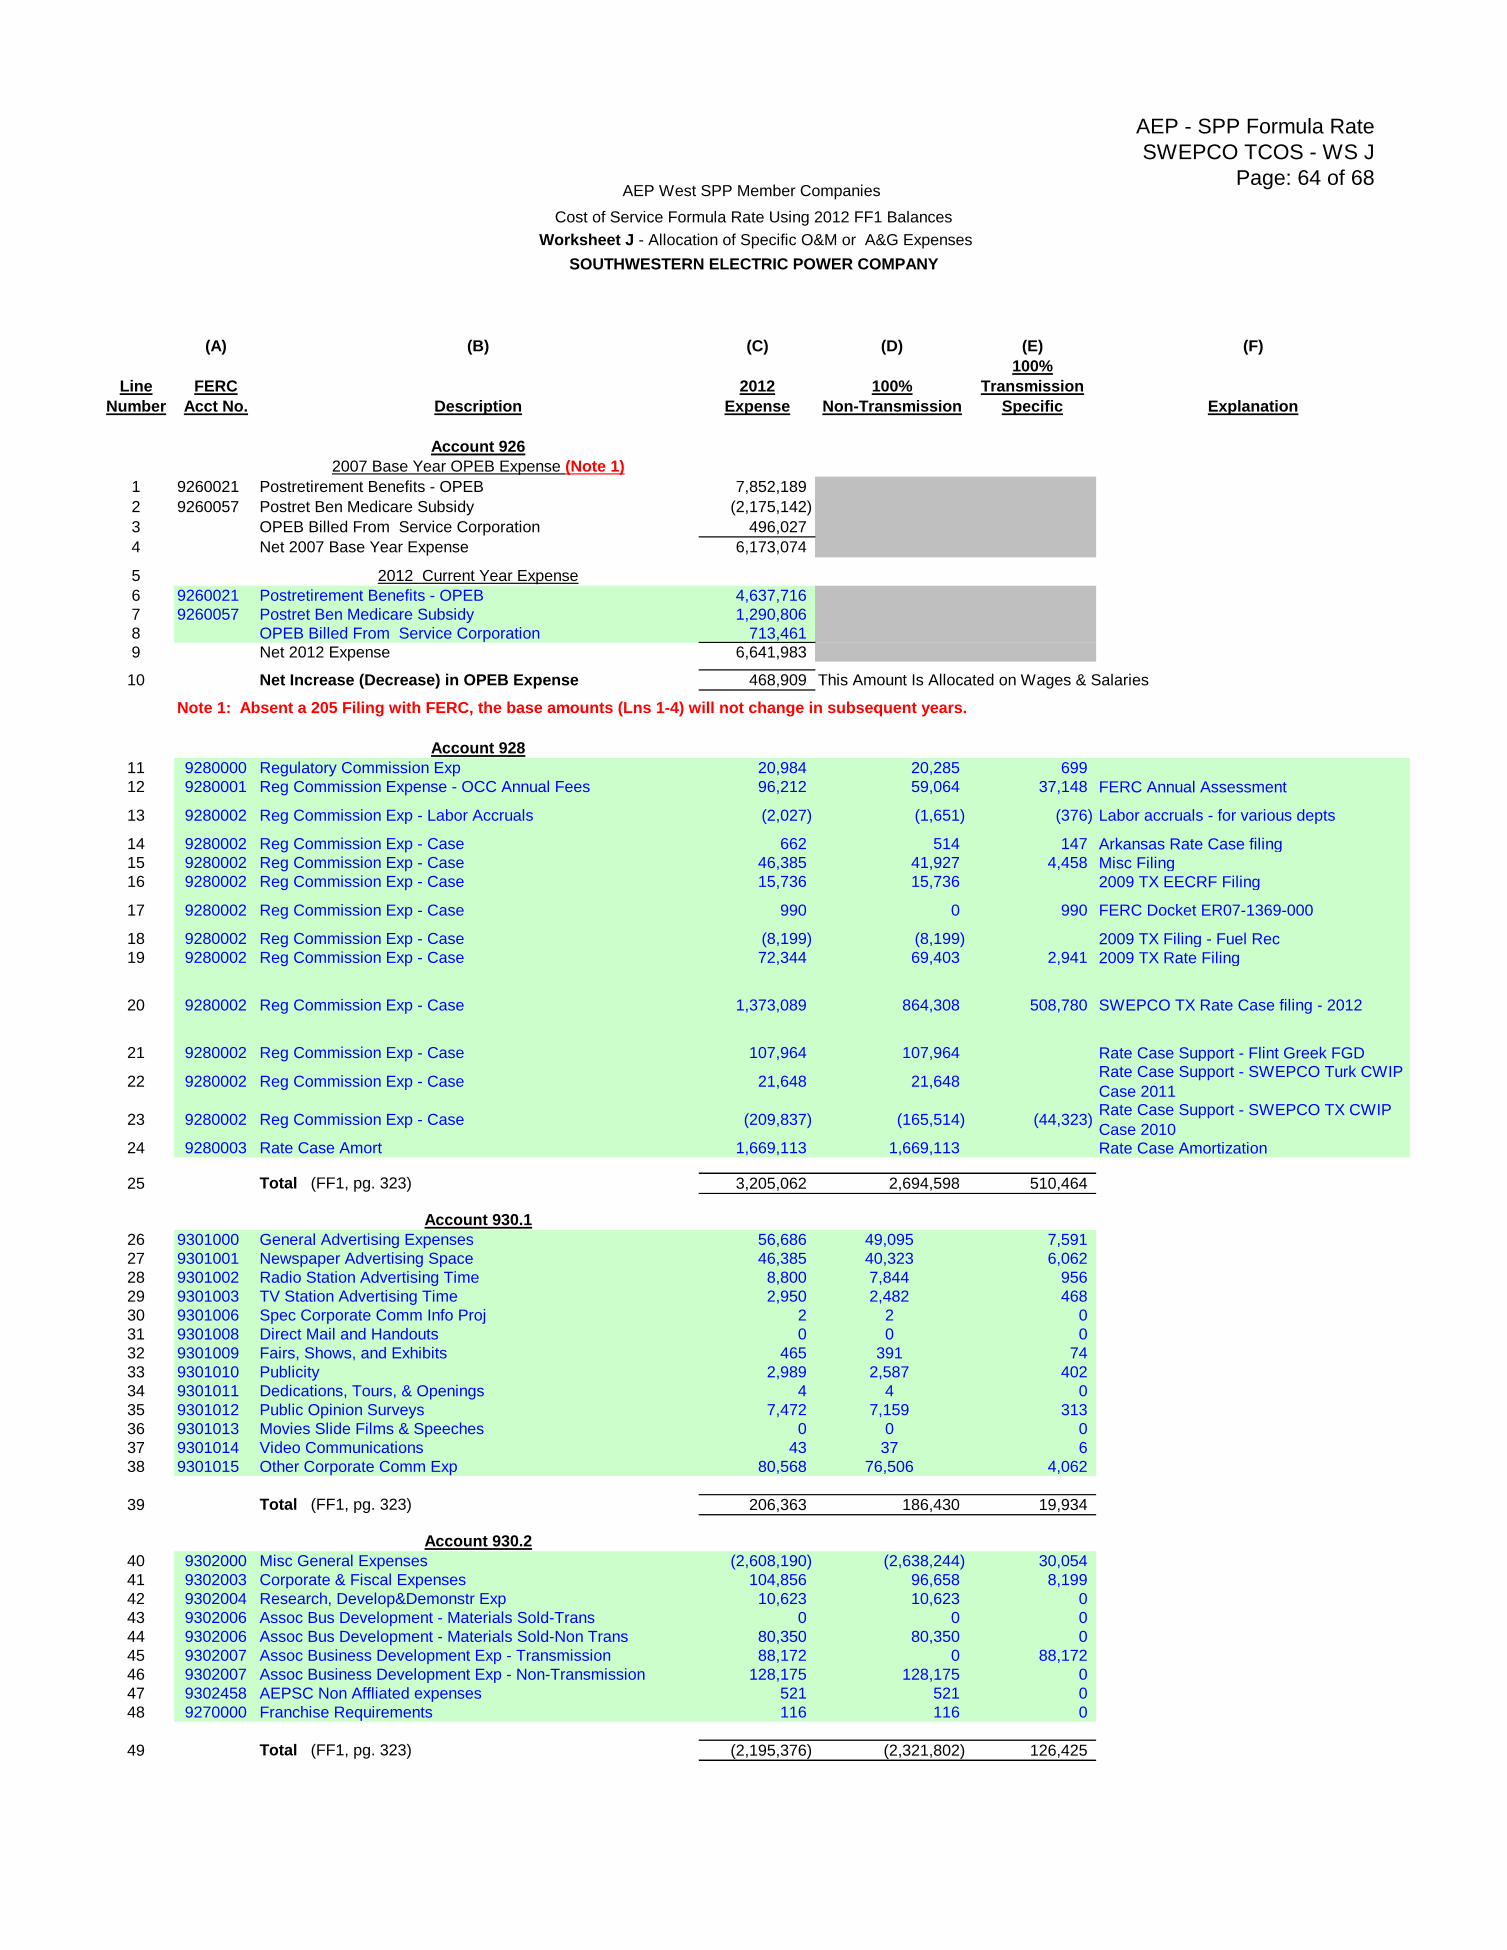
AEP - SPP Formula Rate
SWEPCO TCOS - WS J
Page: 64 of 68
(A) (B) (C) (D) (E) (F)
100%
Line FERC 2012 100% Transmission
Number Acct No. Description Expense Non-Transmission Specific Explanation
Account 926
2007 Base Year OPEB Expense (Note 1)
1 9260021 Postretirement Benefits - OPEB 7,852,189
2 9260057 Postret Ben Medicare Subsidy (2,175,142)
3 OPEB Billed From Service Corporation 496,027
4 Net 2007 Base Year Expense 6,173,074
5 2012 Current Year Expense
6 9260021 Postretirement Benefits - OPEB 4,637,716
7 9260057 Postret Ben Medicare Subsidy 1,290,806
8 OPEB Billed From Service Corporation 713,461
9 Net 2012 Expense 6,641,983
10 Net Increase (Decrease) in OPEB Expense 468,909 This Amount Is Allocated on Wages & Salaries
Note 1: Absent a 205 Filing with FERC, the base amounts (Lns 1-4) will not change in subsequent years.
Account 928
11 9280000 Regulatory Commission Exp 20,984 20,285 699
12 9280001 Reg Commission Expense - OCC Annual Fees 96,212 59,064 37,148 FERC Annual Assessment
13 9280002 Reg Commission Exp - Labor Accruals (2,027) (1,651) (376) Labor accruals - for various depts
14 9280002 Reg Commission Exp - Case 662 514 147 Arkansas Rate Case filing15 9280002 Reg Commission Exp - Case 46,385 41,927 4,458 Misc Filing 16 9280002 Reg Commission Exp - Case 15,736 15,736 2009 TX EECRF Filing
17 9280002 Reg Commission Exp - Case 990 0 990 FERC Docket ER07-1369-000
18 9280002 Reg Commission Exp - Case (8,199) (8,199) 2009 TX Filing - Fuel Rec19 9280002 Reg Commission Exp - Case 72,344 69,403 2,941 2009 TX Rate Filing
20 9280002 Reg Commission Exp - Case 1,373,089 864,308 508,780 SWEPCO TX Rate Case filing - 2012
21 9280002 Reg Commission Exp - Case 107,964 107,964 Rate Case Support - Flint Greek FGD
22 9280002 Reg Commission Exp - Case 21,648 21,648Rate Case Support - SWEPCO Turk CWIP
Case 2011
23 9280002 Reg Commission Exp - Case (209,837) (165,514) (44,323)Rate Case Support - SWEPCO TX CWIP
Case 201024 9280003 Rate Case Amort 1,669,113 1,669,113 Rate Case Amortization
25 Total (FF1, pg. 323) 3,205,062 2,694,598 510,464
Account 930.1
26 9301000 General Advertising Expenses 56,686 49,095 7,591
27 9301001 Newspaper Advertising Space 46,385 40,323 6,062
28 9301002 Radio Station Advertising Time 8,800 7,844 956
29 9301003 TV Station Advertising Time 2,950 2,482 468
30 9301006 Spec Corporate Comm Info Proj 2 2 0
31 9301008 Direct Mail and Handouts 0 0 0
32 9301009 Fairs, Shows, and Exhibits 465 391 74
33 9301010 Publicity 2,989 2,587 402
34 9301011 Dedications, Tours, & Openings 4 4 0
35 9301012 Public Opinion Surveys 7,472 7,159 313
36 9301013 Movies Slide Films & Speeches 0 0 0
37 9301014 Video Communications 43 37 6
38 9301015 Other Corporate Comm Exp 80,568 76,506 4,062
39 Total (FF1, pg. 323) 206,363 186,430 19,934
Account 930.2
40 9302000 Misc General Expenses (2,608,190) (2,638,244) 30,054
41 9302003 Corporate & Fiscal Expenses 104,856 96,658 8,199
42 9302004 Research, Develop&Demonstr Exp 10,623 10,623 0
43 9302006 Assoc Bus Development - Materials Sold-Trans 0 0 0
44 9302006 Assoc Bus Development - Materials Sold-Non Trans 80,350 80,350 0
45 9302007 Assoc Business Development Exp - Transmission 88,172 0 88,172
46 9302007 Assoc Business Development Exp - Non-Transmission 128,175 128,175 0
47 9302458 AEPSC Non Affliated expenses 521 521 0
48 9270000 Franchise Requirements 116 116 0
49 Total (FF1, pg. 323) (2,195,376) (2,321,802) 126,425
AEP West SPP Member Companies
Cost of Service Formula Rate Using 2012 FF1 Balances
Worksheet J - Allocation of Specific O&M or A&G Expenses
SOUTHWESTERN ELECTRIC POWER COMPANY
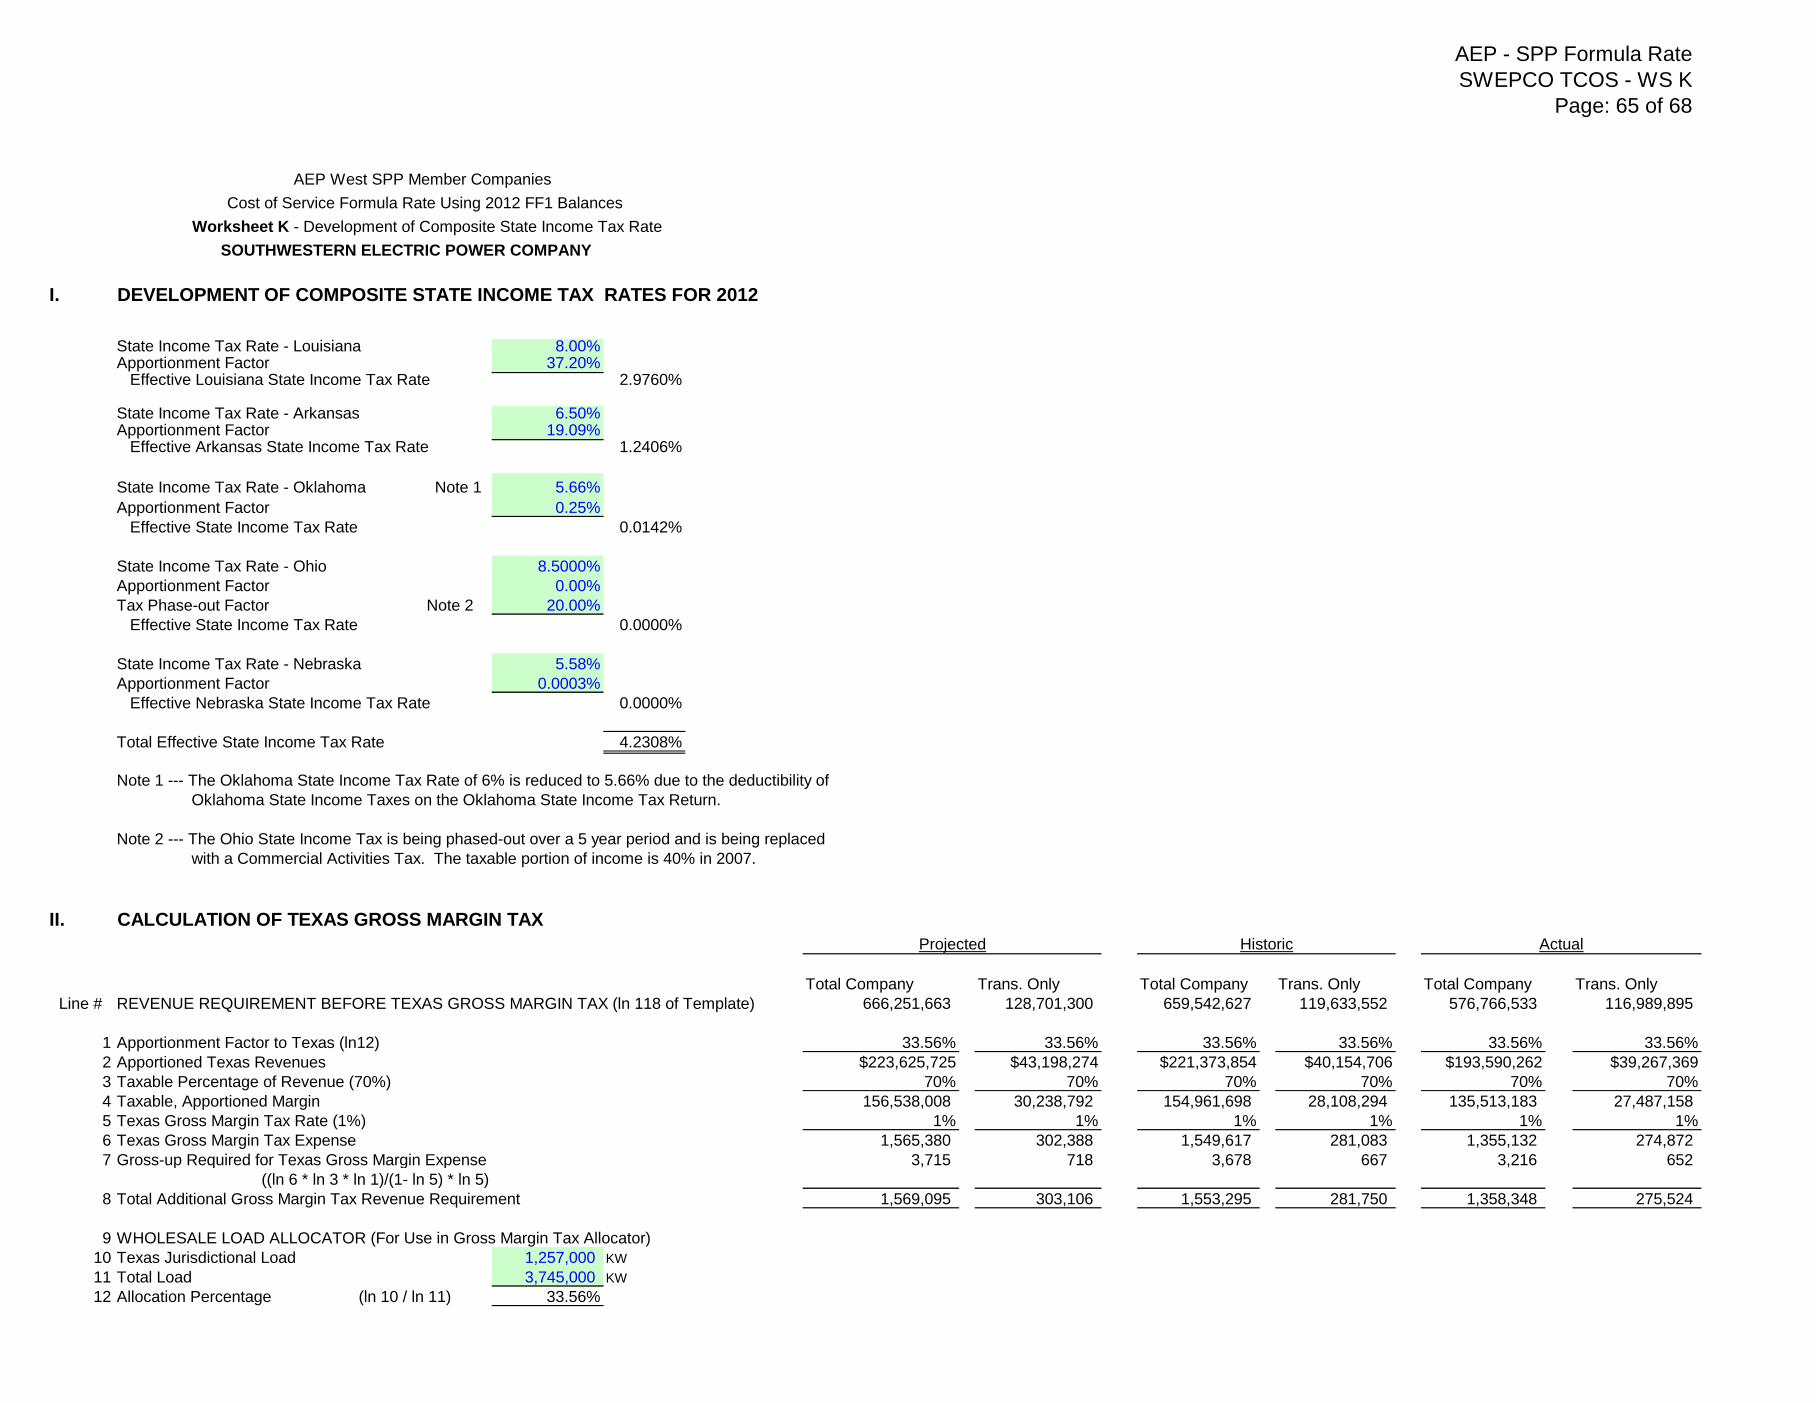
AEP - SPP Formula Rate
SWEPCO TCOS - WS K
Page: 65 of 68
I. DEVELOPMENT OF COMPOSITE STATE INCOME TAX RATES FOR 2012
State Income Tax Rate - Louisiana 8.00%Apportionment Factor 37.20% Effective Louisiana State Income Tax Rate 2.9760%
State Income Tax Rate - Arkansas 6.50%Apportionment Factor 19.09% Effective Arkansas State Income Tax Rate 1.2406%
State Income Tax Rate - Oklahoma Note 1 5.66%
Apportionment Factor 0.25%
Effective State Income Tax Rate 0.0142%
State Income Tax Rate - Ohio 8.5000%
Apportionment Factor 0.00%
Tax Phase-out Factor Note 2 20.00%
Effective State Income Tax Rate 0.0000%
State Income Tax Rate - Nebraska 5.58%
Apportionment Factor 0.0003%
Effective Nebraska State Income Tax Rate 0.0000%
Total Effective State Income Tax Rate 4.2308%
Note 1 --- The Oklahoma State Income Tax Rate of 6% is reduced to 5.66% due to the deductibility of
Oklahoma State Income Taxes on the Oklahoma State Income Tax Return.
Note 2 --- The Ohio State Income Tax is being phased-out over a 5 year period and is being replaced
with a Commercial Activities Tax. The taxable portion of income is 40% in 2007.
II. CALCULATION OF TEXAS GROSS MARGIN TAX
Total Company Trans. Only Total Company Trans. Only Total Company Trans. Only
Line # REVENUE REQUIREMENT BEFORE TEXAS GROSS MARGIN TAX (ln 118 of Template) 666,251,663 128,701,300 659,542,627 119,633,552 576,766,533 116,989,895
1 Apportionment Factor to Texas (ln12) 33.56% 33.56% 33.56% 33.56% 33.56% 33.56%
2 Apportioned Texas Revenues $223,625,725 $43,198,274 $221,373,854 $40,154,706 $193,590,262 $39,267,369
3 Taxable Percentage of Revenue (70%) 70% 70% 70% 70% 70% 70%
4 Taxable, Apportioned Margin 156,538,008 30,238,792 154,961,698 28,108,294 135,513,183 27,487,158
5 Texas Gross Margin Tax Rate (1%) 1% 1% 1% 1% 1% 1%
6 Texas Gross Margin Tax Expense 1,565,380 302,388 1,549,617 281,083 1,355,132 274,872
7 Gross-up Required for Texas Gross Margin Expense 3,715 718 3,678 667 3,216 652
((ln 6 * ln 3 * ln 1)/(1- ln 5) * ln 5)
8 Total Additional Gross Margin Tax Revenue Requirement 1,569,095 303,106 1,553,295 281,750 1,358,348 275,524
9 WHOLESALE LOAD ALLOCATOR (For Use in Gross Margin Tax Allocator)
10 Texas Jurisdictional Load 1,257,000 KW
11 Total Load 3,745,000 KW
12 Allocation Percentage (ln 10 / ln 11) 33.56%
ActualProjected
AEP West SPP Member Companies
Cost of Service Formula Rate Using 2012 FF1 Balances
Worksheet K - Development of Composite State Income Tax Rate
SOUTHWESTERN ELECTRIC POWER COMPANY
Historic
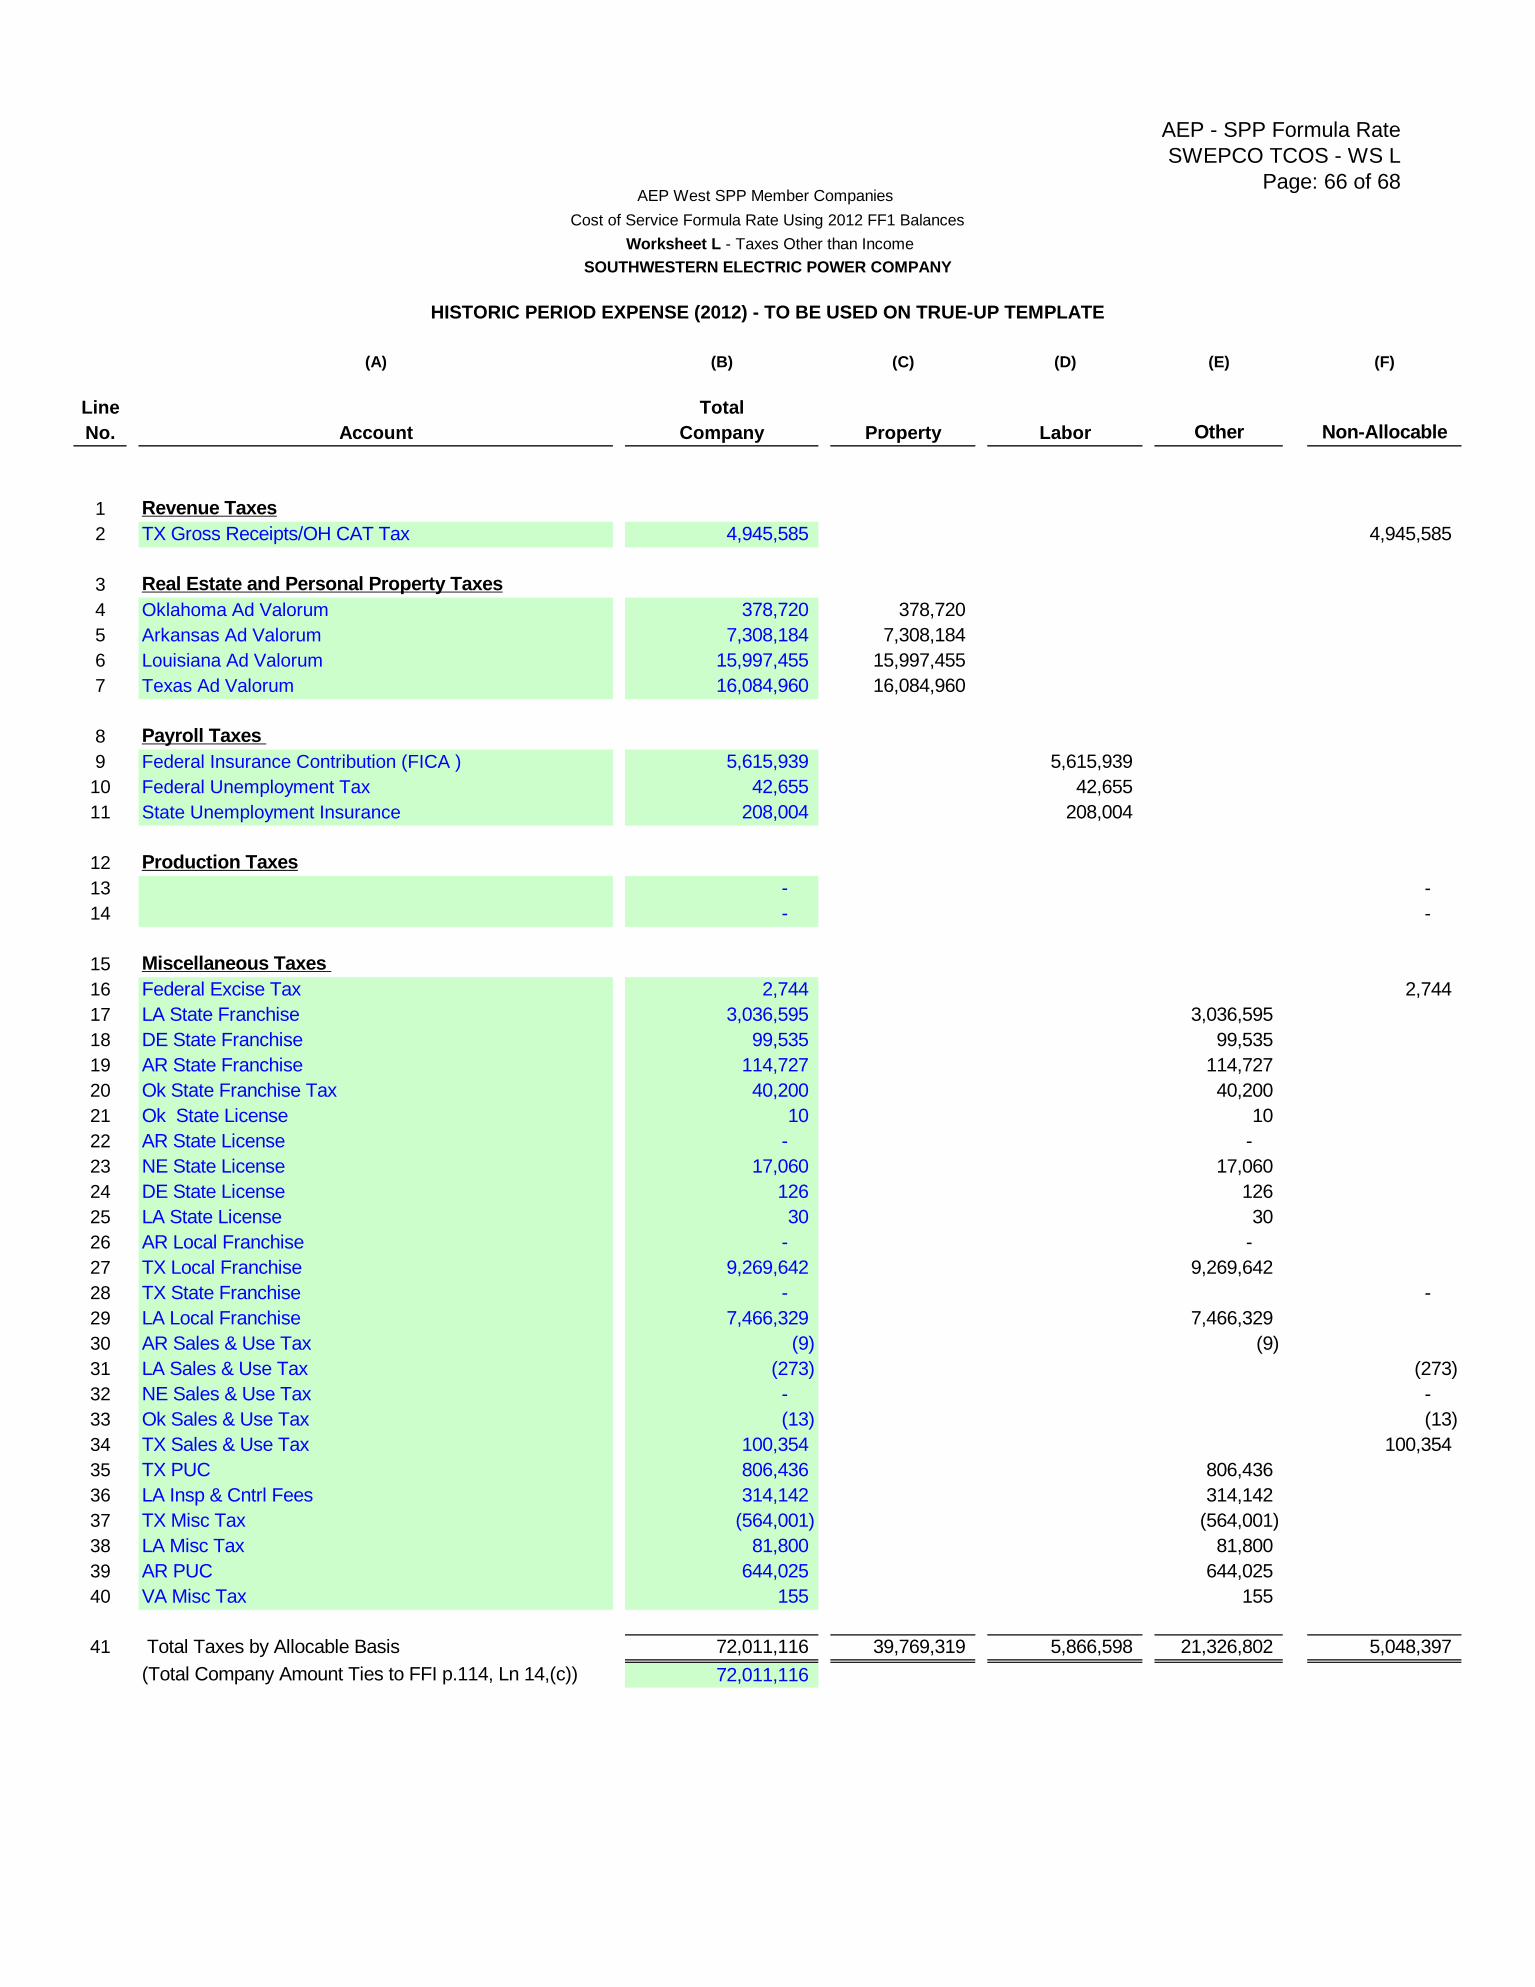
AEP - SPP Formula Rate
SWEPCO TCOS - WS L
Page: 66 of 68
(A) (B) (C) (D) (E) (F)
Line Total
No. Account Company Property Labor Other Non-Allocable
1 Revenue Taxes
2 TX Gross Receipts/OH CAT Tax 4,945,585 4,945,585
3 Real Estate and Personal Property Taxes
4 Oklahoma Ad Valorum 378,720 378,720
5 Arkansas Ad Valorum 7,308,184 7,308,184
6 Louisiana Ad Valorum 15,997,455 15,997,455
7 Texas Ad Valorum 16,084,960 16,084,960
8 Payroll Taxes
9 Federal Insurance Contribution (FICA ) 5,615,939 5,615,939
10 Federal Unemployment Tax 42,655 42,655
11 State Unemployment Insurance 208,004 208,004
12 Production Taxes
13 - -
14 - -
15 Miscellaneous Taxes
16 Federal Excise Tax 2,744 2,744
17 LA State Franchise 3,036,595 3,036,595
18 DE State Franchise 99,535 99,535
19 AR State Franchise 114,727 114,727
20 Ok State Franchise Tax 40,200 40,200
21 Ok State License 10 10
22 AR State License - -
23 NE State License 17,060 17,060
24 DE State License 126 126
25 LA State License 30 30
26 AR Local Franchise - -
27 TX Local Franchise 9,269,642 9,269,642
28 TX State Franchise - -
29 LA Local Franchise 7,466,329 7,466,329
30 AR Sales & Use Tax (9) (9)
31 LA Sales & Use Tax (273) (273)
32 NE Sales & Use Tax - -
33 Ok Sales & Use Tax (13) (13)
34 TX Sales & Use Tax 100,354 100,354
35 TX PUC 806,436 806,436
36 LA Insp & Cntrl Fees 314,142 314,142
37 TX Misc Tax (564,001) (564,001)
38 LA Misc Tax 81,800 81,800
39 AR PUC 644,025 644,025
40 VA Misc Tax 155 155
41 Total Taxes by Allocable Basis 72,011,116 39,769,319 5,866,598 21,326,802 5,048,397
(Total Company Amount Ties to FFI p.114, Ln 14,(c)) 72,011,116
HISTORIC PERIOD EXPENSE (2012) - TO BE USED ON TRUE-UP TEMPLATE
AEP West SPP Member Companies
Cost of Service Formula Rate Using 2012 FF1 Balances
Worksheet L - Taxes Other than Income
SOUTHWESTERN ELECTRIC POWER COMPANY
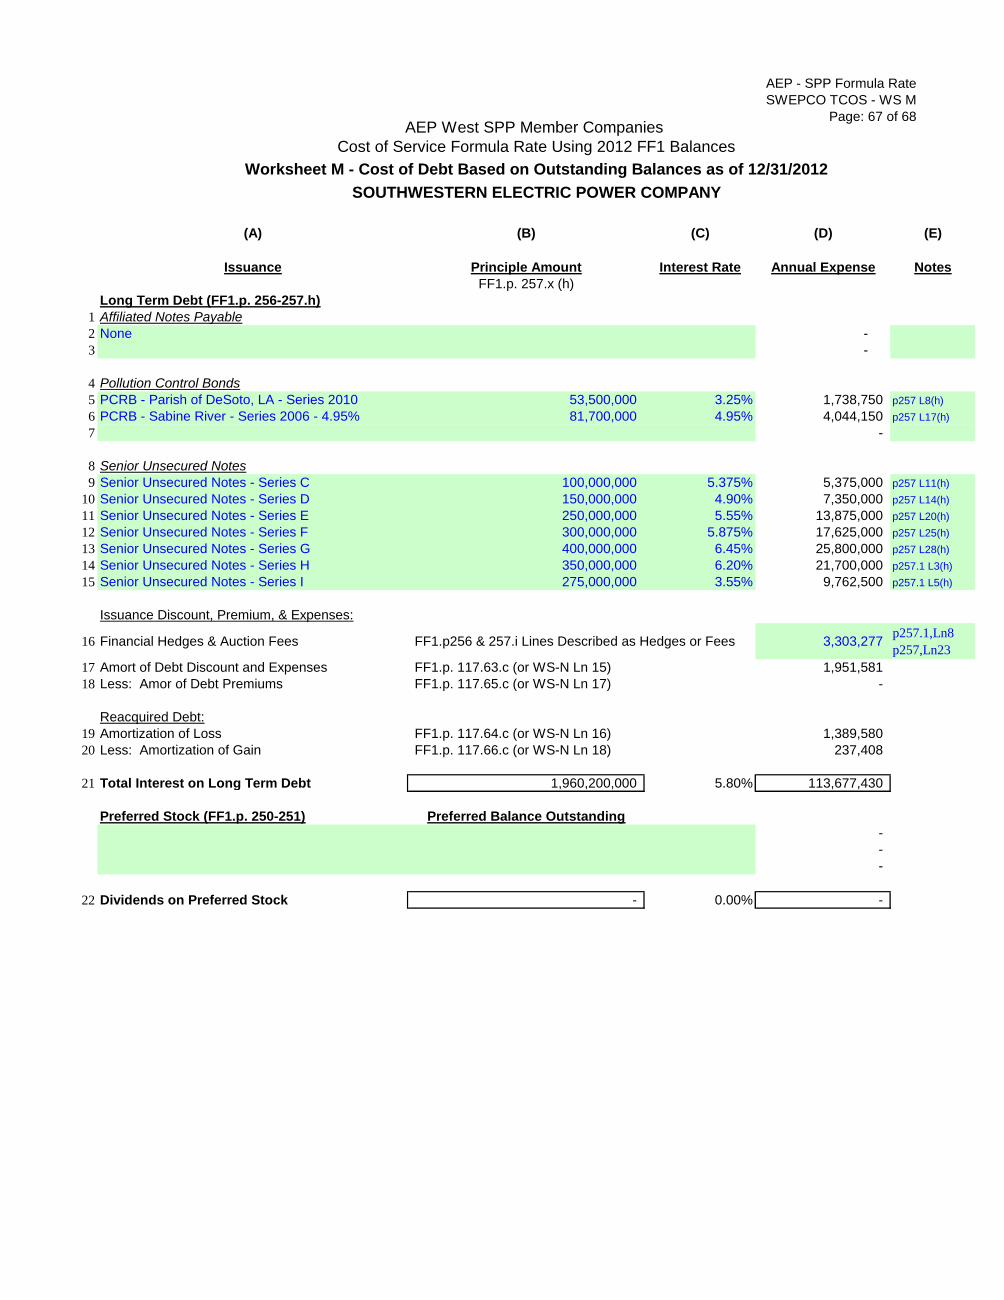
AEP - SPP Formula Rate
SWEPCO TCOS - WS M
Page: 67 of 68
(A) (B) (C) (D) (E)
Issuance Principle Amount Interest Rate Annual Expense Notes
FF1.p. 257.x (h)
Long Term Debt (FF1.p. 256-257.h)
1 Affiliated Notes Payable
2 None -
3 -
4 Pollution Control Bonds
5 PCRB - Parish of DeSoto, LA - Series 2010 53,500,000 3.25% 1,738,750 p257 L8(h)
6 PCRB - Sabine River - Series 2006 - 4.95% 81,700,000 4.95% 4,044,150 p257 L17(h)
7 -
8 Senior Unsecured Notes
9 Senior Unsecured Notes - Series C 100,000,000 5.375% 5,375,000 p257 L11(h)
10 Senior Unsecured Notes - Series D 150,000,000 4.90% 7,350,000 p257 L14(h)
11 Senior Unsecured Notes - Series E 250,000,000 5.55% 13,875,000 p257 L20(h)
12 Senior Unsecured Notes - Series F 300,000,000 5.875% 17,625,000 p257 L25(h)
13 Senior Unsecured Notes - Series G 400,000,000 6.45% 25,800,000 p257 L28(h)
14 Senior Unsecured Notes - Series H 350,000,000 6.20% 21,700,000 p257.1 L3(h)
15 Senior Unsecured Notes - Series I 275,000,000 3.55% 9,762,500 p257.1 L5(h)
Issuance Discount, Premium, & Expenses:
16 Financial Hedges & Auction Fees FF1.p256 & 257.i Lines Described as Hedges or Fees 3,303,277 p257.1,Ln8
p257,Ln23
17 Amort of Debt Discount and Expenses FF1.p. 117.63.c (or WS-N Ln 15) 1,951,581
18 Less: Amor of Debt Premiums FF1.p. 117.65.c (or WS-N Ln 17) -
Reacquired Debt:
19 Amortization of Loss FF1.p. 117.64.c (or WS-N Ln 16) 1,389,580
20 Less: Amortization of Gain FF1.p. 117.66.c (or WS-N Ln 18) 237,408
21 Total Interest on Long Term Debt 1,960,200,000 5.80% 113,677,430
Preferred Stock (FF1.p. 250-251) Preferred Balance Outstanding
-
-
-
22 Dividends on Preferred Stock - 0.00% -
SOUTHWESTERN ELECTRIC POWER COMPANY
AEP West SPP Member Companies
Cost of Service Formula Rate Using 2012 FF1 Balances
Worksheet M - Cost of Debt Based on Outstanding Balances as of 12/31/2012
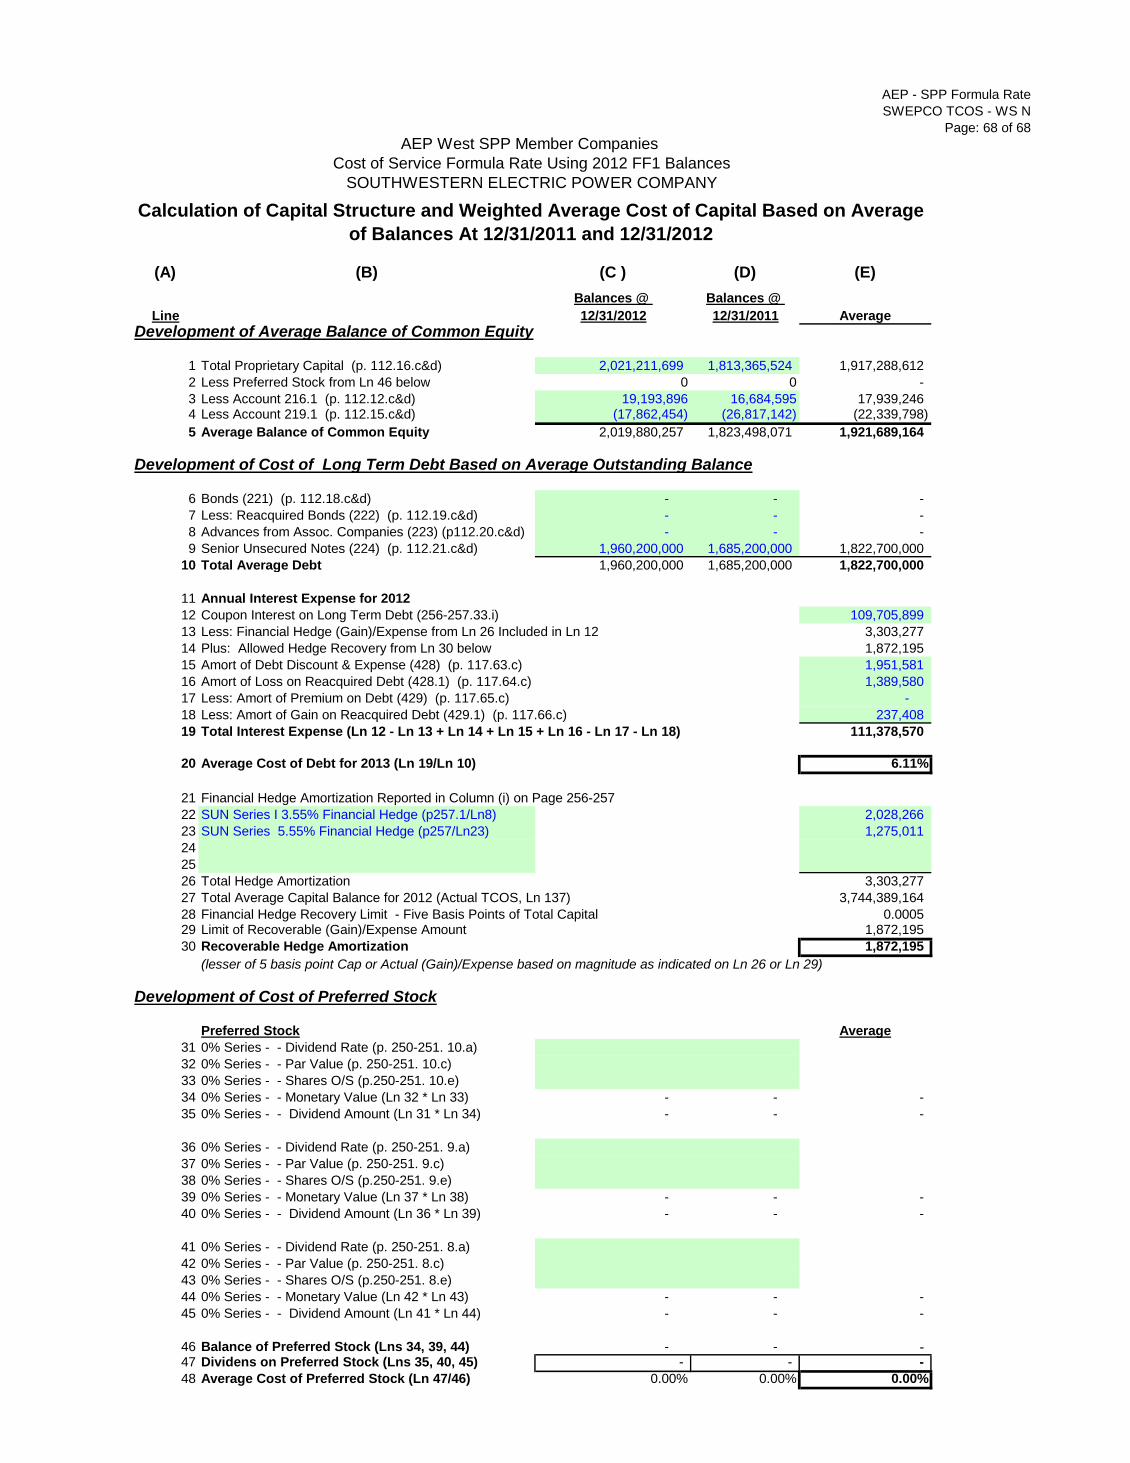
AEP - SPP Formula Rate
SWEPCO TCOS - WS N
Page: 68 of 68
(A) (B) (C ) (D) (E)
Balances @ Balances @
Line 12/31/2012 12/31/2011 Average
Development of Average Balance of Common Equity
1 Total Proprietary Capital (p. 112.16.c&d) 2,021,211,699 1,813,365,524 1,917,288,612
2 Less Preferred Stock from Ln 46 below 0 0 -
3 Less Account 216.1 (p. 112.12.c&d) 19,193,896 16,684,595 17,939,246 4 Less Account 219.1 (p. 112.15.c&d) (17,862,454) (26,817,142) (22,339,798)
5 Average Balance of Common Equity 2,019,880,257 1,823,498,071 1,921,689,164
Development of Cost of Long Term Debt Based on Average Outstanding Balance
6 Bonds (221) (p. 112.18.c&d) - - -
7 Less: Reacquired Bonds (222) (p. 112.19.c&d) - - -
8 Advances from Assoc. Companies (223) (p112.20.c&d) - - -
9 Senior Unsecured Notes (224) (p. 112.21.c&d) 1,960,200,000 1,685,200,000 1,822,700,000
10 Total Average Debt 1,960,200,000 1,685,200,000 1,822,700,000
11 Annual Interest Expense for 2012
12 Coupon Interest on Long Term Debt (256-257.33.i) 109,705,899
13 Less: Financial Hedge (Gain)/Expense from Ln 26 Included in Ln 12 3,303,277
14 Plus: Allowed Hedge Recovery from Ln 30 below 1,872,195
15 Amort of Debt Discount & Expense (428) (p. 117.63.c) 1,951,581
16 Amort of Loss on Reacquired Debt (428.1) (p. 117.64.c) 1,389,580
17 Less: Amort of Premium on Debt (429) (p. 117.65.c) -
18 Less: Amort of Gain on Reacquired Debt (429.1) (p. 117.66.c) 237,408
19 Total Interest Expense (Ln 12 - Ln 13 + Ln 14 + Ln 15 + Ln 16 - Ln 17 - Ln 18) 111,378,570
20 Average Cost of Debt for 2013 (Ln 19/Ln 10) 6.11%
21 Financial Hedge Amortization Reported in Column (i) on Page 256-257
22 SUN Series I 3.55% Financial Hedge (p257.1/Ln8) 2,028,266
23 SUN Series 5.55% Financial Hedge (p257/Ln23) 1,275,011
24
25
26 Total Hedge Amortization 3,303,277
27 Total Average Capital Balance for 2012 (Actual TCOS, Ln 137) 3,744,389,164
28 Financial Hedge Recovery Limit - Five Basis Points of Total Capital 0.0005 29 Limit of Recoverable (Gain)/Expense Amount 1,872,195
30 Recoverable Hedge Amortization 1,872,195
(lesser of 5 basis point Cap or Actual (Gain)/Expense based on magnitude as indicated on Ln 26 or Ln 29)
Development of Cost of Preferred Stock
Preferred Stock Average
31 0% Series - - Dividend Rate (p. 250-251. 10.a)
32 0% Series - - Par Value (p. 250-251. 10.c)
33 0% Series - - Shares O/S (p.250-251. 10.e)
34 0% Series - - Monetary Value (Ln 32 * Ln 33) - - -
35 0% Series - - Dividend Amount (Ln 31 * Ln 34) - - -
36 0% Series - - Dividend Rate (p. 250-251. 9.a)
37 0% Series - - Par Value (p. 250-251. 9.c)
38 0% Series - - Shares O/S (p.250-251. 9.e)
39 0% Series - - Monetary Value (Ln 37 * Ln 38) - - -
40 0% Series - - Dividend Amount (Ln 36 * Ln 39) - - -
41 0% Series - - Dividend Rate (p. 250-251. 8.a)
42 0% Series - - Par Value (p. 250-251. 8.c)
43 0% Series - - Shares O/S (p.250-251. 8.e)
44 0% Series - - Monetary Value (Ln 42 * Ln 43) - - -
45 0% Series - - Dividend Amount (Ln 41 * Ln 44) - - -
46 Balance of Preferred Stock (Lns 34, 39, 44) - - -
47 Dividens on Preferred Stock (Lns 35, 40, 45) - - -
48 Average Cost of Preferred Stock (Ln 47/46) 0.00% 0.00% 0.00%
Calculation of Capital Structure and Weighted Average Cost of Capital Based on Average
of Balances At 12/31/2011 and 12/31/2012
AEP West SPP Member Companies
Cost of Service Formula Rate Using 2012 FF1 Balances
SOUTHWESTERN ELECTRIC POWER COMPANY