Embed Size (px)
Citation preview

Never stop thinking.
AEC/APC Symposium XV
Advanced Process Control Implementation in Plasma Etch at Infineon Technologies RichmondPeter Gilgunn, Charles Venditti, Victor Morozov and Patrick Kelly

Presentation Agenda
Presentation ObjectiveAbout the EnvironmentThe Opportunity in Plasma EtchOur Vision of APCAn Implementation in 3 PhasesApplications and Operational BenefitsConclusionsAcknowledgements

Help the community learn from our successes and failures
Presentation Objective
Encourage the Doers:Focus on ROI to make APC happen in your Fab
Share the IFR Plasma Etch APC experience
Tell the Decision Makers:Return on Investment (ROI) can be achieved with APC

About the Environment
Infineon Technologies Richmond200mm CMOS Fab (1st Si in March 1998)Deep trench based DRAM140nm technology in volume production
Plasma etch department Process, equipment and manufacturing> 20 manufactured etch stages>10000 wspw through each manufactured stage>180 process/chamber combinations under control>170 product/parameter combinations under control
Assuming 10000 wspw
52 weeks per year 300 die per wafer
$2 per die
1% yield or volume =
$3 120 000 revenue
Assuming 300 die per wafer
$2 per die
1 scrap lot (25 wafers) =
$15 000 revenue

About the Environment
Where we came fromStatistical process control (SPC) on in-line product dataEquipment health monitoring through blanket wafer qualificationsActivity based preventive maintenanceUnscheduled maintenance driven by excursions (SPC, parametric or yield) and hard tool faults

The Opportunity in Plasma Etch
Irreversible yield critical processSensitive to all incoming variations 3-dimensional process output limits the ability of metrology to represent process health and predict yield
etched feature dimensions and shape must fit
poly-siarc
oxide
nitride
silicon substrate impingement
film thickness and composition effect etch after etch
there is no way back!
The Opportunity in Plasma Etch
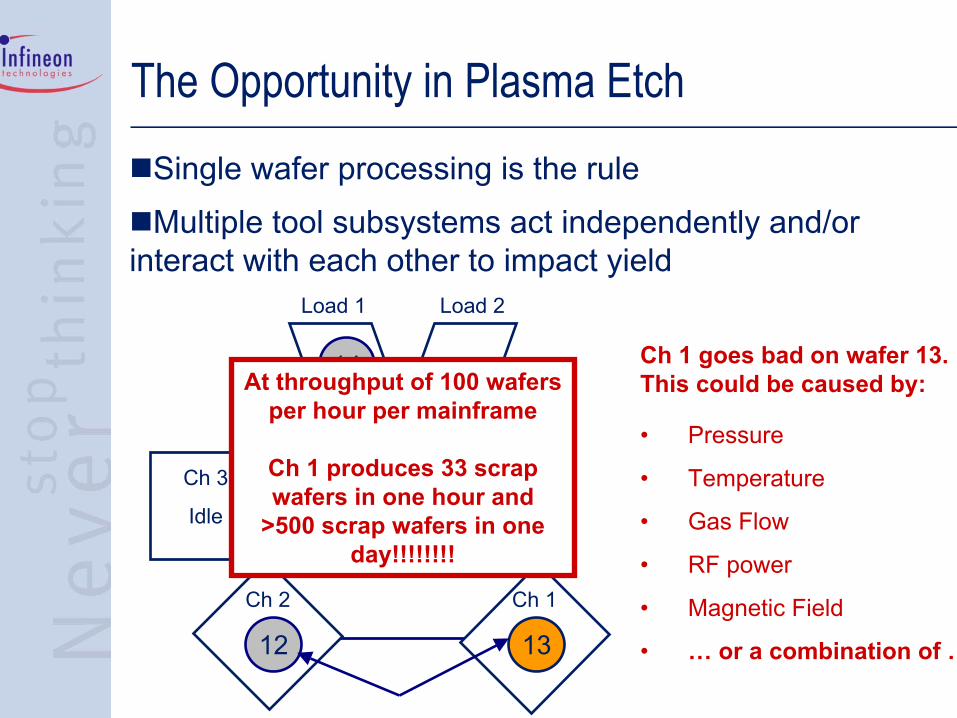
Single wafer processing is the ruleMultiple tool subsystems act independently and/or
interact with each other to impact yieldLoad 1 Load 2
Ch 1Ch 2
Ch 3
Idle
1312
Buffer
14
• Pressure
• Temperature
• Gas Flow
• RF power
• Magnetic Field
• … or a combination of …
At throughput of 100 wafers per hour per mainframe
Ch 1 produces 33 scrap wafers in one hour and
>500 scrap wafers in one day!!!!!!!!
Ch 1 goes bad on wafer 13. This could be caused by:
The Opportunity in Plasma Etch
More dataneeded from More sources

Our Vision of APC
Divergences from optimal conditions will be detected and compensated on first wafer (FDC)Every wafer leaves the Fab achieving its maximum yield potential – dynamic artisan processing (R2R)Capital equipment time will be utilized solely for production or predictive maintenance (OEE)Metrology will be a value added process (R2R)

Our Vision of APC
Future ConsiderationsAPC systems should be scaleable Wafer level Fab Cluster levelHigh volume commodity products Complex multi-generational portfolios

An Implementation in 3 Phases
Jan-
00
Apr
-00
Jul-0
0
Oct
-00
Jan-
01
Apr
-01
Jul-0
1
Oct
-01
Jan-
02
Apr
-02
Jul-0
2
Oct
-02
Jan-
03
Apr
-03
Jul-0
3
Oct
-03
Jan-
04
Apr
-04
Jul-0
4
Dedicated APC h/c added and
spun off
Phase 2
Phase 3
Phase 1 Projected m/h
190nm 170nm 140nm 110nm
non-APC m/h
dedicated APC m/h
Non-dedicated APC m/h
Engineering Man hours

An Implementation in 3 Phases
• Shallow trench isolation depth control (Jowett and Morozov, “Shallow Trench Isolation Run–to–Run Control Project at Infineon Technologies Richmond”, ASMC 2002)
• 3% yield increase over 2 technology nodes
Phase 1 – Demonstrate Return On Investment (ROI)Reduce scrap with FDC
• Deep trench and metal etch• ~$3M revenue savings over 12 months
Increase yield with R2R
Identify infrastructure and database requirements
Justify additional resource allocation

An Implementation in 3 Phases
Plasma Etch Wafer Scrap
0 1 2
6 Month Period
Nor
mal
ized
Waf
ers
Scra
pped
FDC impact at two critical process steps ~$3M revenue savings
65% reduction

An Implementation in 3 Phases
Obstacles• Inertia – reliance on traditional paradigm• Skepticism – uncertainty of new paradigm• Skills gap – no experience in APC
Phase 1 – Demonstrate Return On Investment (ROI)
How We Overcame Them• Charismatic project manager• Small team of consensual junior engineers• Utilized internal competence centers• Workshops and conferences• Hired for missing skills

An Implementation in 3 Phases
Phase 2 – Develop Infrastructure and ApplicationsDevelop infrastructure based on Phase 1 learning
• Equipment to CIM communication• Server hardware upgrades for functionality• “Tool server” creation for each vendor
mainframe
Hardware and software training for engineers• Data access• Data handling and manipulation
Identify applications for automation and roll-out
Justify additional resource allocation

An Implementation in 3 Phases
Phase 2 – Develop Infrastructure and ApplicationsObstacles
• Unrealistic expectations• Multiple databases with incompatible data
structure• Lack of resources both capital and human
How We Overcame Them• Prioritized projects • Pareto and FMEA• Included product yield and quality groups• Focused on ROI as top priority

An Implementation in 3 Phases
Phase 3 – Automate Applications and Rollout Area-wideAutomate four applications
• Statistical machine control (FDC)• SPC by chamber (FDC)• Run to run (R2R)• Qual elimination (OEE)
Justify additional resource allocation
Monitor progress and stay on timeline

An Implementation in 3 Phases
Obstacles• Lack of capital• Lack of human resources• Managing a large quantity of milestones
Phase 3 – Automate Applications and Rollout Area-wide
How We Overcame Them• Focused on ROI • Created a graphical metric• Tracked unique milestone completion

An Implementation in 3 Phases
SMC Capability
EP logbooks
Chamber EP Data
SPC by Chamber
Etchrate Qual
EliminationParticle Qual Elimination
SMC Methods Run to Run
1 Proc1 03ww06 03ww07 03ww08 03ww33 03ww32 x2 Proc2 03ww06 03ww07 03ww08 03ww09 03ww333 Proc3 x 03ww07 03ww08 03ww26 x x x4 Proc4 03ww06 03ww07 03ww08 03ww26 03ww33 x5 Proc5 03ww14 03ww07 03ww20 03ww26 03ww33 x
ProcessItem #
Actual Completion Week
Phase 3 – APC Implementation Metric
SMC Capability
EP logbooks
Chamber EP Data
SPC by Chamber
Etchrate Qual
EliminationParticle Qual Elimination
SMC Methods Run to Run
1 Proc1 03ww06 03ww07 03ww08 03ww09 03ww45 03ww50 03ww45 x2 Proc2 03ww06 03ww07 03ww08 03ww09 03ww27 03ww50 03ww37 03ww443 Proc3 x 03ww07 03ww08 03ww28 x x 03ww41 x4 Proc4 03ww06 03ww07 03ww08 03ww33 03ww45 03ww50 03ww45 x5 Proc5 03ww18 03ww07 03ww20 03ww28 03ww45 03ww50 03ww44 x
ProcessItem #
Target Completion Week
> 20 processes total

An Implementation in 3 Phases
Phase 3 - Etch APC Implementation Metric
020406080
100120140160180
03w
w01
03w
w04
03w
w07
03w
w10
03w
w13
03w
w16
03w
w19
03w
w22
03w
w25
03w
w28
03w
w31
03w
w34
03w
w37
03w
w40
03w
w43
03w
w46
03w
w49
03w
w52
Fiscal Week
# of
Mile
ston
es
Target Milestones CompletedActual Milestones Completed

Applications and Operational Benefits
Wafer-chamber data enabled chamber level yield tracking and improved troubleshooting

Applications and Operational Benefits
Product etchrate data enabled qual elimination
Availability to production increased by 2% on average, test wafer usage reduced by 80% and associate productive time was increased

Applications and Operational Benefits
Yield
Helium Leak Rate
Expanded Operating Region
Yield
Helium Leak Rate
Expanded Operating Region
SMC data enabled improved fault management for OEE and predictive maintenance without loss of resolution
Allowing production in the expanded operating region increased availability by 1% and yield by 0.1%
Original fault limit

Applications and Operational Benefits
SMC data provided context to OEE statistics
0
50
100
150
200
250
300
350
Min
(RFH
OU
RA
)
12Se
p200
2 12
:00
AM
14Se
p200
2 12
:00
AM
16Se
p200
2 12
:00
AM
18Se
p200
2 12
:00
AM
20Se
p200
2 12
:00
AM
22Se
p200
2 12
:00
AM
24Se
p200
2 12
:00
AM
26Se
p200
2 12
:00
AM
28Se
p200
2 12
:00
AM
30Se
p200
2 12
:00
AM
02O
ct20
02 1
2:00
AM
04O
ct20
02 1
2:00
AM
06O
ct20
02 1
2:00
AM
08O
ct20
02 1
2:00
AM
10O
ct20
02 1
2:00
AM
12O
ct20
02 1
2:00
AM
14O
ct20
02 1
2:00
AM
16O
ct20
02 1
2:00
AM
18O
ct20
02 1
2:00
AM
20O
ct20
02 1
2:00
AM
22O
ct20
02 1
2:00
AM
24O
ct20
02 1
2:00
AM
26O
ct20
02 1
2:00
AM
28O
ct20
02 1
2:00
AM
30O
ct20
02 1
2:00
AM
01N
ov20
02 1
2:00
AM
03N
ov20
02 1
2:00
AM
05N
ov20
02 1
2:00
AM
07N
ov20
02 1
2:00
AM
09N
ov20
02 1
2:00
AM
11N
ov20
02 1
2:00
AM
13N
ov20
02 1
2:00
AM
15N
ov20
02 1
2:00
AM
17N
ov20
02 1
2:00
AM
19N
ov20
02 1
2:00
AM
21N
ov20
02 1
2:00
AM
23N
ov20
02 1
2:00
AM
25N
ov20
02 1
2:00
AM
27N
ov20
02 1
2:00
AM
29N
ov20
02 1
2:00
AM
01D
ec20
02 1
2:00
AM
03D
ec20
02 1
2:00
AM
05D
ec20
02 1
2:00
AM
07D
ec20
02 1
2:00
AM
09D
ec20
02 1
2:00
AM
11D
ec20
02 1
2:00
AM
13D
ec20
02 1
2:00
AM
15D
ec20
02 1
2:00
AM
17D
ec20
02 1
2:00
AM
19D
ec20
02 1
2:00
AM
21D
ec20
02 1
2:00
AM
Mi n(Run Date)
Gradient = f(UT)
TTCR
Chamber idle: Eng eval for yield issue
Process restriction
Unscheduled wet cleans
x – Process 1 + - Process 2 • - Process 3
Productive Wafers
Idle Time
Eng Unsch Down
Non Productive Wafers
PM
69.5% 6.9% 3.8% 18.4% 1.2% 0.2%

60
70
80
90
100
110
Med
ian(
YDC
_Reg
_A)
Oct
0120
02 1
2:00
AM
Oct
0820
02 1
2:00
AM
Oct
1520
02 1
2:00
AM
Oct
2220
02 1
2:00
AM
Oct
2920
02 1
2:00
AM
Nov
0520
02 1
2:00
AM
Nov
1220
02 1
2:00
AM
Nov
1920
02 1
2:00
AM
Nov
2620
02 1
2:00
AM
Dec
0320
02 1
2:00
AM
Dec
1020
02 1
2:00
AM
Dec
1720
02 1
2:00
AM
Dec
2420
02 1
2:00
AM
Dec
3120
02 1
2:00
AM
Mi n(Run Date)
-300
-250
-200
-150
-100
-50
0
50
100
Proc
ess
Mix
MTLA05 Median 140nm R1 YDC_A Compared with Yield
Process mixing
Process dedication
Start of wet clean cycle
Applications and Operational Benefits
SMC data provided context to chamber yield performance
Process dedication increased yield by 0.7%

Applications and Operational Benefits
Wafe
r Mea
n
Date/Time Stamp
Tool1 Tool2 Tool3 Process
Systems and data for monitoring dynamic metrology performance
Tool2 does not match other gauges

Applications and Operational Benefits
Happier engineers• Workload reduced by approx. 15%• Able to answer more questions• Able to prove the answer with data• Fewer excursions to clean up• More time to focus on interesting
engineering projects … like sensors!

Conclusions
APC implementation was a long road (3+ years for reasonable functionality and process coverage)The payoff is worth the effortOperational benefits in addition to FDC and R2R will be obtainedFocus on ROI to overcome obstaclesWe still have not reached the final destination
Next step – sensor integration??$$??

Acknowledgements
Contributions to the success of APC in etch were made by: The IFR CIM and EI team - Glenn Thompson, Mike Bussey, Norman England, Joyce Hartley and Bennie Fiol, without whose support our APC infrastructure would not existThe APC Team – James Welsh, Matt England and Gary Skinner, whose support on application development made our ideas reality and opened our minds to new possibilitiesThe Etch Cimco – Dean Smith, who supported our tool server upgrades and maintained our connectivity to the production equipmentIFX APC CoC – Ralf Otto for FDC wisdomErnst-Günter Mohr for the inspiration to get started

References
1. Thomas Sonderman, AMD, “APC as a Competitive Manufacturing Technology: AMD's Vision for 300mm”, Keynote Address, 3rd European AEC/APC Conference, April 2002
2. Brian Harrison, “Expanding the Control Paradigm by Excellence in Manufacturing Execution”, Keynote Address, AEC/APC Symposium XIV, September 2002
3. Hopp and Spearman, Factory Physics, 2nd Edition, page 254. Jowett and Morozov, “Shallow Trench Isolation Run–to–Run Control Project at Infineon
Technologies Richmond”, ASMC 20025. Karzhavin et al, “Advanced Process Control Project at Infineon Technologies Richmond”, Future
Fab volume 12