Embed Size (px)
Citation preview

Advice to follow a low-carbohydrate diet has a
favourable impact on low-grade inflammation
in type 2 diabetes compared with advice to
follow a low-fat diet.
Lena Jonasson, Hans Guldbrand, Anna K Lundberg and Fredrik H Nyström
Linköping University Post Print
N.B.: When citing this work, cite the original article.
Original Publication:
Lena Jonasson, Hans Guldbrand, Anna K Lundberg and Fredrik H Nyström, Advice to follow
a low-carbohydrate diet has a favourable impact on low-grade inflammation in type 2 diabetes
compared with advice to follow a low-fat diet., 2014, Annals of Medicine, (46), 3, 182-7.
http://dx.doi.org/10.3109/07853890.2014.894286
Copyright: Informa Healthcare
http://informahealthcare.com/
Postprint available at: Linköping University Electronic Press
http://urn.kb.se/resolve?urn=urn:nbn:se:liu:diva-107718
1
Advice to follow a low-carbohydrate diet has a favourable impact on low-grade
inflammation in type 2 diabetes compared with advice to follow a low-fat diet
Lena Jonasson, MD, PhDa, Hans Guldbrand, MD
a, Anna K Lundberg, PhD
a, Fredrik H
Nystrom, MD, PhDa
a Division of Cardiovascular Medicine, Department of Medical and Health Sciences, Faculty
of Health Science, Linköping University, SE-581 85 Linköping, Sweden.
Corresponding author:
Lena Jonasson
Division of Cardiovascular Medicine, Department of Medical and Health Sciences, Faculty of
Health Sciences, Linköping University
SE-58185 Linköping, Sweden
Telephone: +46(0)10 103 51 94, fax: +46(0)13 149 106
E-mail: [email protected]
Running title: Effects of low-carbohydrate diet on inflammation

2
Abstract
Inflammation may play an important role in type 2 diabetes. It has been proposed that dietary
strategies can modulate inflammatory activity. We investigated the effects of diet on
inflammation in type 2 diabetes by comparing a traditional low-fat diet (LFD) with a low-
carbohydrate diet (LCD). Patients with type 2 diabetes were randomised to follow either LFD
aiming for 55-60 energy percent, (E%), from carbohydrates (n = 30) or LCD aiming for 20
E% from carbohydrates (n = 29). Plasma was collected at baseline and after 6 months. C-
reactive protein (CRP), interleukin-1 receptor antagonist (IL-1Ra), IL-6, tumor necrosis factor
receptor (TNFR)1 and TNFR2 were determined. Both LFD and LCD led to similar reductions
in body weight while beneficial effects on glycemic control were observed in the LCD group
only. After 6 months, the levels of IL-1Ra and IL-6 were significantly lower in the LCD
group than in the LFD group, 978 (664-1385) vs 1216 (974-1822) pg/ml and 2.15 (1.65-4.27)
vs 3.39 (2.25-4.79) pg/ml, both p < 0.05. To conclude, advice to follow LCD or LFD had
similar effects on weight reduction while effects on inflammation differed. Only LCD was
found to significantly improve the subclinical inflammatory state in type 2 diabetes.
Trial registration: ClinicalTrials.gov NCT01005498
Key words Inflammation, Cytokine, Type 2 diabetes, Dietary intervention

3
Key messages
In type 2 diabetes, randomization to advice to follow a low-carbohydrate diet or a low-fat diet
had similar effects on weight reduction while effects on inflammation differed.
After 6 months, low-carbohydrate diet, but not low-fat diet, had a favourable impact on the
low-grade inflammation in type 2 diabetes.

4
Introduction
Inflammation is considered to play an important role in the development of type 2 diabetes as
well as in further complications of the disease. At the cellular level, the expression of
proinflammatory cytokines like interleukin (IL) -1 and tumor necrosis factor (TNF) is
implicated in insulin resistance and beta-cell failure (1). An enhanced inflammatory activity is
also detected in peripheral blood. It has been consistently shown in several clinical studies
that the levels of inflammatory markers such as C-reactive protein (CRP) and IL-6 are
increased in patients with type 2 diabetes compared with healthy individuals, thus indicating a
low-grade systemic inflammation (1-5). A few studies have also measured IL-1 and TNF in
the circulation but with less consistent results (3,4,6), probably due to the fact that circulating
levels of IL-1 and TNF are often marginal. Instead, their major inhibitors, IL-1 receptor
antagonist (Ra), TNFR1 and TNFR2, are readily secreted into the blood and considered
reliable markers of activity of the cytokines (7-9). Accordingly, elevated levels of IL-1Ra and
TNFR2 in plasma have been associated with both insulin resistance and type 2 diabetes (10-
12). Interestingly, IL-1Ra levels also predict the incidence of type 2 diabetes independently of
CRP levels and other risk factors (5,13). Moreover, circulating levels of TNFR2 predict
morbidities such as cardiovascular disease and nephropathy in patients with type 2 diabetes
(14,15).
Life style interventions play a crucial role in the management of type 2 diabetes and may also
lead to reduced inflammation (1,16). The anti-inflammatory effects have been attributed
mainly to the concomitant weight loss whereas the effects of interventional strategies alone,
e.g. dietary change, have been more difficult to verify. Traditionally, a low-fat diet has been
the recommendation for achieving weight loss and improved glycemic control in type 2

5
diabetes. However, although still controversial, evidence is emerging that a low-fat, high-
carbohydrate diet has less favourable metabolic effects compared with a low-carbohydrate
diet or Mediterranean diet in subjects at high cardiovascular risk (17-22). Moreover, intake of
carbohydrates, in particular refined carbohydrates, have been associated with a
proinflammatory response (23-25) whereas diets high in unsaturated and polyunsaturated fatty
acids may decrease inflammation (16,22).
By using a randomized study design, our aim was to investigate the effects of diet on systemic
inflammation in type 2 diabetes by comparing a low-fat diet (LFD) with a low-carbohydrate
diet (LCD) during weight loss.
Material and Methods
The study was performed in two primary healthcare centers in the southeastern part of
Sweden. The inclusion criteria were a diagnosis of type 2 diabetes treated with diet with or
without oral glucose-lowering medication or insulin. Exclusion criteria were difficulties in
understanding the Swedish language, severe mental disease, malignant disease or drug abuse.
Patients were randomized to advice to follow either a traditional LFD (aiming for 30 energy
percent, E%, from fat) or an LCD (aiming for 20 E% from carbohydrates) over 2 years, as
recently described (20). Randomization was performed by drawing blinded ballots. The
energy contents of diets were similar, 6694 kJ/day (1600 kcal/day) for women and 7531
kJ/day (1800 kcal/day) for men. Dietary advices were given by physicians on a group basis at
baseline, 2, 6 and 12 months, and standardized in regard to energy content and nutrient
composition. One dedicated dietician provided all participants with suitable recipes at each
group meeting and was also available for questions from participants during the whole study

6
period. Diet records from 3 consecutive days were performed at baseline, 3, 6, 12 and 24
months. Plasma samples were collected at baseline and 6 months, i.e. the time point when
weight-loss and compliance was maximal. Plasma samples were also collected from 41
control subjects in the same region, randomly invited from the Swedish Population Register.
Subjects who accepted the invitation were included as controls if they were anamnestically
healthy and received no medication. Anamnesis was gained by one dedicated nurse
coordinator who also performed the blood sampling. None of the participants exhibited any
clinical signs of acute inflammation at the time of blood collection. The research protocol was
approved by the Ethical Review Board of Linköping University. Written informed consent
was obtained from all participants. The study was registered with trial number NCT01005498
at ClinicalTrials.gov.
Plasma C-reactive protein (CRP) was measured using an immunoassay (Roche Diagnostics
GmbH, Vienna, Austria) with a detection limit of 0.03 mg/l. IL-6 and TNFRs were measured
in plasma by ELISA assays (RnD Systems Europe, Abingdon, United Kingdom) with
detection limits of 0.48 pg/mL (IL-6), 0.8 pg/mL (TNFR1) and 0.6 pg/mL (TNFR2). TNF,
IL1 and IL-1Ra were analysed with Luminex (RnD Systems) with the detection limits 5.4,
2.8 and 7.9 pg/mL respectively. Interassay coefficients of variation were 4.5 %, 8.1 %, 4.7 %,
12 % and 11 % for CRP, IL-6, TNFR1, TNFR2 and IL-1Ra, respectively.
IBM SPSS Statistics 19 (SPSS Inc., Chicago, IL, USA) was used for statistical analyses.
Differences within and between groups were analyzed with Student´s paired and unpaired
two-tailed t test except for inflammatory markers that were not normally distributed. For
CRP, IL-6, TNFR1, TNFR2 and IL-1Ra, Mann-Whitney U test was used for between-group
comparisons differences and Wilcoxon signed ranks test for within-group comparisons. For

7
correlation analyses Spearman´s rank correlation was used. A linear multiple regression
analysis was performed to assess the independent contribution of different factors to changes
in cytokine levels. Effects on weight and HbA1c levels were main outcome variables. The
original statistical power calculation that has been previously described (20) was based on an
earlier 6-month pilot study of 28 participants with type 2 diabetes who were randomised to
the same diets as in the present study. Twenty patients completed the study and both diet
groups achieved similar reductions in weight while HbA1c levels tended to decrease in the
LCD group only. Based on the results from the pilot study, the number of participants in the
present trial was increased to at least 30 in each group.
Results
Study participants
Seventy-two patients were consecutively invited by the study nurses to participate. As shown
in the flow diagram (Figure 1), 61 patients entered the study. No patients were lost to follow-
up. Demographic and diabetes-related variables of patients in the two groups are presented in
Table 1. None of the participants were smokers. At baseline, 24 (77 %) LFD patients and 22
(73 %) LCD patients were treated with cholesterol-lowering drugs (statins).
Effects on metabolic parameters
The results of dietary records are shown in Table 2. Adherence to proposed diet was similar in
both groups. However, the most prominent changes in nutrient intake were seen in the LCD
group with a significant reduction in E% intake from carbohydrates and a concomitant
increase in E% intake from fat. At 6 months, the E% intake from fat:carbohydrate was 29:49
in the LFD group and 49:25 in the LCD group. No patients were lost to follow-up. The levels
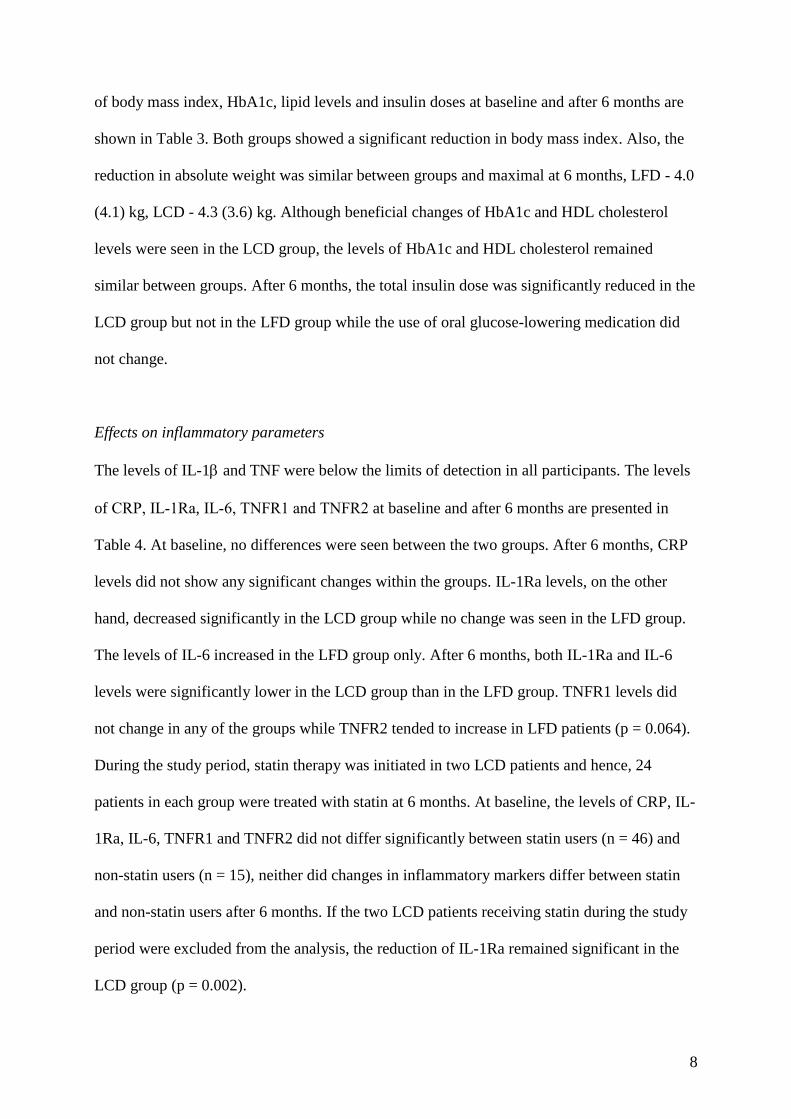
8
of body mass index, HbA1c, lipid levels and insulin doses at baseline and after 6 months are
shown in Table 3. Both groups showed a significant reduction in body mass index. Also, the
reduction in absolute weight was similar between groups and maximal at 6 months, LFD - 4.0
(4.1) kg, LCD - 4.3 (3.6) kg. Although beneficial changes of HbA1c and HDL cholesterol
levels were seen in the LCD group, the levels of HbA1c and HDL cholesterol remained
similar between groups. After 6 months, the total insulin dose was significantly reduced in the
LCD group but not in the LFD group while the use of oral glucose-lowering medication did
not change.
Effects on inflammatory parameters
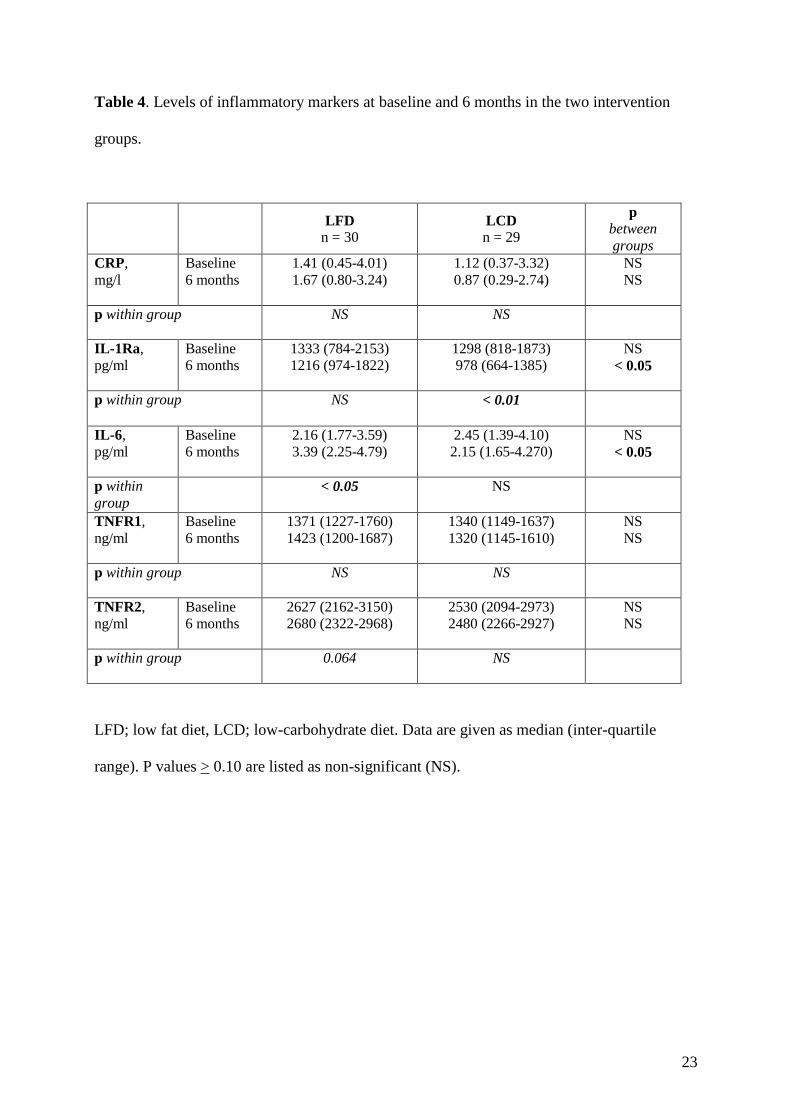
The levels of IL-1 and TNF were below the limits of detection in all participants. The levels
of CRP, IL-1Ra, IL-6, TNFR1 and TNFR2 at baseline and after 6 months are presented in
Table 4. At baseline, no differences were seen between the two groups. After 6 months, CRP
levels did not show any significant changes within the groups. IL-1Ra levels, on the other
hand, decreased significantly in the LCD group while no change was seen in the LFD group.
The levels of IL-6 increased in the LFD group only. After 6 months, both IL-1Ra and IL-6
levels were significantly lower in the LCD group than in the LFD group. TNFR1 levels did
not change in any of the groups while TNFR2 tended to increase in LFD patients (p = 0.064).
During the study period, statin therapy was initiated in two LCD patients and hence, 24
patients in each group were treated with statin at 6 months. At baseline, the levels of CRP, IL-
1Ra, IL-6, TNFR1 and TNFR2 did not differ significantly between statin users (n = 46) and
non-statin users (n = 15), neither did changes in inflammatory markers differ between statin
and non-statin users after 6 months. If the two LCD patients receiving statin during the study
period were excluded from the analysis, the reduction of IL-1Ra remained significant in the
LCD group (p = 0.002).

9
Correlations between baseline variables and between changes during intervention
All inflammatory markers were correlated with each other (p-values of at least 0.01).
Moreover, all inflammatory markers were significantly correlated with BMI (p-values of at
least 0.01). Levels of CRP, TNFR1 and TNFR2 showed correlations with insulin therapy as
well as insulin dose (p < 0.05) while levels of IL1-Ra, TNFR1 and TNFR2 were correlated
with HbA1c (p < 0.05). The change in IL-1Ra during intervention was correlated with
changes in BMI (r = 0.302, p < 0.05), HbA1c (r = 0.411, p < 0.01), CRP (r = 0.245, p < 0.05)
and IL-6 (r = 0.266, p < 0.05) but not with changes in energy intake, HDL cholesterol or
insulin dose. The change in IL-6 correlated with change in CRP (p < 0.05) but not with
changes in energy intake, BMI, weight, HbA1c, HDL cholesterol or insulin dose. In multiple
regression analyses using change in IL-1Ra as dependent variable and changes in BMI,
HbA1c, CRP and IL-6 as independent variables, change in IL-1Ra remained associated with
change in HbA1c only (standardized regression coefficient = 0.365, p <0.05).
Comparison with a population without known diabetes
Forty-one clinically healthy subjects, 24 men and 17 women, all non-smokers, (age 64 (7.9)
years, BMI 25 (3.2) kg/m2), were recruited as clinically healthy controls in order to provide
“reference” levels of systemic inflammatory markers. The levels in the controls were
significantly lower compared with the baseline levels in patients; CRP 0.73 (0.32-1.19) mg/l,
IL-1Ra 713 (569-889) pg/ml, IL-6 1.34 (1.03-2.22) pg/ml, TNFR1 1168 (1996-2502) ng/ml,
and TNFR2 2197 (1996-2502) ng/ml, p values of < 0.05, < 0.001, < 0,001, <0.001, and <
0.05, respectively. In the LCD group, the levels of IL-1Ra and IL-6 were still significantly
higher than in controls after 6 months, p < 0.05 and p < 0.01, respectively, while CRP had
reached levels that were similar to controls (Table 4).

10
Discussion
In the present study, we provide evidence that advice to follow a LCD reduces the subclinical
proinflammatory state in type 2 diabetes. Despite similar weight loss and similar total energy
intake in patients who were randomized to follow either LFD or LCD, cytokine levels were
differently affected in the two groups. After 6 months, IL-1Ra showed a significant decrease
in patients who were randomized to follow LCD while IL-6 increased (and TNFR2 tended to
increase) in those who followed LFD. Overall, these changes resulted in significantly lower
levels of IL-1Ra and IL-6 in the LCD group compared with the LFD group at 6 months.
Clinical studies investigating the effects of carbohydrate restriction on inflammation are
sparse but results that are in line with our findings have been reported. In one study, 40
overweight individuals with atherogenic dyslipidemia were randomised to ad libitum diets
very low in carbohydrate (12 %) or low in fat (24 %) for 12 weeks. Both diets decreased the
levels of inflammatory proteins but overall, the anti-inflammatory effect of carbohydrate
restriction was larger in the very low carbohydrate group than in the LFD group (26). A
recent study by Davis et al (27) compared LFD with LCD in 51 patients with type 2 diabetes
and in contrast to our results, did not find any differences in IL-6 after 6 months. On the other
hand, these authors observed a decrease in soluble adhesion molecules, like E-selectin, in the
LCD arm only. Anti-inflammatory effects of carbohydrate restriction have also been reported
in animal models. Guinea pigs assigned to be fed LCD for 12 weeks showed significantly
lower levels of inflammatory markers and oxidized cholesterol in the aorta compared with
guinea pigs fed LFD (28).

11
A carbohydrate-rich diet itself has also been associated with proinflammatory effects. A
regimen of 4 month eucaloric LFD in 22 healthy women resulted in unfavourable effects on
inflammatory markers including CRP and IL-6 (29). In the large PREDIMED Study, subjects
at high cardiovascular risk were randomized to either two types of Mediterranean diet or a
control diet (21). The control diet group who received advice to follow a low-fat diet reported
44 E% intake from carbohydrates which is rather close to the carbohydrate intake in our LFD
group (49 E%). In a minor substudy of PREDIMED, the levels of IL-6 and soluble adhesion
molecules decreased in the Mediterranean diet groups while a significant increase was
observed in the control group after 3 months (30). In a larger substudy of PREDIMED, the
levels of IL-6, TNFR1 and TNFR2 decreased in the Mediterranean diet groups while TNFR1
and TNFR2 increased significantly and IL-6 trended upwards in the control group after 12
months thus supporting that advice to reduce fat intake, and thereby increase carbohydrate
intake, is associated with proinflammatory effects (31). Notably, the PREDIMED Study
showed a significantly higher incidence of both type 2 diabetes and major cardiovascular
events in the control group compared with the Mediterranean diet group after a median
follow-up of 4-5 years (19,21).
Several mechanistic studies have reported that acute exposure to carbohydrates induces a
proinflammatory response (1,16). This effect is also more pronounced in subjects with obesity
or impaired glucose tolerance (32,33). In obese patients presenting for bariatric surgery, a
history of high carbohydrate intake was associated with significantly higher odds of
inflammation in the liver while higher fat intake was associated with less inflammation (34).
Also, the type of carbohydrate may have a major influence on inflammation. Both population-
based and experimental studies have provided evidence that high intake of refined or simple
carbohydrates is associated with proinflammatory effects (23-25). In the LCD group of our

12
study, the reduction in consumption of simple carbohydrates (monosacharides, disaccharides
and saccharose) was more pronounced than the reduction in fiber consumption, thus allowing
us to speculate that this might have contributed to the lower cytokine levels.
Not only the nature of carbohydrates but also the nature of dietary fats can modulate
inflammation. Several studies have reported that a meal enriched in saturated fatty acids is
followed by a proinflammatory response. On the other hand, diets high in unsaturated or
polyunsaturated fatty acids have been associated with anti-inflammatory effects (22,30,31).
Based on dietary records, we found no changes in the proportional intake of saturated,
unsaturated and polyunsaturated fatty acids in the LFD group over 6 months. In the LCD
group, the percentage of energy intake from saturated fat showed a significant increase but
concomitantly, similar increases in intake of unsaturated and polyunsaturated fat were seen.
The reduction of IL-1Ra levels in the LCD group constituted the most prominent change in
inflammatory biomarkers. The reduction in IL-1Ra was also associated with a reduction in
HbA1c after adjustment for weight reduction and changes in CRP and IL-6, indicating a close
link between IL-1Ra and glycemic control. In a previous study, Ruotsalainen et al (9) used a
broad panel of cytokines in order to examine whether levels were abnormal in 129 offspring
of patients with type 2 diabetes. Interestingly, only the levels of IL-1Ra were elevated in
normoglycemic offspring and even more so in offspring with impaired glucose tolerance
compared with healthy controls suggesting that IL-1Ra is the most sensitive marker of
cytokine response in the prediabetic state.
According to current guidelines, the majority of patients were treated with statin which, to
some extent, may affect the inflammatory response. In vitro, statins exert a wide variety of

13
anti-inflammatory effects and in randomized trials, it is well documented that statins reduce
plasma levels of CRP whereas effects of cytokine levels are less evident (35). We did not find
any significant association between changes in inflammatory markers and statin therapy.
However, it is still possible that diet-induced effects on CRP levels have been attenuated by
the extensive use of statin in our study.
Advice to follow LFD or LCD had similar effects on weight reduction in our study. This is
not in agreement with previous randomized studies reporting a greater weight loss with LCD
than with LFD (36). One explanation may be that our aim was to achieve similar energy
restriction in the two groups in order to focus on the effects of macronutrient composition.
Accordingly, both groups also reported similar energy intake during the study.
One limitation of our study is the limited sample size and possible impact of other lifestyle
related factors which is a methodological problem in any nutritional intervention. The patients
were also informed of randomization results before the diet record at baseline was performed.
This may explain why the reported intake of fat and carbohydrates differed between groups at
baseline. The participants may already have started to adjust their diets according to allocated
diet. No participants were lost to follow-up is which is a strength of the study. The fact that
study nurses in the two primary health care centres had been responsible for the care of the
participants ahead of the study start may explain this remarkably high participation rate.
Efforts to reduce systemic inflammation in patients with type 2 diabetes may be of uttermost
importance for the prevention of complications, such as cardiovascular disease and
nephropathy. Carbohydrate restriction has been associated with anti-inflammatory effects but
still, evidence is insufficient to support specific amounts of carbohydrate and fat intake in

14
individuals with type 2 diabetes, as stated by American Diabetes Association in their recently
published recommendations for dietary therapy (37). Our findings, however, indicate that the
use of LCD aiming for 20 E% intake from carbohydrates may be an effective strategy to
improve the subclinical inflammatory state in type 2 diabetes.
Disclosure of interest
The authors report no conflicts of interest.
References
1. Kolb H, Mandrup-Poulsen T. An immune origin of type 2 diabetes? Diabetologia.
2005;48:1038-50.
2. Pradhan AD, Manson JE, Rifai N, Buring JE, Ridker PM. C-reactive protein, interleukin-6
and risk of developing type 2 diabetes mellitus. JAMA. 2001;286:327-34.
3. Spranger J, Kroke A, Möhlig M, Hoffmann K, Bergmann MM, Ristow M, et al.
Inflammatory cytokines and the risk to develop type 2 diabetes. Results of the prospective
population-based European prospective investigation into cancer and nutrition (EPIC).
Potsdam Study. Diabetes. 2003;52:812-7.
4. Pham MN, Hawa MI, Pfleger C, Roden M, Schernthaner G, Pozzilli P, et al. Pro-and anti-
inflammatory cytokines in latent autoimmune diabetes in adults, type 1 and type 2 diabetes
patients: Action LADA 4. Diabetologia. 2011;54:1630-8.

15
5. Luotola K, Pietilä A, Zeller T, Moilanen L, Kähönen M, Nieminen MS, et al. Associations
between interleukin-1 (IL-1) gene variations or IL-1 receptor antagonist levels and the
development of type 2 diabetes. J Intern Med. 2011;269:322-32.
6. Plomgaard P, Nielsen AR, Fischer CP, Mortensen OH, Broholm C, Penkowa M, et al.
Associations between insulin resistance and TNF-alpha in plasma, skeletal muscle and
adipose tissue inhumans with and without type 2 diabetes. Diabetologia. 2007;50:2562-71.
7. Aderka D. The potential biological and clinical significance of the soluble tumor necrosis
factor receptors. Cytokine Growth Factor Rev. 1996;7:231-40.
8. Hurme M, Santtila S. IL-1 receptor antagonist (IL-1Ra) plasma levels are co-ordinately
regulated by both IL-1Ra and IL-beta genes. Eur J Immunol. 1998;28:2598-602.
9. Ruotsalainen E, Salmenniemi U, Vauhkonen I, Pihlajamäki J, Punnonen K, Kainulainen S,
et al. Changes in inflammatory cytokines are related to impaired glucose tolerance in
offspring of type 2 diabetic subjects. Diabetes Care. 2006;29:2714-20.
10. Fernández-Real JM, Broch M, Ricart W, Casamitjana R, Gutierrez C, Vendrell J, et al.
Plasma levels of the soluble fraction of tumor necrosis factor receptor 2 and insulin resistance.
Diabetes. 1998;47:1757-62.
11. Meier CA, Bobbioni E, Gabay C, Assimacopoulos-Jeannet F, Golay A, Dayer JM. IL-1
receptor antagonist serum levels are increased in human obesity: a possible link to the
resistance to leptin? J Clin Endocrinol Metab. 2002;87:1184-8.
12. Somm E, Cettour-Rose P, Asensio C, Charollais A, Klein M, Theander-Carrillo C, et al.
Interleukin-1 receptor antagonist is upregulated during diet-induced obesity and regulates
insulin sensitivity in rodents. Diabetologia. 2006;49:387-93.
13. Herder C, Brunner EJ, Rathmann W, Strassburger K, Tabák AG, Schloot NC, et al.
Elevated levels of the anti-inflammatory interleukin-1 receptor antagonist precede the onset of
type 2 diabetes: the Whitehall II Study. Diabetes Care. 2009;32:421-3.
16
14. Shai I, Schulze MB, Manson JE, Rexrode KM, Stampfer MJ, Mantzoros C, et al.
A prospective study of soluble tumor necrosis factor-a receptor II (sTNFRII) and risk of
coronary heart disease among women with type 2 diabetes. Diabetes Care. 2005;28:1376-82.
15. Niewczas MA, Gohda T, Skupien J, Smiles AM, Walker WH, Rosetti F, et al. Circulating
TNF receptors 1 and 2 predict ESRD in type 2 diabetes. J Am Soc Nephrol. 2012;23:507-15.
16. Kolb H, Manrup-Poulsen T. The global diabetes epidemic as a consequence of lifestyle-
induced low-grade inflammation. Diabetologia. 2010;53:10-20.
17. Volek JS, Phinney SD, Forsythe CE, Quann EE, Wood RJ, Puglisi MJ, et al.
Carbohydrate restriction has a more favorable impact on the metabolic syndrome than a low
fat diet. Lipids. 2009;44:297-309.
18. Foster GD, Wyatt HR, Hill JO, Makris AP, Rosenbaum DL, Brill C, et al. Weight and
metabolic outcomes after 2 years on a low-carbohydrate versus low-fat diet. Ann Intern Med.
2010;153:147-157.
19. Salas-Salvadó J, Bulló M, Babio N, Martínez-González MÁ, Ibarrola-Jurado N, Basora J,
et al. Reduction in the incidence of type 2 diabetes with the Mediterranean diet: results of the
PREDIMED.Reus nutrition intervention randomuized trial. Diabetes Care. 2011;34:14-9.
20. Guldbrand H, Dizdar B, Bunjaku B, Lindström T, Bachrach-Lindström M, Fredrikson M,
et al. In type 2 diabetes, randomisation to advice to follow a low-carbohydrate diet transiently
improves glycaemic control compared with advice to follow a low-fat diet producing a similar
weight loss. Diabetologia. 2012;55:2118-27.
21. Estruch R, Ros E, Salas-Salvadó J, Covas MI, Corella D, Arós F, et al. Primary prevention
of cardiovascular disease with a Mediterranean diet. N Eng J Med. 2013;368:1279-90.
22. Esposito K, Marfella R, Ciotola M, Di Palo C, Giugliano F, Giugliano G, et al. Effect of a
Mediterranean-style diet on endothelial dysfunction and markers of vascular inflammation in
the metabolic syndrome: a randomized trial. JAMA. 2004;292:1440-1446.
17
23. Jiu S, Manson JA, Buring JE, Stampfer MJ, Willett WC, Ridker PM. Relation between a
diet with a high glycemic load and plasma concentrations of high-sensitive C-reactive protein
in middle-aged women. Am J Clin Nutr. 2002;75:492-498.
24. Schulze MB, Hoffmann K, Manson JE, Willett WC, Meigs JB, Weikert C, et al. Dietary
pattern, inflammation, and incidence of type 2 diabetes in women. Am J Clin Nutr.
2005;82:675-84.
25. Oliveira MC, Menezes-Garcia Z, Henriques MC, Soriani FM, Pinho V, Faria AM, et al.
Acute and sustained inflammation and metabolic dysfunction induced by high refined
carbohydrate-containing diet in mice. Obesity. 2013;21:E396-406.
26. Forsythe CE, Phinney SD, Fernandez ML, Quann EE, Wood RJ, Bibus DM, et al.
Comaprison of low fat and low carbohydrate diets on circulating fatty acid composition and
markers of inflammation. Lipids. 2008;43:65-77.
27. Davis NJ, Crandall JP, Gajavelli S, Berman JW, Tomuta N, Wylie-Rosett J, et al.
Differential effects of low-carbohydrate and low-fat diets on inflammation and endothelial
function in diabetes. J Diabetes Complications. 2011;25: 371-6.
28. Leite JO, DeOgburn R, Ratliff J, Su R, Smyth JA, Volek JS, et al. Low-carbohydrate diets
reduce lipid accumulation and arterial inflammation in guinea pigs fed a high-cholesterol diet.
Atherosclerosis. 2010;209;442-8.
29. Kasim-Karakas SE, Tsodikov A, Singh U, Jialal I. Responses to inflammatory markers to
a low-fat, high-carbohydrate diet: effects of energy intake. Am J Clin Nutr. 2006;83:774-9.
30. Mena MP, Sacanella E, Vazquez-Agell M, Morales M, Fito M, Escoda R, et al. Inhibition
of circulating immune cell activation: a molecular antiinflammatory effect of the
Mediterranean diet. Am J Clin Nutr. 2009;89:248-56.

18
31. Urpi-Sarda M, Casas R, Chiva-Blanch G, Romero-Mamani ES, Valderas-Martínez P,
Salas-Salvadó J, et al. The Mediterranean diet pattern and its main components are associated
with lower plasma concentrations of tumor necrosis factor receptor 60 in patients at high risk
for cardiovascular disease. J Nutr. 2012;142:1019-25.
32. Ziccardi P, Nappo F, Giugliano G, Esposito K, Marfella R, Cioffi M, et al. Inflammatory
cytokine concentrations are acutely increased by hyperglycemia in humans: role of oxidative
stress. Circulation. 2002;106:2067-72.
33. Gonzalez F, Miium J, Rote NS, Kirwan JP. Altered tumor necrosis factor alpha release
from mononuclear cells of obese reproductive-age women during hyperglycemia.
Metabolism. 2006;55:271-6.
34. Solga S, Alkhuraishe AR, Clark JM, Torbenson M, Greenwald A, Diehl AM, et al.
Dietary composition and nonalcoholic fatty liver disease. Dig Dis Sci. 2004;49:1578-83.
35. Devaraj S, Rogers J, Jialal I. Statins and biomarkers of inflammation. Curr Atheroscler
Rep. 2007;9:33-41.
36. Ajala O, English P, Pinkney J. Systematic review and meta-analysis of different dietary
approaches to the management of type 2 diabetes. Am J Clin Nutr. 2013;97:505-16.
37. Evert AB, Boucher JL, Cypress M, Dunbar SA, Franz MJ, Mater-Davis EJ, et al.
Nutrition Therapy Recommendations for the management of adults with diabetes. Diabetes
Care. 2013 Jan;37 Suppl 1:S120-43.

19
Table 1. Clinical and laboratory characteristics of the two intervention groups at baseline.
LFD
n = 31
LCD
n = 30
p
Age, years 63 (11) 61 (9.5) NS
Male/female, n 13/18 14/16 NS
Duration of diabetes, years 8.8 (6.2) 9.8 (5.5) NS
Dietary treatment only, n (%) 2 (6.5) 2 (6.7) NS
Oral glucose-lowering
treatment only, n (%)
13 (42) 15 (50) NS
Oral medication + insulin, n (%) 11 (35) 10 (33) NS
Insulin only, n (%) 5 (16) 3 (10) NS
Total insulin dose, E 39 (51) 42 (65) NS
Metformin dose, mg 1435 (946) 1375 (950) NS
Glibenclamide dose, mg 0.4 (1.9) 1.1 (2.6) NS
LFD; low fat diet, LCD; low-carbohydrate diet. If not stated otherwise, data are given as
mean (SD).

20
Table 2. Dietary outcomes at baseline and 6 months in the two intervention groups, (p values
> 0.10 are listed as non-significant, NS).
LFD
n = 31 LCD
n = 30 p
between
groups
Energy intake, kJ Baseline
6 months
1809 (493)
1553 (427)
1690 (426)
1384 (366)
NS
NS
p within group
< 0.01 < 0.001
Fat, E% Baseline
6 months
32 (5.2)
29 (5.4)
39 (6.8)
49 (7.5)
< 0.001
< 0.001
p within group
NS < 0.001
Carbohydrate, E% Baseline
6 months
49 (5.6)
49 (5.9)
41 (11)
25 (8.4)
< 0.01
< 0.001
p within group NS < 0.001
Protein, E% Baseline
6 months
19 (3.4)
20 (3.5)
19 (2.8)
23 (3.7)
NS
< 0.01
p within group
< 0.05 < 0.001
Total fat, g Baseline
6 months
66 (23)
53 (24)
74 (23)
79 (25)
NS
< 0.001
p within group
< 0.05 NS
Saturated fat, E% Baseline
6 months
13 (2.7)
11 (2.1)
16 (4.1)
20 (3.7)
NS
< 0.001
p within group
NS < 0.001
Unsaturated fat,
E%
Baseline
6 months
12 (2.2)
11 (2.5)
14 (2.8)
18 (3.2)
NS
< 0.001
p within group
NS < 0.001
Polyunsaturated
fat, E%
Baseline
6 months
5.2 (1.5)
5.1 (1.9)
5.9 (2.6)
7.7 (2.4)
NS
< 0.05
p within group
NS < 0.001
Total
carbohydrates, g
Baseline
6 months
213 (64)
182 (51)
167 (56)
82 (28)
< 0.05
< 0.001
p within group < 0.05 < 0.001

21
Fibers, E% Baseline
6 months
2.6 (0.6)
2.8 (0.7)
2.4 (0.7)
2.2 (0.7)
NS
< 0.01
p within group
NS < 0.05
Monosacharides,
E%
Baseline
6 months
7.2 (3.1)
8.1 (2.9)
6.2 (3.0)
4.0 (2.1)
NS
< 0.001
p within group
NS < 0.001
Disacharides, E% Baseline
6 months
8.7 (1.9)
9.1 (2.8)
8.3 (2.6)
5.4 (2.8)
NS
< 0.001
p within group
NS < 0.001
Saccharose, E% Baseline
6 months
5.5 (1.5)
5.2 (1.9)
4.9 (2.5)
2.5 (1.6)
NS
< 0.001
p within group
NS < 0.001
LFD; low fat diet, LCD; low-carbohydrate diet, E%; energy %. Data are given as mean (SD).

22
Table 3. Values of body mass index (BMI), HbA1c and lipids at baseline and 6 months in the
two intervention groups.
LFD
n = 30 LCD
n = 29 p
between
groups
BMI kg/m
2
Baseline
6 months
34 (5.7)
32 (5.5)
32 (5.1)
30 (5.1)
NS
NS
p within group
< 0.001 < 0.001
HbA1c mmol/mol
Baseline
6 months
56 (8.0)
55 (9.7)
57 (8.6)
53 (9.8)
NS
NS
p within group
NS < 0.01
Total
cholesterol mmol/l
Baseline
6 months
4.3 (1.0)
4.2 (1.1)
4.5 (1.0)
4.4 (1.1)
NS
NS
p within group
NS NS
LDL
cholesterol
mmol/l
Baseline
6 months
2.4 (0.7)
2.3 (0.8)
2.7 (0.9)
2.5 (0.8)
NS
NS
p within group
NS NS
HDL
cholesterol mmol/l
Baseline
6 months
1.1 (0.3)
1.1 (0.3)
1.1 (0.3)
1.2 (0.5)
NS
NS
p within group
NS < 0.05
Triglycerides mmol/l
Baseline
6 months
1.8 (0.8)
1.8 (1.3)
1.7 (1.4)
1.5 (1.2)
NS
NS
p within group
NS NS
LFD; low fat diet, LCD; low-carbohydrate diet. Data are given as mean (SD).
23
Table 4. Levels of inflammatory markers at baseline and 6 months in the two intervention
groups.
LFD
n = 30 LCD
n = 29
p
between
groups
CRP,
mg/l
Baseline
6 months
1.41 (0.45-4.01)
1.67 (0.80-3.24)
1.12 (0.37-3.32)
0.87 (0.29-2.74)
NS
NS
p within group
NS NS
IL-1Ra,
pg/ml
Baseline
6 months
1333 (784-2153)
1216 (974-1822)
1298 (818-1873)
978 (664-1385)
NS
< 0.05
p within group
NS < 0.01
IL-6,
pg/ml
Baseline
6 months
2.16 (1.77-3.59)
3.39 (2.25-4.79)
2.45 (1.39-4.10)
2.15 (1.65-4.270)
NS
< 0.05
p within
group < 0.05 NS
TNFR1,
ng/ml
Baseline
6 months
1371 (1227-1760)
1423 (1200-1687)
1340 (1149-1637)
1320 (1145-1610)
NS
NS
p within group
NS NS
TNFR2,
ng/ml
Baseline
6 months
2627 (2162-3150)
2680 (2322-2968)
2530 (2094-2973)
2480 (2266-2927)
NS
NS
p within group
0.064 NS
LFD; low fat diet, LCD; low-carbohydrate diet. Data are given as median (inter-quartile
range). P values > 0.10 are listed as non-significant (NS).

24
Figure 1. Flow diagram of the study
Assessed for eligibility (n=72)
Excluded (n=11) Not meeting inclusion criteria (n=0) Declined to participate (n=11) Other reasons (n=0)
Analysed (n=31)
Excluded from analysis of main outcome
(n=0)
Lost to follow-up (n=0) Discontinued intervention (did not attend group meetings, n=3)
Allocated to intervention Low-fat diet (n=31)
Received allocated intervention (n=31)
Did not receive allocated intervention (n=0)
Lost to follow-up (n=0) Discontinued intervention (did not attend group meetings, n=4)
Allocated to intervention Low-carbohydrate diet (n=30)
Received allocated intervention (n=30)
Did not receive allocated intervention (n=0)
Analysed (n=30)
Excluded from analysis of main outcome
(n=0)
Allocation
Analysis
Follow-Up
Randomized (n=61)
Enrollment