Embed Size (px)
Citation preview

Advances in Data Processing for Open-Path FourierTransform Infrared Spectrometry of GreenhouseGases†
Limin Shao
Department of Chemistry, University of Science and Technology of China, Hefei, Anhui, 230026, PROC
Peter R. Griffiths*
Department of Chemistry, University of Idaho, Moscow, Idaho 83844-2343
April B. Leytem
United States Department of Agriculture, Agricultural Research Service, Northwest Irrigation and Soils ResearchLaboratory, Kimberly, Idaho 83341
The automated quantification of three greenhouse gases,ammonia, methane, and nitrous oxide, in the vicinity ofa large dairy farm by open-path Fourier transform infrared(OP/FT-IR) spectrometry at intervals of 5 min is demon-strated. Spectral pretreatment, including the automateddetection and correction of the effect of interrupting theinfrared beam, is by a moving object, and the automatedcorrection for the nonlinear detector response is appliedto the measured interferograms. Two ways of obtainingquantitative data from OP/FT-IR data are described. Thefirst, which is installed in a recently acquired commercialOP/FT-IR spectrometer, is based on classical least-squares (CLS) regression, and the second is based onpartial least-squares (PLS) regression. It is shown thatCLS regression only gives accurate results if the absorp-tion features of the analytes are located in very shortspectral intervals where lines due to atmospheric watervapor are absent or very weak; of the three analytesexamined, only ammonia fell into this category. On theother hand, PLS regression works allowed what appearedto be accurate results to be obtained for all three analytes.
It is well-known that greenhouses function because the glassfrom which they are constructed transmits short-wavelength solarradiation which is then absorbed by the earth inside the green-house and heats it above the outside temperature. Since the vastmajority of the radiation emitted by a 300 K blackbody is atwavelengths longer than 4 µm (i.e., wavenumbers <2500 cm-1)and glass is opaque to all wavelengths longer than 4 µm, thethermal radiation emitted by the earth is absorbed by the glass,heating it up so that the air inside is heated by conduction andconvection. Molecules present in the atmosphere with infraredabsorption bands at wavelengths longer than 4 µm act in an
analogous manner to the glass of a greenhouse, hence thename greenhouse gases.
The greenhouse gases that are present at the highest concen-tration are water and carbon dioxide. These molecules give riseto the strongest greenhouse effect as they are opaque over wideintervals of the mid-infrared spectrum, as shown in Figure 1.Indeed, were it not for the presence of water and CO2 the earthwould be much cooler. Not as commonly recognized is thepositive feedback in the greenhouse effect. As the temperatureof atmospheric water and CO2 increases, the population of thehigher rotational states is increased, so that the spectralintervals over which the rotational transitions in theirvibration-rotation spectrum absorb strongly are extended awayfrom the center of the absorption bands, thereby increasingthe opacity over a wider spectral interval and further contribut-ing to the warming of the Earth. Molecules that absorb in the“atmospheric windows” between the bands of H2O and CO2
also contribute to the greenhouse effect, and this paper willcover the measurement of the concentration of three of thesegases (NH3, CH4, and N2O). To be significant contributors to
† Part of the special issue “Atmospheric Analysis as Related to ClimateChange”.
* To whom correspondence should be addressed. E-mail: [email protected].
Figure 1. Single-beam FT-IR spectrum measured through a totalpath length of 200 m.
Anal. Chem. 2010, 82, 8027–8033
10.1021/ac101711r 2010 American Chemical Society 8027Analytical Chemistry, Vol. 82, No. 19, October 1, 2010Published on Web 09/30/2010

the greenhouse effect, these molecules should be present at aconcentration of several parts-per-billion by volume (ppbv) orelse their absorption, and hence the amount by which theyheat the atmosphere, will be insignificant.
Open-path Fourier transform infrared (OP/FT-IR) spectrom-etry is sensitive to most volatile compounds that have absorptionbands in atmospheric windows; the typical limit of detection ofOP/FT-IR spectrometry for most greenhouse gases is between 1and 10 ppbv.1-4 The greater the absorptivity of a band absorbingin an atmospheric window, the more it contributes to thegreenhouse effect (for a given concentration) and the lower isthe detection limit of OP/FT-IR measurements. OP/FT-IR spec-trometry is “blind” in spectral intervals where atmospheric watervapor and CO2 absorb strongly; however, molecules that absorbonly in these regions do not contribute significantly to thegreenhouse effect, and so, measurement of their concentrationsis largely unnecessary. As a result, OP/FT-IR spectrometry isan almost ideal technique for measuring the concentration ofgreenhouse gases as it is reasonably sensitive, noninvasive,fast, capable of determining multiple compounds simulta-neously, and only measures those compounds that contributeto global warming. Furthermore, the instrumentation is ruggedand relatively easy to handle in the field.5-9
OP/FT-IR spectrometry has also been used for monitoringhazardous air pollutants10 and airborne toxic industrial chemicals11
from various sources such as industrial plants, agriculturaloperations, burning of biomass, engines of motor vehicles oraircraft, and volcanoes.12 Wide applications of OP/FT-IR spec-trometry are found in occupational and environmental air monitor-ing and military and homeland security. In the past decade, theapplication of OP/FT-IR spectrometry for atmospheric monitoringhas seen a significant increase in Asian countries such as Chinaand South Korea. However, on a worldwide scale, and especiallyin the USA, this technique is still undergoing a slow acceptance,largely because of the difficulty of processing the data whencommercial instruments are used.
The atmosphere is a complex, multicomponent system, thestudy of which is complicated by uncontrolled or unpredicted
factors such as wind, rain, snow, and dust. Furthermore, for OP/FT-IR spectrometers mounted at close to ground level, the beamcan be interrupted by vehicular and pedestrian traffic or even bybirds. As a result, although a typical OP/FT-IR spectrum containsthe information on the path-integrated concentration of green-house gases, the determination of these molecules is hamperedby various types of interference in addition to the omnipresentabsorption of the beam by water vapor and CO2. To add to theanalytical challenge, continuous atmospheric monitoring byOP/FT-IR spectrometry yields a huge amount of data fromwhich the concentrations of the various analytes must beextracted. Unfortunately, most of the software of commercialOP/FT-IR spectrometers requires considerable expertise andtime on the part of the operator. Furthermore, the chemometrictechnique that is usually employed, namely classical least-squares (CLS) regression, is far more accurate when allmolecules in the spectral interval being investigated (includingthe lines in the spectrum of water vapor) obey Beer’s Law,which is seldom the case with atmospheric spectra whereinterfering water lines are often very intense and are measuredwith an instrument line shape function that is broader thanthe spectral lines. As a result, nonlinear Beer’s law behavior isoften observed, and algorithms to correct for nonlinearity havebeen described.13 Nonetheless, these algorithms have not beenincorporated in all commercially available OP/FT-IR spectrom-eters, and it is usually necessary to only use very short intervalsof the spectrum between the stronger water lines to performthe analysis of compounds for which the spectrum is locatedin intervals of strong absorption by water vapor.3
A more general and user-friendly software program for OP/FT-IR spectroscopy that is not based on CLS regression and thathandles nonlinear behavior of band intensities would increase thequality and automation of the data processing and enableresearchers without spectroscopic expertise to use the OP/FT-IR technology for atmospheric monitoring more readily.14,15 Inthis paper, we will show the results obtained with such a system.The data processing techniques that we use were either adoptedor specifically developed in our laboratories both to improve theaccuracy of the result and to decrease the spectroscopic expertiseon the part of the operator that is required to obtain a reliableresult.
Distortion of the Interferograms by the Extraneous Fac-tors. The frequencies at which the infrared wavelengths aremodulated by the interferometer in a typical OP/FT-IR spectrom-eter (the so-called Fourier frequencies) are usually greater than500 Hz. Most of the variations in the signal at frequencies below500 Hz are caused by either adverse weather conditions or theblockage of the IR beam by a moving object. Such interferencecan be removed by the application of a high-pass filter to theinterferogram. Three years ago, we reported a simple procedureto reject invalid interferograms that had been subjected to high-pass filtering from further analysis in order to eliminate erroneous
(1) Russwurm; G. M.; Childers, J. W. Open-path Fourier transform infraredspectroscopy. In Handbook of Vibrational Spectroscopy; Chalmers, J. M.,Griffiths, P. R., Eds.; Wiley: New York, 2002, Vol. 2.
(2) American Society for Testing and Materials. Standard Guide for Open-PathFourier Transform Infrared (OP/FTIR) Monitoring of Gases and Vaporsin Air, E-1865-97. In Annual Book of ASTM Standards; American Societyfor Testing and Materials: West Conshohocken, PA, 1997; Vol. 03.06.
(3) Russwurm, G. M.; Childers, J. W. FTIR Open-path Monitoring GuidanceDocument, 3rd ed.; TR-4423-99-03, ManTech Environmental Technology:Research Triangle Park, NC, 1999.
(4) European Standard EN 15483. Ambient air quality-Atmospheric measure-ments near ground with FTIR spectroscopy; European Committee forStandardization: Brussels, Belgium, 2008.
(5) Childers, J. W.; Thompson, E. L.; Harris, D. B.; Kirchgessner, D. A.; Clayton,M.; Natschke, D. F.; Phillips, W. J. Atmos. Environ. 2001, 35, 1923–1936.
(6) Eklund, B. Atmos. Environ. 1999, 33, 1065–1071.(7) Griffith, D. W. T.; Leuning, R.; Denmead, O. T.; Jamie, I. M. Atmos. Environ.
2002, 36, 1833–1842.(8) Briz, S.; Barrancos, J.; Nolasco, D.; Melian, G.; Padron, E.; Perez, N. Proc.
SPIE Int. Soc. Opt. Eng. 2009, 747510.(9) Schafer, K.; Jahn, C.; Wiwiorra, M.; Schleichardt, A.; Emeis, S.; Raabe, A.;
Bottcher, J.; Landmeyer, N.-D.; Bonecke, C.; Deurer, M.; von der Heide,C.; Weymann, D. Proc. SPIE Int. Soc. Opt. Eng. 2009, 747511.
(10) Newman, A. R. Anal. Chem. 1997, 69, 43A–47A.(11) Walter, W. T. Proc. SPIE Int. Soc. Opt. Eng. 2004, 5270, 144–150.(12) Bacsik, Z.; Mink, J.; Keresztury, G. Appl. Spectrosc. Rev. 2005, 40, 327–
390.
(13) Childers, J. W.; Phillips, W. J.; Thompson, E. L.; Harris, D. B.; Kirchgessner,A. A.; Natschke, D. F.; Clayton, M. Appl. Spectrosc. 2002, 56, 325–336.
(14) Griffiths, P. R.; Hart, B. K.; Yang, H.; Berry, R. J. Talanta 2000, 53, 223–231.
(15) Griffiths, P. R.; Shao, L.; Leytem, A. B. Anal. Bioanal. Chem. 2009, 393,45–50.
8028 Analytical Chemistry, Vol. 82, No. 19, October 1, 2010
results.16 This procedure operates automatically and effectivelybut at the cost of losing the information at the times those rejectedmeasurements were measured. It is noteworthy that the effect offog or smoke is completely removed by this approach17 andregions where the frequency of the interference is less than thelowest Fourier frequency are corrected.18
Reducing the Effect of the Nonlinear Response of MCTDetectors. Another source of error is caused by the nonlinearresponse of the mercury cadmium telluride (MCT) detector. It iswell-known that the response of MCT detectors used for FT-IRspectrometry can be nonlinear; i.e., the response is not linearlyproportional to the incident flux. This nonlinearity produces abaseline offset in the calculated single-beam spectrum and, hence,introduces a severe error in the absorbance of strong spectralfeatures including many of the lines in OP/FT-IR spectra ofatmospheric water vapor.19-21 Therefore, the effect of the non-linear response must be corrected in order to improve thequantitative accuracy of OP/FT-IR spectrometry. Several correc-tion methods based on hardware and software implementationare reviewed in ref 22. Most of them require iterative calculations,and none of them works well if the energy that is incident on thedetector changes significantly, as it often does with OP/FT-IRspectrometry.
We have developed a rapid numerical method in which thecorrection is implemented by modifying the signal intensities ofjust three points on the affected interferogram, namely, thecenterburst (i.e., the largest data point) and the adjacent pointson either side.22 Since these points have larger values than all ofthe other points in the interferogram, they are the most adverselyaffected by a nonlinear detector response. Results demonstratedthe effectiveness of this correction method. This approach alsofeatures fast and automatic computation since an iterative processthat is common to most nonlinearity-correction algorithms is notemployed. Unlike other algorithms, the one that we use can beapplied in real time.
There is another benefit of the nonlinearity correction for OP/FT-IR monitoring. In unattended measurements, we found thatsome factors, especially the effect of wind, sometimes significantlyincreased the optical alignment of the instrument and resulted insignals so intense as to overflow the analog-to-digital converter.In our prior experiments, such interferograms were rejecteddespite the very high centerburst signal.15 As a result, during theinitial optical setup, we had to leave room for an incidentalalignment improvement. Nonetheless, ever since the integrationof the nonlinearity correction into our data processing softwarepackage, the effect of a varying optical alignment under windyconditions is a less serious issue than before.
Calculation of the Sample Spectrum. After the aboveprocedures have been carried out, the remaining interferograms
are ready for the calculation of the single-beam spectra. Theoperator first defines the resolution, apodization function, zero-filling factor, and number of scans to be averaged. The single-beam spectrum (SBS) of the sample is, thus, obtained and mustbe ratioed against a suitable background SBS to yield thetransmittance spectrum of the atmosphere, T(ν).
In most previous work, the operators attempt to measure thesample and background SBS over the same optical path lengthwith the background spectrum having the same temperature andhumidity for both measurements but with all analytes absent.Were this condition to be met for field measurements, when theratio of the sample and background spectra is calculated, thebaseline would be at exactly 100% T, the spectral features due toatmospheric water and CO2 would be completely removed, andthe spectra of other molecules that absorb in the atmosphericwindows could be observed with no interference other thanthe effect of noise. In practice, however, the measurement ofsample and background spectra with everything identicalexcept the presence of the analyte is never possible, so that,for example, the protocols specified by the American Societyfor Testing and Materials,2 the United States EnvironmentalProtection Agency (USEPA),3 and the European Committeefor Standardization4 rarely, if ever, yield quantitatively accurateresults.
Hart and Griffiths showed that, provided that the data areprocessed by partial least-squares regression (PLS, vide infra),the use of a background SBS measured over a very short pathlength (i.e., with the retroreflector only about 1 m from thetelescope) yields spectra that are far more easily acquired andresults that are more accurate than if a background SBS of thesame path length as the sample SBS is used.23,24 Not only doesthis procedure make setting up measurements in the field fareasier, but also, for the measurement of important greenhousegases that have a global average concentration exceeding about10 ppb, such as methane, the short-path background SBS mustbe used; otherwise, the absorption due to methane in the long-path background SBS would partially cancel out the correspondingbands in the sample SBS and result in a lower calculatedconcentration than the true value.
Quantitative Analysis. The most straightforward algorithmfor quantitative analysis of OP/FT-IR spectra is classical least-squares regression (CLS), which relies on Beer’s law beingobeyed by all molecules absorbing in the spectral range underinvestigation. To the best of our knowledge, this algorithm isincorporated in all commercial OP/FT-IR spectrometers. However,Beer’s law is a limiting law, and the linearity of the measuredabsorbance with respect to the concentration of a particularmolecule is affected by several factors of which the most importantfor OP/FT-IR measurements is the effect of resolution on stronglyabsorbing lines such as those in the vibration-rotation spectraof atmospheric water vapor and CO2.25-28 Generally speaking,the peak absorbance of bands or lines due to trace molecules in
(16) Shao, L.; Pollard, M. J.; Griffiths, P. R.; Westermann, D. T.; Bjorneberg,D. J. Vib. Spectrosc. 2007, 43, 78–85.
(17) Shao, L.; Roske, C. W.; Griffiths, P. R. Anal. Bioanal. Chem. 2010, 397,1521–1528.
(18) Shao, L.; Roske, C. W.; Griffiths, P. R. Anal. Bioanal. Chem. 2010, 397,1511–1519.
(19) Heise, H. M.; Janissek, P. R.; Fischer, P. Mikrochim. Acta [Suppl.] 1997,14, 301–303.
(20) Chase, D. B. Appl. Spectrosc. 1984, 38, 491–494.(21) Griffiths, P. R.; de Haseth, J. A. Fourier transform infrared spectrometry,
2nd ed.; Wiley Interscience: Hoboken, NJ, 2007, pp 187-191.(22) Shao, L.; Griffiths, P. R. Anal. Chem. 2008, 80, 5219–5224.
(23) Hart, B. K.; Griffiths, P. R. Proc. 11th Int. Conf. Fourier Transform Spectrosc.Am. Inst. Phys. Conf. Proc. 1998, 430, 241–242.
(24) Hart, B. K.; Griffiths, P. R. Environ. Sci. Technol. 2000, 34, 1337-1345;1346-1351.
(25) Ramsay, D. A. J. Am. Chem. Soc. 1952, 74, 72–80.(26) Anderson, R. J.; Griffiths, P. R. Anal. Chem. 1975, 47, 2339–2347.(27) Zhu, C.; Griffiths, P. R. Appl. Spectrosc. 1998, 52, 1403-1408; 1409-
1413.
8029Analytical Chemistry, Vol. 82, No. 19, October 1, 2010
the atmosphere is sufficiently weak in OP/FT-IR spectra, so thatthe measured absorbance is proportional to concentration evenwhen the spectrum is measured at low resolution. Thus, providedthat the spectral interval being used for the analysis is free ofinterference by water and CO2, CLS gives accurate results. Ifthis is not the case, the quantitative accuracy can be drasticallyimpaired, as we will show later in this paper.
In practice, the complete elimination of lines in the spectrumof H2O and CO2 is far more easily said than done. Severaltechniques designed to accomplish this goal are outlined inthe USEPA guidance document for OP/FT-IR spectroscopy;3
however, all of them are essentially impossible to implementin practice. Indeed, to the best of our knowledge, there hasnever been a report of an OP/FT-IR spectral measurementwhere all the lines in the vibration-rotation spectrum of watervapor have been compensated. Hong and Cho29 reported atechnique to compensate for the water absorption in themeasured spectrum with the reference of water that wascalculated from the HITRAN database30 in the way reportedby Muller et al.31 assuming a Lorentzian line shape. Hong andCho modified the software for conventional CLS regression sothat the concentrations of all analytes were constrained to liewithin reasonable values. Although this approach yielded betterresults than the protocols recommended by the USEPA, itsimplementation is still quite time-consuming and it is notsuitable for processing large numbers of OP/FT-IR spectra thatwould be measured during a continuous monitoring session.To the best of our knowledge, software of the type recom-mended by Hong and Cho has not been incorporated in thesoftware of any commercial OP/FT-IR spectrometer.
Perhaps the most successful application of FT-IR spectroscopyto atmospheric measurements was reported by Esler et al.,32
although it should be stressed that this work involved pointmonitoring rather than an open-path measurement. In theirapproach, air was pumped into a thermostatted multipass gas cellwith a total path-length of either ca. 10 or 22 m. The cell was heldat a temperature of 30 °C which allowed the measured spectra of12CO2, 13CO2, CH4, N2O, and CO to be modeled accurately byconvolving the HITRAN data for these molecules at the knowntemperature and pressure with the instrument line shape ofthe spectrometer calculated for the maximum optical pathdifference (OPD), apodization function, and etendue of thespectrometer using the MALT (multiple atmospheric layertransmission) program that was originally written by Griffith.33
The concentration of each analyte was then calculated by CLSregression. Because the spectra had been accurately modeledbeforehand, very accurate results were able to be obtained eventhough the spectra were measured at a resolution (∆ν ) 1
cm-1) that was much broader than full-width at half-height(fwhh) of the lines in the spectrum (∼0.2 cm-1).
Before the era of chemometrics, a solution to the problem ofBeer’s law nonlinearity introduced by the effect of resolution onthe absorbance of strong narrow bands in the spectrum wouldhave been to acquire several reference spectra of the samemolecule of various concentrations and set up a nonlinear workingcurve. Today, with a factor-based chemometric approach such asPLS regression, the effect of Beer’s law nonlinearity can becompensated by the addition of additional factors to the model.Hart and Griffiths showed that, for pristine atmospheres, variationsin the effect of path length, humidity, temperature, and spectralbaseline in OP/FT-IR spectra can be taken care of by the use often “background factors”. For each analyte molecule to bequantified, one additional factor is added to these ten backgroundfactors.
To implement this approach, single-beam background spectrawere measured through a pristine atmosphere over a 9 monthperiod using a wide range of path lengths. During this time, thetemperature varied from below -5 to 35 °C; however, since thesemeasurements were all taken in Idaho, the relative humidity rarelyexceeded 50% on warm days. Each of these spectra was ratioedagainst a background SBS measured with the retroreflectormounted very close to the telescope. All interferograms werecorrected for the response nonlinearity of the MCT detector. Thespectra were then converted to the absorbance format. To eachof these spectra, one or more reference spectra of the analytesbeing investigated were added. To ensure that there are noresolution errors, we took advantage of the fact that at highresolution (∆ν < fwhh) Beer’s law is obeyed over a wideconcentration range. After first measuring a reference absorbancespectrum of each analyte at high resolution (0.125 cm-1 in ourresearch), these spectra were then scaled by different factorsto represent the absorbance spectrum at different concentra-tions in the range of interest. These spectra were thenconverted to transmittance, and their Fourier transform wascalculated. The Fourier domain array was then truncated toan optical path difference equal to that at which the OP/FT-IRspectra were measured in the field and multiplied by theappropriate apodization function, so that reference spectra ofthe analytes at various concentrations were generated at theresolution at which the OP/FT-IR spectra were acquired (1 or4 cm-1 in our work).34 Finally, the spectra calculated in thisway are added to open-path background spectra measuredthrough pristine atmospheres in order to generate the calibra-tion set for PLS regression.18 For molecules that are known tobe present at a detectable concentration in pristine air, theglobal average concentration was added to the concentrationof the added analyte.
The fact that all the single-beam OP/FT-IR spectra that aremeasured over long paths in our investigations are ratioed againsta short path-length background SBS obviates the need to measurea background spectrum over exactly the same path length andwith the same temperature and relative humidity as the samplespectrumbutwithallanalytesabsent.Becausethevibration-rotationlines in the spectrum of water vapor are seen throughout the
(28) Griffiths, P. R.; de Haseth, J. A. Fourier transform infrared spectrometry,2nd ed.; Wiley Interscience, Hoboken, NJ, 2007, pp 177-181.
(29) Hong, D.; Cho, S. Appl. Spectrosc. 2003, 57, 299–308.(30) Rothman, L. S.; Rinsland, C. P.; Goldman, A.; Massie, S. T.; Edwards, D. P.;
Flaud, J.-M.; Perrin, A.; Camy-Peyret, C.; Dana, V.; Mandin, J.-Y.; Schroeder,J.; McCann, A.; Gamache, R. R.; Wattson, R. B.; Yoshino, K.; Chance, K. V.;Jucks, K. W.; Brown, L. R.; Nemtchinov, V.; Varanasi, P. J. Quant. Spectrosc.Radiat. Transfer 1998, 60, 665–710.
(31) Muller, U.; Heise, H. M.; Mosebach, H.; Gartner, A. G.; Hausler, T. FieldAnal. Chem. Technol. 1999, 3, 141–159.
(32) Esler, M. B.; Griffith, D. W. T.; Wilson, S. R.; Steele, L. P. Anal. Chem.2000, 206–215.
(33) Griffith, D. W. T. Appl. Spectrosc. 1996, 59–70.(34) Bjorneberg, D. L.; Leytem, A. B.; Westermann, D. T.; Griffiths, P. R.; Shao,
L.; Pollard, M. J. Vib. Spectrosc. 2009, 52, 1749–1756.
8030 Analytical Chemistry, Vol. 82, No. 19, October 1, 2010

spectrum, CLS regression cannot be easily applied to obtainquantitative data from such spectra without fitting the water linesin the way that has been described by Hong and Cho29 or Griffithet al.32,33 Consequently, CLS is usually carried out over very shortspectral ranges in which absorption by water lines is minimal. Tocircumvent such problems, we use partial least-squares regression(PLS) as the quantitative algorithm by first building calibrationdata sets as described in the previous paragraph using OP/FT-IR spectra that were measured through a pristine atmosphereunder as wide a range of path length, temperature, and humidityas possible. The calibration spectra contain all the absorptionfeatures due to water vapor and CO2 acquired over a wide rangeof relative humidity, temperature, and path length as well asthe spectra of the analytes under investigation. We have usedthe same set of background spectra for several years withoutobserving any degradation of the results, and concentrationscalculated from spectra measured with the two instrumentsshowed only small differences, even though they were manu-factured more than 20 years apart.
EXPERIMENTAL SECTIONTo assess the differences in measuring concentrations of
methane, ammonia, and nitrous oxide utilizing either the PLStechnique described above or a CLS method, two OP/FT-IRspectrometers were used. Each contained a Globar source, acube-corner interferometer of the type incorporated in the ABB-Bomem MB-100 FT-IR spectrometer, and a beamsplitter andoptics that diverted about 50% of the energy leaving theinterferometer to a 25 cm beam-expanding telescope. Theexpanded beam was passed over an approximately 100 m pathto a cube-corner array retroreflector that returned the beaminto the telescope and beamsplitter, from which about 50% ofthe energy was passed to an MCT detector. One instrument(AirSentry, Cerex Monitoring Solutions, Atlanta, GA) had beenrecently purchased and the other (donated to the Universityof Idaho after over 10 years of operation by du Pont) was over25 years old. Over the path lengths studied in this project, thesignal-to-noise ratio (SNR) of spectra measured by bothinstruments was very similar, although the SNR of spectra
measured on the older instrument over total path lengthsgreater than 400 m was poorer.
Spectra were collected over a 200 m total path length (100 mbetween the telescope and retroreflector) in an area that waslocated adjacent (to the east) of a large (∼13 000 cows) open-freestall dairy located in southern Idaho, as shown in Figure 2.The barns run east and west and are each almost 1 km in length.At the time that these measurements were taken (January, 2010),the winds were generally from an easterly direction. In this case,the two OP/FT-IR spectrometers were located upwind of the cattlebut several times the wind changed direction so that it blew froma more westerly direction. OP/FT-IR spectra were acquiredcontinuously at intervals of 5 min over a period of 44 h. Over themeasurement period, the average temperature was -1.3 °C, witha daytime high of 5.8 °C and a nighttime low of -4.4 °C. Theaverage relative humidity was 87%, with a high of about 94% (atnighttime, when the temperature was lowest) and a low of 58%.The average wind speed was 1.2 m s-1 and never exceeded 2.8 ms-1 while these measurements were being taken. Because bothinstruments were located to the east of the dairy, the analyteconcentrations were expected to be near their global meanwhen the wind was from the east but should show the influenceof the dairy emissions when the wind was predominantly fromthe southwest and west.
The data acquired by the older of the two instruments wereprocessed with the PLS-based software described above. Datafrom the other instrument were processed with the CLS-basedsoftware that was installed in the spectrometer by the vendor.
RESULTS AND DISCUSSIONThe results obtained by PLS are shown in Figure 3a, which
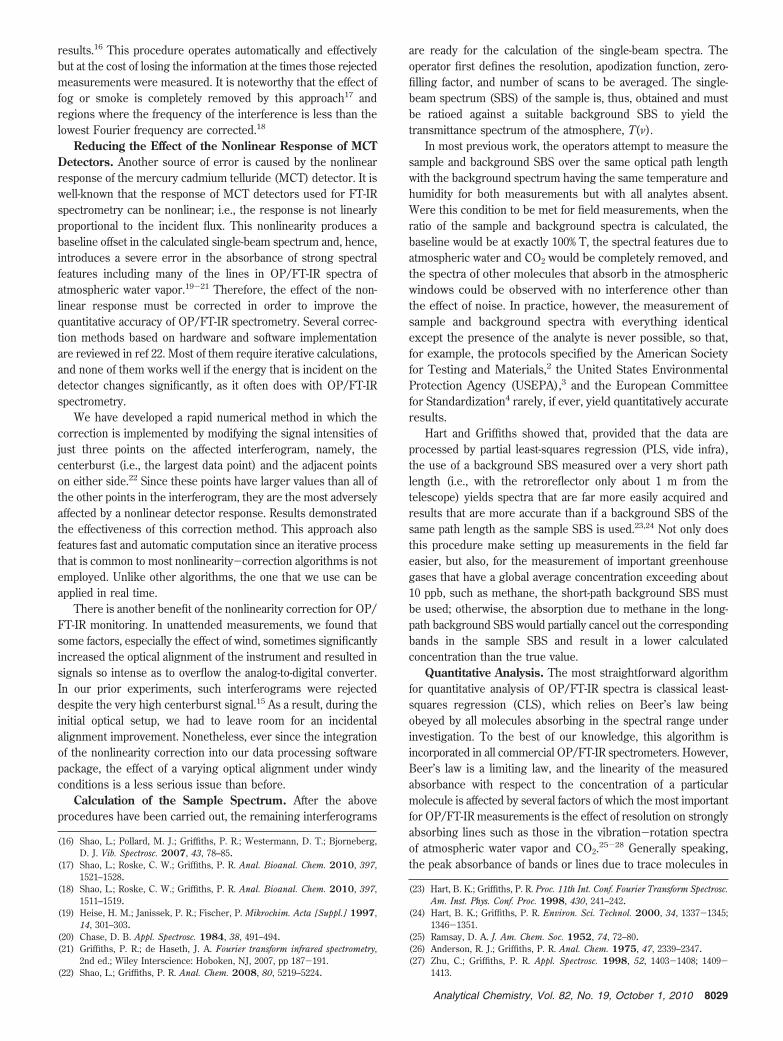
shows that ammonia was present at or below its detection limitover much of the duration of these measurements (when the windwas predominantly from the east) but increased to well above thelimit of detection during periods when the wind shifted to thesouthwest and west and blew the emissions from the dairy intothe infrared beam, as illustrated in Figure 4. The concentrationof methane calculated by PLS was at about the global average formuch of the measurement period but, as would be expected, rose
Figure 2. Aerial photograph of the dairy farm at which the OP/FT-IR spectra were measured.
8031Analytical Chemistry, Vol. 82, No. 19, October 1, 2010

during the same time periods as the ammonia concentration rose,when the winds blew from the west. The concentration of nitrousoxide remained approximately constant at the global average overthe 44 h measurement period. This behavior is typical of whatwould be found adjacent to a dairy production facility.34,35
Whereas the concentration of ammonia calculated by the CLS-based software supplied by the vendor with the instrument wassimilar to the values calculated by PLS at all times, the resultscalculated for methane and nitrous oxide were dramaticallydifferent, as shown in Figure 3b. Methane was frequentlycalculated to have a negative concentration although the calculatedconcentration was in approximate agreement with the concentra-tion calculated by PLS when methane was present at a concentra-tion that was appreciably greater than the global average. Thecalculated concentration of N2O varied so wildly that only a fewdata points fit on the scale of this figure and were never closeto their expected values.
The reason for these results is speculated to be as follows.The spectral intervals used in the two programs are shown inTable 1. Ammonia absorbs in a spectral interval where water onlyabsorbs very weakly (see Figure 5), and so, it is possible to findshort spectral intervals (such as the one chosen for the CLSanalysis) where the presence of atmospheric water vapor doesnot interfere at all. (Thus, estimating the concentration of ammoniaby CLS is essentially a univariate analysis, even though amultivariate algorithm is being applied.) Conversely, water lines
appear quite strongly in the spectral intervals that are used tocalculate methane and nitrous oxide by the CLS-based program(1300-1307 and 1235-1283 cm-1, respectively). The effect ofthese atmospheric interferences is clearly not handled ad-equately when the data are processed by CLS. The spectralintervals that are used in the PLS calculations are far widerand were selected in part because the strongest lines in thespectra of the analytes were found in these intervals. Eventhough there is significant overlap by rotational lines due toboth the water and CO2 spectra, their effect is taken care ofmuch better using the PLS approach and the result of thesecalculations appears to be very accurate.
CONCLUSIONIn order to facilitate the analysis of OP/FT-IR measurements,
good software is a necessity. As noted by Heise et al., althoughcommercially available software for OP/FT-IR is user-friendly, itgenerally lags behind the state of the art of chemometrics and,hence, is less effective than the programs developed in research
(35) Leytem, A. B.; Dungan, R. S.; Bjorneberg, D. L.; Koehn, A. C. J. Environ.Qual. 2010, in press (DOI: 10.2134\JEQ2009.0515).
Figure 3. Concentrations of methane (solid line), ammonia (dashed line), and nitrous oxide (dotted line) calculated with (a) PLS and (b) CLSregression.
Figure 4. (]) Concentration of ammonia calculated by PLS regres-sion. (b) Wind direction at each time the spectrum was measured;when the direction is 90°, the wind is coming from the east.
Table 1. Spectral Intervals in the CLS and PLSCalculations
CLS PLS (cm-1)
methane 1300-1307 2850-3200ammonia 955-969 750-1250nitrous oxide 1235-1283 2160-2260
Figure 5. (Above) Absorbance spectrum of water vapor measuredin pristine air over a path length of 408 m, showing the vendor-recommended spectral intervals for CLS analysis of each analyte.(Below) Reference spectra of (A) N2O, (B) CH4, and (C) NH3.
8032 Analytical Chemistry, Vol. 82, No. 19, October 1, 2010

laboratories,36 while the latter are often difficult to use byinexperienced users. In our opinion, the software should be user-friendly, but a totally “black-box” program is not as helpful asmuch of the intermediate data that helps experienced users tointerpret the results is inaccessible. We kept these concepts inmind while developing a software package with the numericaltechniques described above incorporated. The result is a softwarepackage (available on request) with a straightforward graphicaluser interface, which provides both the analytical results and allthe intermediate data including the processed interferograms,single-beam spectra, and absorbance spectra in a popular formatfor easy access.
ACKNOWLEDGMENTThis work was funded by the National Natural Science
Foundation in China (Grant No. 20705032) and partly by theChinese Universities Scientific Fund. The development of thesoftware at the University of Idaho was funded in part byCooperative Agreement 58-5368-3-269 with the USDA/NWISL,Agricultural Research Service, Northwest Irrigation and SoilsResearch Laboratory, Kimberly, Idaho, and in part by ContractW91ZLK08P0739 from the Edgewood Chemical Biological Center(ECBC), Edgewood Arsenal, U.S. Army.
Received for review June 29, 2010. Accepted September14, 2010.
AC101711R(36) Heise, H. M.; Muller, U.; Gartner, A. G.; Holscher, N. Field Anal. Chem.
Technol. 2001, 5, 13–28.
8033Analytical Chemistry, Vol. 82, No. 19, October 1, 2010