Embed Size (px)
Citation preview

Timothy Morge, CTA and President Blackthorne Capital, Inc.
www.marketgeometry.com www.medianline.com
Advanced Use of Wide Range Bars & Gaps When Trading CME Group Currency Futures
Internet Presentation Sponsored by Interactive Brokers February 9, 2012
All Material and Images are the Property of Timothy Morge and are protected under the United States and International Copyright Laws.
©Timothy Morge 1991-2012
FOREX and Futures Risk DisclaimerTrading in the off exchange retail foreign currency market or futures markets is one of the riskiest forms of investments available in the financial markets and suitable for sophisticated individuals and institutions. The possibility exists that you could sustain a substantial loss of funds and therefore you should not invest money that you cannot afford to lose. Nothing in this presentation is a recommendation to buy or sell currencies or futures and Timothy Morge is not liable for any loss or damage, including without limitation, any loss of profit, which may arise directly or indirectly from the use of Timothy Morge’s tools or reliance on such information. ResultsPast performance does not guarantee future results.This is one persons experience, your experience may differ.Results are not guaranteed, individual experiences may vary.Market VolatilityIn volatile market conditions, substantial losses may occur.In volatile market conditions, orders may not be filled as placed.LeverageThe leveraged nature of FX trading and Futures trading means that any market movement will have an equally proportional effect on your deposited funds. This may work against you as well as for you. The possibility exists that you could sustain a total loss of initial margin funds and be required to deposit additional funds to maintain your position. If you fail to meet any margin call within the time prescribed, your position will be liquidated and you will be responsible for any resulting losses.
This webcast is dedicated to my two early mentors: Dr. AlanAndrews, a great market researcher that applied NewtonianPhysics in the 1920’s to develop the Median Line, one of theonly true leading indicators available to traders; and AmosHostetter, a master of risk reward and money management andin my opinion, the best ‘Campaign Trader’ in the last 300 years.
Advanced Use of Wide Range Bars & Gaps When Trading CME Group Currency Futures
Let’s Look at the CME Euro Currency Futures, see if we can find Gaps and Wide Range Bars and observe how they determine Market Structure, Support and Resistance.
Let’s start out where we ended last month’s presentation.
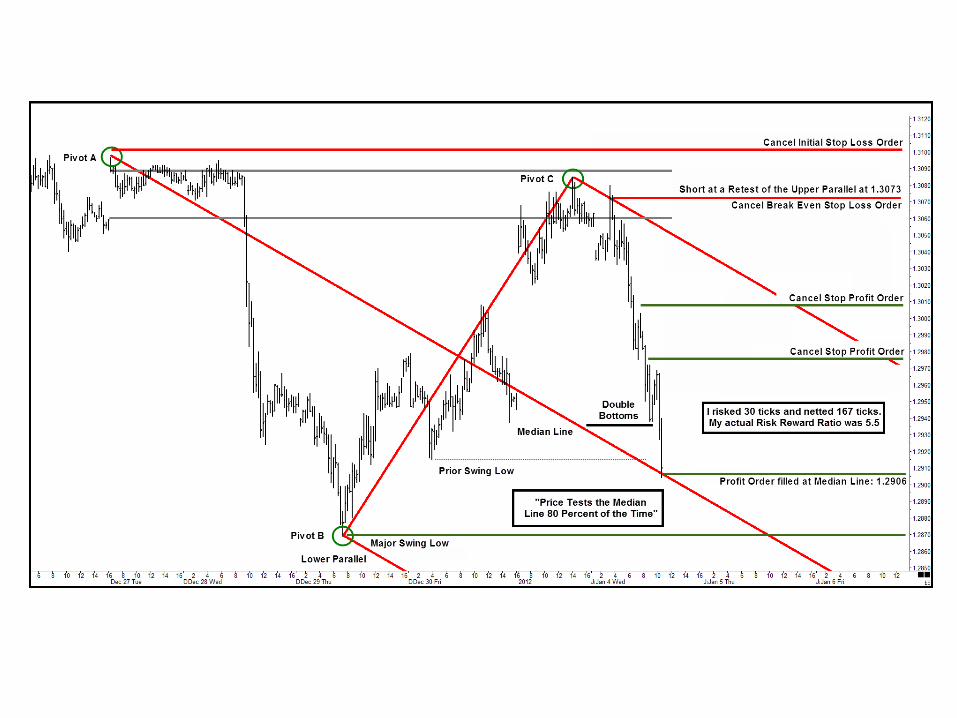
We finished the prior session with 167 ticks of profit in ouraccount. If we consistently use 30 ticks as our maximumacceptable Stop Loss, we have now ‘Rolled Forward’ 5.5Stops . This means we can effectively get stopped out of fivetrades in a row and still be trading with the market’s money!
Let’s take a look at the market as the day begins.

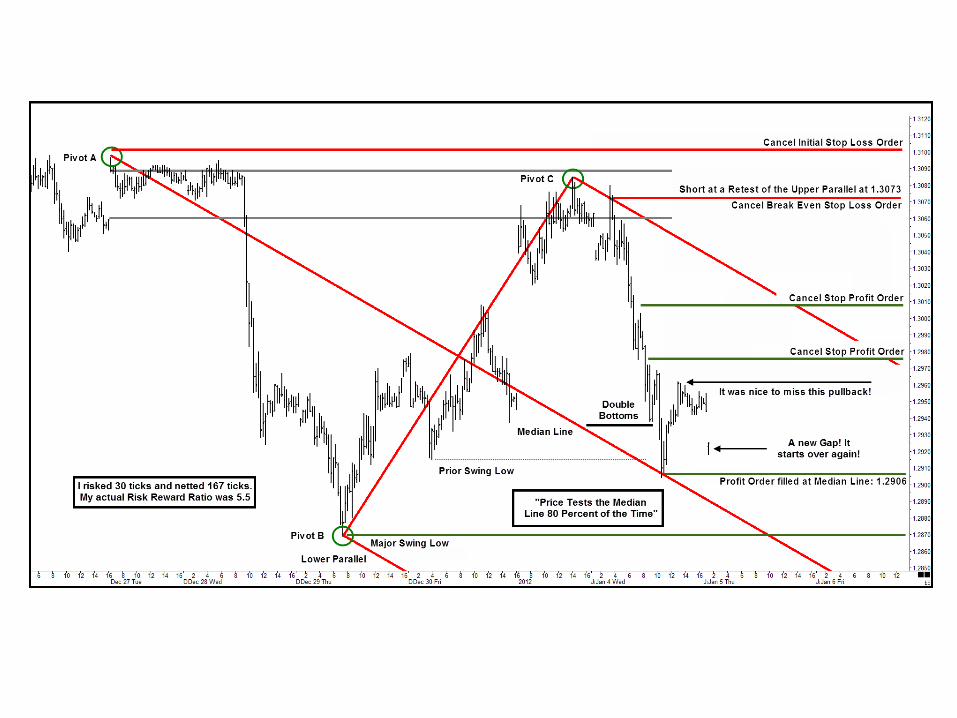
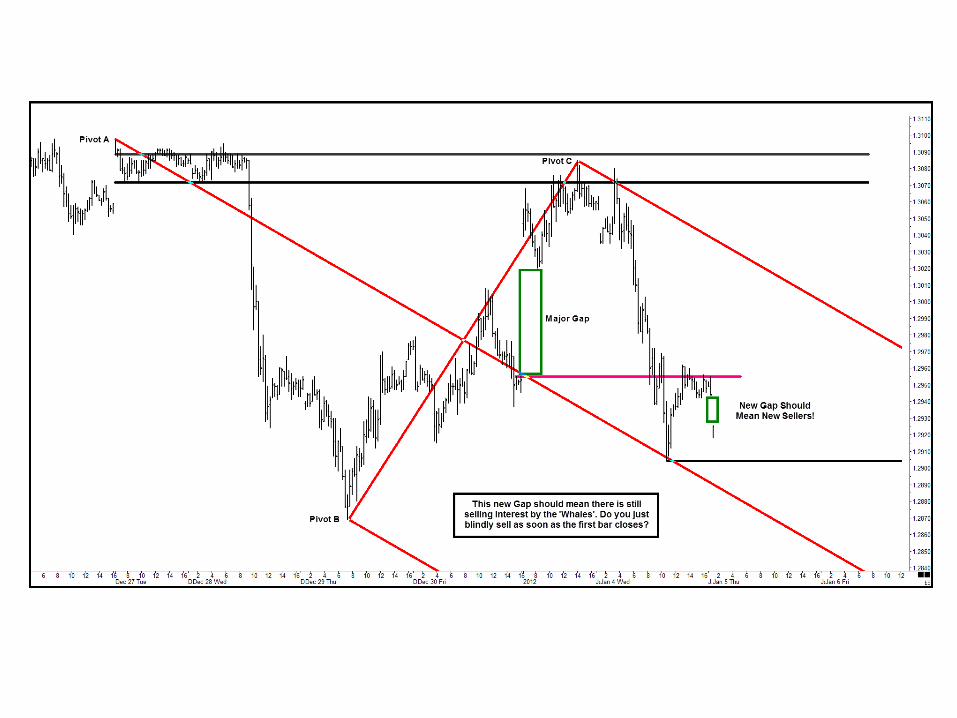
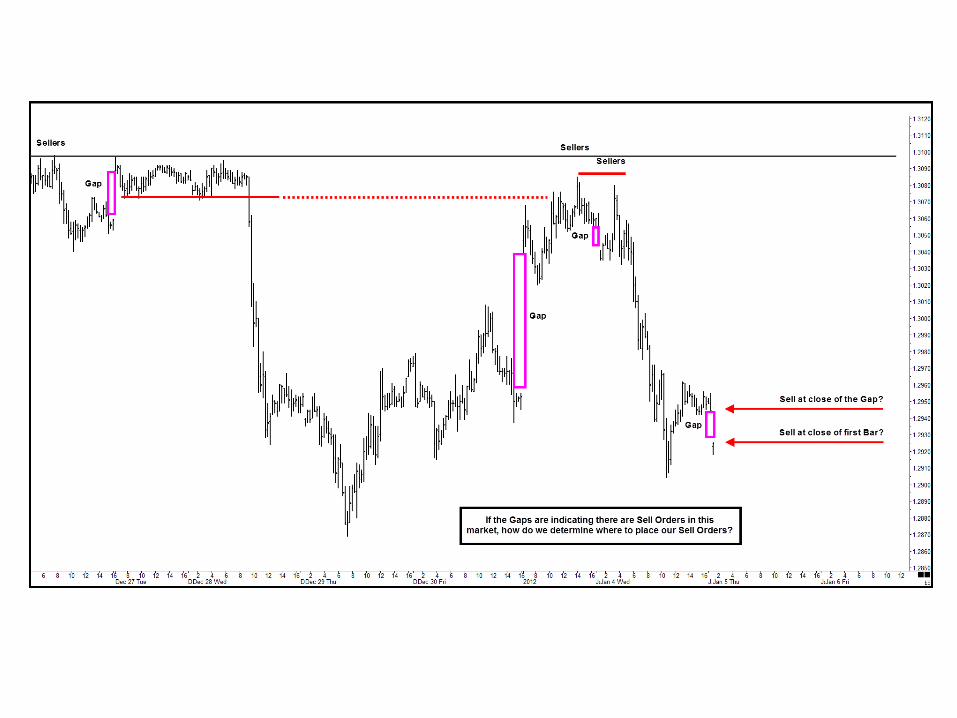
As the day starts out, price Gaps lower again, telling us there is ahigh probability that there are significant sell orders above themarket that the market makers are ‘leaning on’. These are ordersleft by the ‘Whales’, the largest position or portfolio traders inthese markets.
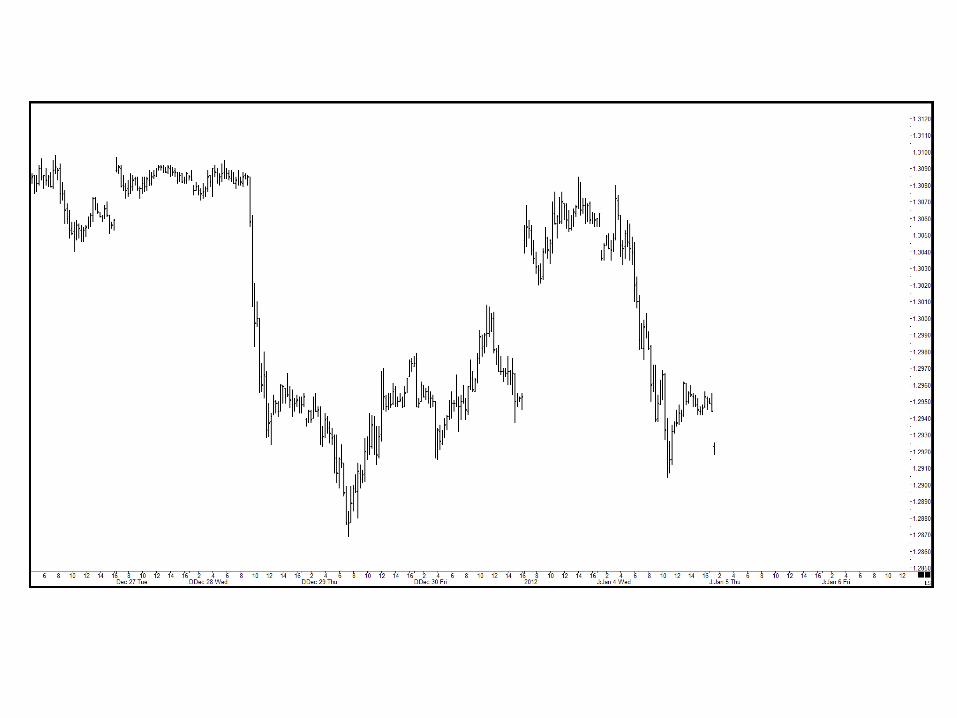
I am currently flat as I view this chart. The Gap lower on the opening makes me interested in finding a nice area to get short. How do I find a nice short entry in a market that has fallen so far, so fast and now has Gapped Lower on the opening?
After a vertical fall, Price often has to ‘eat up’ Time or Space before moving on with the trend. These days, I like to use the term Space, because many traders use bars that are not based on time: Tick based bars, Range bars, Point and Figure formations, Market Profile formations, etc.
Let me see if I can show you what I mean by eating up Space…

Maybe that’s hard for you to ‘see’. Let’s take the Price Bars off the chart and maybe it will be easier to see the Market ‘Breathe’. This is the Language of Price…

Once we understand the need to eat up some Time or Space, are there ways to look for a probable place where Price has eaten up
enough Time? Where is it likely Time will meet Price?
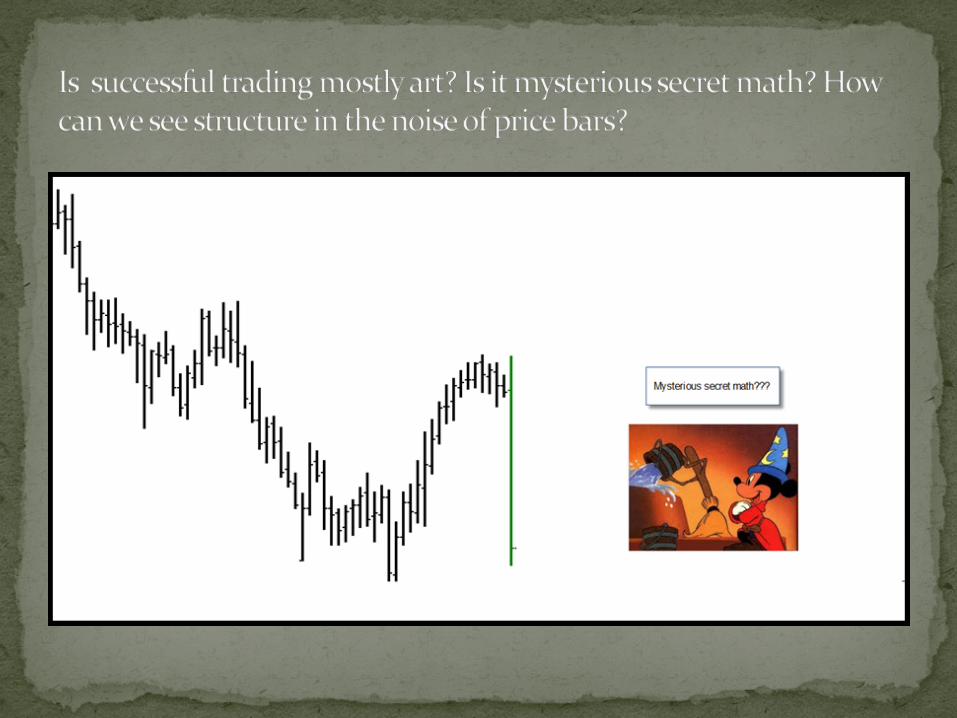
I should ask Mickey the Alchemist where to sell, right? Let’s look at a more simple view and see if that helps us find an area to stalk
a potential short position with a good money management.
That didn’t make it much clearer for me. Maybe there are some other tools to help us look for a good area to get short this market.
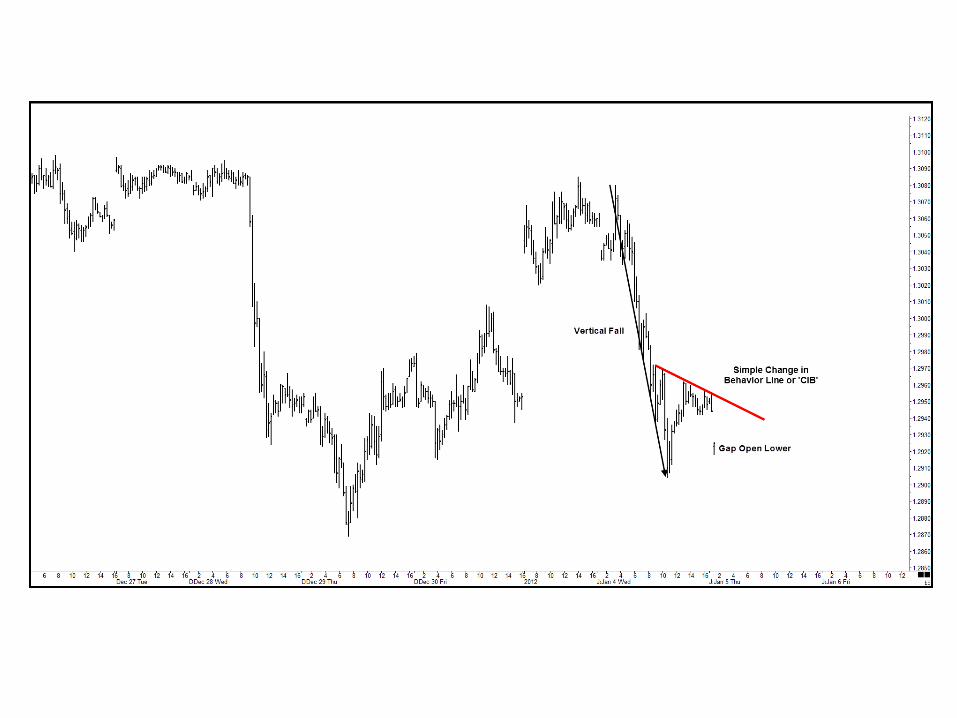
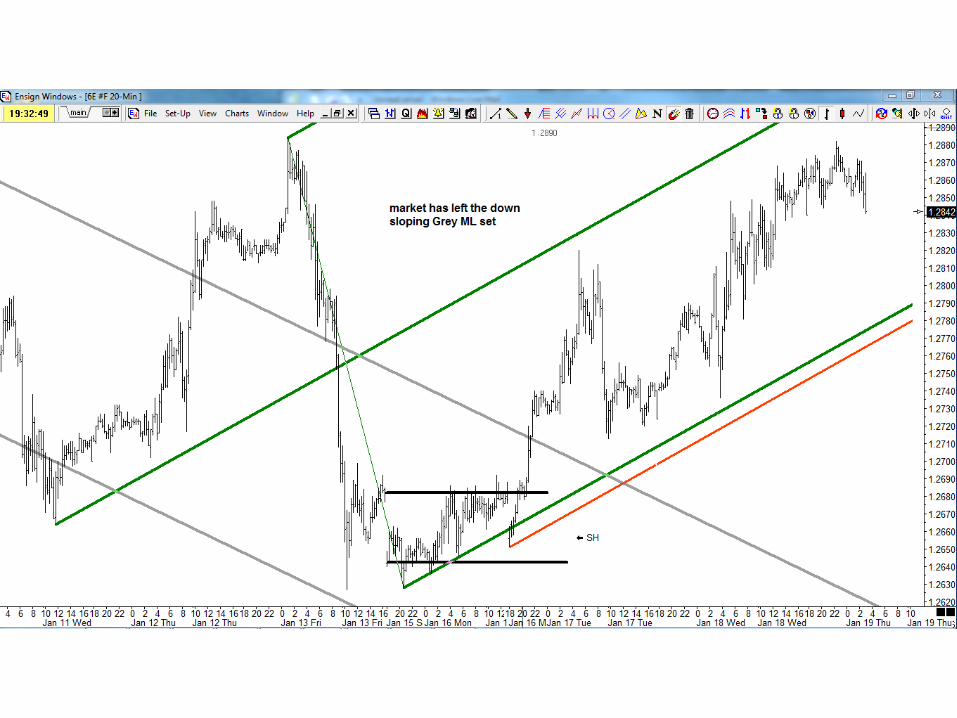
This is one of the simple ways to look for timing: Draw a simple Trend Line over the Lower Highs. This simple Change in Behavior line does a very good job telling us where Price is likely to meet Time and then turn back in step with the trend. If Price breaks through it and holds above the CIB Line, the old trend is likely
over and a new phase in the market has begun.
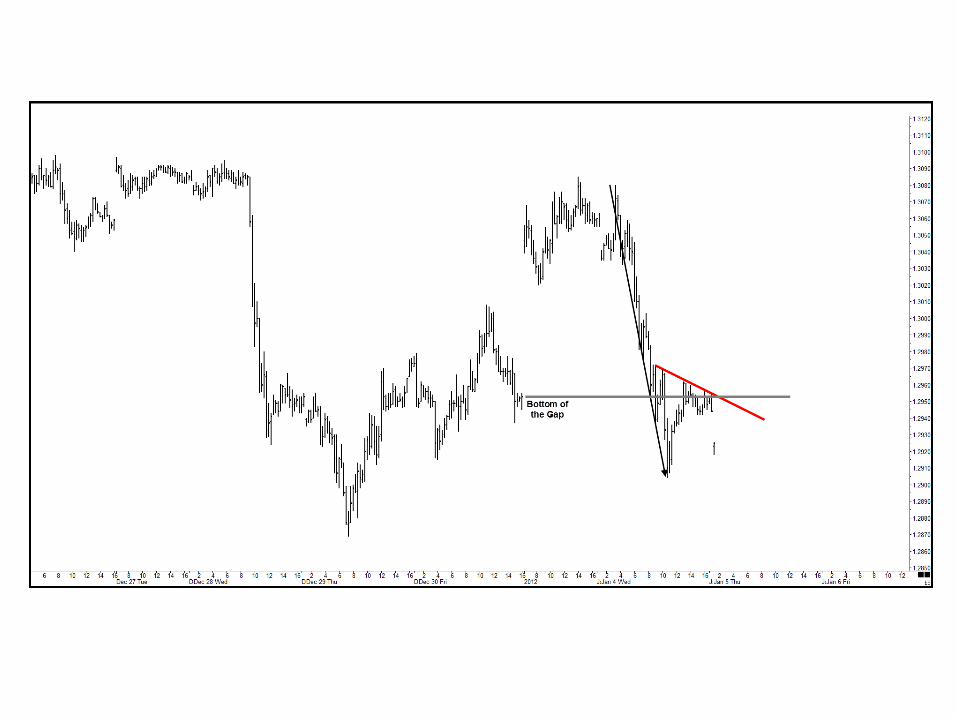
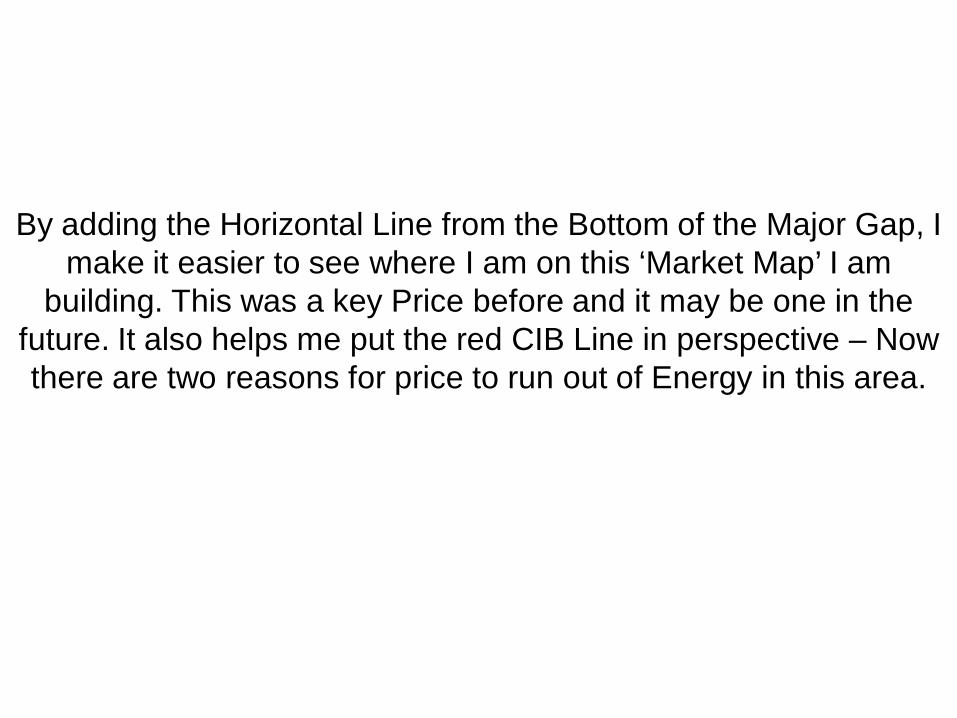
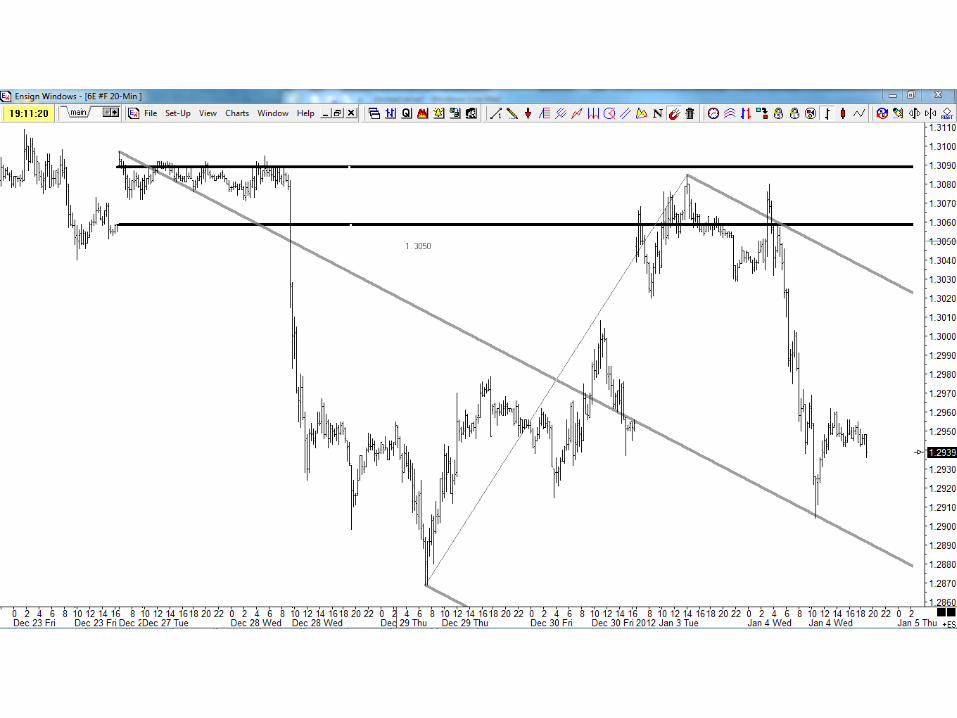
By adding the Horizontal Line from the Bottom of the Major Gap, I make it easier to see where I am on this ‘Market Map’ I am
building. This was a key Price before and it may be one in the future. It also helps me put the red CIB Line in perspective – Now there are two reasons for price to run out of Energy in this area.
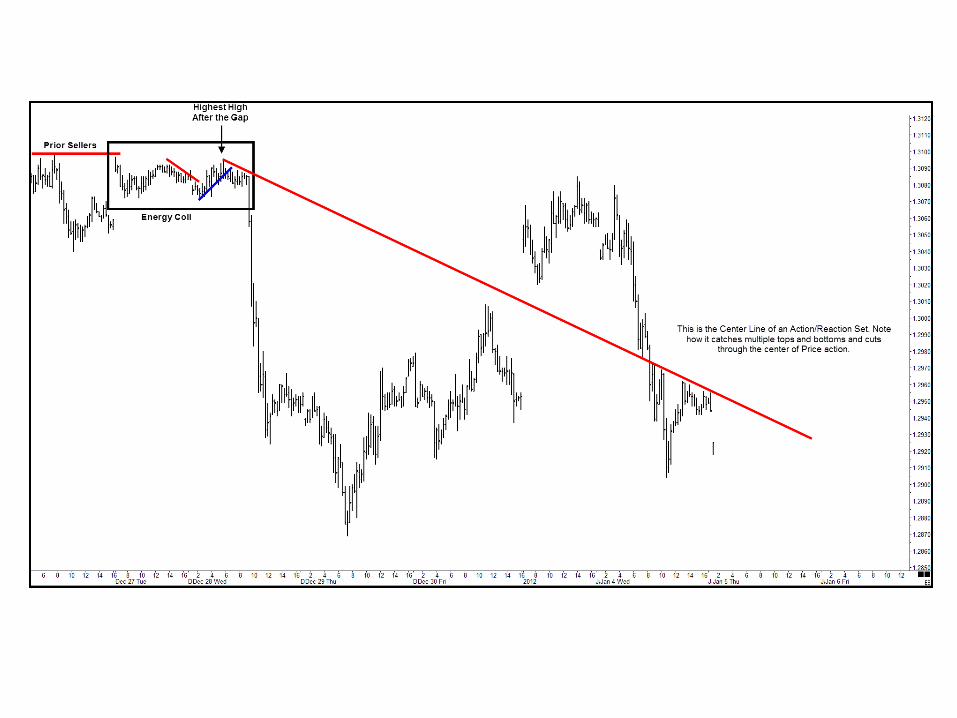

I can draw in the Center Line of an Action Reaction set that starts from the highest high after the first Gap, cuts down through Price action, including the Major Gap, and catches the recent down sloping highs I used when drawing the Change in Behavior Line. Action Reaction Lines, especially their Center Lines, take a bit more art and practice when drawing them, so let’s see if we can find something with some mathematics behind it to help us.
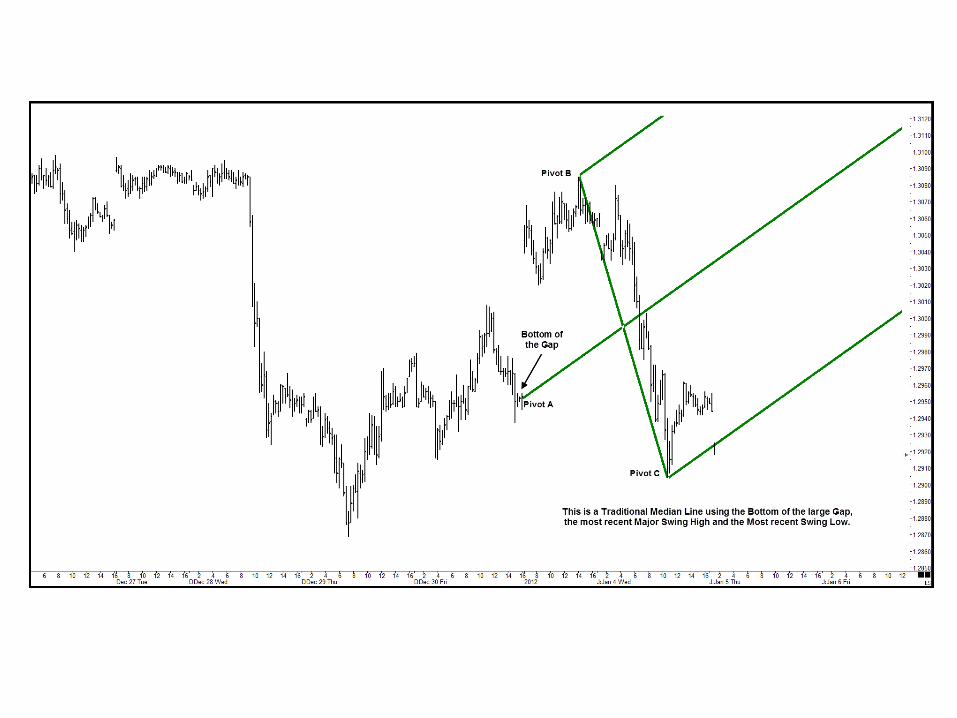

This is a traditional Median Line, drawn from the Bottom of the Major Gap, the recent Major High and the recent Major Low. After I draw it, I push my chair three or four feet back from my trading desk, close my eyes, then open them and take a long hard look. This Median Line isn’t what I am looking for, but I ‘feel’ I am close, I decide to use the same Pivots and draw a Modified Schiff Median Line set to see how it catches or describes the action.
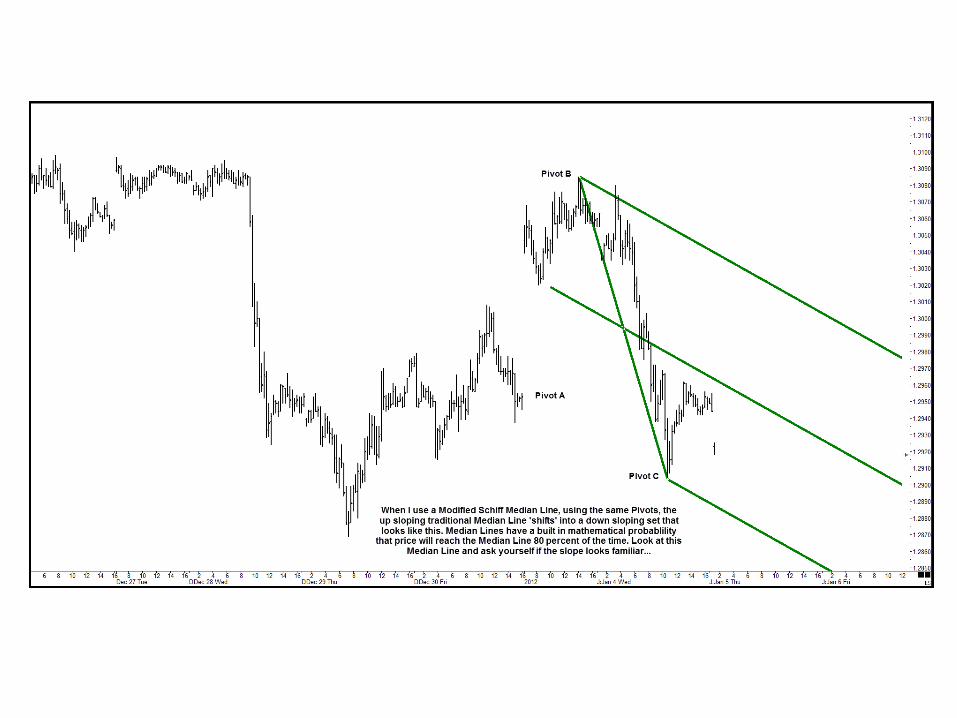
Once again, Median Lines have a mathematical probability built in: Price will reach the Median Line or its Parallel 80 percent of the time. This concept has been proven time and again statistically since the idea was first pioneered by Dr. Alan Andrews at MIT in the mid-1920’s.
As I build this Market Map, I am looking for a ‘Pendulum Pullback’ to sell – so I am expecting price to test the Median Line before it turns lower to head to the Lower Parallel. What does Median Line theory tell us about what price will do when it tests the Median Line? About half the time it stops and reverses and the rest of the time, it accelerates. But remember we are ‘Newtonian Chartists’ and we believe when Price is in a trend, it tends to stay in a trend. Let’s see if we can put all the clues together as we build this ‘Market Map’.


Look at how all the different methods we reviewed come together between 1.2940 and 1.2950, and project that they could all come together within a few bars of each other. If there is going to be a Pendulum Pullback, I want to try to short this area with a reasonable stop.
Let me see if I can diagram a set of orders for this potential trade.
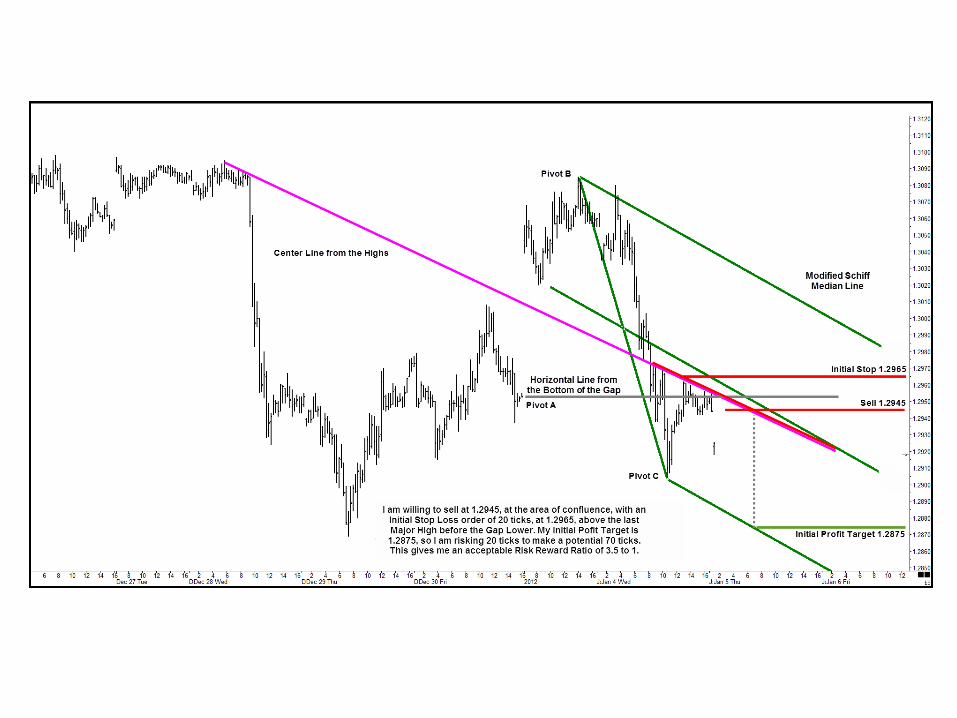
I don’t expect too much of a pullback, both in Price and Space, because of the area of confluence I just diagrammed out. Here are the orders I place in the market:
1. I place a Limit Sell Order at 1.29452. I Place an Initial Stop Loss Order at 1.29653. If I am filled on my Limit Sell Order, I will place a Limit Buy Order at 1.2875 to take profits.
This means I will be risking 20 ticks to make 70 ticks, a Risk Reward Ratio of 3.5 to 1. I would have liked to place my Initial Stop Loss order at 1.2975, above the highs just above the ‘C’ Pivot of the Modified Schiff, but risking 30 ticks on this trade is too much – the Risk Reward does not justify that much risk if I use a realistic Profit Target.
Let’s see if the markets let me in this trade.

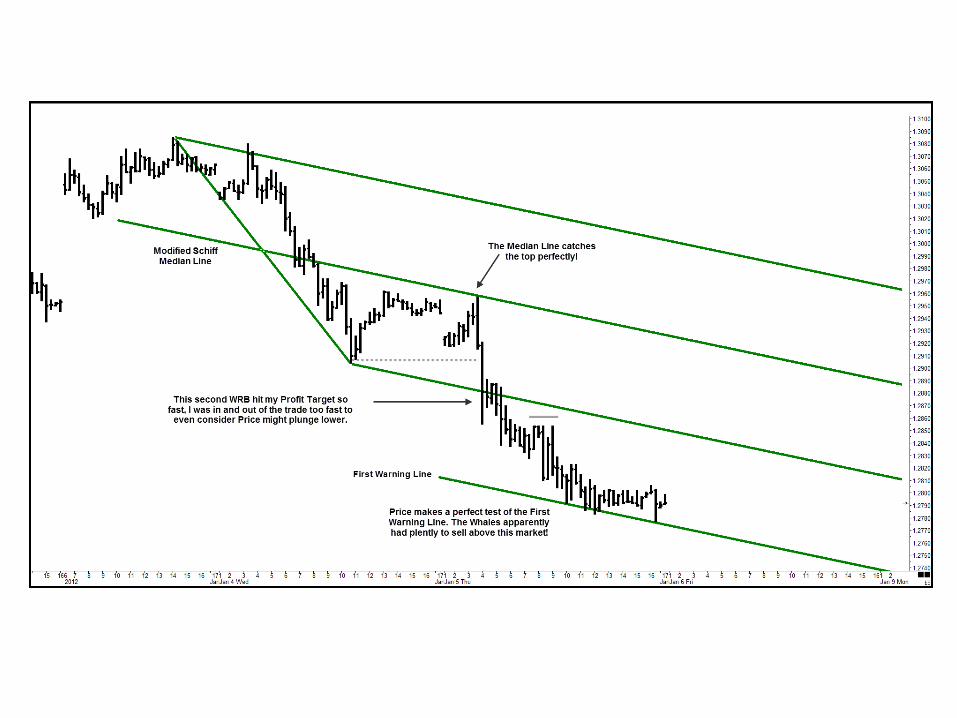
Price pulls back higher in a classic ‘Pendulum Pullback’. My Limit Sell Order at 1.2945 gets filled easily and several bars later, as price climbs above the Horizontal Line drawn from the Bottom of the Prior Major Gap, I begin to think I am going to be stopped out of this trade.
But price runs out of Upside Directional Energy exactly where it is supposed to: at the down sloping Median Line. It turns lower after testing the Median Line to the tick and that same bar becomes a Wide Range Lower bar [WRB] that closes on its lows, leaving me with a nice 25 tick profit. I am considering collapsing my risk now as the next bar unfolds.


Remember! You never know WHAT the markets are going to do! I was in and out of this trade nearly before I knew what happened! Price moved down so fast, I never had a chance to collapse my risk or reconsider my Initial Profit Order!
I made my 70 ticks in this market – don’t get me wrong. And I am not complaining. But when trades play out in an unusual fashion, it always reminds me to check and double check the risk I put on each and every trade. I am not a pessimist, but my mind always wonders what would have happened if I had the opposite position on and the market traded that fast against me! Hard work and preparation is everything when trading these markets. Do you homework, plan your trade, and do your best to execute your plan flawlessly.
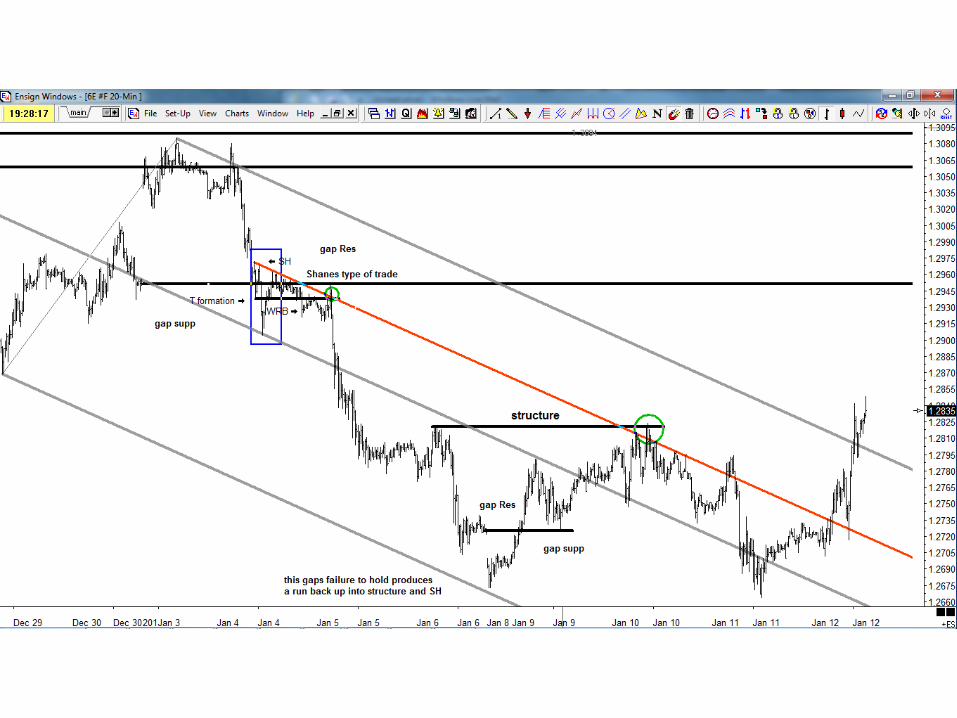
Let’s see where this market headed as it unfolded further.

Thank You for taking the time to attend this session. Questions?
“Master your tools, master yourself.”®Timothy Morge
www.marketgeometry.com www.medianline.com


Thank You for taking the time to attend this session. Questions?
“Master your tools, master yourself.”®Timothy Morge
www.marketgeometry.com www.medianline.com

Access a world of market opportunity.
Diversify and take advantage of current market opportunities with contracts covering all major asset classes including forex, stock indexes, agricultural commodities, energy, metals and interest rates. Learn more in the CME Group Resource Center under IB Exchange Tutorials.
Trade CME Group markets:
•Equivalent market exposure with lower capital requirements
•No uptick rule or short selling restrictions
•Around the clock markets
•Financial safeguards of a regulated exchange
The CME Group is a trademark of CME Group Inc. The Globe Logo, CME and Globex are trademarks of Chicago Mercantile Exchange Inc. The Chicago Board of Trade® are trademarks of the Board of Trade of the City of Chicago. NYMEX is a registered trademark of New York Mercantile Exchange, Inc. All other trademarks are the property of their respective owners.
53
CME Group FX –Manage global FX risk and capture opportunity. In every corner of the world.
• Over $120 billion in daily liquidity
• 56 futures and 31 options based on 20 currencies
• Level Playing Field
• You see and have access to the same tradable prices as a bank, hedge fund or an active individual trader with complete anonymity in all bids and offers
• Electronic access around the world, around the clock on CME Globex
• Safety and Security
• Unparalleled backing of CME Clearing - virtually mitigates counterparty credit risk
• Access to a diverse base of global market participants including banks, hedge funds, proprietary trading firms and active individual traders
www.cmegroup.com/fx
CME E-quivalents -Free Real-Time Quotes in Spot Equivalent Pricescmegroup.com/equivalents