Embed Size (px)
Citation preview

Advanced Lipid Management Douglas Triffon, MD
ADVANCED LIPID ADVANCED LIPID TESTINGTESTING
Douglas W. Douglas W. TriffonTriffon, M.D. FACC, M.D. FACC
DiplomateDiplomate of the American Board of of the American Board of Clinical Clinical LipidologyLipidology
COMPARISON OF LIPID PANELS
STANDARD LIPID PANEL
• Strongest components are:
– TC/HDL RATIO
– NON‐HDL CHOLESTEROL
– LDL‐C
ADVANCED LIPID PANEL
• APO B
• APO B/APO A1
• LDL SUBFRACTIONATION
• HDL SUBTYPE
• Lp(a)
• Hs‐CRP
• LP‐PLA2
• NT‐proBNP
• CYSTATIN C

Advanced Lipid Management Douglas Triffon, MD
Prevalence of Emerging CardiovascularRisk Factors in Younger Individuals witha Family History of Premature CoronaryHeart Disease and Low Framingham
Risk Score
Clin. Cardiol. 31, 11, 542–545 (2008)
GOFMAN’S LIVERMORE COHORT
• Prospective study of 1905 men with 29 yr follow‐up
• Low HDL2 was independently associated with CV events after multivariate analysis. HR= 1.67 for total CHD.
• Premature CHD was increased 60% by low HDL2
Atherosclerosis 214 (2011) 196–202

Advanced Lipid Management Douglas Triffon, MD
GOFMAN’S LIVERMORE COHORT
Atherosclerosis 214 (2011) 196–202
Apo BApo B Apo B has been shown to be superior to LDLApo B has been shown to be superior to LDL--C in predicting C in predicting
risk of CV events in the following trials:risk of CV events in the following trials: Quebec Cardiovascular StudyQuebec Cardiovascular Study AMORIS StudyAMORIS Study ThromboThrombo StudyStudy ThromboThrombo Metabolic Syndrome StudyMetabolic Syndrome Study Northwick Park Heart StudyNorthwick Park Heart Study NursesNurses’’ Health StudyHealth Study Health ProfessionalsHealth Professionals’’ FollowFollow--up Studyup Study AFCAPS/TEXCAPSAFCAPS/TEXCAPS Leiden Heart TrialLeiden Heart Trial INTERHEART StudyINTERHEART Study WomenWomen’’s Health Studys Health Study Ideal and TNT StudiesIdeal and TNT Studies ISISISIS COPENHAGENCOPENHAGEN LIPIDLIPID FIELD (PLACEBO GROUP ONLY)FIELD (PLACEBO GROUP ONLY)

Advanced Lipid Management Douglas Triffon, MD
LDL‐C VS APO B1.) AMORIS n=172,000 F/U=5.5 yrs
RR of LDL‐C = 1.14 (RR Female=0.85)RR of apo B= 1.33 (RR Female = 1.53)
2.) ISIS n = 3510 controls = 9805RR of LDL‐C = 2.21RR of apo B = 2.66
3.) Health Professional Study n=18,225 F/U=6yrRR of LDL‐C = 1.81RR of apo B = 3.01
4. Copenhagen Study n= 9231 F/U=8 yrsRR of LDL‐C = 1.4 (Female RR= 1.4)RR of apo B =1.6 (Female RR=1.8)
LDL‐C VS APO B5.) Nurses Health Study n=33,000 F/U= 8yrs
LDL‐C RR=2.73
apo B RR=4.7
6.) LIPID n=9014 R/U 6.1yrs
LDL‐C RR= 1.15
apo B RR= 1.64
7.) AFCAPS/TEXCAPS n=6505 F/U= 5.2 yrs
LDL‐C RR=1.29
apo B RR=1.6
8.) TNT and IDEAL n=18,018 F/U=4.8 yrs
LDL‐C RR= 0.95
Apo B RR=1.24
9.) FRAMINGHAM n= 3322 F/U = 15 yrs
LDL‐C HR = 1.11
APO B HR = 1.37

Advanced Lipid Management Douglas Triffon, MD
LDL‐C VS APO B10.) Quebec Cardiovascular Study n=2155 F/U = 5 yrs
LDL‐C RR = NSAPO B RR = 1.4 (p<0.001)
11.) Thrombo Study n=1045 F/U = 2.16 yrsLDL‐C RR = NSAPO B RR = 1.82 (p= 0.018)
12.) Northwick Park Heart Study n=2508 F/U = 6 yrsLDL‐C RR =4.4 (multivariate 1.31)APO B RR = 4.64 (multivariate 1.42)
13.) Leiden Heart Study N=848 F/U = 2.95 yrsLDL‐C RR = 1.16APO B RR =3.21 (P=0.033)
14.) FIELD STUDY PLACEBO GROUP N= 4900 F/U = 5 YRSLDL‐C HR = 1.05APO B HR = 1.14 (P=0.001)
Total patient yrs of follow‐up is 1,826,71
LDL‐C VS APO BNEGATIVE STUDIES
1.) NHANES IIILDL‐C vs apo B RR=NS
2.) ARIC n=12,300 F/U=10 yrsLDL‐C RR= 1.42apo B RR= 1.31
3.) PREVEND N= 6948 F/U = 7.9 yrsLDL‐C RR = 1.24 (HDL = 52 and TG = 98)apo B RR = 1.13 ( Diabetes = 2.8%)
4.) FIELD STUDY FENOFIBRATE SUBGROUPLDL‐C HR = 1.16APO B HR = 1.22

Advanced Lipid Management Douglas Triffon, MD
APO B VS LDL‐C
FRAMINGHAM STUDY ROC CURVES ANALYSISAPO B HR = 1.37 AUC = 0.73
LDL‐C HR = 1.11 AUC = 0.71
AMORIS STUDY ROC CURVE ANALYSIS
APO B RR = 1.33 AUC = 0.65
LDL‐C RR = 1.14 AUC = 0.6
FIELD STUDY ROC CURVE ANALYSIS
APO B HR = 1.14 AUC = 0.545
LDL‐C HR = 1.05 AUC = 0.530
JAMA, August 15, 2007—Vol 298, No. 7
Advanced Lipid Management Douglas Triffon, MD
11
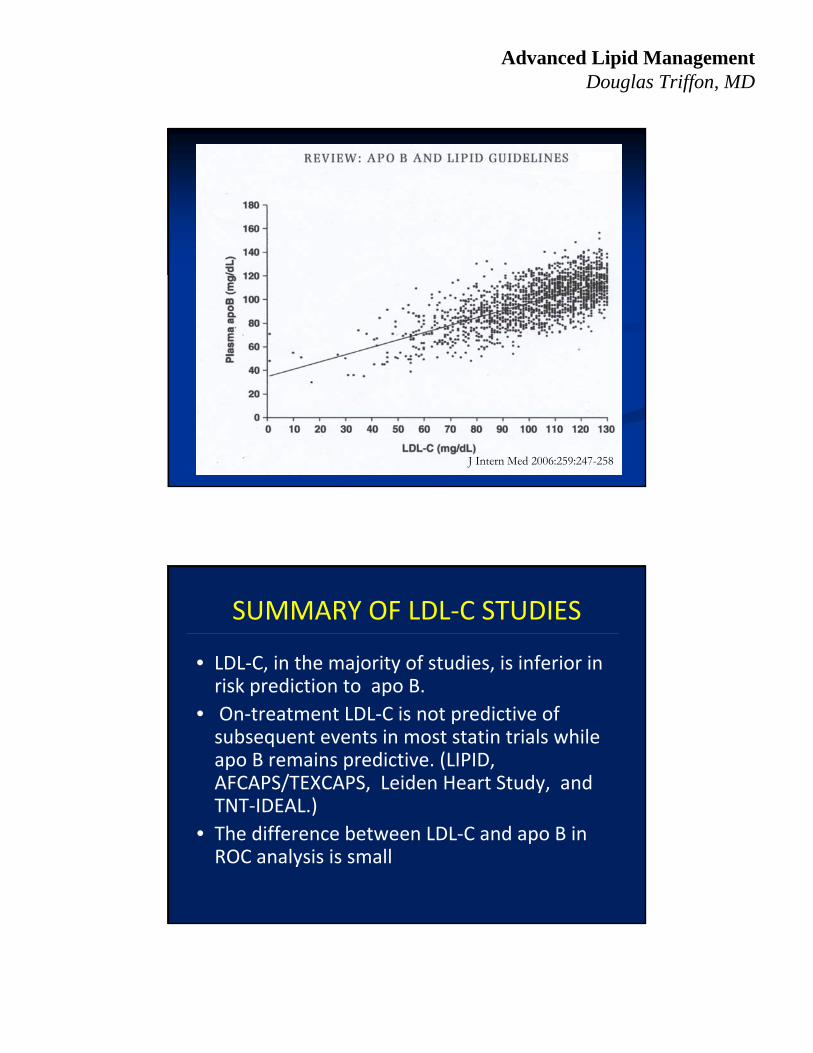
J Intern Med 2006:259:247-258
SUMMARY OF LDL‐C STUDIES
• LDL‐C, in the majority of studies, is inferior in risk prediction to apo B.
• On‐treatment LDL‐C is not predictive of subsequent events in most statin trials while apo B remains predictive. (LIPID, AFCAPS/TEXCAPS, Leiden Heart Study, and TNT‐IDEAL.)
• The difference between LDL‐C and apo B in ROC analysis is small

Advanced Lipid Management Douglas Triffon, MD
THE EMERGING RISK FACTOR COLLABORATION91307 SUBJECTS FROM 22 TRIALS
JAMA, November 11, 2009—Vol 302, No. 18
NON‐HDL CHOLESTEROL AND APO B
• Non‐HDL cholesterol and apo B are highly correlated with correlation coefficients of 0.93‐0.94.
• Elevated triglycerides decrease this correlation to 0.69
• Statin treatment changes this relationship
• Non‐HDL‐C and apo B can become discordant in risk prediction
Advanced Lipid Management Douglas Triffon, MD
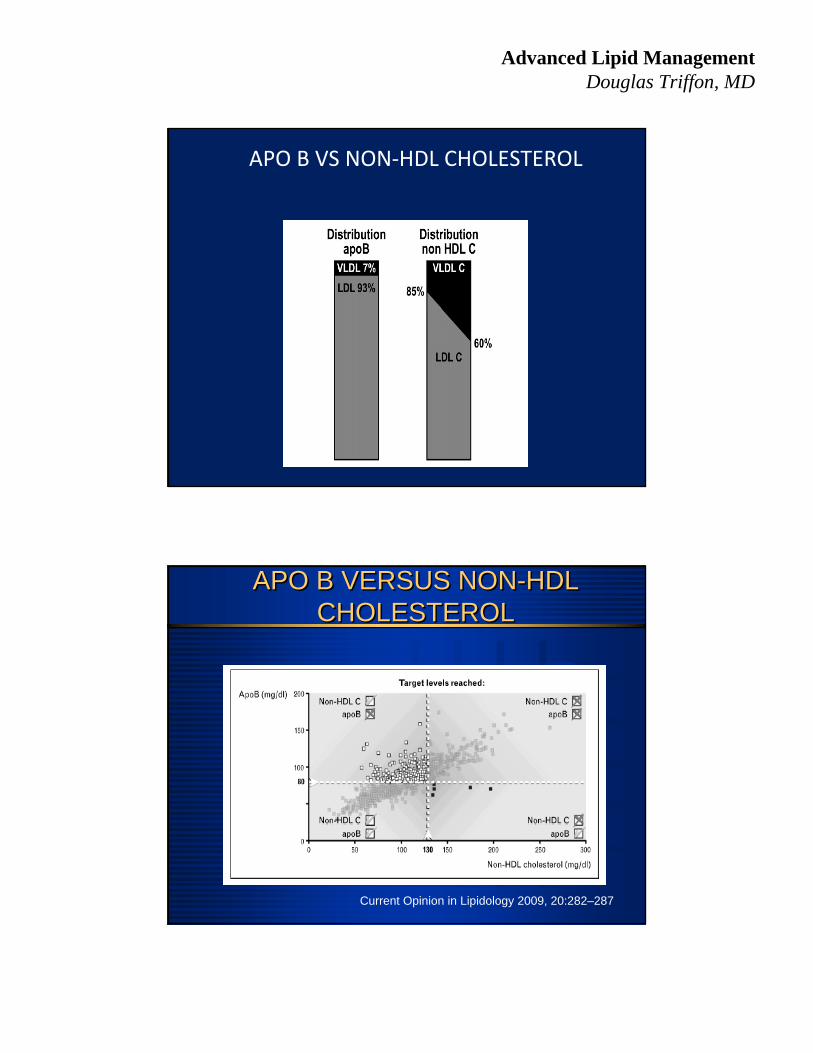
APO B VS NON‐HDL CHOLESTEROL
APO B VERSUS NON-HDL CHOLESTEROL
APO B VERSUS NON-HDL CHOLESTEROL
Current Opinion in Lipidology 2009, 20:282–287

Advanced Lipid Management Douglas Triffon, MD
NON‐HDL‐C VS APO B
Journal of Clinical Lipidology, Vol 4, No 3, June 2010
HR 1.9
HR 3.45
2.75
APO B AND NON-HDL CHOLESTEROLAPO B AND NON-HDL CHOLESTEROL
Am J Cardiol 2009;104:548–553

Advanced Lipid Management Douglas Triffon, MD
Baseline Treatment
APO B AND NON-HDL CHOLESTEROLAPO B AND NON-HDL CHOLESTEROL
Am J Cardiol 2009;104:548–553
APO B VS NON-HDL CHOLESTEROLAPO B VS NON-HDL CHOLESTEROL
J Am Coll Cardiol 2008;52:626–32

Advanced Lipid Management Douglas Triffon, MD
APO B VS NON HDL CHOLESTEROLAPO B VS NON HDL CHOLESTEROL
J Am Coll Cardiol 2008;52:626–32

Advanced Lipid Management Douglas Triffon, MD
Circ;2008;117,3002‐3009
TNT‐IDEAL STUDY
Lipids, lipoproteins, and apolipoproteins as risk markers of
myocardial infarction in 52 countries (the INTERHEART study): a case‐
control study
Lancet Jul 2008; 372: 224‐33

Advanced Lipid Management Douglas Triffon, MD
INTERHEART
Lancet Jul 2008; 372: 224‐33
INTERHEART: Results

Advanced Lipid Management Douglas Triffon, MD
AMORIS STUDY
Journal of Internal Medicine 259: 455–461
LIPID RATIOS
• The relationship between apo B and risk is continuous where the relationship with HDL is more complex at the extremes of values.
• Do LDL and HDL contribute equally and continuously at all values?

Advanced Lipid Management Douglas Triffon, MD
CONTINGENT EFFECT OF HDL ON CV RISK
Current Atherosclerosis Reports 2007, 9:261–265
ROC CURVE ANALYSIS1.) GOES STUDY (593 statin treated pts)APO B/APO A‐1 HR = 3.77 AUC = 0.655TC/HDL HR = 1.19 AUC = 0.65
2.) EPIC NORFOLK STUDY (NO STATINS AND AODM)HDL = 52 MG/DL TG = 141 MG/DL
APO B/APOA‐1 OR = 2.08 AUC = 0.673 (FRS)TC/HDL OR = 1.85 AUC = 0.67
3.) FRAMINGHAM HEART STUDY n=3332 f/u=15yrsAPO B/APO A1 HR = 1.39 AUC = 0.74TC/HDL HR = 1.39 AUC = 0.73
4.) FIELD N= 9795 F/U = 5 YRSAPO B/APO A1 HR = 1.2 AUC = 0.589TC/HDL HR = 1.21 AUC = 0.592

Advanced Lipid Management Douglas Triffon, MD
ROC CURVE ANALYSIS
AMORIS STUDY
Journal of Internal Medicine 259: 455–461
ERRORS USING RATIOS
• EPIC NORFOLK STUDY‐ APO B/APO A1 The percent of reclassified cases was incorrect 41% of the time and controls reclassified in error 50% of the time.
• FRAMINGHAM STUDY‐ APOB/APOA1 had net improvement of reclassification of risk of 9.2%
• AMORIS STUDY‐TC/HDL underestimates risk in 69% of men and 85% of women and overestimates risk in 26% of men and 12% of women.
Ann Intern Med. 2007;146:640‐648.

Advanced Lipid Management Douglas Triffon, MD
Lp(a): LDL with apoliprotein(a) attachedLp(a): LDL with apoliprotein(a) attached
apoB100
Binds LDLreceptor
and oxidized LDLreceptor
SSn
apo (a)
Promotes smoothmuscle cell activity
Inhibitsfibrinolysis
Binds vascularmatrix and cells
Lipid
J Cardiovasc Risk 1995;2:206-15
Lp(a) – cholesterol in FraminghamLp(a) – cholesterol in Framingham
Clinical Chemistry 1999; 45(7):1039-1046
1.0x
2.3x
0
0.5
1
1.5
2
2.5
1.0x
2.3x
0
0.5
1
1.5
2
2.5
Odds Ratio for CHD 2.3x higher when Lp(a) cholesterol > 10mg/dL, after adjusting for age, HDL, LDL, smoking, diabetes, BP, and BMI.
Lp(a) < 10 mg/dL Lp(a) > 10 mg/dL
Odd
s R
atio
for
CH
D

Advanced Lipid Management Douglas Triffon, MD
Lp(a) CHOLESTEROL VS Lp(a) MASS
Steven R. Jones, Johns Hopkins Hospital, Baltimore, MD; Krishnaji Kulkarni, Atherotech
• Lipoprotein (a) Cholesterol, But Not Lp(a) Mass, Is An Independent Predictor Of Angiographic Coronary Artery Disease And Subsequent Cardiovascular Events In Patients Referred For Coronary Angiography.
• Joseph P McConnell1; Linnea M Baudhuin1; Peter B Berger2; Iftikhar J Kullo3; John F O’Brien3; Sandra C Bryant3; Stacy J Hartman3; Jennie N Ward3; Ryan J Lennon3; Virend K Somers3; George G Klee3; Allan S Jaffe3
Advanced Lipid Management Douglas Triffon, MD
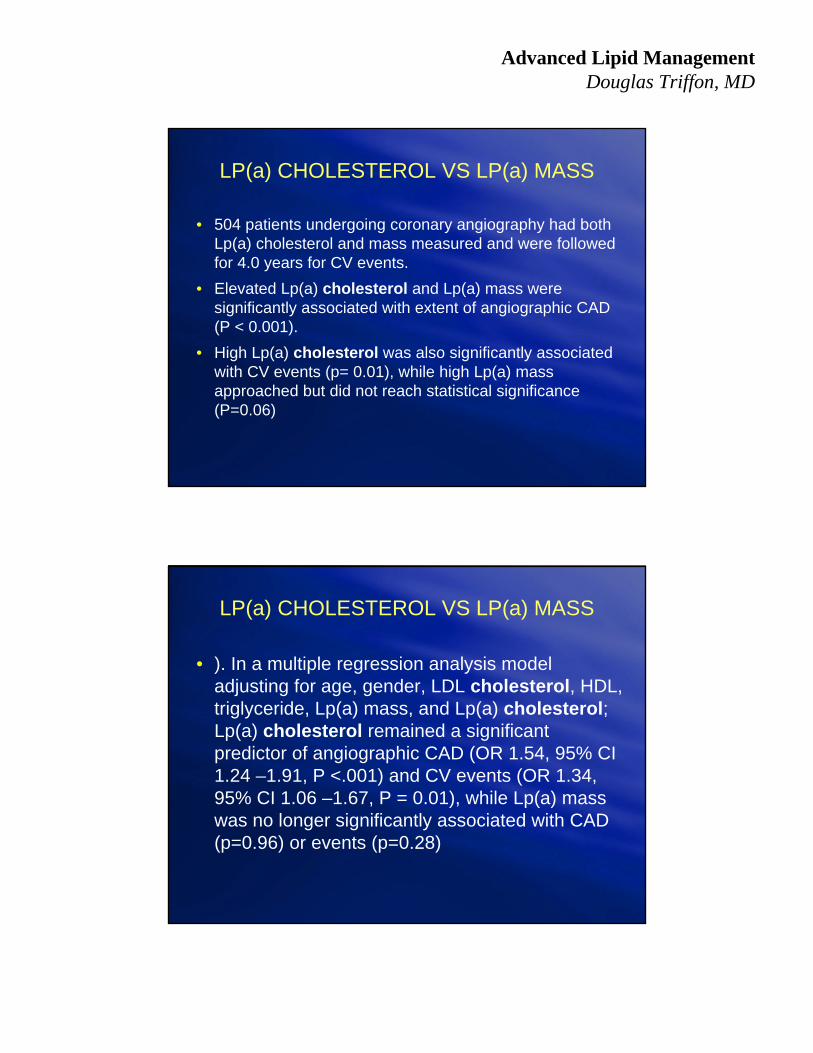
LP(a) CHOLESTEROL VS LP(a) MASS
• 504 patients undergoing coronary angiography had both Lp(a) cholesterol and mass measured and were followed for 4.0 years for CV events.
• Elevated Lp(a) cholesterol and Lp(a) mass were significantly associated with extent of angiographic CAD (P < 0.001).
• High Lp(a) cholesterol was also significantly associated with CV events (p= 0.01), while high Lp(a) mass approached but did not reach statistical significance (P=0.06)
LP(a) CHOLESTEROL VS LP(a) MASS
• ). In a multiple regression analysis model adjusting for age, gender, LDL cholesterol, HDL, triglyceride, Lp(a) mass, and Lp(a) cholesterol; Lp(a) cholesterol remained a significant predictor of angiographic CAD (OR 1.54, 95% CI 1.24 –1.91, P <.001) and CV events (OR 1.34, 95% CI 1.06 –1.67, P = 0.01), while Lp(a) mass was no longer significantly associated with CAD (p=0.96) or events (p=0.28)

Advanced Lipid Management Douglas Triffon, MD
Oxidized Phospholipids, Oxidized Phospholipids, Lipoprotein(aLipoprotein(a), ), LipoproteinLipoprotein--Associated Associated PhospholipasePhospholipase A2 A2
Activity and 10Activity and 10--Year Cardiovascular Outcomes: Year Cardiovascular Outcomes: Prospective Results from the Prospective Results from the BruneckBruneck Study Study
765 inhabitants of 765 inhabitants of BruneckBruneck, Italy were , Italy were studied over a 10 year periodstudied over a 10 year period
The primary endThe primary end--point was CV death, MI, point was CV death, MI, CVA, and TIA.CVA, and TIA.
OXPL/OXPL/apoapo B, B, Lp(aLp(a), and Lp), and Lp--PLA2 were PLA2 were measuredmeasured
ATVB 2007;27;1788-95
ATVB 2007;27;1788-95

Advanced Lipid Management Douglas Triffon, MD
ATVB 2007;27;1788-95
ADDITIVE EFFECTS OF Lp(a) ANDPLA2
BRUNECK STUDY
• Prospective population based survey– 765 subjects with CAD
– 10 year follow‐up (82 events)
– End point was CV death, MI, CVA or TIA
– RR was elevated in highest tertiles of both Lp(a) and Lp‐PLA2 activity versus lowest tertiles RR=3.5 vs 1.0
EPIC NORFOLK STUDY
• Nested Case Control Study– 763 cases
– 1397 controls
– 6 year follow‐up
– End point was fatal and non‐fatal CAD
– RR was elevated in highest tertiles of both Lp(a) and sPLA2 activity versus lowest tertiles RR=2.97 vs 1.00
JACC Vol,56, No. 12,2010Sept 14,2010:946‐55
ATVB 2007;27;1788‐95

Advanced Lipid Management Douglas Triffon, MD
OXIDATION SPECIFIC BIOMARKERS
JACC Vol,56, No. 12,2010Sept 14,2010:946‐55
MULTIPLE BIOMARKERS
• Uppsala Longitudinal Study of Adult Men N=1135 men (Mean age = 70 yrs)
Follow‐up 10 years
Assessed additive effects of troponin I, pro‐BNP, cystatinC, and hs‐CRP on death from all causes and CV death.
All the biomarkers predicted total mortality and CV death.
Subjects with elevated levels of any two biomarkers tripled the risk of CV death.
Subjects with 3 biomarkers = 7 fold increased risk
C statistic was increased from 0.664 to 0.766 with addition of the 4 biomarkers to established risk factors.
NEJM;358, May 15,2008,2107‐2116
Advanced Lipid Management Douglas Triffon, MD
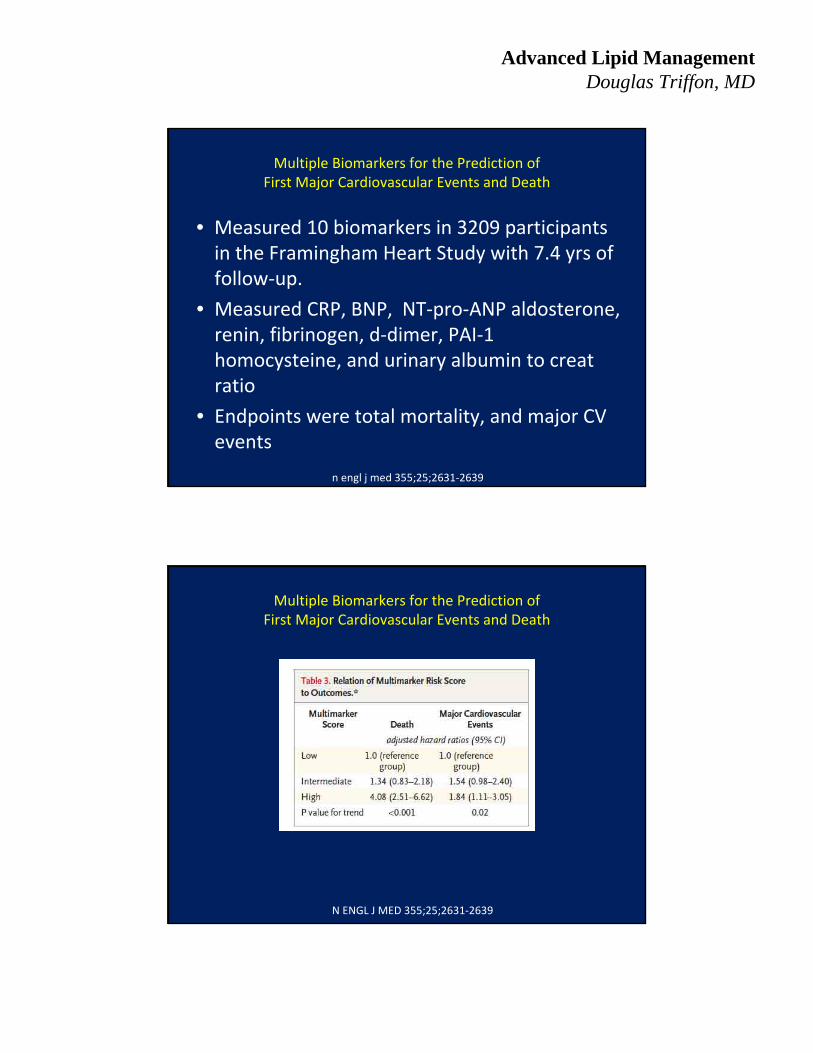
Multiple Biomarkers for the Prediction ofFirst Major Cardiovascular Events and Death
• Measured 10 biomarkers in 3209 participants in the Framingham Heart Study with 7.4 yrs of follow‐up.
• Measured CRP, BNP, NT‐pro‐ANP aldosterone, renin, fibrinogen, d‐dimer, PAI‐1 homocysteine, and urinary albumin to creatratio
• Endpoints were total mortality, and major CV events
n engl j med 355;25;2631‐2639
Multiple Biomarkers for the Prediction ofFirst Major Cardiovascular Events and Death
N ENGL J MED 355;25;2631‐2639

Advanced Lipid Management Douglas Triffon, MD
WOMEN’S HEALTH STUDY
Circulation. 2009;119:931–939.
SUMMARY
Cholesterol Risk
– Apo B or Non‐HDL Cholesterol Treat with statins
Inflamatory Risk Treat with combination Rx
‐ HS‐CRP
‐Lp(a)
‐ Lp‐Pla2
Cardiorenal Risk Treat with ACE‐I, ARB, DRI
‐Microalbumin
‐ BNP