Embed Size (px)
Citation preview
Daniel Brooks, Aminul Huque, & Jeff Smith
PC Enhanced Inverters Stakeholder Meeting 2014 April 28
Advanced Inverter Functionality to Support Grid Reliability &
Related Interconnection Requirements Part 2
2© 2014 Electric Power Research Institute, Inc. All rights reserved.
Objectives & Agenda
Agenda: •Bulk System reliability impacts & needed inverter-based generation functionality
•Overview of Distribution System impacts
•Advanced inverter cost considerations
•Key take-aways from Apr 23-24 IEEE 1547 Mtg
•Q&A
Basic Understanding of Need for AdvancedReliability Services from Inverter-Based Generation

3© 2014 Electric Power Research Institute, Inc. All rights reserved.
PJM Renewable Integration Study Scenario
14% RPS Scenario• Onshore Wind: 28.8 GW
• Offshore Wind: 4.0 GW
• Central Solar: 3.2 GW
• Distributed Solar: 4.1 GW
Recently reported study included scenarios rangingfrom 2% (BAU) to 30% energy from renewables
30% High PV Scenario• Onshore Wind: 47.1 GW
• Offshore Wind: 5.4 GW
• Central Solar: 27.3 GW
• Distributed Solar: 33.8 GW

April 28, 2014
Bulk System Reliability Impacts and Benefits of Inverter Generation Support
5© 2014 Electric Power Research Institute, Inc. All rights reserved.
General Reliability Concerns
Reliability Functions• Reactive power/voltage control• Active power control
– inertia/primary freq response• Disturbance performance
– voltage & frequency ride through
Other Considerations• Inverter capabilities• Available headroom for wind/PV• Distribute
Inverter-Based Generators must supply Reliability Services as they
Displace Conventional
Sources of thosereliability services!
6 © 2014 Electric Power Research Institute, Inc. All rights reserved.
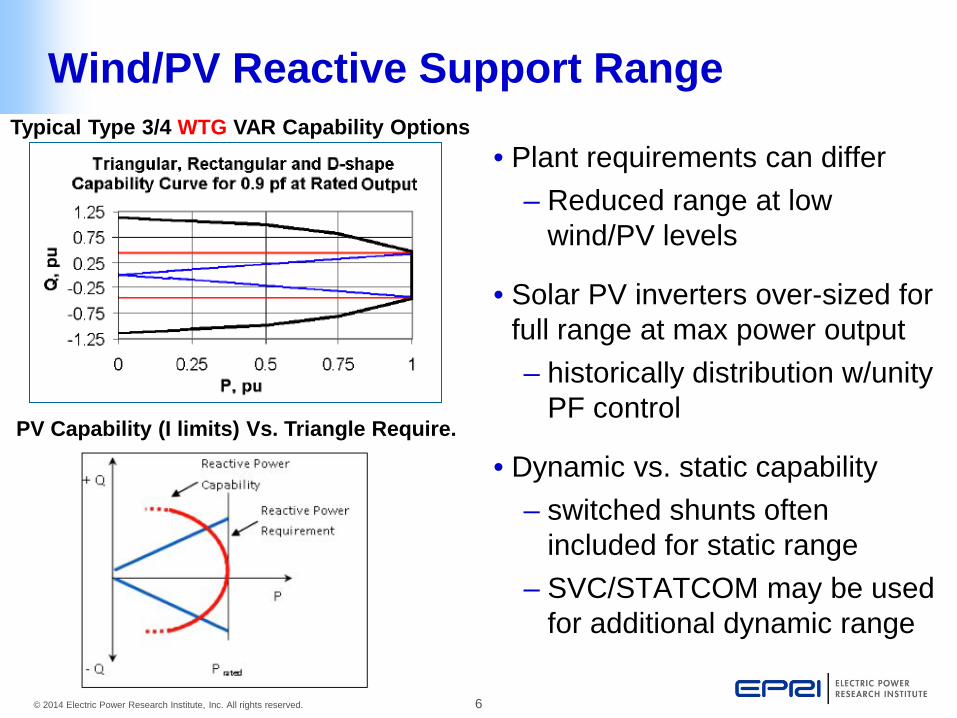
Wind/PV Reactive Support Range
• Plant requirements can differ – Reduced range at low
wind/PV levels
• Solar PV inverters over-sized for full range at max power output – historically distribution w/unity
PF control
• Dynamic vs. static capability – switched shunts often
included for static range – SVC/STATCOM may be used
for additional dynamic range
Typical Type 3/4 WTG VAR Capability Options
PV Capability (I limits) Vs. Triangle Require.

7© 2014 Electric Power Research Institute, Inc. All rights reserved.
EPRI PV Voltage Control Project** ResultsImpact of PV Reactive Power Control
Terminal Voltage Control +/-0.95 PF
Terminal Power Factor Control
•Selected Bus Voltage -- July•High solar PV output •PF Control Lower Voltages•Voltage Control More Robust Voltages
**Bulk Electricity System Impacts of Distributed and Transmission System Connected Solar PV, EPRI, Palo Alto, CA: 2012. 1024349.
8© 2014 Electric Power Research Institute, Inc. All rights reserved.
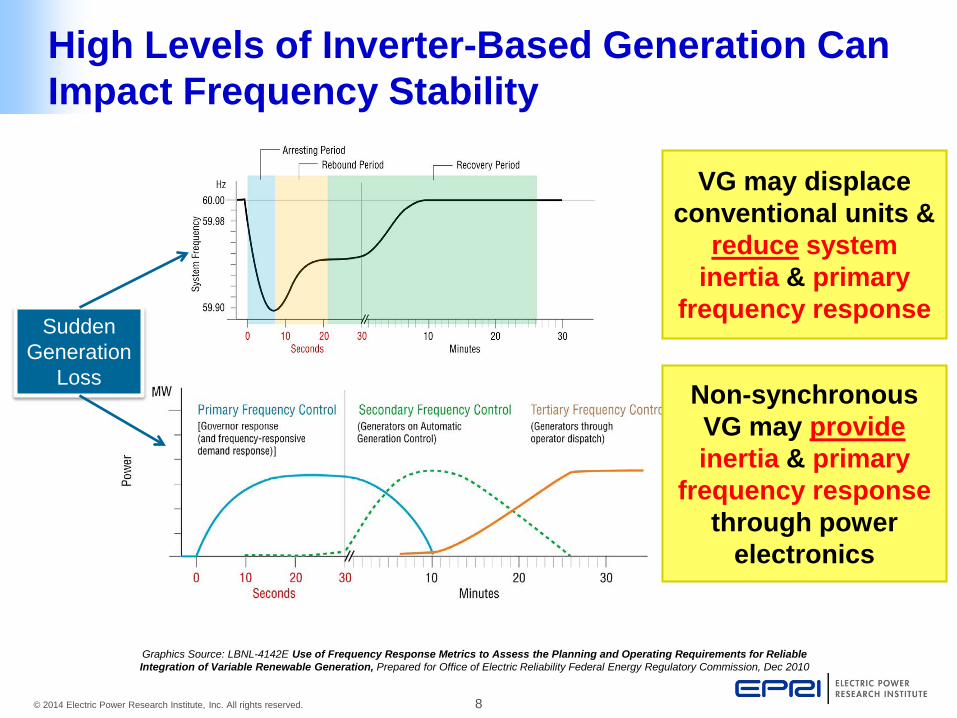
High Levels of Inverter-Based Generation Can Impact Frequency Stability
Graphics Source: LBNL-4142E Use of Frequency Response Metrics to Assess the Planning and Operating Requirements for Reliable Integration of Variable Renewable Generation, Prepared for Office of Electric Reliability Federal Energy Regulatory Commission, Dec 2010
Sudden Generation
LossNon-synchronous VG may provideinertia & primary
frequency response through power
electronics
VG may displace conventional units &
reduce system inertia & primary
frequency response

9© 2014 Electric Power Research Institute, Inc. All rights reserved.
59.5
59.6
59.7
59.8
59.9
60
60.1
0 5 10 15 20 25 30 35 40 45
Freq
uenc
y (H
z)
Base(15%)
Base (20%)
Base(30%)
Base(40%)
Nadir
Settled Frequency
UFLS
EPRI Frequency Response Project (WECC)Impact of Wind Without Frequency Response
All Else Constant, as Wind Gen without Freq Control
replaces Thermal Gen, Freq Performance Deteriorates

10© 2014 Electric Power Research Institute, Inc. All rights reserved.
EPRI Frequency Response Project (WECC)Benefits of Wind With Frequency Response
10
59.5
59.6
59.7
59.8
59.9
60
0 5 10 15 20 25 30 35 40 45
Freq
uenc
y (H
z)
Time (Seconds)
Base (No Wind Inertia and Droop)
With 4% Wind Droop
NadirSettled
Frequency
Frequency Response
135
140
145
150
155
160
0 5 10 15 20 25 30 35 40 45 50
Freq
uenc
y (H
z)
Time (Seconds)
With Wind Inertia (56% CF)Wind Recovery
MW Output of a Unit
Frequency Frequency
135
140
145
150
155
160
Freq
uenc
y (H
z)
59.5
59.6
59.7
59.8
59.9
60
0 5 10 15 20 25 30 35 40 45
Freq
uenc
y (H
z)
Time (Seconds)
Base (No Wind Inertia and Droop)
With Inertia (56% CF)Slow Recovery
Wind Providing Inertial Response
Wind Providing Droop Response
•Wind Inertia & Droop Control Improve Freq Performance•Controls must be tuned to ensure desired performance
11 © 2014 Electric Power Research Institute, Inc. All rights reserved.
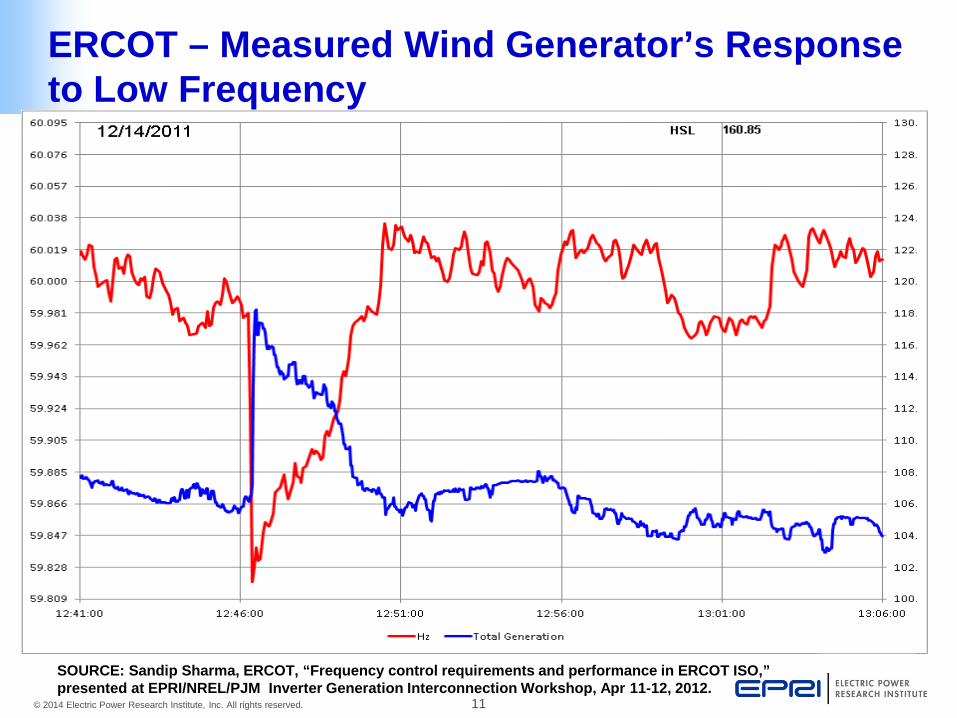
ERCOT – Measured Wind Generator’s Response to Low Frequency
SOURCE: Sandip Sharma, ERCOT, “Frequency control requirements and performance in ERCOT ISO,” presented at EPRI/NREL/PJM Inverter Generation Interconnection Workshop, Apr 11-12, 2012.

12 © 2014 Electric Power Research Institute, Inc. All rights reserved.
SOURCE: Sandip Sharma, ERCOT, “Frequency control requirements and performance in ERCOT ISO,” presented at EPRI/NREL/PJM Inverter Generation Interconnection Workshop, Apr 11-12, 2012.
ERCOT – Measured Wind Generator’s Response to High Frequency
13© 2014 Electric Power Research Institute, Inc. All rights reserved.
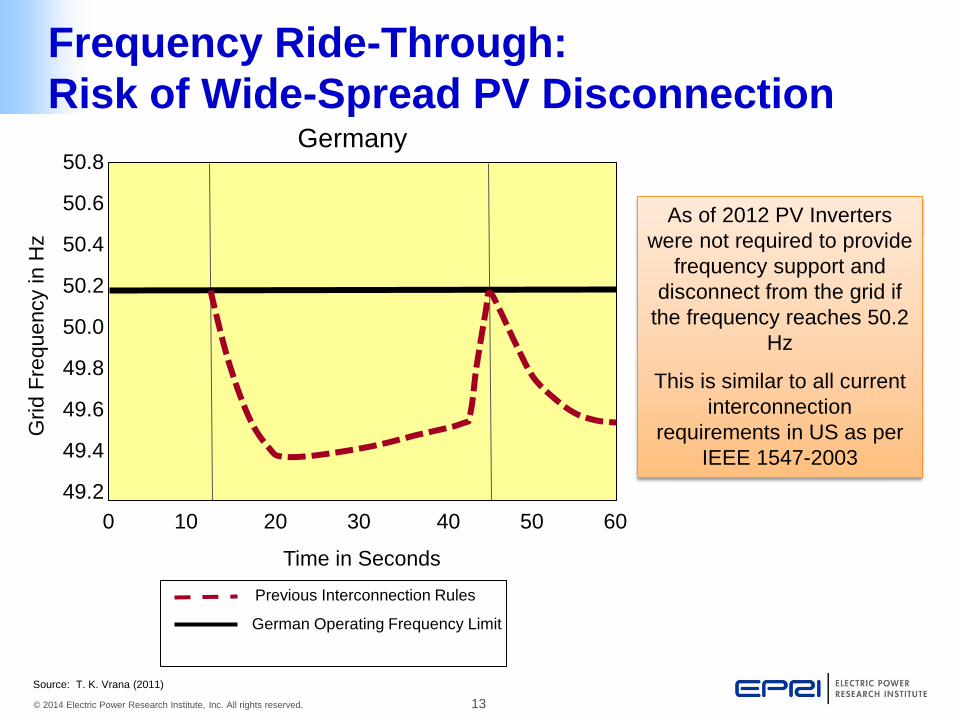
Frequency Ride-Through:Risk of Wide-Spread PV Disconnection
50.8
50.6
50.4
50.2
50.0
49.8
49.6
49.4
49.2
Grid
Fre
quen
cy in
Hz
Time in Seconds
0 10 20 30 40 50 60
Source: T. K. Vrana (2011)
Previous Interconnection Rules
German Operating Frequency Limit
Germany
As of 2012 PV Inverters were not required to provide
frequency support and disconnect from the grid if
the frequency reaches 50.2 Hz
This is similar to all current interconnection
requirements in US as per IEEE 1547-2003
14© 2014 Electric Power Research Institute, Inc. All rights reserved.
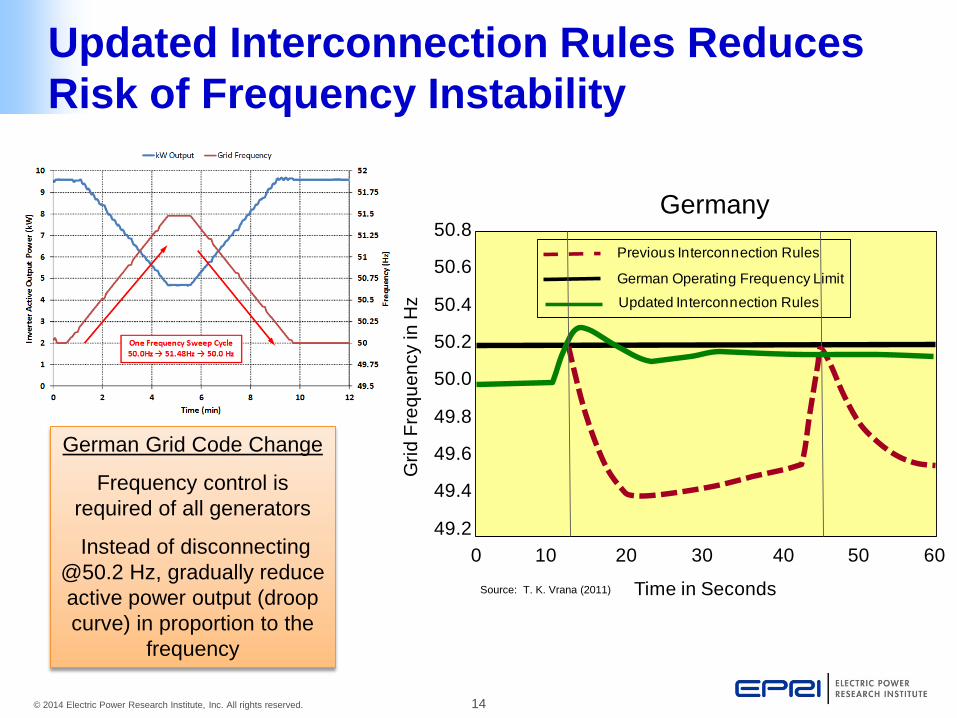
Updated Interconnection Rules Reduces Risk of Frequency Instability
Source: T. K. Vrana (2011)
Germany50.8
50.6
50.4
50.2
50.0
49.8
49.6
49.4
49.2
Grid
Fre
quen
cy in
Hz
Time in Seconds
0 10 20 30 40 50 60
Updated Interconnection Rules
Previous Interconnection Rules
German Operating Frequency Limit
German Grid Code Change
Frequency control is required of all generators
Instead of disconnecting @50.2 Hz, gradually reduce active power output (droop curve) in proportion to the
frequency
15© 2014 Electric Power Research Institute, Inc. All rights reserved.
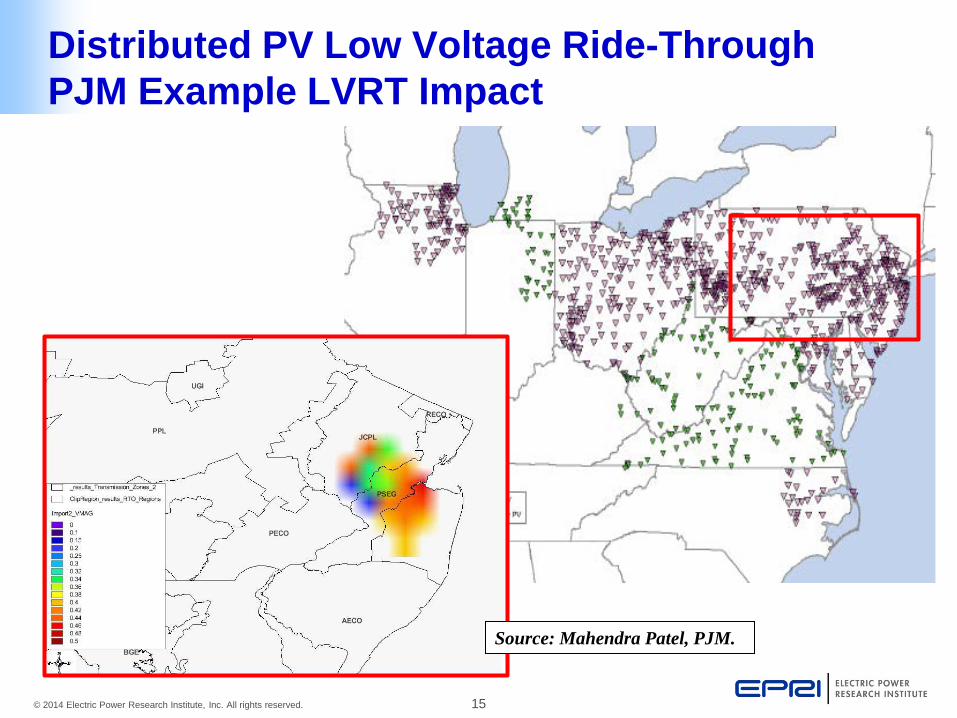
Distributed PV Low Voltage Ride-Through PJM Example LVRT Impact
Source: Mahendra Patel, PJM.

16 © 2014 Electric Power Research Institute, Inc. All rights reserved.
Five Points Solar Station (inverters not equipped with LVRT)
5 MW PV
10 MW PV
1 M
W e
ach
1 MW each
5 MW PV 10 MW PV Westside Solar Station (inverters equipped with LVRT)
Schindler Sub; 12 kV
Bus
115/12 kV 30 MVA
Phase to Phase fault
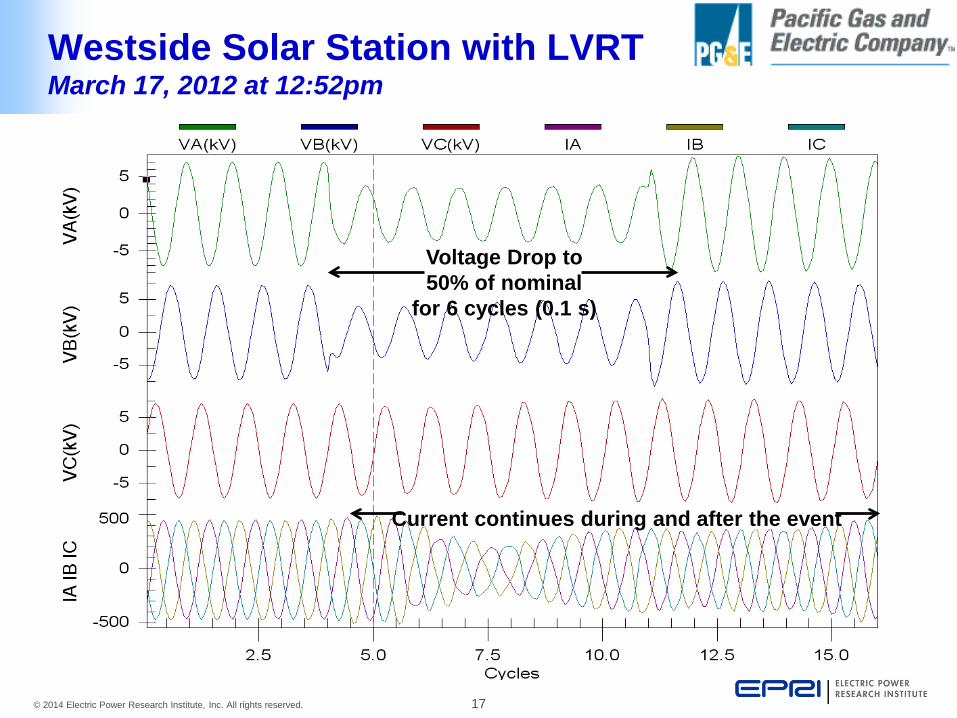
Two phases slapped together Fault cleared in 6 cycles (0.1 s) Happened 4 times: 12:52 pm; 12:53 pm; 13:22 pm; 14:21 pm
LVRT – PG&E Experience
March 17, 2012
17 © 2014 Electric Power Research Institute, Inc. All rights reserved.
Voltage Drop to 50% of nominal
for 6 cycles (0.1 s)
Current continues during and after the event
Westside Solar Station with LVRT March 17, 2012 at 12:52pm
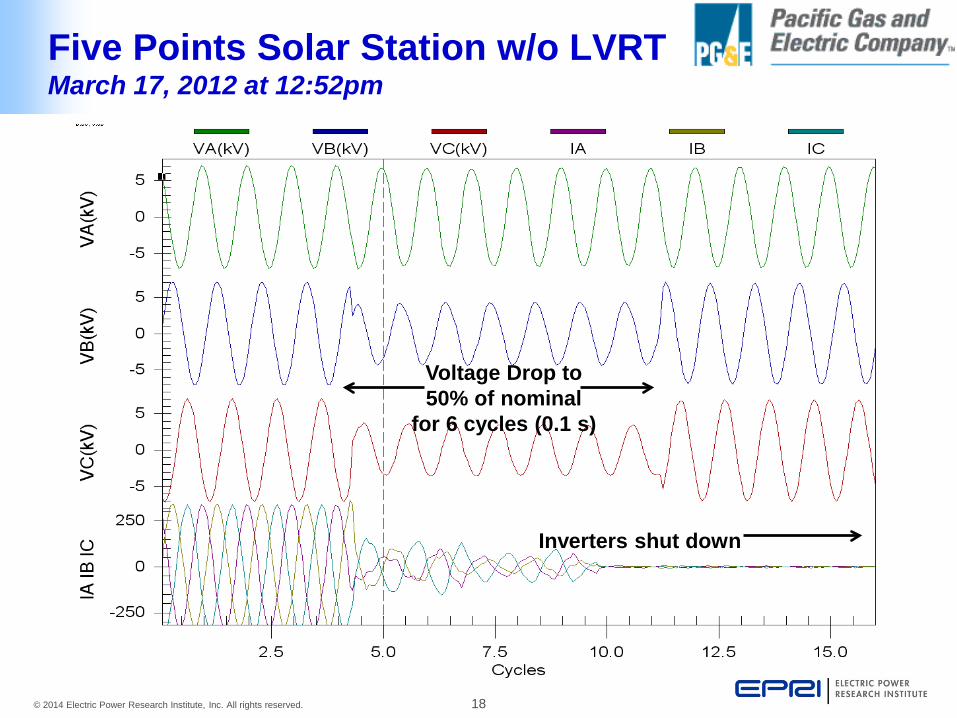
18 © 2014 Electric Power Research Institute, Inc. All rights reserved.
Inverters shut down
Voltage Drop to 50% of nominal
for 6 cycles (0.1 s)
Five Points Solar Station w/o LVRT March 17, 2012 at 12:52pm

19© 2014 Electric Power Research Institute, Inc. All rights reserved.
Loss of 250 MW generation
for a normal 230 kV line fault?
Transmission Line Fault
March 31, 2014
Distribution Feeder Impacts and Inverter Support Benefits

21© 2014 Electric Power Research Institute, Inc. All rights reserved.
Distribution System Impacts
Voltage• Overvoltage• Voltage variations
Equipment Operation• Feeder regulators• Load tap changers• Switched capacitor banks
Demand• “Masking” peak demand• Reducing power factor
System Protection• Relay desensitization• Unintentional islanding
Power Quality• Harmonics
0.0
0.1
0.2
0.3
0.4
0.5
0.6
0.7
0.8
0.9
1.0
7 8 9 10 11 12 13 14 15 16 17 18 19
Pow
er (p
er-u
nit)
Hour

22© 2014 Electric Power Research Institute, Inc. All rights reserved.
= Line Regulators= Substation
0.95
0.97
0.99
1.01
1.03
1.05
1.07
1.09
0 60 120 180 240 300 360 420 480 540
Volta
ge (p
u)
Time (sec)
0.95
0.97
0.99
1.01
1.03
1.05
1.07
1.09
0 60 120 180 240 300 360 420 480 540
Volta
ge (p
u)
Time (sec)
Why are Smart Inverters Important?Smart Inverters Mitigating Voltage Issues
22
Voltage at END of feeder
No Control Volt/Var Control
360 420 480 540
*Simulated in OpenDSS

23© 2014 Electric Power Research Institute, Inc. All rights reserved.
Use of Smart Inverters for Accommodating Large Number of Distributed PV Systems
Solar Rooftop PVSolar Rooftop PV
With volt/var control
Baseline – No PV
20% PV20% PV withvolt/var control
Customer Load Customer PV
VARs
Gen
erat
ed
Capacitive
Inductive
System Voltage
V1 V2 V3 V4
Q1
Q4
Q3 Q2
Volt-Var Control
24 Hour Simulation
Source: J. Smith, T. Key “High-Penetration PV Impact Analysis on Distribution Systems,” Solar Power International, Oct 2011
Initial analysis indicated 25%-100% more PV can be accommodated using
Volt/var control

24© 2014 Electric Power Research Institute, Inc. All rights reserved.
Smart Inverters for Increasing Hosting Capacity of Distributed PV
PV at Unity Power Factor PV with Volt/var Control
2500 cases shownEach point = highest primary voltage
ANSI voltage limit
ANSI voltage limit
PV with Volt/var Control
ANSI voltage limitANSI voltage limitANSI voltage limit
Increasing penetration (kW)
Max
imum
Fee
der V
olta
ge (p
u)
PV at Unity Power Factor
2500 cases shown2500 cases shown2500 cases shown2500 cases shownEach point = highest primary voltageEach point = highest primary voltageEach point = highest primary voltageEach point = highest primary voltageEach point = highest primary voltageEach point = highest primary voltage
ANSI voltage limit
Max
imum
Fee
der V
olta
ges
(pu)
Increasing penetration (kW)
No observable violations regardless of PV size/location
Possible violations based upon PV size/location
Observable violations occur regardless of size/location
For voltage-constrained feeders, results indicate use of smart inverters can increase feeder hosting capacity for PV
Minimum Hosting CapacityMaximum Hosting Capacity
Minimum Hosting CapacityMax Hosting Capacity
Increasing penetration (kW) Increasing penetration (kW)

March 31, 2014
Cost Considerations for Advanced Inverter Functionality
26 © 2014 Electric Power Research Institute, Inc. All rights reserved.
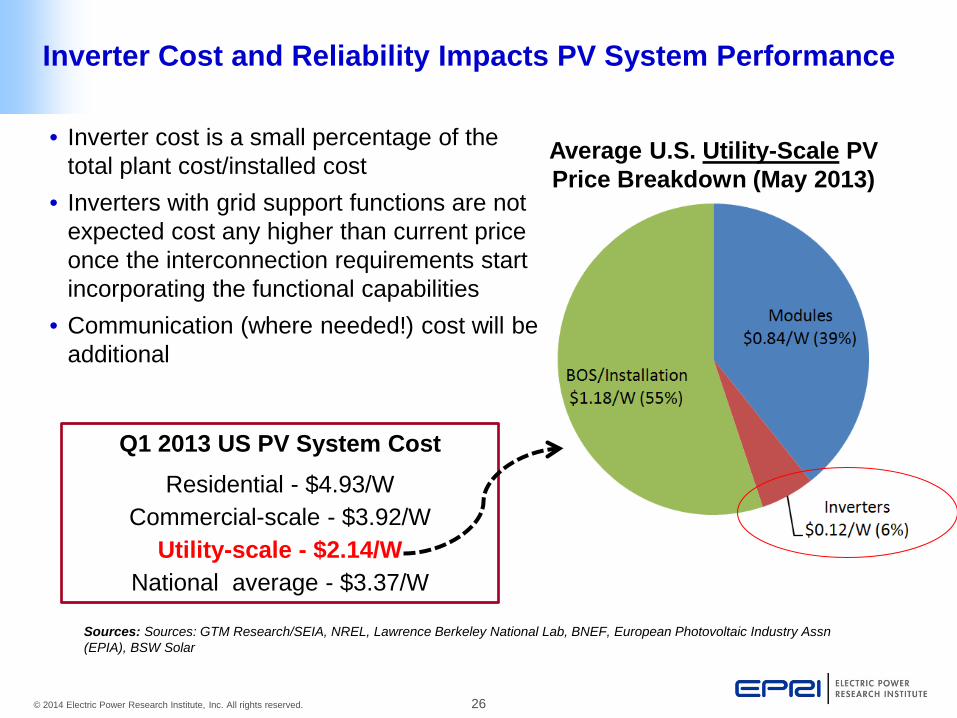
Inverter Cost and Reliability Impacts PV System Performance
• Inverter cost is a small percentage of the total plant cost/installed cost
• Inverters with grid support functions are not expected cost any higher than current price once the interconnection requirements start incorporating the functional capabilities
• Communication (where needed!) cost will be additional
Average U.S. Utility-Scale PV Price Breakdown (May 2013)
Q1 2013 US PV System Cost Residential - $4.93/W
Commercial-scale - $3.92/W Utility-scale - $2.14/W
National average - $3.37/W
Sources: Sources: GTM Research/SEIA, NREL, Lawrence Berkeley National Lab, BNEF, European Photovoltaic Industry Assn (EPIA), BSW Solar

27 © 2014 Electric Power Research Institute, Inc. All rights reserved.
0
5000
10000
15000
20000
25000
30000
35000
Inst
alle
d PV
Cap
acity
(MW
p) in
Ger
man
y
Year
German Experience of High Penetration of PV
Bright, breezy Sunday between 2pm to 3pm
Grid at that time could take up to 45GW
PV and wind supplied 28.9 GW – more than half the
total!
Solar Wind
Conventional >100MW

28© 2014 Electric Power Research Institute, Inc. All rights reserved.
0
25
50
75
100
125
150
175
200
225
2005 2010 2015 2020 2025 2030Inst
alle
d PV
Cap
acity
(GW
) in
USA
Years
What if Standards are not Changed?
Source: DOE SunShot Vision Study (Total PV Capacity in U.S. 2008 – 2030)
Retrofitting inverters in a later date could be pretty expensive
March 31, 2014
IEEE Standard 1547 Revision Apr 23-24 Meeting Overview
30 © 2014 Electric Power Research Institute, Inc. All rights reserved.
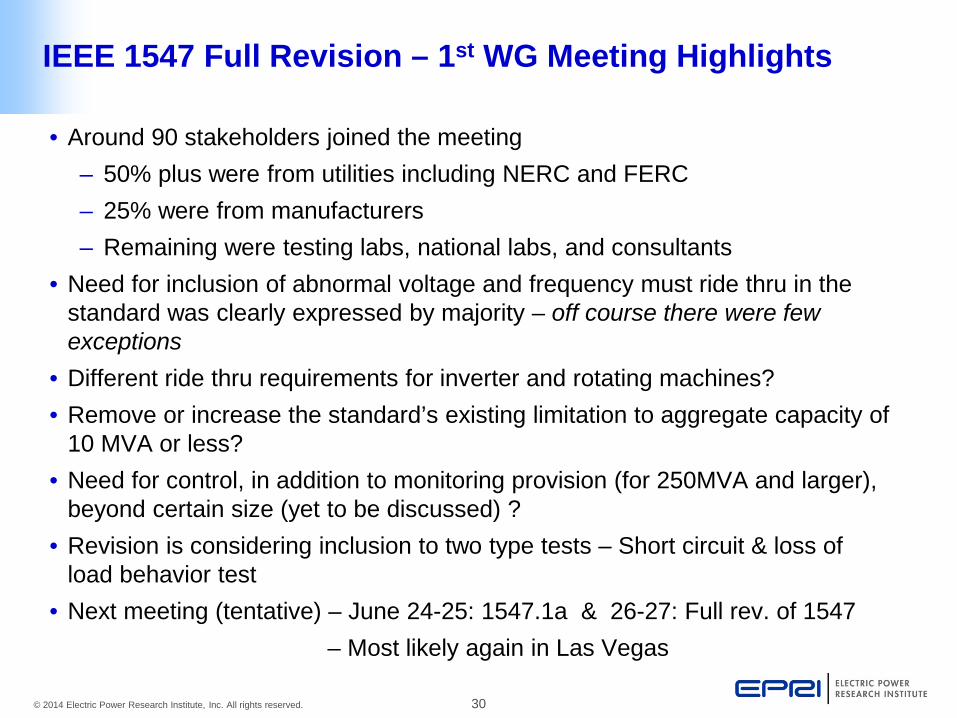
IEEE 1547 Full Revision – 1st WG Meeting Highlights
• Around 90 stakeholders joined the meeting – 50% plus were from utilities including NERC and FERC – 25% were from manufacturers – Remaining were testing labs, national labs, and consultants
• Need for inclusion of abnormal voltage and frequency must ride thru in the standard was clearly expressed by majority – off course there were few exceptions
• Different ride thru requirements for inverter and rotating machines? • Remove or increase the standard’s existing limitation to aggregate capacity of
10 MVA or less? • Need for control, in addition to monitoring provision (for 250MVA and larger),
beyond certain size (yet to be discussed) ? • Revision is considering inclusion to two type tests – Short circuit & loss of
load behavior test • Next meeting (tentative) – June 24-25: 1547.1a & 26-27: Full rev. of 1547 – Most likely again in Las Vegas
31 © 2014 Electric Power Research Institute, Inc. All rights reserved.
Together…Shaping the Future of Electricity