Embed Size (px)
Citation preview
Advanced imaging techniques to study brain development in
nutritional interventions
Stéphane V. Sizonenko, MD-PhD, PD Division of Development and Growth Department of Child and Adolescent School of Medicine and University Hospital Geneva, Switzerland [email protected]
Brain imaging and human nutrition: which measures to use in intervention studies?
Stéphane V. Sizonenko, Claudio Babiloni, Eveline A. de Bruin, Elizabeth B. Isaacs, Lena S. Jönsson, David O. Kennedy, Marie E. Latulippe, M. Hasan Mohajeri, Judith Moreines, Pietro Pietrini, Kristine B. Walhovd,
Robert J. Winwood and John W. Sijben
Vol. 110 Supplement No. 1 August 2013 British Journal of Nutrition • Magnetic Resonance Imaging (3D-MRI, DTI, MRS, fMRI) • Electroencephalography and magnetoencephalography • Near-IR spectroscopy • Positron emission tomography imaging • Single-photon emission computerised tomography imaging
Commissioned by the ILSI Europe Nutrition and Immunity Task Force
Magnetic Resonance imaging • Non invasive imaging technique usable in human and
animals • Can be repeated for longitudinal studies • Multimodal tool: structure, function and metabolism • Available in most secondary-tertiary hospitals • Expensive: imaging but also post-processing • Not usable
• without patient cooperation • on patient with magnetic sensitive material or device
• Possible from birth to 2-3 months during sleep after feeding • After 3 months until 5-6 years with training of the child
MRI as Imaging Biomarker: Visualization of development, injury,
plasticity in the human brain
Imaging biomarker: • Objective measuments of brain tissue caracteristics • Multimodal measurements • Indicator of a normal developmental process • Indicator of pathogenic process • Indicator of response to a therapeutic intervention
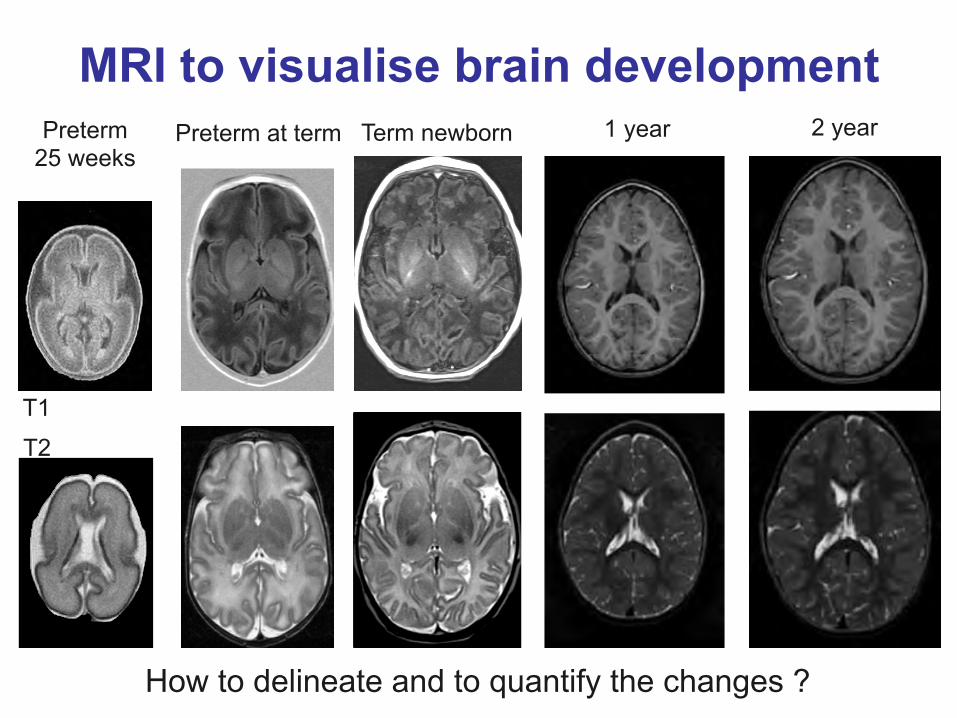
MRI to visualise brain development Preterm at term Term newborn
How to delineate and to quantify the changes ?
T1
T2
Preterm 25 weeks
1 year 2 year
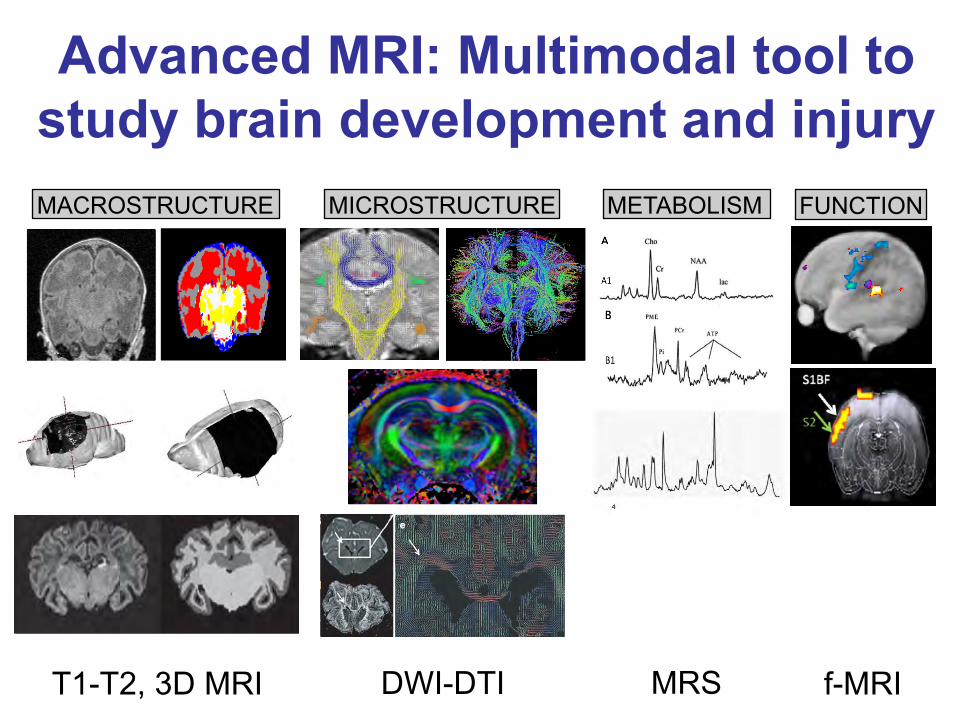
Advanced MRI: Multimodal tool to study brain development and injury MACROSTRUCTURE METABOLISM MICROSTRUCTURE
T1-T2, 3D MRI MRS DWI-DTI f-MRI
FUNCTION
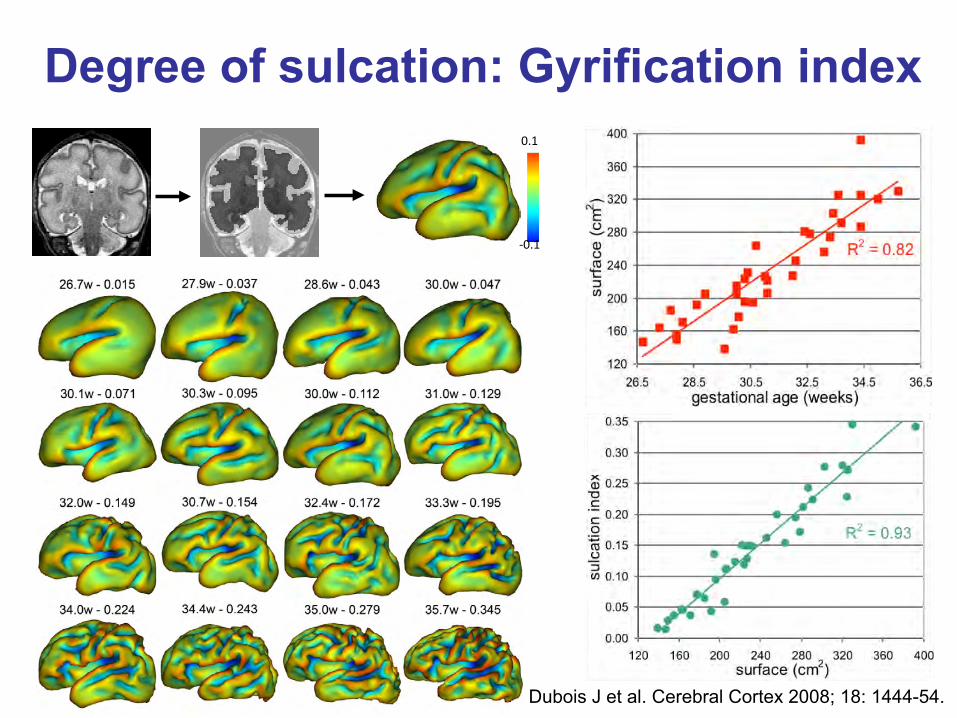
Dubois J et al. Cerebral Cortex 2008; 18: 1444-54.
-‐0.1
0.1
Degree of sulcation: Gyrification index
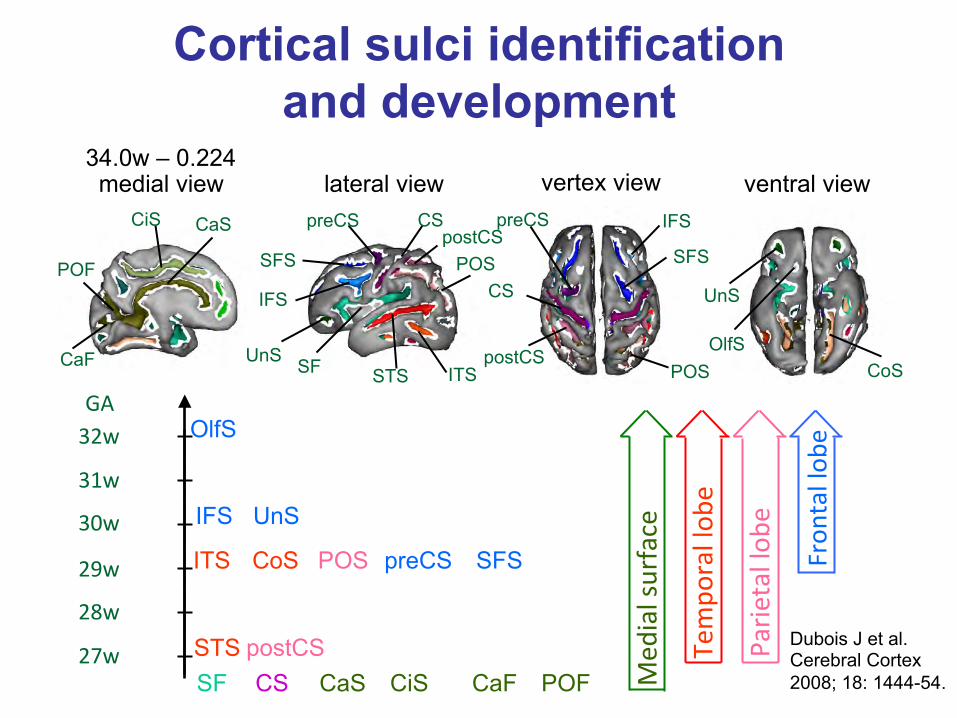
Cortical sulci identification and development
medial view lateral view vertex view ventral view 34.0w – 0.224
SF
POF
CiS CaS
CaF
CS
CS
postCS STS CoS
SFS
POS ITS
POS
preCS IFS
UnS
OlfS
preCS
SFS
IFS
UnS
GA
27w
28w
29w
30w
31w
32w
SF CaS CiS CaF POF CS
ITS
IFS
OlfS
STS
CoS
UnS
postCS
POS preCS SFS
postCS
Med
ial surface
Tempo
ral lob
e
Parie
tal lob
e
Fron
tal lob
e
Dubois J et al. Cerebral Cortex 2008; 18: 1444-54.
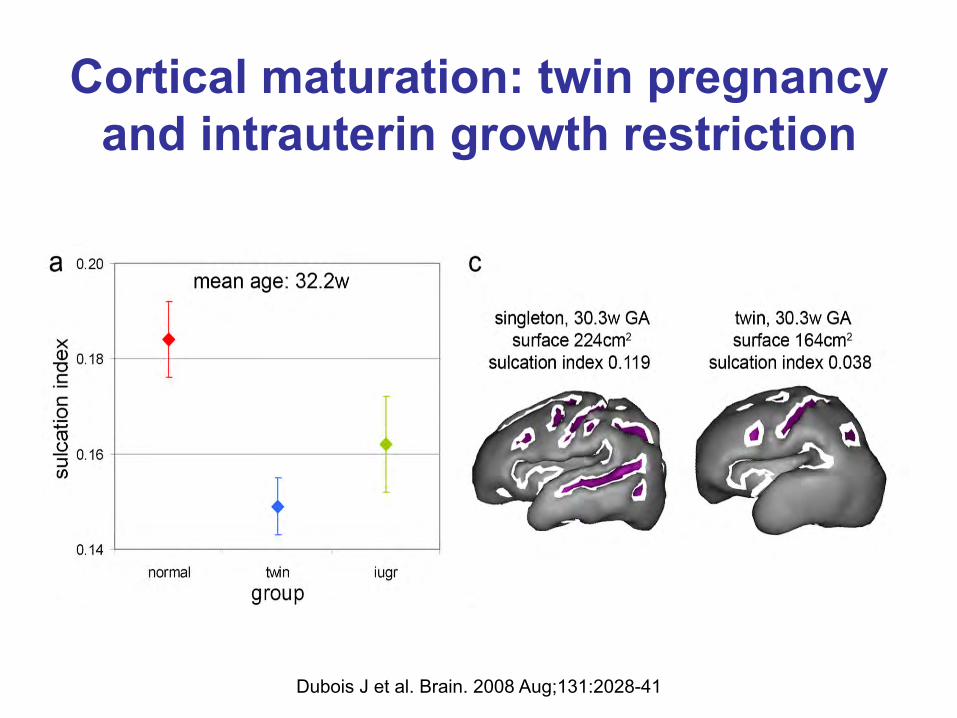
Cortical maturation: twin pregnancy and intrauterin growth restriction
Dubois J et al. Brain. 2008 Aug;131:2028-41
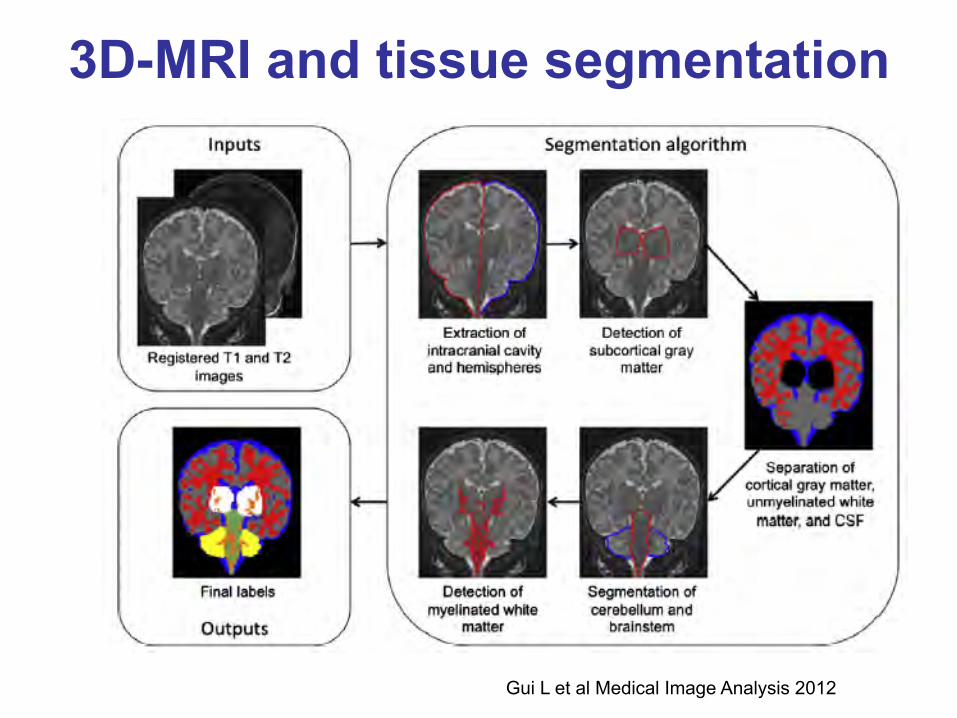
Gui L et al Medical Image Analysis 2012
3D-MRI and tissue segmentation
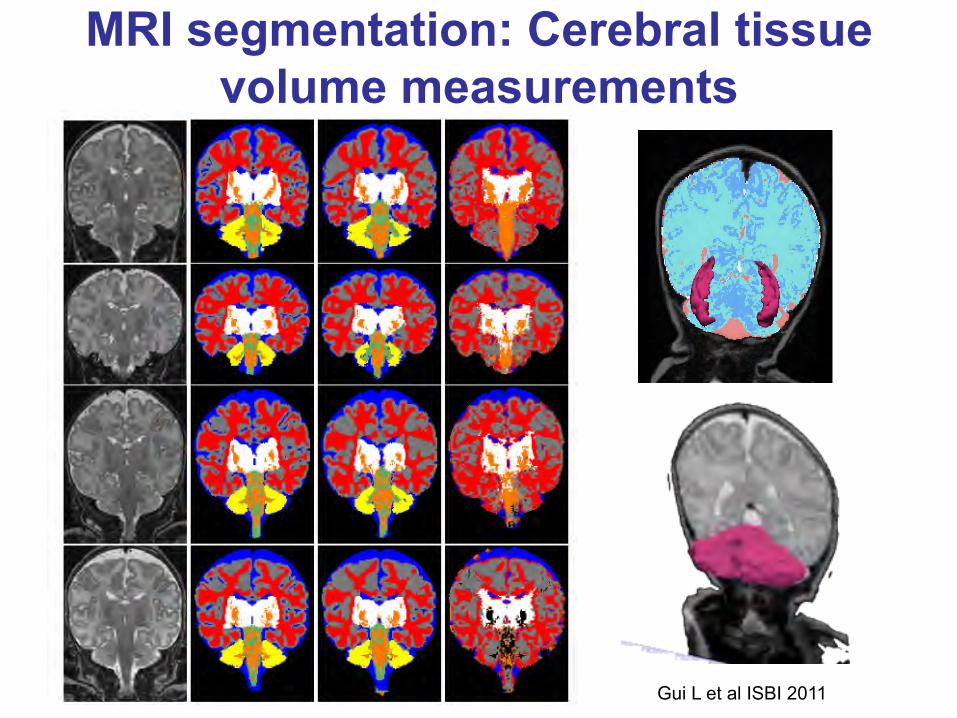
Gui L et al ISBI 2011
MRI segmentation: Cerebral tissue volume measurements
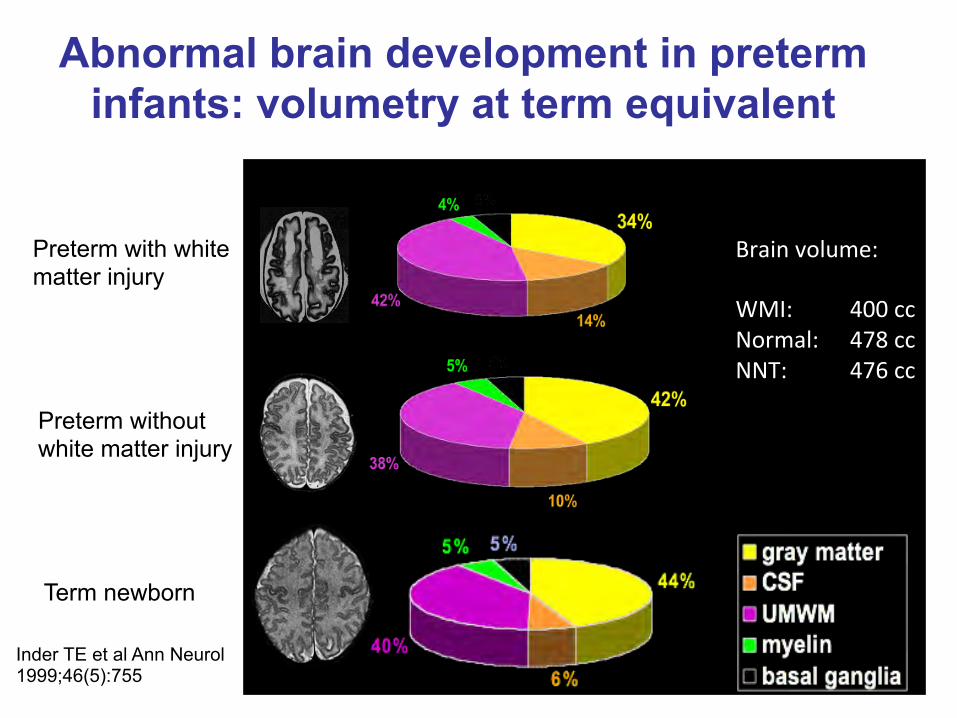
Term newborn
Preterm with white matter injury
Preterm without white matter injury
Brain volume: WMI: 400 cc Normal: 478 cc NNT: 476 cc
Inder TE et al Ann Neurol 1999;46(5):755
Abnormal brain development in preterm infants: volumetry at term equivalent
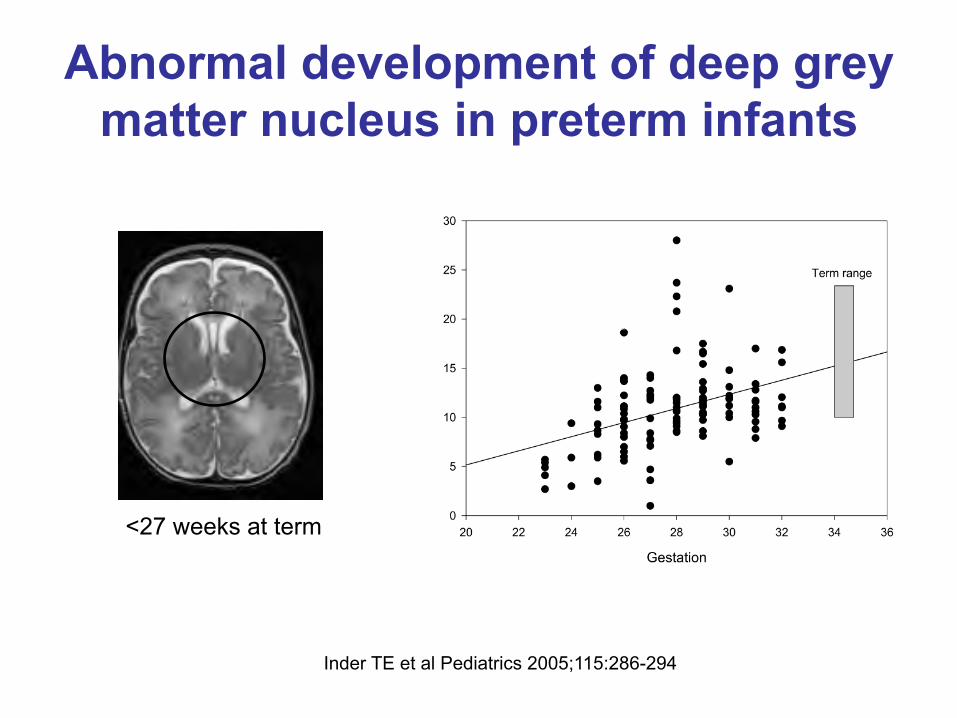
Inder TE et al Pediatrics 2005;115:286-294
<27 weeks at term
Abnormal development of deep grey matter nucleus in preterm infants
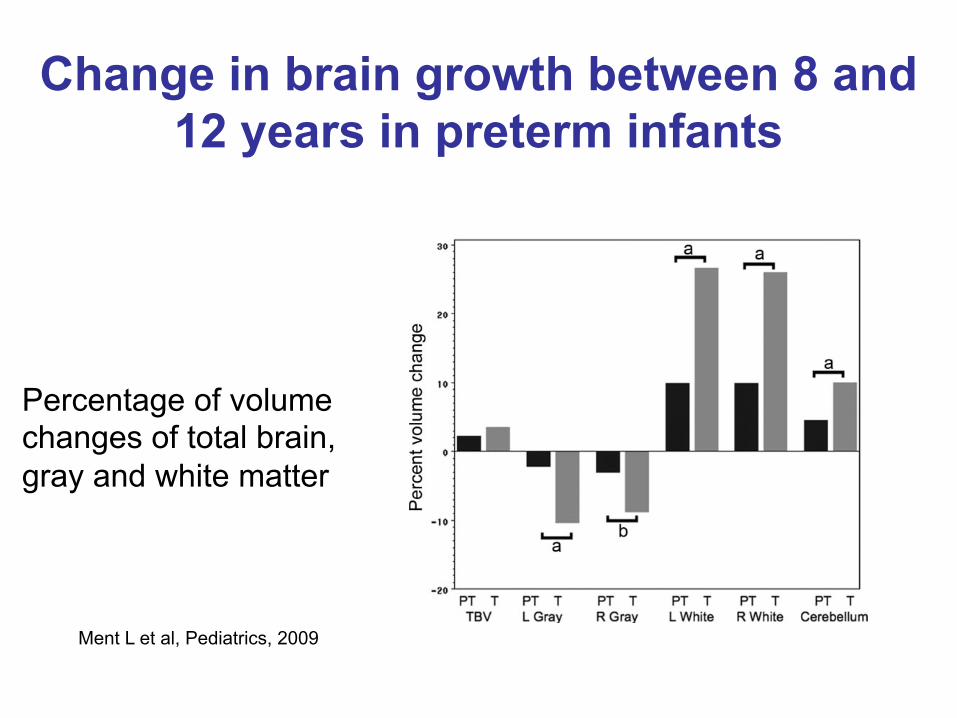
Ment L et al, Pediatrics, 2009
Change in brain growth between 8 and 12 years in preterm infants
Percentage of volume changes of total brain, gray and white matter
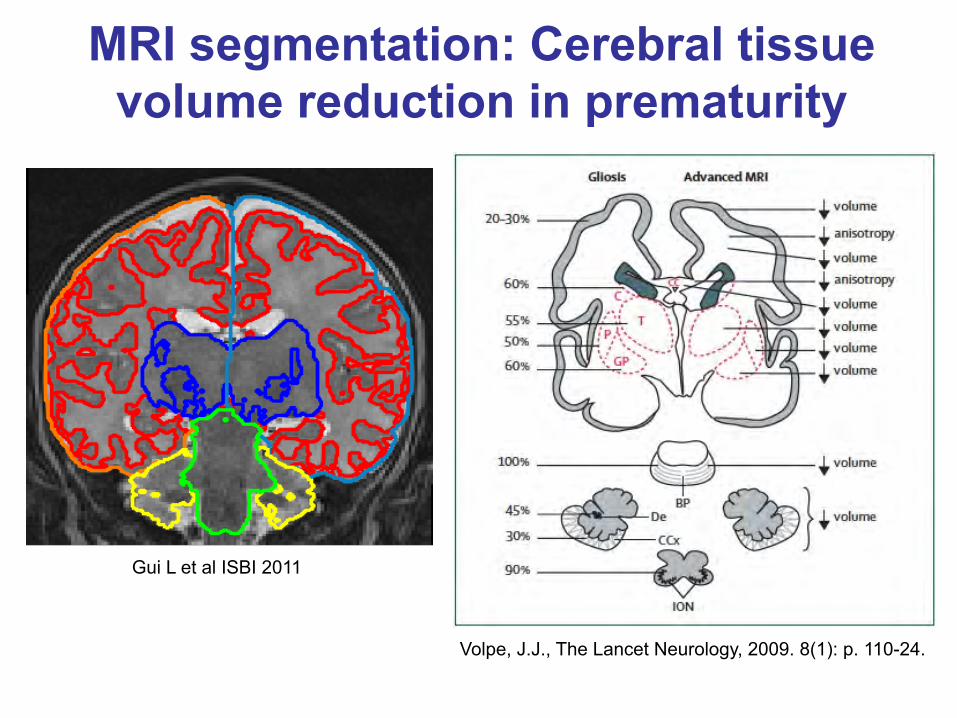
Volpe, J.J., The Lancet Neurology, 2009. 8(1): p. 110-24.
Gui L et al ISBI 2011
MRI segmentation: Cerebral tissue volume reduction in prematurity
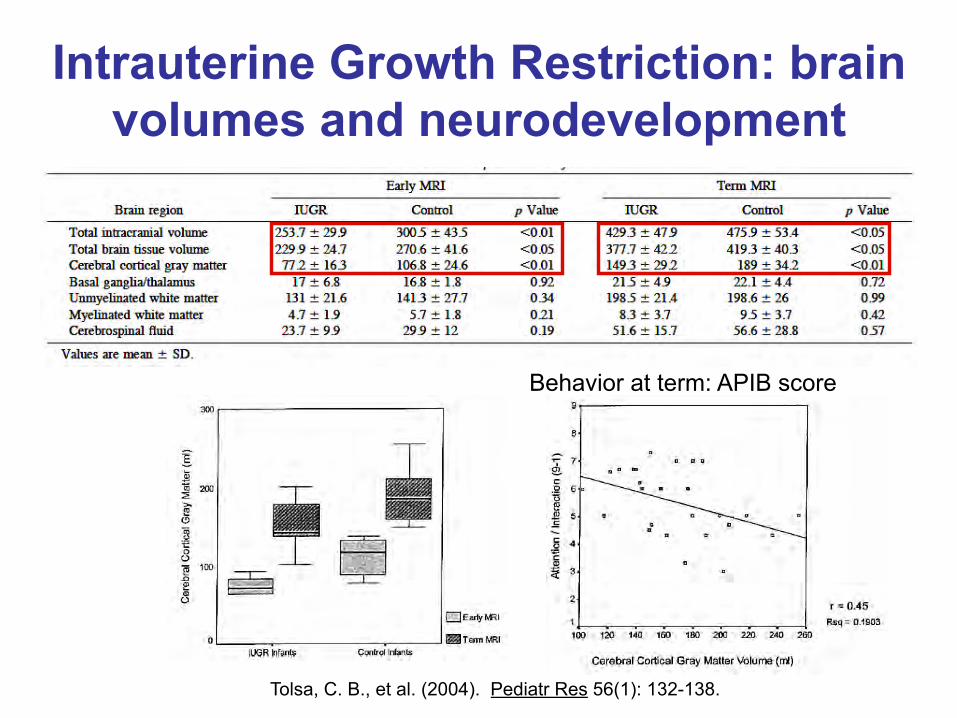
Intrauterine Growth Restriction: brain volumes and neurodevelopment
Tolsa, C. B., et al. (2004). Pediatr Res 56(1): 132-138.
Behavior at term: APIB score
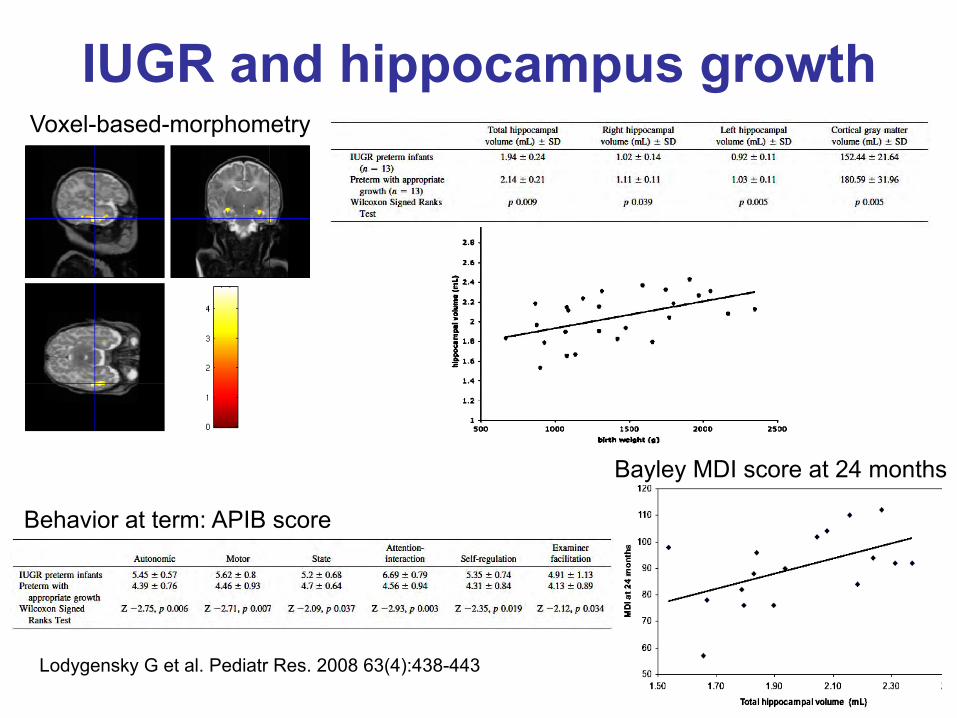
Voxel-based-morphometry
IUGR and hippocampus growth
Lodygensky G et al. Pediatr Res. 2008 63(4):438-443
Behavior at term: APIB score
Bayley MDI score at 24 months
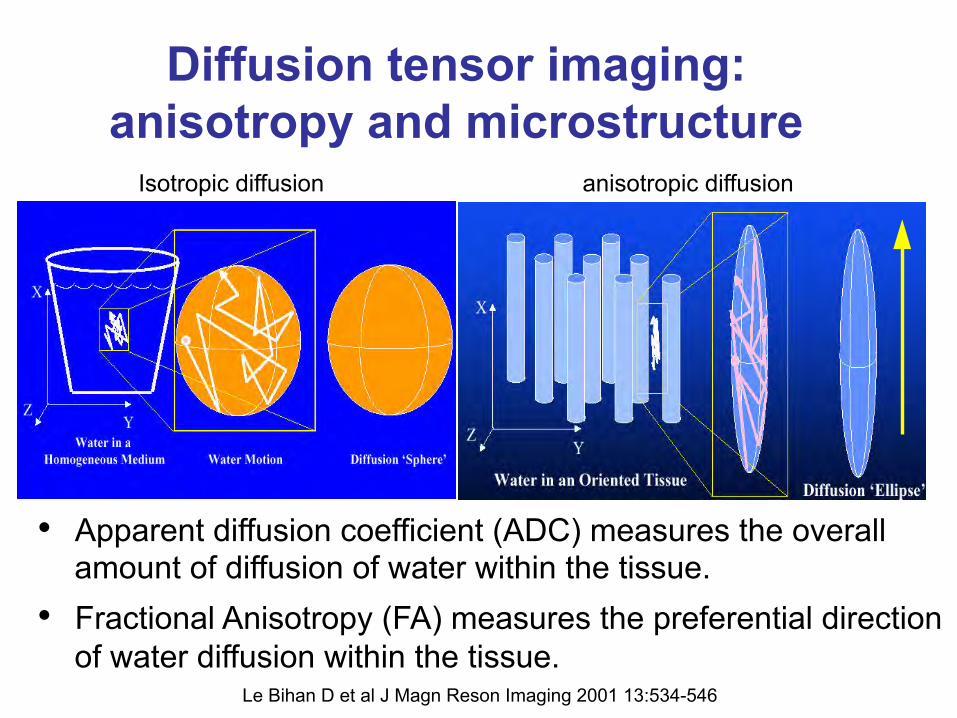
Le Bihan D et al J Magn Reson Imaging 2001 13:534-546
Diffusion tensor imaging: anisotropy and microstructure
• Apparent diffusion coefficient (ADC) measures the overall amount of diffusion of water within the tissue.
• Fractional Anisotropy (FA) measures the preferential direction of water diffusion within the tissue.
Isotropic diffusion anisotropic diffusion
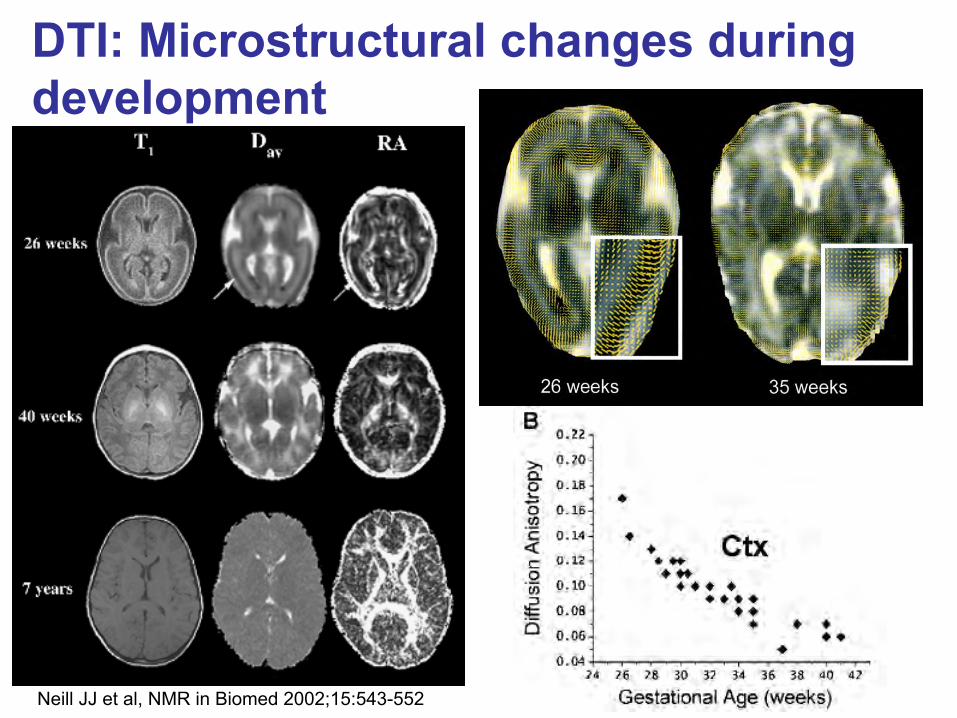
DTI: Microstructural changes during development
Neill JJ et al, NMR in Biomed 2002;15:543-552
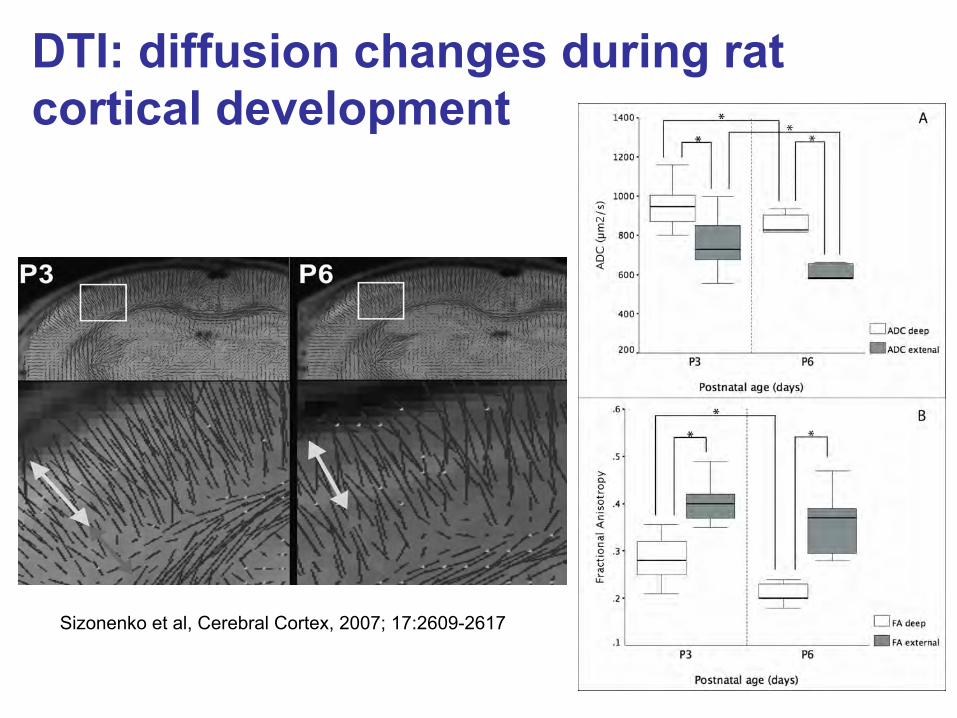
DTI: diffusion changes during rat cortical development
Sizonenko et al, Cerebral Cortex, 2007; 17:2609-2617
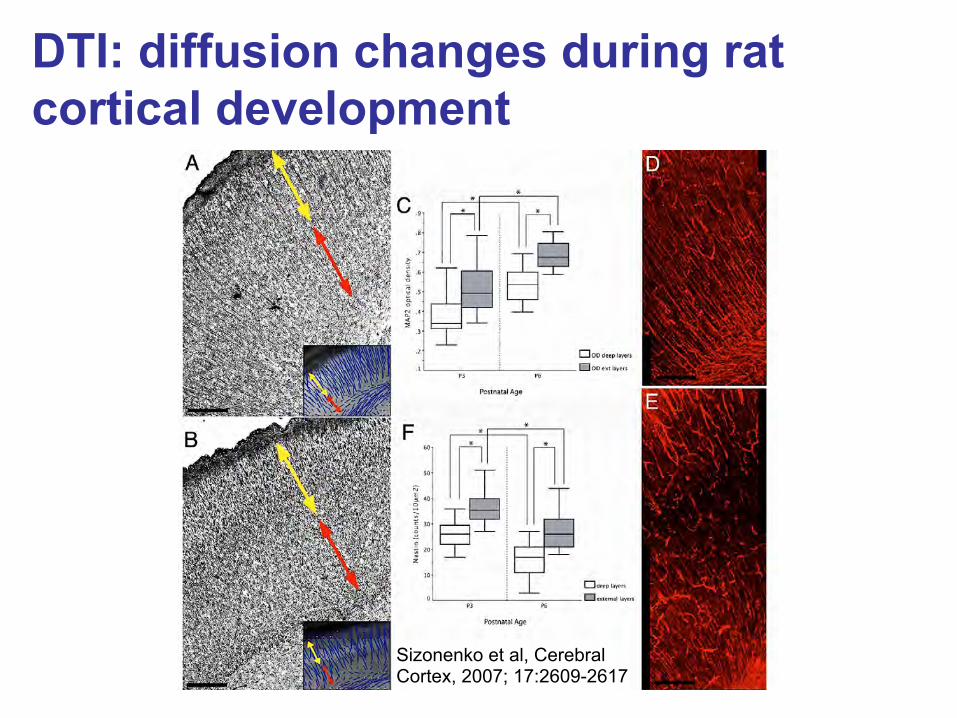
Sizonenko et al, Cerebral Cortex, 2007; 17:2609-2617
DTI: diffusion changes during rat cortical development
0
0.5
1
1.5
2
2.5
3
3.5
4
26 28 30 32 34 36 38 40 42
PT and FT PT at Term0
0.5
1
1.5
2
2.5
26 28 30 32 34 36 38 40 42
PT and FT PT at Term
ADC
PCA (weeks)
RA
PCA (weeks)
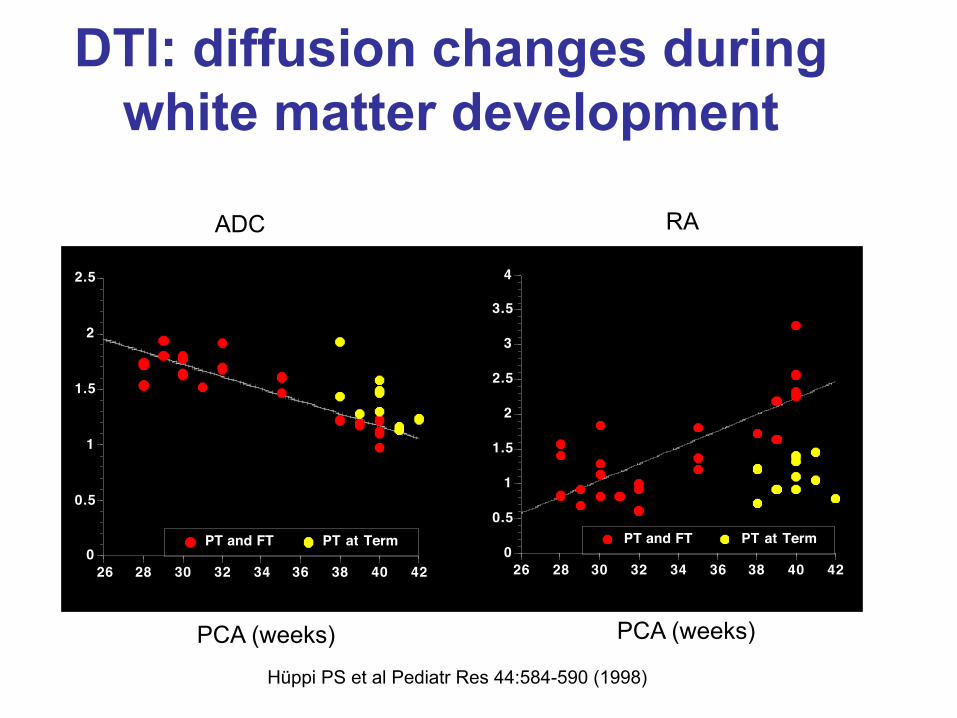
Hüppi PS et al Pediatr Res 44:584-590 (1998)
DTI: diffusion changes during white matter development
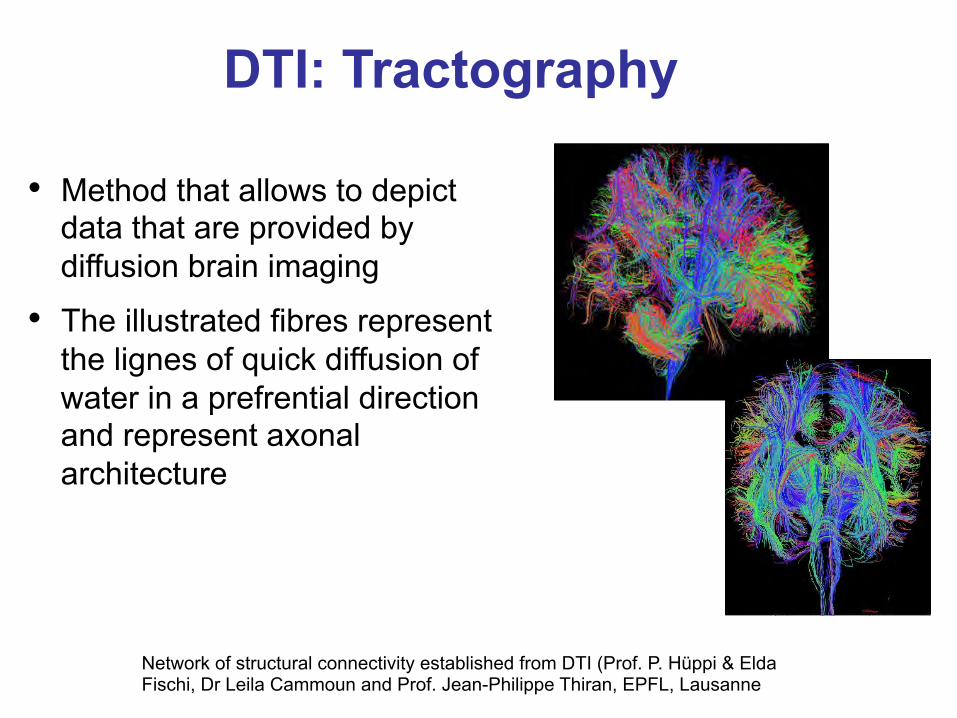
• Method that allows to depict data that are provided by diffusion brain imaging
• The illustrated fibres represent the lignes of quick diffusion of water in a prefrential direction and represent axonal architecture
Network of structural connectivity established from DTI (Prof. P. Hüppi & Elda Fischi, Dr Leila Cammoun and Prof. Jean-Philippe Thiran, EPFL, Lausanne
DTI: Tractography
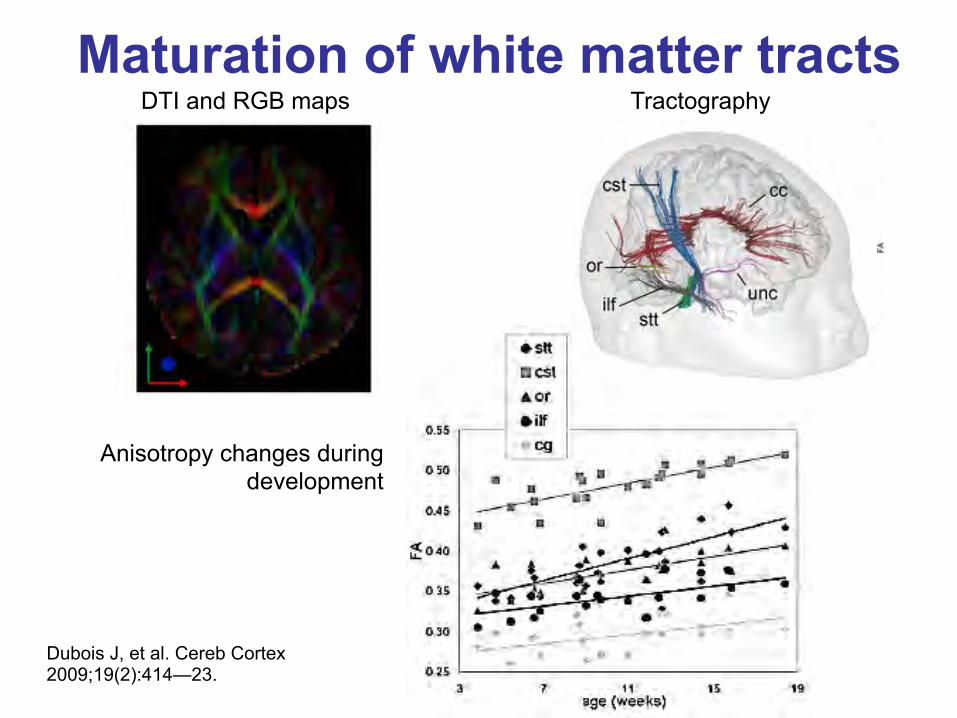
Maturation of white matter tracts
Dubois J, et al. Cereb Cortex 2009;19(2):414—23.
DTI and RGB maps Tractography
Anisotropy changes during development
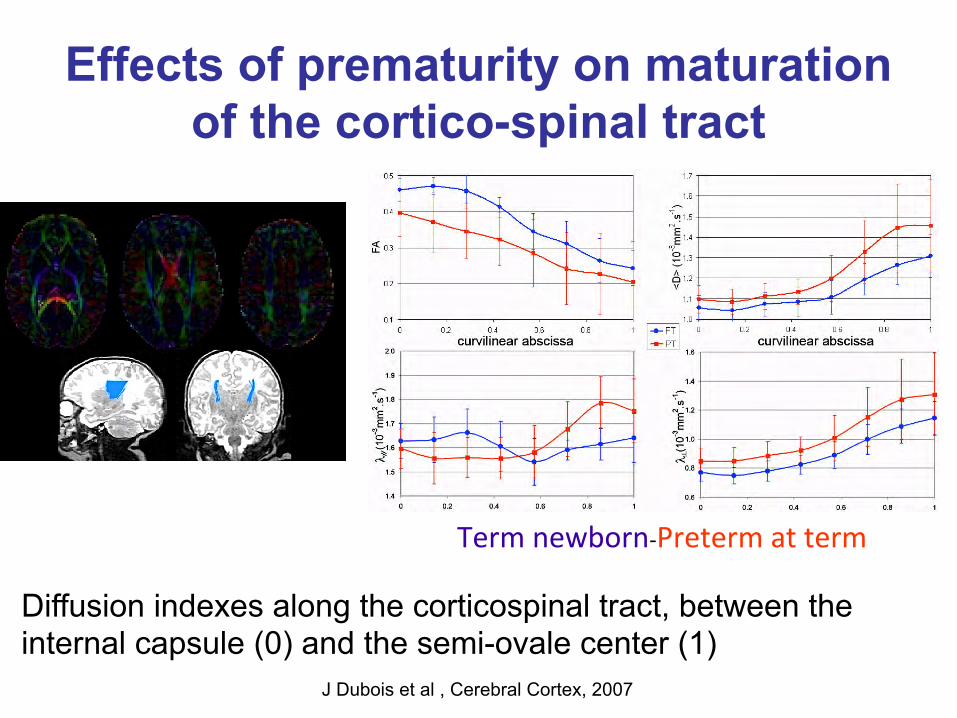
Effects of prematurity on maturation of the cortico-spinal tract
Diffusion indexes along the corticospinal tract, between the internal capsule (0) and the semi-ovale center (1)
Term newborn-‐Preterm at term
J Dubois et al , Cerebral Cortex, 2007
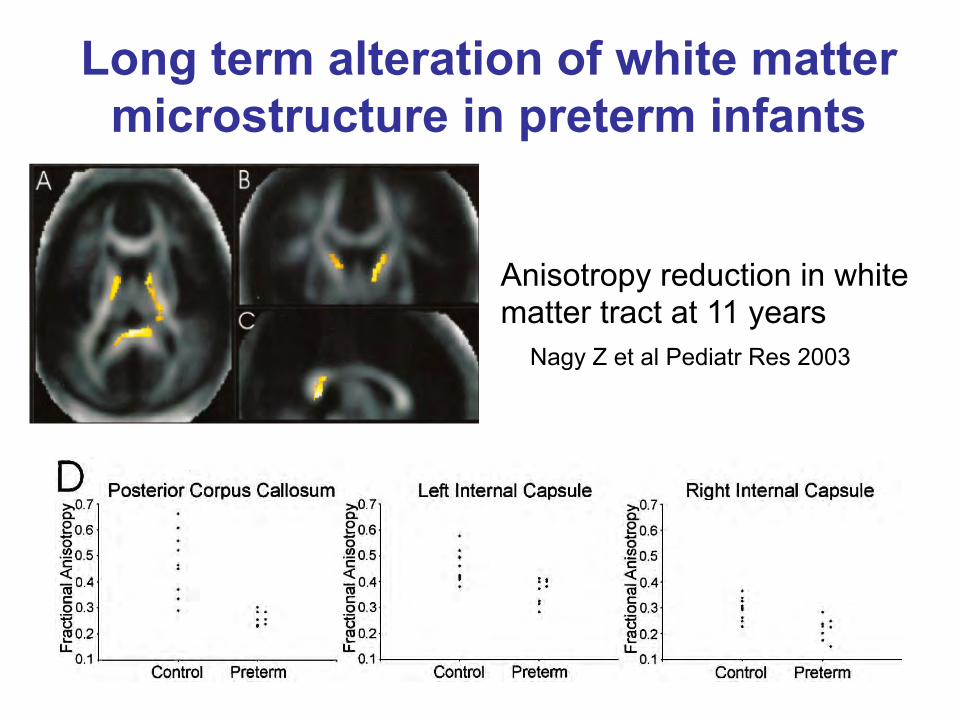
Nagy Z et al Pediatr Res 2003
Anisotropy reduction in white matter tract at 11 years
Long term alteration of white matter microstructure in preterm infants
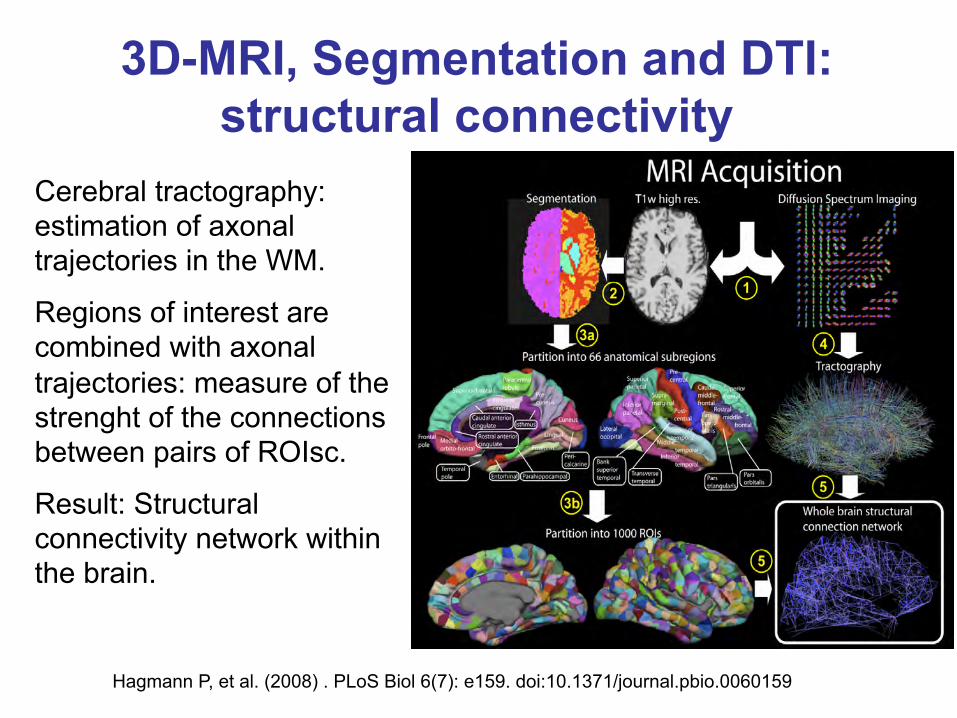
Cerebral tractography: estimation of axonal trajectories in the WM.
Regions of interest are combined with axonal trajectories: measure of the strenght of the connections between pairs of ROIsc.
Result: Structural connectivity network within the brain.
Hagmann P, et al. (2008) . PLoS Biol 6(7): e159. doi:10.1371/journal.pbio.0060159
3D-MRI, Segmentation and DTI: structural connectivity
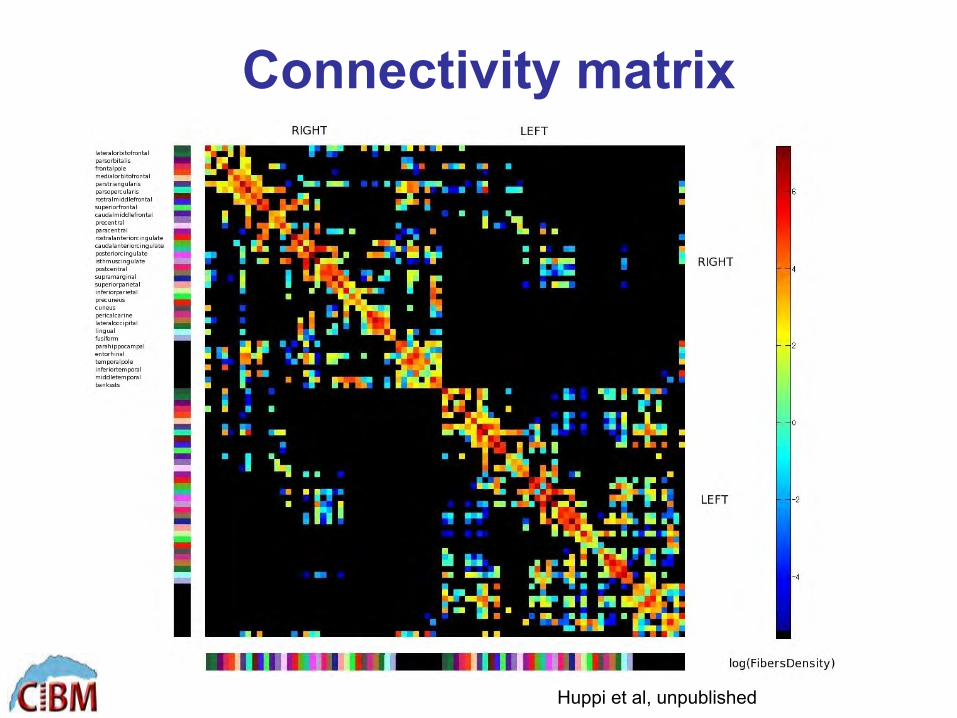
Connectivity matrix
Huppi et al, unpublished
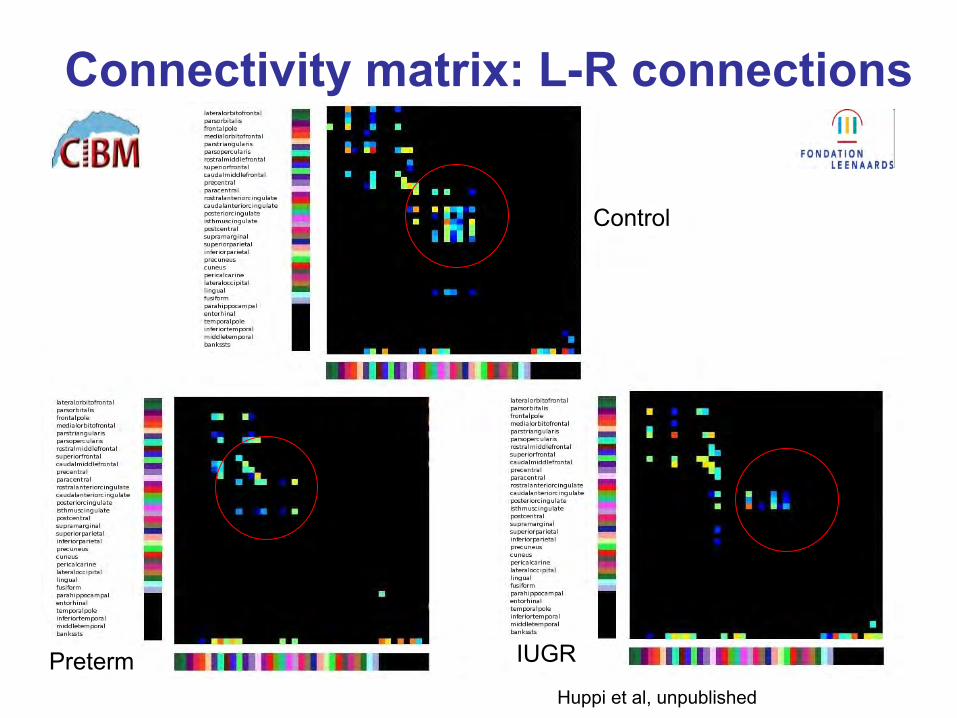
Connectivity matrix: L-R connections
Control
Huppi et al, unpublished
Preterm IUGR
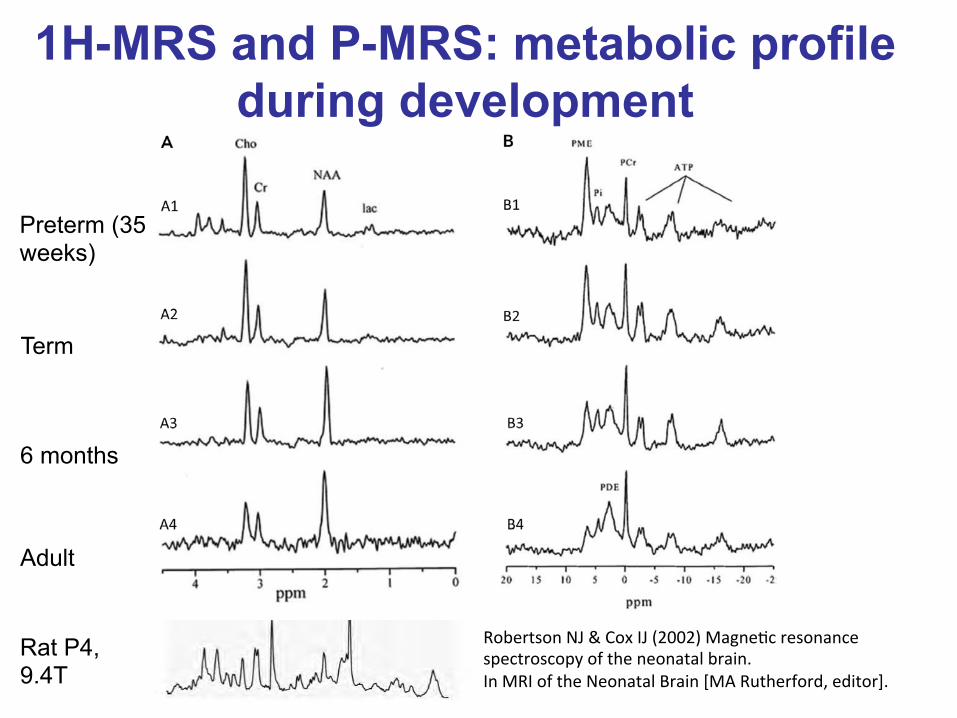
Robertson NJ & Cox IJ (2002) MagneRc resonance spectroscopy of the neonatal brain. In MRI of the Neonatal Brain [MA Rutherford, editor].
Preterm (35 weeks)
Term
6 months
Adult
1H-MRS and P-MRS: metabolic profile during development
Rat P4, 9.4T
Kreis R et al Magn. Reson. Med. 30, 424-437 (1993) Hüppi PS et al Pediatr Res 37, 145-150 (1995) Cady EB et al Magn. Reson. Med. 36, 878-886 (1996)
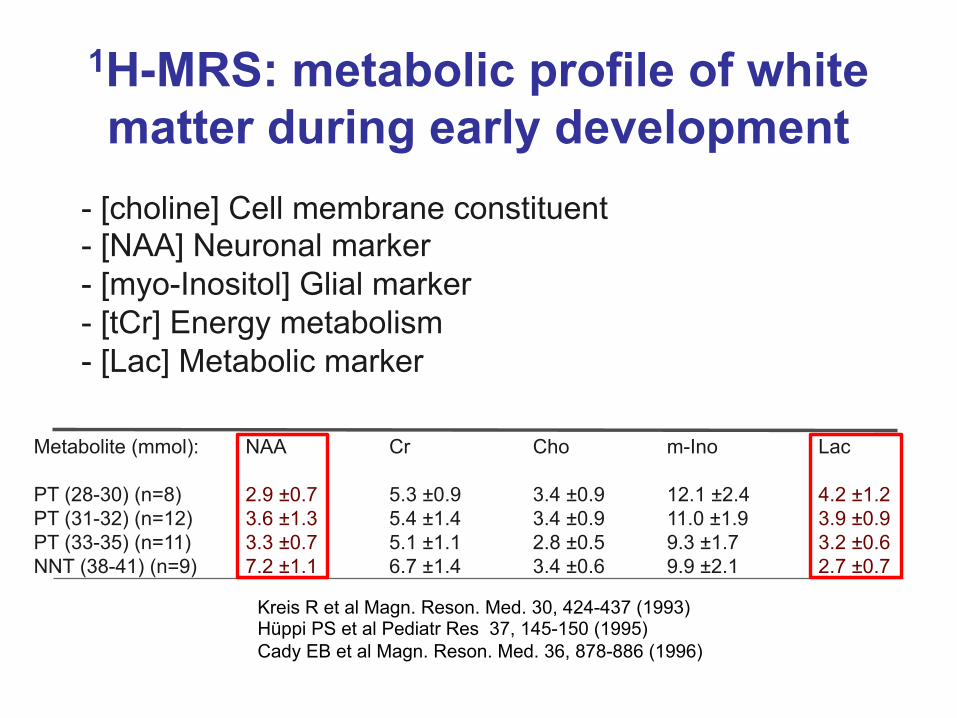
Metabolite (mmol): NAA Cr Cho m-Ino Lac
PT (28-30) (n=8) 2.9 ±0.7 5.3 ±0.9 3.4 ±0.9 12.1 ±2.4 4.2 ±1.2 PT (31-32) (n=12) 3.6 ±1.3 5.4 ±1.4 3.4 ±0.9 11.0 ±1.9 3.9 ±0.9 PT (33-35) (n=11) 3.3 ±0.7 5.1 ±1.1 2.8 ±0.5 9.3 ±1.7 3.2 ±0.6 NNT (38-41) (n=9) 7.2 ±1.1 6.7 ±1.4 3.4 ±0.6 9.9 ±2.1 2.7 ±0.7
1H-MRS: metabolic profile of white matter during early development
- [choline] Cell membrane constituent - [NAA] Neuronal marker - [myo-Inositol] Glial marker - [tCr] Energy metabolism - [Lac] Metabolic marker
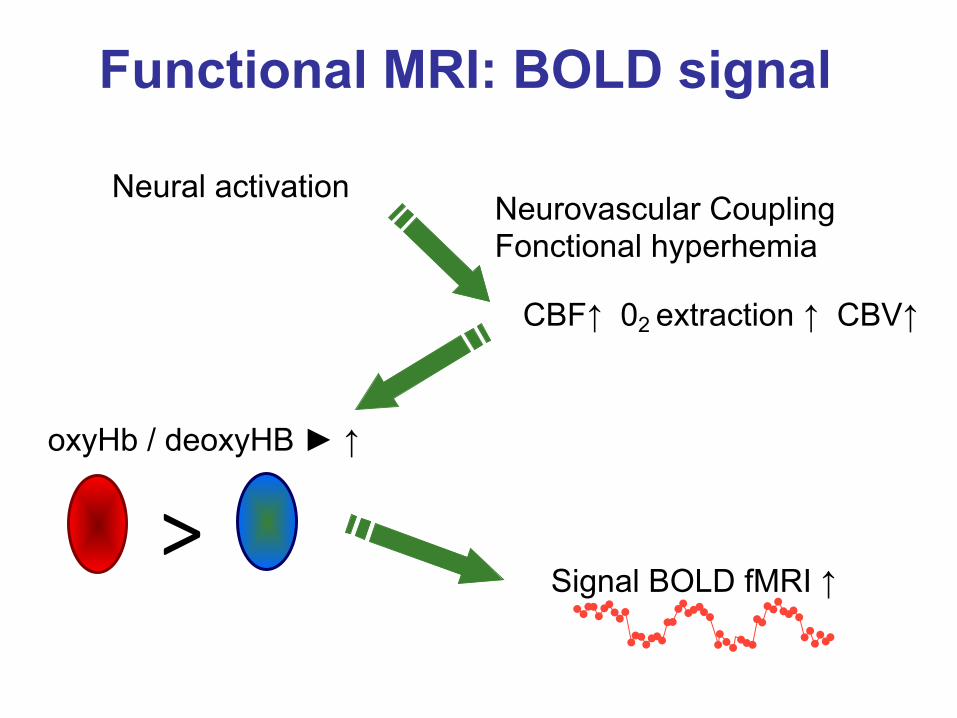
Neurovascular Coupling Fonctional hyperhemia
Neural activation
CBF↑ 02 extraction ↑ CBV↑
oxyHb / deoxyHB ► ↑
> Signal BOLD fMRI ↑
Functional MRI: BOLD signal
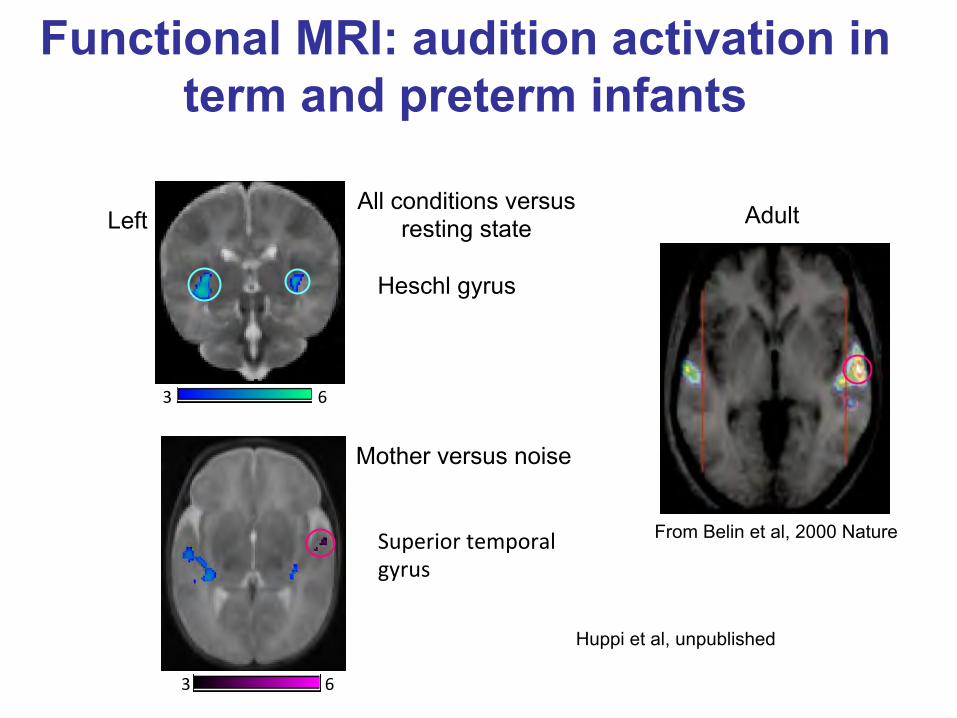
From Belin et al, 2000 Nature
All conditions versus resting state
6 3
Left
Heschl gyrus
6 3
Mother versus noise
Superior temporal gyrus
Functional MRI: audition activation in term and preterm infants
Adult
Huppi et al, unpublished
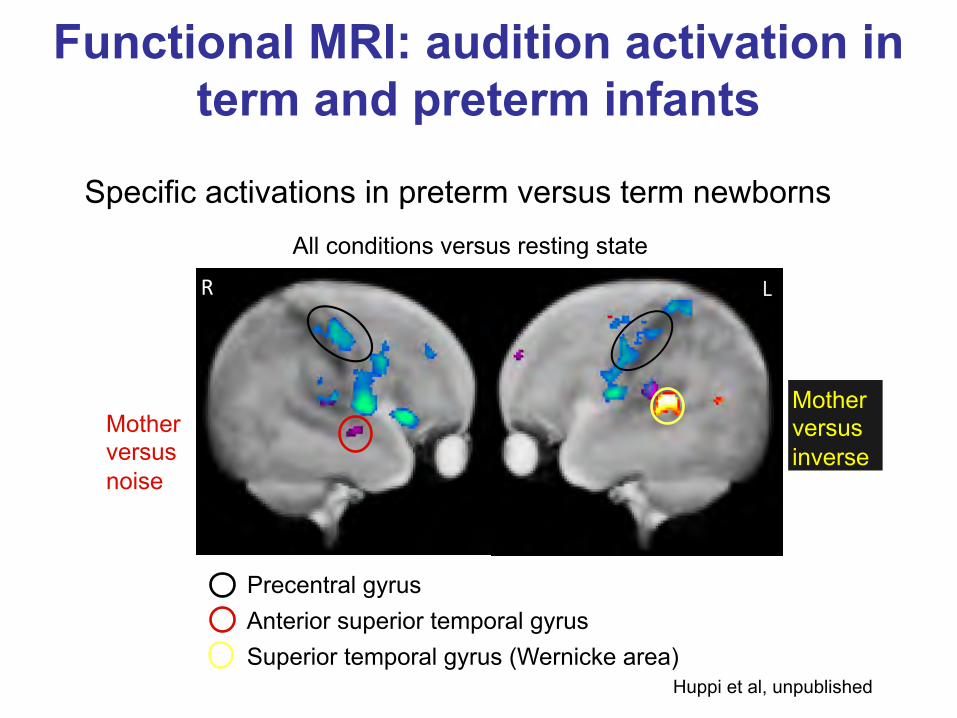
Specific activations in preterm versus term newborns
Precentral gyrus Anterior superior temporal gyrus Superior temporal gyrus (Wernicke area)
L R
Mother versus noise
Mother versus inverse
Functional MRI: audition activation in term and preterm infants
All conditions versus resting state
Huppi et al, unpublished
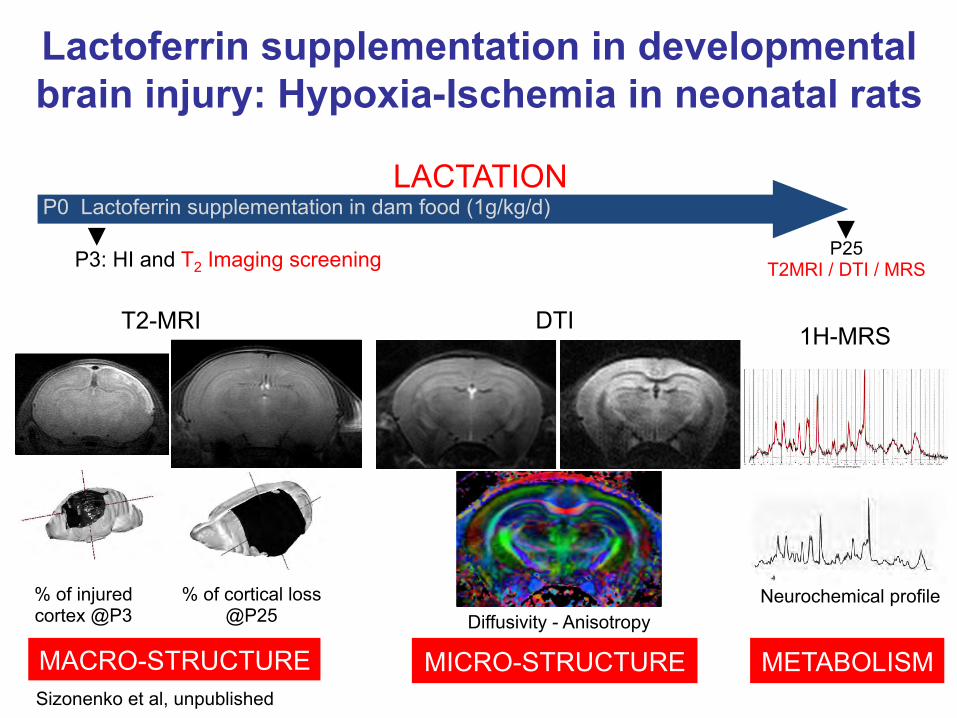
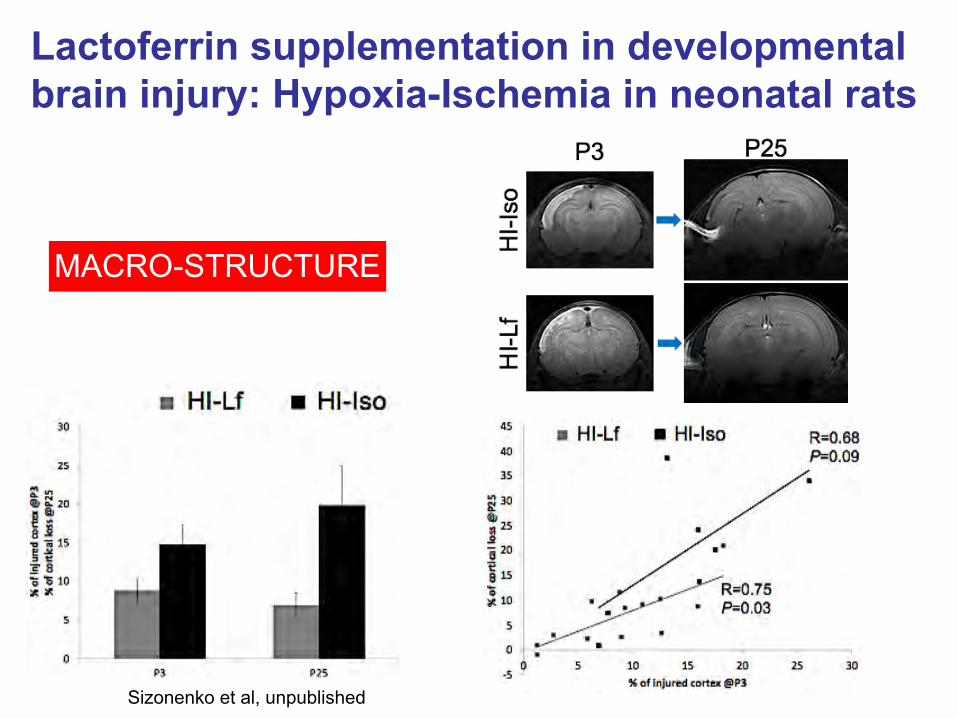
% of cortical loss @P25
% of injured cortex @P3
MACRO-STRUCTURE
Neurochemical profile
METABOLISM MICRO-STRUCTURE Diffusivity - Anisotropy
T2-MRI 1H-MRS DTI
Lactoferrin supplementation in developmental brain injury: Hypoxia-Ischemia in neonatal rats
P3: HI and T2 Imaging screening P25 T2MRI / DTI / MRS
P0 Lactoferrin supplementation in dam food (1g/kg/d) LACTATION
Sizonenko et al, unpublished
MACRO-STRUCTURE
Lactoferrin supplementation in developmental brain injury: Hypoxia-Ischemia in neonatal rats
Sizonenko et al, unpublished
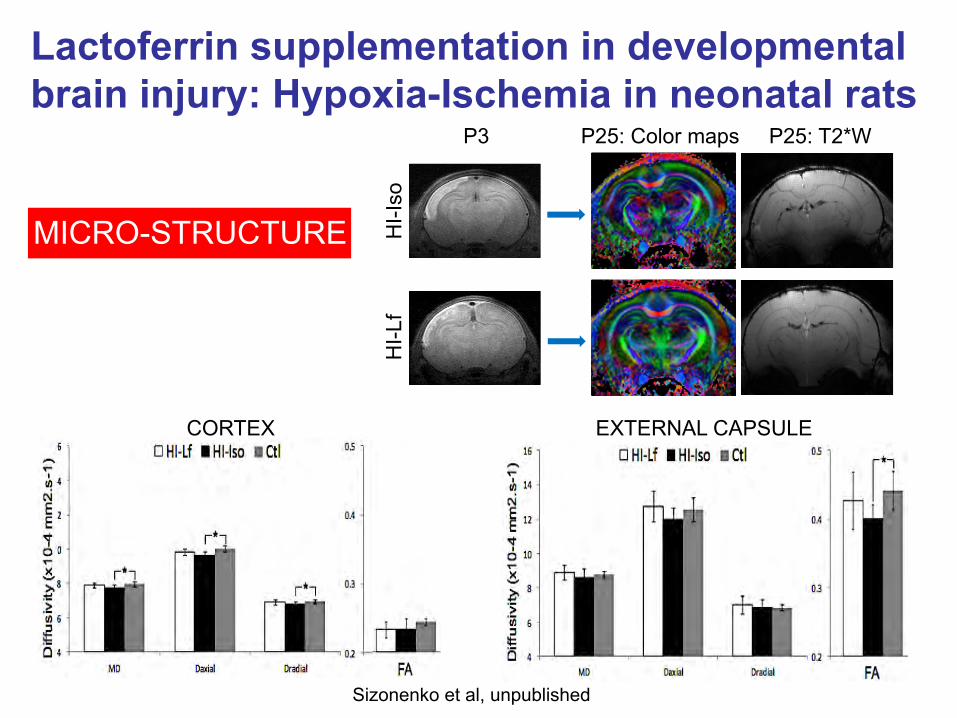
MICRO-STRUCTURE HI-I
so
HI-L
f
P3 P25: T2*W P25: Color maps
CORTEX EXTERNAL CAPSULE
Lactoferrin supplementation in developmental brain injury: Hypoxia-Ischemia in neonatal rats
Sizonenko et al, unpublished
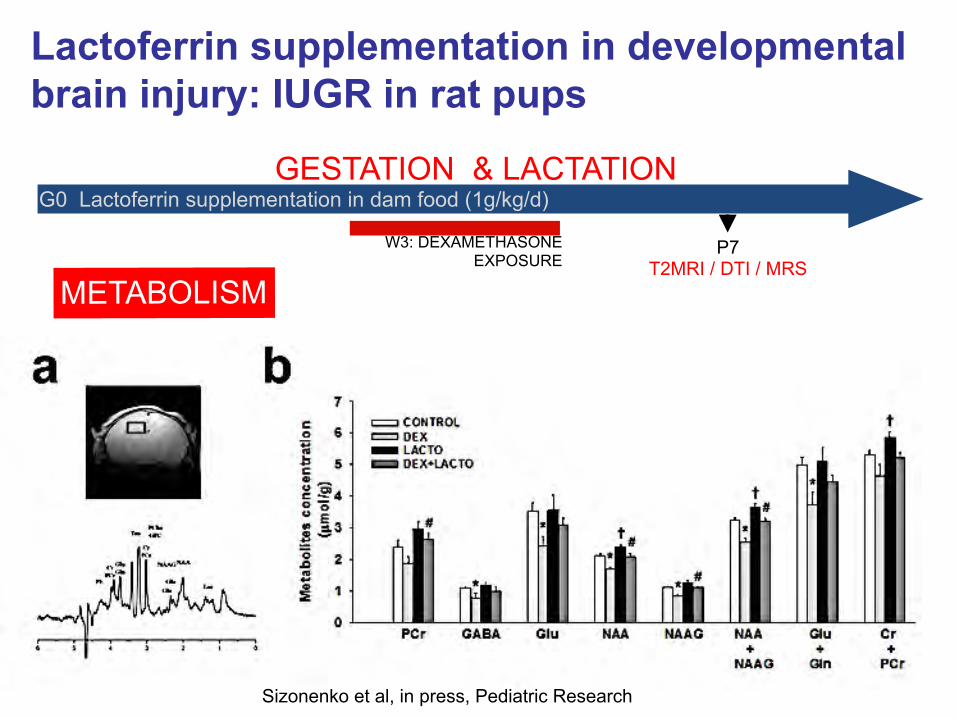
METABOLISM
Lactoferrin supplementation in developmental brain injury: IUGR in rat pups
W3: DEXAMETHASONE EXPOSURE
P7 T2MRI / DTI / MRS
G0 Lactoferrin supplementation in dam food (1g/kg/d) GESTATION & LACTATION
Sizonenko et al, in press, Pediatric Research
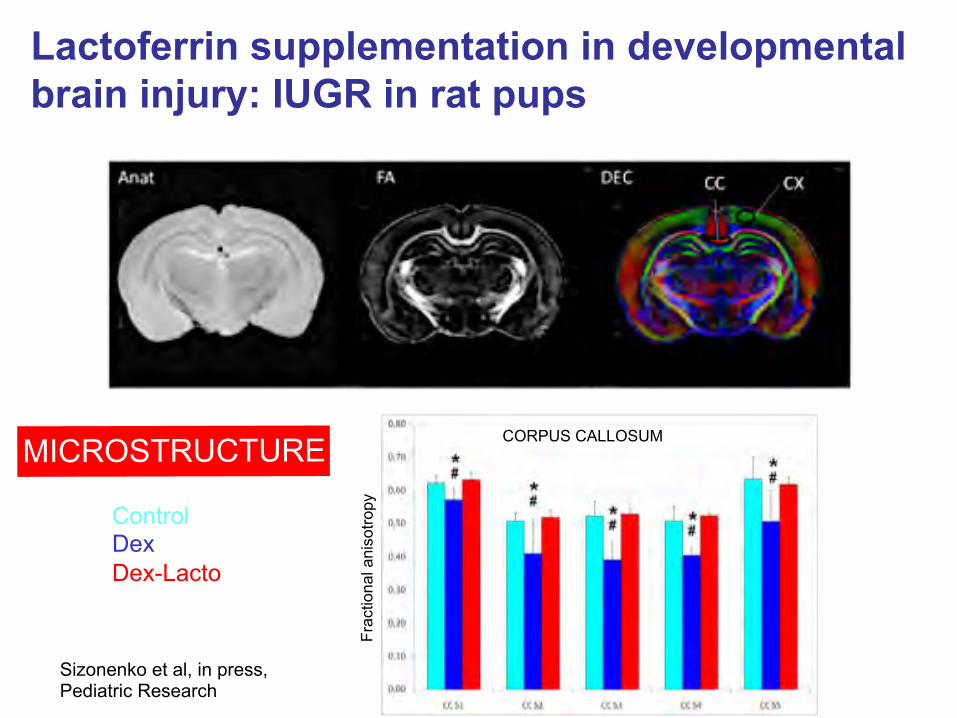
MICROSTRUCTURE
Lactoferrin supplementation in developmental brain injury: IUGR in rat pups
Control Dex Dex-Lacto
CORPUS CALLOSUM
Sizonenko et al, in press, Pediatric Research
Frac
tiona
l ani
sotro
py
MRI to study the effect of nutrition on brain development and injury
• Powerful multimodal tool that can delineate brain development and injury
• It has clearly enhanced our understanding of the altered brain development in preterm and IUGR infants
• It is clearly correlated to neurodevelopmental difficulties in these infants
• Translational tool that can be applied to clinical and basic research
• MRI generates biomarkers of brain changes that could be used in nutritional intervention during in early life
• Need for nutrition specialists to include such measures in nutritional intervention studies: collaboration
A. Chatagner P. Larvaron E. Somm G. Lodygensky L. Gui J. Dubois F. Lazeyras P. Hüppi
Y. Van de Looij N. Kuntz R. Gruetter
J. Garbow T. Inder J. Neil
C. Williams P. Gluckman
Collaborators
B. Wang R. Mansourian F. Raymond M. Faure
European Consortium NEOBRAIN, FP6
Biomedical Imaging Centre, EPFL, Lausanne
Swiss National Fund
ELA Fondation Motrice
Leenards, Louis Jeantet, Von Meissner, Bonninchi, de Reuter Fundations
Funding
Nestlé Research Centre

Thank you for your attention