Embed Size (px)
Citation preview

Number 354 + May 12, 2005
Access to Dental Care Among Hispanic or Latino Subgroups: United States, 2000–03
by Gulnur Scott, M.P.A., and Catherine Simile, Ph.D., Division of Health Interview Statistics
Abstract Objective—This report presents national estimates of access to dental care for
the following five subgroups of Hispanic or Latino persons in the United States: Mexican, Puerto Rican, Cuban, Central or South American, and other Hispanic or Latino. For comparison, estimates are also presented for non-Hispanic white persons.
Methods—Combined data from the 2000–2003 National Health Interview Surveys (NHIS), conducted by the Centers for Disease Control and Prevention’s National Center for Health Statistics, were analyzed to produce estimates for Hispanic or Latino persons aged 2 years and over. Information on dental care service utilization and unmet dental care needs due to cost was self-reported by persons aged 18 years and over. For children aged 2–17 years, the information was collected from an adult knowledgeable about the child’s health.
Results—Approximately 49% of Hispanic or Latino adults and 63% of Hispanic or Latino children had visited a dentist at least once in the past year. Mexican adults (44%) were least likely and Cuban adults (60%) were most likely to have used dental care in the past year. The percentage of adults with unmet dental needs was highest among Mexican adults (12%) and lowest among Cuban adults (6%). Among the five subgroups of Hispanic or Latino children, Mexican children (60%) were least likely and Puerto Rican children (72%) were most likely to have visited a dentist in the past year. Mexican children (9%) were more likely than Puerto Rican children (5%) and other Hispanic or Latino children (6%) to experience unmet dental needs due to cost. For both adults and children, underutilization of dental care services was most prevalent among those with poor or near poor poverty status, with less than a high school diploma, who were foreign-born, without health insurance coverage, and who had resided in the United States for less than 5 years.
Conclusion—Utilization of dental care services and unmet dental needs due to cost varied among subgroups of Hispanic or Latino persons. Identifying and understanding these subgroup differences will help those who administer policies and design programs for Hispanic or Latinos to improve their access to dental care.
Keywords: Hispanic or Latino c dental care utilization c National Health Interview Survey
U.S. DEPARTMENT OF HEALTH AND HUMAN SERVICES Centers for Disease Control and Prevention National Center for Health Statistics
Introduction Oral health is a significant
component of overall health, a fact underscored by the recent release of a special report on oral health by the Surgeon General. The two leading dental diseases (i.e., caries and periodontal disease) are common health problems, affecting nearly everyone during his or her lifespan. Additionally, oral disease is increasingly found to be associated with other chronic diseases such as heart and lung disease, diabetes, and stroke. Social costs, such as loss of school or work days, can also be linked to poorer oral health (1). Previous research has indicated that many people in the United States do not receive essential preventive dental services and treatment, which may result in socioeconomic disparities in oral health status (2). Although efforts have been made to eliminate inequality in health and health care, disparities in access to oral health care continue to exist in the United States. Thus, in 2000, the Surgeon General called for a national oral plan to eliminate health disparities among the different segments of the U.S. population (1). A recent study has indicated that race or ethnicity is one of the key factors that contribute to disparities in health and health care utilization (3). To improve

2 Advance Data No. 354 + May 12, 2005
understanding of the disparities found among the race or ethnic subpopulations in the United States, this study describes differences in access to dental care and dental care utilization in the Hispanic or Latino population and among Hispanic or Latino subgroups in the United States.
The U.S. Hispanic or Latino population is projected to grow from 31.7 million (12% of the total population) in 1999 to 98.2 million (24% of the total U.S. population) by 2050. Over the same period, the proportion of non-Hispanic white people is projected to decrease from 72% to 53% of the total U.S. population (4,5). Despite such a sharp projected population increase, dental care needs among Hispanic or Latino people have received little attention although a number of studies indicate that Hispanic or Latino persons are less likely to have utilized dental care services compared with non-Hispanic white persons (6–18).
The U.S. Hispanic or Latino population consists of individuals whose ancestors were originally from various countries in North America, Central or South America, the Caribbean, and Europe. Although the Hispanic or Latino population in the United States may share a common language, there is considerable variation among subgroups in terms of dialects, cultural background, socioeconomic status, and care-seeking behaviors. These diversities could result in disparities in access and utilization of dental care within the Hispanic or Latino population. Understanding these disparities can help identify target populations for oral health promotion and education among subgroups of Hispanic or Latino persons.
The objective of this study was to assess subgroup disparities in dental care service utilization. For comparison, estimates are also presented for non-Hispanic white people.
Methods
Data source
Data from the 2000–2003 National Health Interview Surveys (NHIS) were analyzed for this study. The NHIS is
conducted by the Centers for Disease Control and Prevention’s National Center for Health Statistics (NCHS). The annual sample consists of about 100,000 persons of all ages in about 40,000 households representing the civilian noninstitutionalized resident population of the United States. Trained interviewers from the U.S. Census Bureau conduct the in-person interviews for NCHS using computer-assisted personal interviewing (CAPI).
The NHIS questionnaire has been revised every 10 to 15 years, with the latest revision occurring in 1997 (19). Both the black and Hispanic or Latino populations are oversampled to increase the precision of estimates for those subgroups (20). The NHIS consists of a set of core questions that remain generally unchanged from year to year and supplemental questions that vary annually in response to current needs for data. The Core Module has three components: the Family Core, the Sample Adult Core, and the Sample Child Core. The Family Core collects information on everyone in the family about household composition, sociodemographic characteristics, health status, and utilization of health care services (19,20). Additionally, one adult and one child are randomly selected from each family, and information on each is collected with the Sample Adult Core and the Sample Child Core questionnaires. These questionnaires collect more detailed information on health status, utilization of health care services, and health behaviors. For the Sample Adult Core, adults usually respond for themselves. On average, between 200 and 300 sample adults per year have proxy caretakers responding for them because they are physically or mentally unable to respond for themselves. For the Sample Child Core, information is collected from an adult family member who is familiar with the child’s health, usually a parent.
This study analyzed data from the 2000–2003 NHIS. Combining 4 years of data provided a larger sample size for each Hispanic or Latino subgroup. During 2000–2003, interviews were conducted for a total of 51,728 children (including 14,274 Hispanic or Latino children aged 2–17 years) and 127,596
adults aged 18 years and over (including 21,681 Hispanic or Latino adults) in 149,647 households. The overall response rates for the Sample Child and Sample Adult components of the 2000–03 NHIS were 80.5% and 73.6%, respectively. Information on utilization of dental care services and unmet dental care needs due to cost was analyzed for 34,024 Hispanic or Latino persons who were aged 2 years and over (including 12,343 Hispanic or Latino children and 21,681 Hispanic or Latino adults).
Classification of Hispanic or Latino subgroups
The questionnaire included two questions about Hispanic origin: ‘‘Do/does[you/name] consider[yourself/ himself/herself] Hispanic or Latino?’’ and ‘‘Please give me the (number of the group) that represents your Hispanic Origin or ancestry.’’ During the interview, a flash card was shown to the respondent listing the following response categories: Puerto Rican, Cuban or Cuban American, Dominican, Mexican, Mexican American, Central or South America, Other Latin American, and Other Hispanic or Latino. Similarly, for children, the knowledgeable respondents are first asked if they consider their child to be Hispanic or Latino. Those who answered ‘‘Yes’’ are then asked to identify the subgroup(s) that represents (Sample Child’s) Hispanic origin or ancestry from the same list provided to the adults. Those reporting any Hispanic or Latino ethnicity were classified as ‘‘Hispanic or Latino’’ regardless of their race identification.
This report presents data for five Hispanic or Latino subgroups: Mexican (comprising Mexicans and Mexican Americans), Puerto Rican, Cuban (comprising Cubans and Cuban Americans), Central or South American, and other Hispanic or Latino. The other Hispanic or Latino subgroup includes those classified as Dominican, other Latin American, or other Hispanic or Latino. Because the non-Hispanic white population comprises the majority of the general population, the dental visit estimate for the white population is presented as the reference group.

3 Advance Data No. 354 + May 12, 2005
Figure 1. Percentage of Hispanic or Latio persons by Hispanic or Latino origin: United States, 2000–2003
Measurement of dental care utilization
The NHIS questionnaire obtains information on dental visits based on the following question in each of the Sample Adult and Sample Child Core components: ‘‘About how long has it been since you (or name) last saw or talked to a dentist? Include all types of dentists such as orthodontists, oral surgeons, and all other dental specialists as well as dental hygienists.’’ The possible responses are: ‘‘Never,’’ ‘‘6 months or less,’’ ‘‘More than 6 months, but not more than 1 year ago,’’ ‘‘More than 1 year, but not more than 2 years ago,’’ ‘‘More than 2 years, but not more than 5 years ago,’’ ‘‘More than 5 years ago.’’ Parents were not asked this question about children under age 1 because such children are generally not expected to have preventive dental care visits.
For this report, ‘‘unmet dental care needs due to cost’’ was measured using the following question: ‘‘During the past 12 months, was there any time when you (or name) needed dental care (including check-ups) but didn’t get it because you (or name) couldn’t afford it?’’
Statistical analysis
Estimates shown in this report were calculated using NHIS weights that are based on census totals for sex, age, and race/ethnicity of the civilian noninstitutionalized population of the United States (20). The Taylor series linearization method was chosen for variance estimation. All analyses were conducted using the SUDAAN software package to account for the complex sample design of the NHIS (21). Estimates with relative standard errors of greater than 30% are considered to be unreliable and are indicated with an asterisk (*). Differences between percentages were evaluated using two-sided t-tests at the 0.05 level. No adjustments were made for multiple comparisons. In this report, terms such as ‘‘greater than’’ and ‘‘less than’’ imply that differences are significant, and terms such as ‘‘similar ’’ or ‘‘no difference’’ mean that no significant difference among the estimates was
found. Lack of comments regarding the difference between estimates does not mean that the difference was tested and found to be significant. Direct standardization was used to calculate age-adjusted percents using the projected 2000 U.S. population as the standard population (22).
Results Table 1 presents the percent
distributions of selected sociodemographic characteristics among the different subgroups of Hispanic or Latino persons and non-Hispanic white persons. Figure 1 shows the percentage of Hispanic or Latino persons by origin.
With the exception of Cubans, who had the highest percentage of adults aged 65 and over, the age distributions were similar among the five subgroups of Hispanic or Latinos. Compared with the non-Hispanic white population, most Hispanic or Latino subgroups had a higher percentage of children under age 18 and a lower percentage of adults aged 65 and over. Hispanic or Latinos were 2.5 times as likely as non-Hispanic white people to be living below the Federal poverty level (figure 2). Among the five subgroups of Hispanic or
Latinos, Mexicans (19.2%) and Puerto Ricans (20.4%) were more likely than Cubans (14.7%) and Central or South Americans (13.1%) to be living below the Federal poverty level.
The subgroups of Hispanic or Latino persons were concentrated in different geographic regions. The majority of Mexicans lived in the West (54.1%), the majority of Puerto Ricans (60.1%) lived in the Northeast, and most Cubans (73.7%) lived in the South. Among the five subgroups of Hispanic or Latino persons aged 25 and over, Mexicans were most likely to have less than a high school education and also least likely to have higher educational attainment. Almost 4 out of every 10 Hispanic or Latinos were foreign-born. Almost one-third of Hispanics or Latinos (31.1%) did not have health insurance coverage at the time of interview compared with 10.3% of non-Hispanic white people. Of the five subgroups of Hispanic or Latinos, Mexicans (35.4%) and Central or South Americans (36.5%) were more likely than Puerto Ricans (14.6%), Cubans (18.3%), and other Hispanic or Latinos (18.7%) to be uninsured.
4 Advance Data No. 354 + May 12, 2005
Figure 2. Percentage of Hispanic or Latino persons in five subgroups and of non-Hispanic white persons, by poverty status: United States, 2000–2003
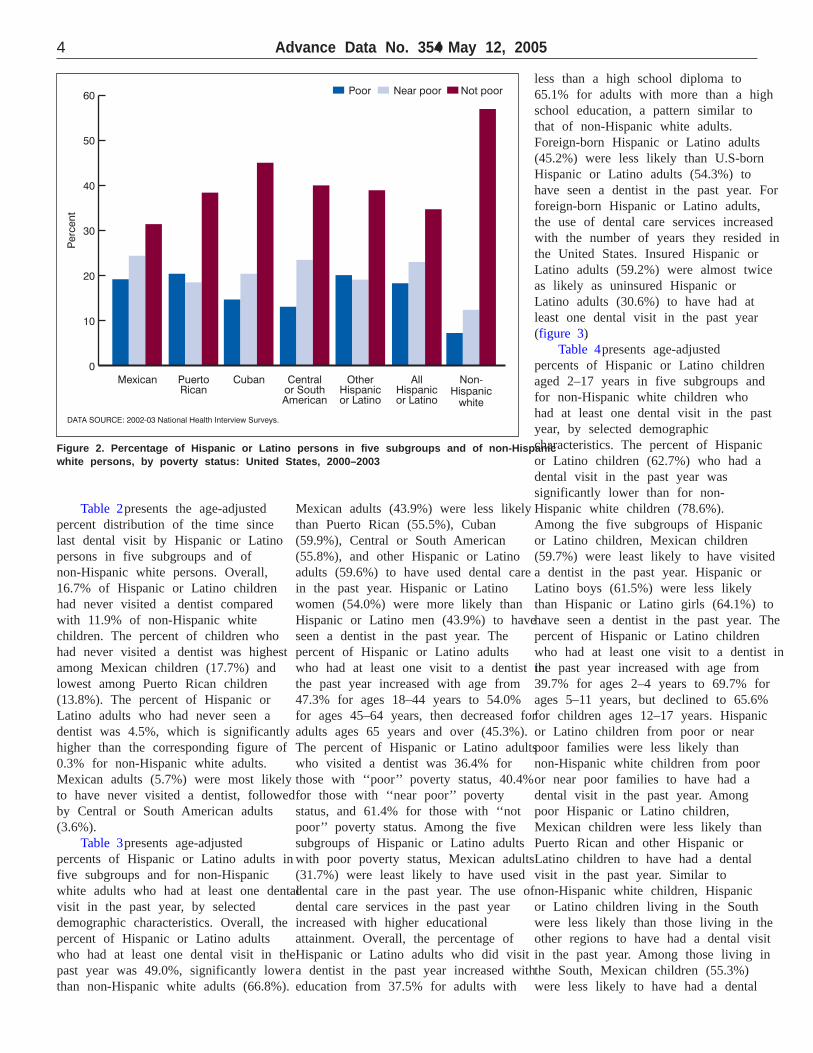
Table 2 presents the age-adjusted percent distribution of the time since last dental visit by Hispanic or Latino persons in five subgroups and of non-Hispanic white persons. Overall, 16.7% of Hispanic or Latino children had never visited a dentist compared with 11.9% of non-Hispanic white children. The percent of children who had never visited a dentist was highest among Mexican children (17.7%) and lowest among Puerto Rican children (13.8%). The percent of Hispanic or Latino adults who had never seen a dentist was 4.5%, which is significantly higher than the corresponding figure of 0.3% for non-Hispanic white adults. Mexican adults (5.7%) were most likely to have never visited a dentist, followed by Central or South American adults (3.6%).
Table 3 presents age-adjusted percents of Hispanic or Latino adults in five subgroups and for non-Hispanic white adults who had at least one dental visit in the past year, by selected demographic characteristics. Overall, the percent of Hispanic or Latino adults who had at least one dental visit in the past year was 49.0%, significantly lower than non-Hispanic white adults (66.8%).
Mexican adults (43.9%) were less likely than Puerto Rican (55.5%), Cuban (59.9%), Central or South American (55.8%), and other Hispanic or Latino adults (59.6%) to have used dental care in the past year. Hispanic or Latino women (54.0%) were more likely than Hispanic or Latino men (43.9%) to have seen a dentist in the past year. The percent of Hispanic or Latino adults who had at least one visit to a dentist in the past year increased with age from 47.3% for ages 18–44 years to 54.0% for ages 45–64 years, then decreased for adults ages 65 years and over (45.3%). The percent of Hispanic or Latino adults who visited a dentist was 36.4% for those with ‘‘poor’’ poverty status, 40.4% for those with ‘‘near poor’’ poverty status, and 61.4% for those with ‘‘not poor’’ poverty status. Among the five subgroups of Hispanic or Latino adults with poor poverty status, Mexican adults (31.7%) were least likely to have used dental care in the past year. The use of dental care services in the past year increased with higher educational attainment. Overall, the percentage of Hispanic or Latino adults who did visit a dentist in the past year increased with education from 37.5% for adults with
less than a high school diploma to 65.1% for adults with more than a high school education, a pattern similar to that of non-Hispanic white adults. Foreign-born Hispanic or Latino adults (45.2%) were less likely than U.S-born Hispanic or Latino adults (54.3%) to have seen a dentist in the past year. For foreign-born Hispanic or Latino adults, the use of dental care services increased with the number of years they resided in the United States. Insured Hispanic or Latino adults (59.2%) were almost twice as likely as uninsured Hispanic or Latino adults (30.6%) to have had at least one dental visit in the past year (figure 3).
Table 4 presents age-adjusted percents of Hispanic or Latino children aged 2–17 years in five subgroups and for non-Hispanic white children who had at least one dental visit in the past year, by selected demographic characteristics. The percent of Hispanic or Latino children (62.7%) who had a dental visit in the past year was significantly lower than for non-Hispanic white children (78.6%). Among the five subgroups of Hispanic or Latino children, Mexican children (59.7%) were least likely to have visited a dentist in the past year. Hispanic or Latino boys (61.5%) were less likely than Hispanic or Latino girls (64.1%) to have seen a dentist in the past year. The percent of Hispanic or Latino children who had at least one visit to a dentist in the past year increased with age from 39.7% for ages 2–4 years to 69.7% for ages 5–11 years, but declined to 65.6% for children ages 12–17 years. Hispanic or Latino children from poor or near poor families were less likely than non-Hispanic white children from poor or near poor families to have had a dental visit in the past year. Among poor Hispanic or Latino children, Mexican children were less likely than Puerto Rican and other Hispanic or Latino children to have had a dental visit in the past year. Similar to non-Hispanic white children, Hispanic or Latino children living in the South were less likely than those living in the other regions to have had a dental visit in the past year. Among those living in the South, Mexican children (55.3%) were less likely to have had a dental

5 Advance Data No. 354 + May 12, 2005
Figure 3. Percentage of Hispanic or Latino adults in five subgroups and of non-Hispanic white adults who had visited a dentist in the past year, by insurance status: United States, 2000—2003
visit in the past year than Puerto Rican children (65.5%), Cuban children (68.8%), and other Hispanic or Latino children (64.2%). Foreign-born Hispanic or Latino children were less likely than their U.S-born counterparts to have seen a dentist in the past year. Among foreign-born Hispanic or Latino children, Mexican children (37.0%) were less likely to have seen a dentist in the past year compared with Cuban (54.1%), Central or South American (54.8%), and other Hispanic or Latino children (64.2%). For foreign-born children, the use of dental care services increased with the number of years they resided in the United States. Similar to non-Hispanic white children, insured Hispanic or Latino children (69.9%) were more likely than uninsured Hispanic or Latino children (40.7%) to have had a dental visit in the past year.
Table 5 presents the age-adjusted percent of Hispanic or Latino adults and non-Hispanic white adults who experienced an unmet need for dental care due to cost by selected demographic characteristics. Hispanic or Latino adults (11.1%) were more likely than non-Hispanic white adults (9.2%) to experience an unmet dental need due to cost. The percent of adults with
unmet dental needs was highest among Mexican adults (12.3%) and lowest among Cuban adults (5.5%). Women in all groups were more likely than men to experience an unmet dental need. The percent of Hispanic or Latino adults who experienced unmet dental needs due to cost was 17.1% for those with ‘‘poor’’ status, 14.4% for those with ‘‘near poor’’ status, and 7.2% for those with ‘‘not poor’’ status. The percent of Hispanic or Latino adults with unmet dental needs decreased with education from 12.1% for those with less than a high school education to 10.0% for those with more than a high school education. Unlike dental visits analyzed in this report, foreign-born Hispanic or Latino adults (10.4%) were less likely than their U.S.-born counterparts (12.1%) to experience an unmet need. Among foreign-born Hispanic or Latino adults, Mexican adults (11.4%) and Central or South American adults (10.4%) were more likely than Cuban adults (5.6%) to experience unmet dental needs. Uninsured Hispanic or Latino adults were 2.7 times as likely as insured Hispanic or Latino adults to experience unmet dental needs. Among the five subgroups of uninsured
Hispanic or Latino adults, the percent was highest among Puerto Ricans (20.2%) and lowest among Cubans (14.2%).
Table 6 presents the percentages of Hispanic or Latino children and non-Hispanic white children who had unmet dental needs due to cost, by selected demographic characteristics. Hispanic or Latino children (8.0%) were more likely than non-Hispanic white children (5.6%) to experience unmet dental needs (figure 4). Among the five subgroups of Hispanic or Latino children, Mexican children (8.8%) were more likely than Puerto Rican children (5.1%) and other Hispanic or Latino children (6.4%) to experience such needs. The percentage of Hispanic or Latino children with unmet dental needs due to cost increased with age from 3.8% for ages 2–4 years to 9.5% for ages 12–17 years. Poor and near poor Hispanic or Latino children were more likely than not poor Hispanic or Latino children to experience an unmet dental need. The percentage of children experiencing an unmet dental need was higher for foreign-born Hispanic or Latino children (10.1%) than for U.S.-born Hispanic or Latino children (7.5%). Uninsured Hispanic or Latino children were almost three times as likely as insured Hispanic or Latino children to have an unmet dental need.
Discussion This report is the first to provide
national estimates of access to dental care by selected social demographic characteristics for five subgroups of Hispanic or Latino persons in the United States. Analyses revealed that Hispanic or Latino persons were at greater risk of experiencing a lack of access to dental care compared with non-Hispanic white persons. The study results also indicated a disparity in access to dental care among the five subgroups of Hispanics or Latinos. Of the five subgroups examined for adults and children in this report, Mexicans were found to be least likely to have utilized dental care services in the past year. Mexicans were also most likely to lack health insurance coverage and most likely to experience unmet dental needs due to cost. For both

6 Advance Data No. 354 + May 12, 2005
Figure 4. Percentage of Hispanic or Latino children in five subgroups and of non-Hispanic white children with unmet dental needs due to cost: United States, 2000–2003
adults and children, underutilization of dental care services was most prevalent among those with poor or near poor poverty status, with less than a high school diploma, who were foreign-born, without health insurance coverage, and who resided in the U.S. for less than 5 years. Many of these socioeconomic factors are correlated and were prevalent among Hispanic or Latino persons and most prevalent among Mexicans. The information from this study may help design and implement programs that aim to improve access to dental care among subgroups of Hispanic or Latinos.
The Hispanic or Latino population in the United States has been disproportionately represented in the uninsured population (23–25). It is well documented that uninsured persons are less likely to have a regular source of care, less likely to receive preventive and primary care, less likely to receive required preventive services, and more likely to delay needed medical care than insured persons (26–36). Uninsured persons are also less likely to get needed dental care than insured persons (16, 37–39). Persons without dental insurance coverage are 39% less likely than those with dental insurance
coverage to receive dental care (40). A previous study indicated that the high cost of oral care was the primary reason for not seeking needed dental care among Hispanic or Latinos (41). Fear of the dentist, long waiting times, transportation difficulties, language barriers, and no available facility have also been identified as barriers to dental care among Hispanic or Latinos (42–43).
The results of this study revealed a diverse sociodemographic background for these five subgroups of Hispanics or Latinos. Among them, Mexicans were most likely to have lower levels of educational attainment, which is related to less favorable occupational status and poverty. It has been well documented that Hispanic or Latinos with lower levels of educational attainment were at greater risk for the lack of access to dental care (44–46). There are some studies that suggest that Hispanics or Latinos may perceive their need of access to dental care differently than non-Hispanic white persons because of different expectations of access to dental care according to their culture. For example, a previous study indicated that Hispanics or Latinos were almost twice
as likely as the total U.S. population to use herbal and other home remedies to treat episodes of illness (47). Similarly, different Hispanic or Latino subgroups may also have different expectations about their dental care needs due to cultural differences, which may have subsequently resulted in a difference in access to dental care among the subgroups.
This study also revealed that for foreign-born Hispanics or Latinos, the use of dental care services increased with the number of years they had resided in the United States. Less acculturated people were less likely than those with high levels of acculturation to use dental care services and to have dental insurance coverage. Less acculturated Mexicans had higher numbers of decayed and missing teeth than more acculturated Mexicans (48). Less acculturated Mexicans also had poorer oral hygiene and a higher prevalence of gingivitis (6).
The NHIS is one of the largest health surveys conducted in the United States. It provides annual data to identify and monitor trends in the Nation’s health and health care. Because of its sample design, it is also possible to combine years of data to produce more reliable estimates and thus provide national estimates of access to health care for subgroups of Hispanic or Latino persons. Although the data from the 2000–2003 NHIS were combined to increase sample size, the sample sizes for some groups of Hispanic or Latino persons are still small. This limited the ability to produce reliable estimates for all Hispanic or Latino subgroups. Nonetheless, this study has been able to demonstrate significant disparities among subpopulations of Hispanics or Latinos living in the United States.
Mexicans were disproportionately represented among Hispanic or Latino persons who did not utilize dental care services in the past year and had unmet dental needs due to cost. It is important to keep in mind that Hispanics or Latinos make up over 13% of the general population and over 61% of Hispanic or Latino persons in the United States are of Mexican origin. This subgroup also has a disproportionate percentage of demographic

7 Advance Data No. 354 + May 12, 2005
characteristics that put them at risk for utilizing dental care services. Much of the disparity in access to dental care between Hispanics or Latinos and non-Hispanic white people is driven by lack of access to dental care among Mexicans in the United States.
The NHIS dental visit measure is limited. Because the dental visit question includes all types of dental visits, including routine examinations, restorative procedures, emergency care, and preventive services, a higher visit estimate does not mean better oral health status. In fact, it may indicate the need for more dental care to improve oral health status. Therefore, the fact that 59.9% of Cuban adults have seen a dentist in the past year, compared with 43.9% of Mexican adults, does not necessarily mean that Cubans have better oral health. It means that they were more likely to have had a dental visit whether for preventive or restorative measures. However, those who do not go to the dentist probably have poorer oral health. For example, 17.7% of Mexican children have never seen a dentist as compared with 11.9% of non-Hispanic white children. This may indicate not only that Mexican children are not accessing dental care, but also that they are at higher risk for poorer oral health.
References 1. U.S. Department of Health and
Human Services. Oral health in America: A report of the surgeon general—executive summary. Rockville, MD: National Institute of Dental and Craniofacial Research, National Institutes of Health. 2000.
2. National Center for Health Statistics. Healthy people 2000 final review: Priority area 13 oral health. pp.195– 205. Hyattsville, MD: Public Health Service. 2001.
3. Keppel K, Pearcy J, Wagener D. Trends in racial and ethnic specific rates for the health status indicators: United States, 1990–98. Healthy People Statistical Notes, no 23. Hyattsville, MD: National Center for Health Statistics. January 2002.
4. Therrien M, Ramirez RR. The Hispanic population in the United States: March 2000, Current Population Reports, P20–535.
Washington: U.S. Census Bureau. 2000.
5. Census Bureau projects doubling of Nation’s population by 2100. U.S. Census Bureau. Public Information Office. Available at: www.census.gov/Press-Release/www/ 2000/cb00–05.html.
6. Waldman HB. Hispanic children: An increasing reality in pediatric dental practice. J Dent Child, May–June; 221–24. 1992.
7. Aday LA, Forthofer RN. A profile of black and Hispanic subgroups’ access to dental care: findings from the National Health Interview Survey. J Public Health Dent. 52(4): 210–15. 1992.
8. Davidson PL, Andersen RM. Determinants of dental care utilization for diverse ethnic and age groups. Adv Dent Res 11(2):254–62. 1997.
9. Atchison KA, Davidson PL, Nakazono TT. Predisposing, enabling, and need for dental treatment characteristics of ICS-II USA ethnically diverse groups. Adv Dent Res 11(2):223–34. 1997.
10. Gonzales CD, Frazier PJ, LeMay W, et al. Sealant status and factors associated with sealant presence among children in Milwaukee, WI. J Dent Child 335–41. 1995.
11. Dunlop DD, Manheim LM, Song J, Chang R. Gender and ethnic/racial disparities in health care utilization among older adults. J Gerontology vol 57B no3, S221–33. 2002.
12. Edelstein BL. Disparities in oral health and access to care: findings of national surveys. Ambulatory Pediatr 2(2):141–47. 2002.
13. Waldman HB. An increasing Hispanic population and the practice of dentistry. Ill Den J 81–85. 1992.
14. Davidson PL, Andersen RM, Marcus M, et al. Indicators of oral health in diverse ethnic and age groups: Findings from the International Collaborative Study of Oral Health Outcomes (ICS-II) USA Research Locations. J Med Syst. 20 (5): 295–316. 1996.
15. Vargas CM, Isman RE, Crall JJ. Comparison of children’s medical and dental insurance coverage by sociodemographic characteristics, United States, 1995. J Public Health Dent 62(1):38–42. 2002.
16. Yu SM, Bellamy HA, Schwalberg RH, Drum MA. Factors associated with use of preventive dental and
health services among U.S.adolescents. J Adolesc Health.29:395–405. 2001.
17. Macek MD, Manski RJ, Vargas CM, Moeller JF. Comparing oral health care utilization estimates in the United States across three nationally representative surveys. Health Serv Res 37(2):499–521. 2002.
18. Day AN, Schiller JS, Tai DA. Summary health statistics for U.S. children. National Health Interview Survey. 2002. National Center for Health Statistics. Vital Health Stat 10(221). 2004.
19. Botman S, Moore T, Moriarity C, Parsons VL. Design and estimation for the National Health Interview Survey, 1995–2004. National Center for Health Statistics. Vital Health Stat 2(130). 2000.
20. National Center for Health Statistics. 2001 National Health Interview Survey (NHIS) Public-Use Data Release, NHIS Survey Description, vol. 2001. Hyattsville, MD: 2003. Available at: ftp://ftp.cdc.gov/pub/ health_statistics/NCHS/ dataset_documentation/NHIS.
21. Shah BV, Barnwell BG, Bieler GS. SUDAAN User’s Manual, Release 7.0. Research Triangle Park, NC: Research Triangle Institute. 1996.
22. Klein RJ, Schoenborn CA. Age adjustment using the 2000 projected U.S. population. Healthy People Statistical Notes, no 20. Hyattsville, MD: National Center for Health Statistics, January 2001.
23. Highlights and Chartpack. The Kaiser Family Foundation D.C. Health Care Access Survey, 2003. Publication 6108. Washington. October 2003.
24. Quinn K. Working without benefits: The health insurance crisis confronting Hispanic Americans. Publication 370. The Commonwealth Fund. February 2000.
25. Scott G, Ni H. Access to health care among Hispanic or Latino children: United States, 1998–2001. Advance data from the vital health statistics, no 344. Hyattsville, MD: National Center for Health Statistics. 2004.
26. Bindman AB, Grumbach K, Osmond D, et al. Primary care and receipt of preventive services. J Gen Intern Med, 11(5):269–76. May 1996.
27. Franks P, Clancy CM, Gold MR, Nutting PA. Health insurance and subjective health status: Data from the 1987 National Medical

8 Advance Data No. 354 + May 12, 2005
Expenditure Survey. Am J Public Health 83(9):1295–99. 1993.
28. Freeman HE, Aiken LH, Blendon RJ, Corey CR. Uninsured working-age adults: Characteristics and consequences. Health Serv Res. 24(6):811–23. 1990.
29. Hafner-Eaton C. Physician utilization disparities between the uninsured and insured. Comparisons of the chronically ill, acutely ill, and well nonelderly populations. JAMA, February 10, 269(6):787–92. 1993.
30. Bindman AB, Grumbach K, Osmond D, et al. Preventable hospitalizations and access to health care. JAMA, 274(4):305–11. July 26, 1995.
31. Demographic characteristics of persons without a regular source of medical care—Selected states, 1995. MMWR, 47(14):277–79. April 17, 1998.
32. Newacheck PW, Brindis CD, Cart CU, et al. Adolescent health insurance coverage: Recent changes and access to care. Pediatr. 104(2):195–202. 1999.
33. Newacheck PW, Stoddard JJ, Hughes DC, Pearl M. Health insurance and access to primary care for children. New Engl J Med 338(8):513–19. 1998.
34. Zuvekas SH, Weinick RM. Changes in access to care, 1977–1996. The role of health insurance. Health Serv Res, 34(1):271–79. April 1999.
35. Ayanian JZ, Kohler BA, Abe T, Epstein AM. The relation between health insurance coverage and clinical outcomes among women with breast cancer. New Engl J Med, 329(5):326–31. July 29, 1993.
36. Roetzheim RG, Pal N, Tennant C, et al. Effects of health insurance and race on early detection of cancer. J National Cancer Institute. 91(16):1409–15. August 18, 1999.
37. Yu SM, Bellamy HA, Kogan MD, et al. Factors that influence receipt of recommended preventive pediatric health and dental care. Pediatrics 110(6); e73–84. 2002.
38. Stewart DCL, Ortega AN, Dausey D, Rosenbeck R. Oral health and use of dental services among Hispanics. J Public Health Dent 62(2):84–91. 2002.
39. Vasquez L, Swan JH. Access and attitudes toward oral health among Hispanics in Wichita, KS. J Dent Hygiene. 77(2):85–96. 2003.
40. Manski RJ, Magder LS. Demographic and socioeconomic
predictors of dental care utilization. J Am Dent Assoc 129(2):195–200. 1998.
41. Mueller CD, Schur CL, Paramore LC. Access to dental care in the United States. J Am Dent Assoc 129:429–37. 1998.
42. Entwistle BA, Swanson TM. Dental needs and perceptions of adult Hispanic migrant farmworkers in Colorado. J Dent Hygiene 63(6):286– 92. 1989.
43. Lukes S, Miller F. Oral health issues among migrant workers. J Dent Hygiene 76(2):134–40. 2002.
44. Dolan TA, Corey CR, Freeman HE. Older Americans’ access to oral health care. J Dent Educ 52: 637–42. 1988.
45. Dolan TA, Atchison KA. Implications of access, utilization and need for oral health care by the noninstitutionalized elderly on the dental delivery system. J.Dent Educ 57:876–87. 1998.
46. Atchison KA, Mayer-Oakes SA, Schweitzer SO, et al. J.Pub.Health Dent 53(2):88–95. 1993.
47. Andersen RM. Access to medical care among the Hispanic population of the southwestern United States. J. Health Soc Behav 22:78–89. 1981.
48. Ismail AI, Szpunar SM. Oral health status of Mexican-Americans with low and high acculturation status: findings from southwestern HHANES, 1982–1984. J Pub Health Dent 50(1):24–31. 1990.

9 Advance Data No. 354 + May 12, 2005
Table 1. Percent distributions (with standard errors) of selected demographic characteristics for Hispanic or Latino persons in five subgroups and for non-Hispanic white persons aged 2 and over: United States, 2000–2003
Puerto Selected characteristic Mexican Rican
Central Other All or South Hispanic or Hispanic or Non-Hispanic
Cuban American Latino Latino white
Unweighted sample size . . . . . . . . . . 21,857 3,310 1,643 4,609 2,605 34,024 107,717
Percent distribution (standard error)
Total. . . . . . . . . . . . . . . . . . . . . . . . 100.0 (0.00) 100.0 (0.00) 100.0 (0.00) 100.0 (0.00) 100.0 (0.00) 100.0 (0.00) 100.0 (0.00)
Sex
Male . . . . . . . . . . . . . . . . . . . . . . . 49.2 (0.42) 45.1 (0.95) 45.3 (1.32) 47.1 (0.79) 43.2 (1.19) 47.8 (0.33) 46.5 (0.19) Female . . . . . . . . . . . . . . . . . . . . . . 50.8 (0.42) 54.9 (0.95) 54.7 (1.32) 52.9 (0.79) 56.8 (1.19) 52.2 (0.33) 53.5 (0.19)
Age
2–17 years. . . . . . . . . . . . . . . . . . . . 36.5 (0.29) 2–4 years . . . . . . . . . . . . . . . . . . . 8.4 (0.18) 5–11 years . . . . . . . . . . . . . . . . . . 15.8 (0.22) 12–17 years . . . . . . . . . . . . . . . . . 12.3 (0.22)
18 years and over . . . . . . . . . . . . . . . 63.5 (0.29) 18–44 years . . . . . . . . . . . . . . . . . 44.4 (0.38) 45–64 years . . . . . . . . . . . . . . . . . 13.5 (0.29) 65 years and over . . . . . . . . . . . . . . 5.5 (0.28)
32.0 (0.80) 22.1 (1.29) 30.4 (0.57) 36.0 (1.33) 34.4 (0.29) 21.8 (0.15) 6.9 (0.41) 4.3 (0.50) 6.7 (0.33) 7.7 (0.64) 7.7 (0.15) 4.0 (0.07)
13.1 (0.74) 7.6 (0.67) 13.0 (0.50) 16.1 (0.94) 14.7 (0.21) 8.8 (0.10) 11.9 (0.62) 10.2 (0.79) 10.7 (0.47) 12.2 (0.67) 11.9 (0.18) 9.0 (0.09) 68.0 (0.80) 77.9 (1.29) 69.6 (0.57) 64.0 (1.33) 65.6 (0.29) 78.2 (0.15) 41.3 (0.88) 32.9 (1.48) 48.3 (0.81) 35.3 (1.06) 43.4 (0.35) 36.5 (0.28) 18.6 (0.74) 21.0 (1.22) 16.6 (0.67) 19.5 (1.06) 15.3 (0.26) 24.7 (0.17)
8.1 (0.60) 23.9 (2.68) 4.7 (0.39) 9.2 (1.14) 6.9 (0.32) 17.0 (0.21)
Poverty status1
Poor. . . . . . . . . . . . . . . . . . . . . . . . 19.2 (0.55) 20.4 (1.02) 14.7 (1.77) 13.1 (0.61) 20.1 (1.16) 18.3 (0.39) 7.3 (0.22) Near poor . . . . . . . . . . . . . . . . . . . . 24.4 (0.48) 18.5 (1.02) 20.4 (0.99) 23.5 (0.78) 19.1 (0.95) 23.0 (0.36) 12.4 (0.17) Not poor . . . . . . . . . . . . . . . . . . . . . 31.4 (0.73) 38.4 (1.48) 45.0 (2.05) 40.0 (1.17) 38.9 (1.35) 34.7 (0.56) 56.9 (0.36) Unknown . . . . . . . . . . . . . . . . . . . . . 24.9 (0.69) 22.7 (1.07) 19.8 (2.04) 23.4 (0.89) 21.9 (1.43) 24.0 (0.50) 23.4 (0.32)
Region
Northeast . . . . . . . . . . . . . . . . . . . . 1.9 (0.30) Midwest . . . . . . . . . . . . . . . . . . . . . 10.0 (0.76) South . . . . . . . . . . . . . . . . . . . . . . . 34.0 (1.39) West . . . . . . . . . . . . . . . . . . . . . . . 54.1 (1.40)
60.1 (2.03) 15.5 (2.43) 28.0 (1.75) 39.1 (3.46) 15.9 (0.52) 20.1 (0.34) 9.3 (1.12) 3.5 (0.68) 5.4 (0.59) 5.2 (0.74) 8.6 (0.53) 28.5 (0.43)
23.1 (1.81) 73.7 (2.55) 38.6 (1.67) 20.1 (1.95) 34.3 (1.00) 34.6 (0.45) 7.5 (0.98) 7.3 (0.85) 28.0 (1.54) 35.7 (5.35) 41.3 (0.99) 16.8 (0.33)
Place of residence2
MSA . . . . . . . . . . . . . . . . . . . . . . . 88.8 (1.23) Central city . . . . . . . . . . . . . . . . . . 45.5 (1.58) Not central city . . . . . . . . . . . . . . . . 43.3 (1.53)
Not MSA . . . . . . . . . . . . . . . . . . . . . 11.2 (1.23)
96.9 (1.05) 97.6 (0.96) 97.5 (0.40) 88.8 (7.11) 91.4 (0.75) 76.0 (0.55) 57.9 (2.01) 26.4 (2.92) 45.6 (1.55) 51.3 (4.66) 46.5 (1.19) 22.2 (0.64) 39.0 (1.94) 71.2 (3.06) 51.8 (1.55) 37.5 (3.69) 45.0 (1.17) 53.8 (0.77) *3.1 (1.05) *2.4 (0.96) 2.5 (0.40) *11.2 (7.11) 8.6 (0.75) 24.0 (0.55)
Urban/rural
Urban . . . . . . . . . . . . . . . . . . . . . . . 87.9 (0.87) 93.6 (0.87) 97.0 (0.63) 95.4 (0.59) 92.2 (2.28) 90.5 (0.63) 67.8 (0.69) Rural . . . . . . . . . . . . . . . . . . . . . . . 12.1 (0.87) 6.4 (0.87) 3.0 (0.63) 4.6 (0.59) 7.8 (2.28) 9.5 (0.63) 32.2 (0.69)
Highest education3
Less than high school diploma . . . . . . . 50.5 (0.82) 32.8 (1.36) 34.7 (2.19) 32.2 (1.21) 28.9 (1.60) 42.8 (0.63) 12.8 (0.23) High school or GED . . . . . . . . . . . . . . 22.3 (0.44) 29.0 (1.28) 22.7 (1.10) 22.0 (0.95) 25.7 (1.54) 23.4 (0.37) 30.6 (0.27) More than high school. . . . . . . . . . . . 27.2 (0.72) 38.2 (1.43) 42.6 (1.95) 45.7 (1.25) 45.4 (2.05) 33.8 (0.58) 56.6 (0.37)
Citizenship
U.S. citizen . . . . . . . . . . . . . . . . . . . 69.6 (0.78) 98.8 (0.23) 75.1 (1.60) 53.5 (1.10) 83.9 (1.64) 71.9 (0.61) 98.5 (0.06) Not U.S. citizen . . . . . . . . . . . . . . . . . 30.4 (0.78) 1.2 (0.23) 24.9 (1.60) 46.5 (1.10) 16.1 (1.64) 28.1 (0.61) 1.5 (0.06)
Nativity4
U.S.-born. . . . . . . . . . . . . . . . . . . . . 60.8 (0.78) 98.1 (0.28) 34.2 (1.74) 30.6 (0.76) 70.8 (2.58) 60.1 (0.61) 96.6 (0.09) Foreign-born. . . . . . . . . . . . . . . . . . . 39.2 (0.78) 1.9 (0.28) 65.8 (1.74) 69.4 (0.76) 29.2 (2.58) 39.9 (0.61) 3.4 (0.09)
Years in United States5
Less than 5 years . . . . . . . . . . . . . . . 23.4 (0.81) 5–10 years. . . . . . . . . . . . . . . . . . . . 18.6 (0.72) 10 years or more . . . . . . . . . . . . . . . . 58.0 (1.05)
10.8 (1.23) 14.0 (1.44) 27.3 (1.39) 11.4 (1.56) 21.8 (0.68) 17.7 (0.95) 8.2 (0.94) 13.9 (1.36) 16.2 (0.74) 21.0 (1.96) 16.8 (0.49) 12.2 (0.65)
81.1 (1.47) 72.1 (2.36) 56.5 (1.41) 67.6 (2.66) 61.4 (0.86) 70.1 (1.02)
Health insurance6
Uninsured . . . . . . . . . . . . . . . . . . . . 35.4 (0.65) 14.6 (0.63) 18.3 (1.14) 36.5 (1.02) 18.7 (0.85) 31.1 (0.51) 10.3 (0.15) Insured . . . . . . . . . . . . . . . . . . . . . . 64.6 (0.65) 85.4 (0.63) 81.7 (1.14) 63.5 (1.02) 81.3 (0.85) 68.9 (0.51) 89.7 (0.15)
* Estimate has a relative standard error of 30% or higher and should be used with caution as it does not meet the standard of reliability or precision. 1Poverty status is based on family income and family size using the U.S. Census Bureau’s poverty thresholds for the previous calendar year. ‘‘Poor’’ persons are defined as below the povertythreshold, ‘‘near poor’’ persons have incomes of 100% to less than 200% of the poverty threshold, and ‘‘not poor’’ persons have incomes that are 200% of the poverty threshold or greater.2MSA is metropolitan statistical area.3Highest educational attainment is shown only for persons aged 25 years and over.4U.S.-born refers to persons born in the 50 States of the United States, the District of Columbia, Puerto Rico, Guam, and other outlying territories of the United States. Foreign-born refers topersons born outside the 50 States of the United States, the other outlying territories of the United States. Foreign-born refers to persons born outside the 50 States of the United States, the

10 Advance Data No. 354 + May 12, 2005
District of Columbia, Puerto Rico, Guam, and other outlying territories of the United States. 5Includes only those who were not born in the United States. 6Health insurance coverage is based on a hierarchy of mutually exclusive categories. The category ‘‘Uninsured’’ includes those who had no coverage as well as those who had only Indian Health Service coverage or had only a private plan that paid for one type of service.
DATA SOURCE: 2000–03 National Health Interview Surveys.
Table 2. Age-adjusted percent distribution (with standard errors) of the time since last dental visit by Hispanic or Latino persons in five subgroups and of non-Hispanic white persons: United States, 2000–2003
Central Other All Age group and time Puerto or South Hispanic Hispanic Non-Hispanic since last dental visit Mexican Rican Cuban American or Latino or Latino white
Age-adjusted percent distribution1 (standard error) Children aged 2–17 years
Total. . . . . . . . . . . . . . . . . . . . . . . . 100.0 (0.00) 100.0 (0.00) 100.0 (0.00) 100.0 (0.00) 100.0 (0.00) 100.0 (0.00) 100.0 (0.00)
12 months or less . . . . . . . . . . . . . . . 59.7 (0.79) 71.8 (1.67) 69.6 (2.70) 65.7 (1.49) 70.5 (1.81) 62.7 (0.64) 78.6 (0.31) More than 12 months . . . . . . . . . . . . . 22.6 (0.61) 14.5 (1.31) 14.3 (2.22) 19.0 (1.24) 15.1 (1.43) 20.6 (0.50) 9.5 (0.23) Never . . . . . . . . . . . . . . . . . . . . . . . 17.7 (0.61) 13.8 (1.08) 16.1 (1.71) 15.4 (0.94) 14.4 (1.11) 16.7 (0.46) 11.9 (0.20)
Adults aged 18 years and over
Total. . . . . . . . . . . . . . . . . . . . . . . . 100.0 (0.00) 100.0 (0.00) 100.0 (0.00) 100.0 (0.00) 100.0 (0.00) 100.0 (0.00) 100.0 (0.00)
12 months or less . . . . . . . . . . . . . . . 43.9 (0.63) 55.5 (1.39) 59.9 (1.92) 55.8 (1.32) 59.6 (1.50) 49.0 (0.52) 66.8 (0.28) More than 12 months . . . . . . . . . . . . . 50.4 (0.63) 43.1 (1.39) 37.9 (2.01) 40.6 (1.30) 38.3 (1.54) 46.5 (0.51) 32.9 (0.28) Never . . . . . . . . . . . . . . . . . . . . . . . 5.7 (0.32) 1.4 (0.31) *2.2 (0.85) 3.6 (0.42) 2.1 (0.59) 4.5 (0.22) 0.3 (0.02)
* Estimate has a relative standard error of 30% or higher and should be used with caution as it does not meet the standard of reliability or precision.1Age-adjusted estimates for adults aged 18 and over are adjusted to the projected year 2000 standard U.S. population using three age groups: 18–44 years, 45–64 years, and 65 years and over.For children, three age groups were used: 2–4 years, 5–11 years, and 12–17 years.
DATA SOURCE: 2000–03 National Health Interview Surveys.

11 Advance Data No. 354 + May 12, 2005
Table 3. Age-adjusted percent (with standard errors) of Hispanic or Latino adults in five subgroups and of non-Hispanic white adults aged 18 and over who had visited a dentist in the past year, by selected demographic characteristics: United States, 2000–2003
Central or Other All Non-South Hispanic Hispanic Hispanic
Selected characteristic Mexican Puerto Rican Cuban American or Latino or Latino white
Age-adjusted percent1 (standard error)
Total. . . . . . . . . . . . . . . . . . . . . . . . 43.9 (0.63) 55.5 (1.39) 59.9 (1.92) 55.8 (1.32) 59.6 (1.50) 49.0 (0.52) 66.8 (0.28)
Sex
Male . . . . . . . . . . . . . . . . . . . . . . . 38.6 (0.91) 51.8 (2.11) 56.3 (2.89) 52.8 (2.08) 52.9 (2.47) 43.9 (0.74) 63.4 (0.36) Female . . . . . . . . . . . . . . . . . . . . . . 49.3 (0.82) 58.9 (1.74) 63.0 (2.25) 58.8 (1.62) 65.2 (1.76) 54.0 (0.63) 70.2 (0.33)
Age
18–44 years . . . . . . . . . . . . . . . . . . . 42.1 (0.72) 45–64 years . . . . . . . . . . . . . . . . . . . 49.5 (1.11) 65+ years . . . . . . . . . . . . . . . . . . . . 39.4 (1.90)
57.7 (1.70) 60.8 (2.64) 54.6 (1.44) 61.1 (2.19) 47.3 (0.62) 67.5 (0.34) 57.5 (2.60) 60.4 (3.13) 59.8 (2.26) 63.4 (2.68) 54.0 (0.89) 69.8 (0.40) 45.3 (3.92) 56.0 (3.56) 52.4 (4.38) 48.4 (4.17) 45.3 (1.41) 59.4 (0.53)
Poverty status2
Poor. . . . . . . . . . . . . . . . . . . . . . . . 31.7 (1.20) Near poor . . . . . . . . . . . . . . . . . . . . 37.2 (1.24) Not poor . . . . . . . . . . . . . . . . . . . . . 57.3 (1.12) Unknown . . . . . . . . . . . . . . . . . . . . . 41.5 (1.26)
46.0 (2.83) 45.7 (4.55) 43.4 (2.97) 48.0 (2.97) 36.4 (0.98) 46.6 (1.09) 46.4 (3.19) 44.7 (3.76) 43.0 (2.53) 54.8 (3.75) 40.4 (0.99) 48.0 (0.60) 63.6 (2.22) 69.7 (2.53) 64.8 (2.14) 68.2 (2.32) 61.4 (0.81) 71.8 (0.28) 55.5 (2.98) 59.0 (4.15) 55.9 (2.52) 53.6 (3.40) 46.6 (1.01) 68.1 (0.49)
Region
Northeast . . . . . . . . . . . . . . . . . . . . 40.4 (4.32) Midwest . . . . . . . . . . . . . . . . . . . . . 47.3 (2.09) South . . . . . . . . . . . . . . . . . . . . . . . 35.4 (1.03) West . . . . . . . . . . . . . . . . . . . . . . . 48.5 (0.84)
59.4 (1.71) 68.7 (4.78) 61.6 (2.27) 61.0 (2.39) 59.6 (1.18) 71.6 (0.53) 54.2 (4.45) 43.6 (9.61) 56.8 (4.43) 68.5 (8.20) 50.0 (1.81) 68.2 (0.46) 48.0 (3.03) 59.4 (2.21) 51.8 (2.33) 52.1 (3.95) 43.0 (0.87) 61.9 (0.56) 53.8 (5.35) 55.2 (5.99) 55.2 (2.31) 60.1 (2.26) 50.1 (0.77) 68.9 (0.55)
Place of residence3
MSA . . . . . . . . . . . . . . . . . . . . . . . 44.8 (0.67) Central city . . . . . . . . . . . . . . . . . . 42.6 (0.99) Not central city . . . . . . . . . . . . . . . . 47.2 (0.99)
Not MSA . . . . . . . . . . . . . . . . . . . . . 36.4 (1.69)
55.6 (1.41) 60.3 (1.95) 56.2 (1.33) 60.7 (1.70) 49.9 (0.53) 69.4 (0.30) 54.5 (1.80) 52.5 (3.33) 52.3 (1.91) 62.3 (2.03) 47.3 (0.77) 67.5 (0.55) 57.2 (2.26) 62.8 (2.42) 59.2 (1.86) 59.1 (2.84) 52.5 (0.79) 70.2 (0.38) 57.4 (5.65) 52.1 (8.03) 36.9 (6.53) 52.5 (6.18) 39.0 (2.57) 58.6 (0.65)
Urban/rural
Urban . . . . . . . . . . . . . . . . . . . . . . . 44.3 (0.67) 55.4 (1.42) 59.9 (1.96) 55.6 (1.34) 60.4 (1.59) 49.5 (0.53) 69.0 (0.31) Rural . . . . . . . . . . . . . . . . . . . . . . . 40.3 (1.73) 58.6 (6.16) 55.6 (9.39) 57.8 (6.43) 51.5 (6.39) 44.3 (1.75) 62.4 (0.54)
Highest education4
Less than high school diploma . . . . . . . 35.0 (0.83) High school or GED5 . . . . . . . . . . . . . 52.1 (1.47) More than high school. . . . . . . . . . . . . 62.2 (1.38)
43.7 (2.37) 45.1 (3.70) 40.3 (2.08) 52.2 (3.13) 37.5 (0.70) 41.8 (0.77) 60.5 (2.68) 59.0 (3.68) 56.4 (2.77) 62.1 (3.09) 55.4 (1.03) 60.3 (0.42) 65.1 (2.75) 68.2 (2.69) 68.8 (2.11) 68.1 (2.45) 65.1 (0.91) 75.8 (0.27)
Citizenship U.S. citizen . . . . . . . . . . . . . . . . . . . 51.0 (0.83) 56.1 (1.38) 68.8 (2.13) 68.2 (1.71) 60.1 (1.72) 55.8 (0.63) 66.9 (0.28) Not U.S. citizen . . . . . . . . . . . . . . . . . 33.8 (1.02) 45.6 (9.44) 38.6 (2.81) 46.4 (1.86) 56.3 (3.28) 37.8 (0.86) 63.1 (1.60)
Nativity6
U.S.-born. . . . . . . . . . . . . . . . . . . . . 51.3 (0.97) 56.1 (1.39) 73.0 (4.43) 65.8 (4.70) 59.2 (1.88) 54.3 (0.76) 66.7 (0.29) Foreign-born. . . . . . . . . . . . . . . . . . . 38.0 (0.83) 37.7 (7.61) 55.1 (2.23) 54.5 (1.35) 60.2 (2.46) 45.2 (0.69) 69.1 (1.03)
Years in United States7
Less than 5 years . . . . . . . . . . . . . . . 25.6 (3.26) 5–10 years. . . . . . . . . . . . . . . . . . . . 25.0 (2.09) 10 years or more . . . . . . . . . . . . . . . . 43.5 (1.04)
60.3 (5.56) 29.7 (4.05) 41.5 (4.11) 65.2 (8.21) 32.5 (2.17) 58.2 (4.18) 42.3 (7.19) 35.2 (4.60) 55.2 (4.01) 64.3 (6.41) 38.0 (1.95) 70.6 (3.10) 54.2 (2.10) 61.7 (2.95) 60.0 (1.52) 60.8 (2.90) 50.8 (0.75) 69.5 (1.05)
Health insurance8
Uninsured . . . . . . . . . . . . . . . . . . . . 25.7 (1.20) 32.0 (2.87) 37.0 (4.16) 40.0 (2.68) 40.5 (3.82) 30.6 (1.21) 42.3 (1.19) Insured . . . . . . . . . . . . . . . . . . . . . . 54.9 (0.75) 60.0 (1.49) 66.9 (2.06) 67.4 (1.45) 64.5 (1.68) 59.2 (0.57) 70.5 (0.27)
1Age-adjusted estimates for adults aged 18 and over are adjusted to the projected year 2000 standard U.S. population using three age groups: 18–44 years, 45–64 years, and 65 years and over.2Poverty status is based on family income and family size using the U.S. Census Bureau’s poverty thresholds for the previous calendar year. ‘‘Poor’’ persons are defined as below the povertythreshold, ‘‘near poor’’ persons have incomes of 100% to less than 200% of the poverty threshold, and ‘‘not poor’’ persons have incomes that are 200% of the poverty threshold or greater.3MSA is metropolitan statistical area.4Highest educational attainment is shown only for persons aged 25 years and over.5GED is General Educational Development high school equivalency diploma.6U.S.-born refers to persons born in the 50 States of the United States, the District of Columbia, Puerto Rico, Guam, and other outlying territories of the United States. Foreign-born refers topersons born outside the 50 States of the United States, the District of Columbia, Puerto Rico, Guam, and other outlying territories of the United States.7Includes only those who were not born in the United States.8Health insurance coverage is based on a hierarchy of mutually exclusive categories. The category ‘‘Uninsured’’ includes those who had no coverage as well as those who had only Indian HealthService coverage or had only a private plan that paid for one type of service.
DATA SOURCE: 2000–03 National Health Interview Surveys.

12 Advance Data No. 354 + May 12, 2005
Table 4. Age-adjusted percent (with standard errors) of Hispanic or Latino children in five subgroups and of non-Hispanic white children aged 2–17 years who had visited a dentist in the past year, by selected demographic characteristics: United States, 2000–2003
Central or Other All Non-South Hispanic Hispanic Hispanic
Selected characteristic Mexican Puerto Rican Cuban American or Latino or Latino white
Age-adjusted percent1 (standard error)
Total. . . . . . . . . . . . . . . . . . . . . . . . 59.7 (0.79) 71.8 (1.67) 69.6 (2.70) 65.7 (1.49) 70.5 (1.81) 62.7 (0.64) 78.6 (0.31)
Sex
Male . . . . . . . . . . . . . . . . . . . . . . . 58.2 (0.99) 72.1 (2.19) 65.3 (4.11) 64.3 (2.10) 69.4 (2.52) 61.5 (0.82) 78.3 (0.42) Female . . . . . . . . . . . . . . . . . . . . . . 61.3 (0.99) 71.5 (2.46) 73.0 (3.20) 67.2 (2.05) 71.7 (2.23) 64.1 (0.81) 78.8 (0.42)
Age
2–4 years . . . . . . . . . . . . . . . . . . . . 39.4 (1.60) 5–11 years . . . . . . . . . . . . . . . . . . . . 66.6 (1.07) 12–17 years . . . . . . . . . . . . . . . . . . . 61.3 (1.20)
40.2 (3.99) 34.5 (6.48) 42.0 (3.40) 40.8 (4.12) 39.7 (1.28) 44.7 (0.89) 80.5 (2.33) 75.3 (4.49) 73.2 (2.08) 76.8 (2.66) 69.7 (0.88) 86.0 (0.44) 76.7 (2.42) 79.7 (3.51) 68.2 (2.63) 77.3 (2.71) 65.6 (0.97) 86.1 (0.43)
Poverty status2
Poor. . . . . . . . . . . . . . . . . . . . . . . . 53.9 (1.45) 64.0 (3.60) 67.2 (7.25) 59.9 (3.81) 73.9 (3.42) 57.4 (1.25) 65.3 (1.53) Near poor . . . . . . . . . . . . . . . . . . . . 55.7 (1.42) 71.7 (3.20) 50.0 (7.09) 62.9 (2.73) 66.9 (3.65) 58.5 (1.15) 68.1 (0.95) Not poor . . . . . . . . . . . . . . . . . . . . . 69.8 (1.23) 76.2 (2.36) 75.3 (3.28) 69.2 (2.61) 73.0 (2.59) 71.1 (0.93) 82.1 (0.34) Unknown . . . . . . . . . . . . . . . . . . . . . 58.6 (1.33) 73.9 (3.38) 71.5 (5.40) 66.7 (2.80) 66.1 (4.17) 61.9 (1.10) 79.6 (0.65)
Region
Northeast . . . . . . . . . . . . . . . . . . . . 70.7 (5.61) Midwest . . . . . . . . . . . . . . . . . . . . . 63.6 (3.32) South . . . . . . . . . . . . . . . . . . . . . . . 55.3 (1.49) West . . . . . . . . . . . . . . . . . . . . . . . 61.4 (0.89)
73.4 (2.06) 76.6 (7.72) 71.3 (2.76) 75.4 (2.31) 73.2 (1.35) 83.3 (0.60) 76.1 (4.94) 84.3 (9.44) 71.9 (5.66) 52.1 (7.57) 65.1 (2.53) 80.0 (0.54) 65.5 (3.93) 68.8 (3.06) 59.9 (2.50) 64.2 (3.66) 57.9 (1.21) 74.3 (0.60) 74.1 (5.30) 58.0 (10.32) 65.9 (2.62) 71.2 (3.65) 62.3 (0.88) 78.8 (0.67)
Place of residence3
MSA . . . . . . . . . . . . . . . . . . . . . . . 60.4 (0.76) Central city . . . . . . . . . . . . . . . . . . 58.8 (1.19) Not central city . . . . . . . . . . . . . . . . 61.9 (1.03)
Not MSA . . . . . . . . . . . . . . . . . . . . . 54.1 (3.04)
72.2 (1.68) 70.2 (2.70) 65.8 (1.51) 69.9 (1.72) 63.4 (0.60) 79.9 (0.34) 72.6 (2.30) 71.0 (4.98) 62.1 (2.23) 70.4 (2.35) 62.2 (0.94) 78.6 (0.72) 71.6 (2.42) 70.1 (3.15) 68.0 (2.00) 69.4 (2.55) 64.5 (0.81) 80.3 (0.39) 64.1 (9.46) 50.0 (6.30) 61.9 (8.78) 79.6 (7.21) 56.2 (3.16) 74.4 (0.69)
Urban/rural
Urban . . . . . . . . . . . . . . . . . . . . . . . 60.0 (0.81) 71.8 (1.73) 69.3 (2.68) 65.4 (1.54) 69.8 (1.80) 63.0 (0.65) 79.8 (0.37) Rural . . . . . . . . . . . . . . . . . . . . . . . 57.4 (2.15) 72.3 (5.36) 42.9 (10.65) 70.6 (5.86) 79.4 (5.50) 60.3 (1.92) 76.4 (0.56)
Highest education4
Less than high school diploma . . . . . . . 64.2 (0.86) 78.6 (1.78) 77.6 (2.97) 71.0 (1.64) 77.6 (1.92) 67.8 (0.71) 86.0 (0.31) High school or GED5 . . . . . . . . . . . . . 54.2 (9.61) 83.6 (16.10) *49.7 (30.51) 58.7 (17.36) *43.3 (13.63) 54.3 (7.44) 84.4 (3.43) More than high school. . . . . . . . . . . . . *66.5 (26.28) 0.00 (0.00) 0.00 (0.00) 0.00 (0.00) 0.00 (0.00) 85.6 (13.64) 88.6 (10.51)
Citizenship
U.S. citizen . . . . . . . . . . . . . . . . . . . 64.0 (0.78) 72.1 (1.67) 71.6 (3.00) 70.7 (1.69) 71.0 (1.87) 66.4 (0.64) 78.6 (0.31) Not U.S. citizen . . . . . . . . . . . . . . . . . 35.9 (1.92) *24.7 (12.20) 54.7 (4.95) 52.0 (3.38) 66.6 (7.03) 40.9 (1.71) 74.6 (3.36)
Nativity6
U.S.-born. . . . . . . . . . . . . . . . . . . . . 64.1 (0.77) 72.0 (1.67) 72.1 (3.07) 70.9 (1.76) 71.2 (1.88) 66.5 (0.64) 78.6 (0.31) Foreign-born. . . . . . . . . . . . . . . . . . . 37.0 (1.94) *26.2 (11.31) 54.1 (4.68) 54.8 (3.17) 64.2 (7.27) 42.7 (1.69) 77.3 (2.82)
Years in United States7
Less than 5 years . . . . . . . . . . . . . . . 31.3 (2.45) 5–10 years. . . . . . . . . . . . . . . . . . . . 42.6 (3.38) 10 years or more . . . . . . . . . . . . . . . . 59.9 (6.25)
71.4 (5.51) 53.9 (5.55) 51.2 (3.75) 67.0 (10.03) 40.6 (2.07) 79.1 (2.92) 74.3 (7.60) 69.6 (9.09) 57.7 (7.09) 75.9 (7.12) 52.0 (2.71) 84.7 (3.89) 85.8 (4.06) 100.0 (0.00) 62.8 (12.98) 26.8 (7.78) 63.0 (5.35) 75.4 (8.29)
Health insurance8
Uninsured . . . . . . . . . . . . . . . . . . . . 38.2 (1.35) 56.9 (5.21) 46.7 (7.38) 48.7 (3.09) 47.4 (4.82) 40.7 (1.20) 56.4 (1.35) Insured . . . . . . . . . . . . . . . . . . . . . . 68.3 (0.82) 73.2 (1.74) 72.4 (2.81) 71.6 (1.64) 73.9 (1.84) 69.9 (0.65) 80.3 (0.29)
* Estimate has a relative standard error of 30% or higher and should be used with caution as it does not meet the standard of reliability or precision.1Age-adjusted estimates for children are adjusted to the projected year 2000 standard U.S. population using three age groups: 2–4 years, 5–11 years, and 12–17 years.2Poverty status is based on family income and family size using the U.S. Census Bureau’s poverty thresholds for the previous calendar year. ‘‘Poor’’ persons are defined as below the povertythreshold, ‘‘near poor’’ persons have incomes of 100% to less than 200% of the poverty threshold, and ‘‘not poor’’ persons have incomes that are 200% of the poverty threshold or greater.3MSA is metropolitan statistical area.4Highest educational attainment is shown only for persons aged 25 years and over.5GED is General Educational Development high school equivalency diploma.6U.S.-born refers to persons born in the 50 States of the United States, the District of Columbia, Puerto Rico, Guam, and other outlying territories of the United States. Foreign-born refers topersons born outside the 50 States of the United States, the District of Columbia, Puerto Rico, Guam, and other outlying territories of the United States.7Includes only those who were not born in the United States.8Health insurance coverage is based on a hierarchy of mutually exclusive categories. The category ‘‘Uninsured’’ includes those who had no coverage as well as those who had only Indian HealthService coverage or had only a private plan that paid for one type of service.
DATA SOURCE: 2000–03 National Health Interview Surveys.

13 Advance Data No. 354 + May 12, 2005
Table 5. Age-adjusted percent (with standard errors) of Hispanic or Latino adults in five subgroups and of non-Hispanic white adults aged 18 and over who had unmet dental care needs due to cost, by selected demographic characteristics: United States, 2000–2003
Central or Other All Non-South Hispanic Hispanic Hispanic
Selected characteristic Mexican Puerto Rican Cuban American or Latino or Latino white
Age-adjusted percent1 (standard error)
Total. . . . . . . . . . . . . . . . . . . . . . . . 12.3 (0.45) 10.0 (0.84) 5.5 (0.89) 10.2 (0.71) 10.3 (0.95) 11.1 (0.32) 9.2 (0.15)
Sex
Male . . . . . . . . . . . . . . . . . . . . . . . 9.8 (0.54) 9.5 (1.21) 4.1 (1.14) 8.9 (1.28) 7.9 (1.22) 9.1 (0.39) 8.0 (0.19) Female . . . . . . . . . . . . . . . . . . . . . . 14.9 (0.62) 10.5 (1.04) 6.8 (1.26) 11.6 (0.93) 12.2 (1.44) 13.1 (0.45) 10.3 (0.21)
Age
18–44 years . . . . . . . . . . . . . . . . . . . 12.1 (0.47) 45–64 years . . . . . . . . . . . . . . . . . . . 14.4 (0.85) 65 years and over . . . . . . . . . . . . . . . 9.4 (1.06)
11.0 (1.01) 5.5 (1.26) 11.1 (0.80) 12.0 (1.35) 11.6 (0.37) 11.6 (0.22) 9.9 (1.48) 6.2 (1.73) 9.4 (1.23) 9.1 (1.47) 12.0 (0.60) 8.3 (0.21)
*7.1 (2.17) *4.3 (1.75) 8.6 (2.52) 7.0 (2.09) 7.9 (0.77) 3.1 (0.15)
Poverty status2
Poor. . . . . . . . . . . . . . . . . . . . . . . . 18.6 (1.16) Near poor . . . . . . . . . . . . . . . . . . . . 15.6 (0.91) Not poor . . . . . . . . . . . . . . . . . . . . . 8.3 (0.55) Unknown . . . . . . . . . . . . . . . . . . . . . 10.4 (0.75)
13.0 (2.32) *7.7 (2.92) 19.4 (2.62) 14.2 (2.30) 17.1 (0.89) 20.5 (0.82) 14.6 (2.20) *4.4 (1.45) 12.2 (1.47) 19.7 (2.91) 14.4 (0.67) 20.8 (0.55) 7.4 (0.98) 4.6 (1.24) 5.3 (0.68) 5.9 (1.11) 7.2 (0.40) 6.9 (0.15) 9.4 (1.39) *7.9 (2.39) 11.8 (1.59) 8.2 (1.62) 10.2 (0.57) 7.3 (0.27)
Region
Northeast . . . . . . . . . . . . . . . . . . . . *8.0 (2.62) Midwest . . . . . . . . . . . . . . . . . . . . . 11.9 (1.49) South . . . . . . . . . . . . . . . . . . . . . . . 14.5 (0.77) West . . . . . . . . . . . . . . . . . . . . . . . 11.1 (0.59)
7.7 (0.86) *11.0 (3.57) 10.5 (1.39) 8.0 (1.33) 8.6 (0.59) 8.0 (0.28) 13.4 (2.70) *12.3 (7.20) 7.6 (2.20) *15.4 (5.00) 11.7 (1.16) 8.1 (0.25) 14.6 (2.40) 4.3 (0.88) 8.0 (0.97) 12.9 (2.39) 12.0 (0.54) 9.8 (0.31)
8.4 (2.12) *7.0 (3.46) 12.8 (1.37) 10.4 (1.53) 11.1 (0.55) 11.3 (0.37)
Place of residence3
MSA . . . . . . . . . . . . . . . . . . . . . . . 12.0 (0.43) Central city . . . . . . . . . . . . . . . . . . 12.4 (0.69) Non central city . . . . . . . . . . . . . . . 11.5 (0.57)
Not MSA . . . . . . . . . . . . . . . . . . . . . 15.0 (2.05)
10.0 (0.85) 5.1 (0.88) 10.1 (0.72) 10.1 (0.99) 10.8 (0.30) 8.7 (0.17) 8.9 (0.98) 5.0 (1.41) 11.6 (1.09) 9.1 (1.21) 11.1 (0.47) 9.7 (0.31)
11.5 (1.38) 5.2 (1.09) 9.0 (0.96) 11.8 (1.74) 10.5 (0.43) 8.3 (0.21) *9.7 (3.64) *16.6 (5.17) 10.9 (3.19) *11.6 (3.73) 14.2 (2.15) 10.8 (0.33)
Urban/rural
Urban . . . . . . . . . . . . . . . . . . . . . . . 11.9 (0.44) 10.0 (0.87) 5.4 (0.91) 10.5 (0.74) 10.2 (0.93) 10.9 (0.32) 8.9 (0.17) Rural . . . . . . . . . . . . . . . . . . . . . . . 14.9 (1.36) 9.1 (2.51) *6.9 (4.02) *3.5 (1.57) *10.3 (3.71) 13.2 (1.19) 9.7 (0.29)
Highest education4
Less than high school diploma . . . . . . . 12.9 (0.65) High school or GED5 . . . . . . . . . . . . . 12.1 (0.94) More than high school. . . . . . . . . . . . . 11.9 (1.03)
10.1 (1.84) *5.1 (1.83) 12.1 (1.39) 12.4 (2.03) 12.1 (0.54) 15.1 (0.55) 8.3 (1.52) *7.7 (2.32) 10.1 (1.58) 9.3 (1.96) 10.8 (0.67) 10.0 (0.25)
10.8 (1.37) 4.6 (1.19) 7.8 (1.29) 10.6 (1.60) 10.0 (0.58) 7.4 (0.16)
Citizenship
U.S. citizen . . . . . . . . . . . . . . . . . . . 12.7 (0.57) 10.1 (0.86) 4.8 (0.98) 7.1 (0.82) 10.3 (1.08) 10.9 (0.40) 9.2 (0.15) Not U.S. citizen . . . . . . . . . . . . . . . . . 11.7 (0.63) *5.0 (2.89) 6.3 (1.52) 12.5 (1.14) 11.1 (2.42) 11.5 (0.52) 9.5 (0.93)
Nativity6
U.S.-born. . . . . . . . . . . . . . . . . . . . . 13.5 (0.68) 10.2 (0.87) 6.4 (2.35) 7.8 (1.94) 11.3 (1.38) 12.1 (0.53) 9.2 (0.16) Foreign-born. . . . . . . . . . . . . . . . . . . 11.4 (0.54) *4.5 (2.05) 5.6 (1.07) 10.4 (0.74) 8.9 (1.33) 10.4 (0.39) 8.8 (0.68)
Years in United States7
Less than 5 years . . . . . . . . . . . . . . . 9.1 (1.51) 5–10 years. . . . . . . . . . . . . . . . . . . . 10.1 (1.30) 10 years or more . . . . . . . . . . . . . . . . 12.1 (0.64)
*9.4 (3.27) *6.0 (2.33) 9.9 (2.02) *11.1 (5.80) 9.2 (1.07) 7.7 (1.66) *8.4 (3.56) 9.9 (3.44) 13.7 (2.26) *5.8 (2.23) 10.9 (1.04) 10.8 (1.83) 8.9 (1.17) 3.9 (0.91) 9.2 (0.88) 9.2 (1.55) 10.2 (0.42) 9.0 (0.72)
Health insurance8
Uninsured . . . . . . . . . . . . . . . . . . . . 17.2 (0.81) 20.2 (2.27) 14.2 (3.36) 20.0 (2.29) 19.6 (2.24) 18.6 (0.96) 27.2 (0.74) Insured . . . . . . . . . . . . . . . . . . . . . . 8.1 (0.42) 7.2 (0.79) 3.0 (0.74) 5.1 (0.61) 7.1 (0.91) 7.0 (0.29) 6.4 (0.13)
* Estimate has a relative standard error of 30% or higher and should be used with caution as it does not meet the standard of reliability or precision.1Age-adjusted estimates for adults aged 18 and over are adjusted to the projected year 2000 standard U.S. population using three age groups: 18–44 years, 45–64 years, and 65 years and over.2Poverty status is based on family income and family size using the U.S. Census Bureau’s poverty thresholds for the previous calendar year. ‘‘Poor’’ persons are defined as below the povertythreshold, ‘‘near poor’’ persons have incomes of 100% to less than 200% of the poverty threshold, and ‘‘not poor’’ persons have incomes that are 200% of the poverty threshold or greater.3MSA is metropolitan statistical area.4Highest educational attainment is shown only for persons aged 25 years and over.5GED is General Educational Development high school equivalency diploma.6U.S.-born refers to persons born in the 50 States of the United States, the District of Columbia, Puerto Rico, Guam, and other outlying territories of the United States. Foreign-born refers topersons born outside the 50 States of the United States, the District of Columbia, Puerto Rico, Guam, and other outlying territories of the United States.7Includes only those who were not born in the United States.8Health insurance coverage is based on a hierarchy of mutually exclusive categories. The category ‘‘Uninsured’’ includes those who had no coverage as well as those who had only Indian HealthService coverage or had only a private plan that paid for one type of service.
DATA SOURCE: 2000–03 National Health Interview Surveys.

14 Advance Data No. 354 + May 12, 2005
Table 6. Age-adjusted percent (with standard errors) of Hispanic or Latino children in five subgroups and of non-Hispanic white children aged 2–17 years who had unmet dental care needs due to cost, by selected demographic characteristics: United States, 2000–2003
Central or Other All Non-South Hispanic Hispanic Hispanic
Selected characteristic Mexican Puerto Rican Cuban American or Latino or Latino white
Age-adjusted percent1 (standard error)
Total. . . . . . . . . . . . . . . . . . . . . . . . 8.8 (0.43) 5.1 (0.74) *3.8 (1.27) 7.7 (0.95) 6.4 (0.96) 8.0 (0.33) 5.6 (0.19)
Sex
Male . . . . . . . . . . . . . . . . . . . . . . . 8.6 (0.59) 5.2 (0.96) *2.8 (1.84) 8.0 (1.17) 7.0 (1.41) 7.9 (0.45) 5.0 (0.24) Female . . . . . . . . . . . . . . . . . . . . . . 8.9 (0.57) 4.9 (1.11) *4.7 (1.76) 7.5 (1.50) 5.8 (1.13) 8.0 (0.46) 6.3 (0.29)
Age
2–4 years . . . . . . . . . . . . . . . . . . . . 4.1 (0.60) 5–11 years . . . . . . . . . . . . . . . . . . . . 9.0 (0.54) 12–17 years . . . . . . . . . . . . . . . . . . . 10.7 (0.80)
*4.1 (1.65) 0.00(0.00) *3.2 (1.28) *2.0 (1.00) 3.8 (0.45) 2.7 (0.29) 5.1 (1.06) *6.3 (2.62) 7.3 (1.20) 8.5 (1.65) 8.4 (0.44) 5.4 (0.27) 5.5 (1.28) *2.7 (1.06) 10.5 (1.92) 6.0 (1.45) 9.5 (0.61) 7.2 (0.32)
Poverty status2
Poor. . . . . . . . . . . . . . . . . . . . . . . . 10.6 (0.91) Near poor . . . . . . . . . . . . . . . . . . . . 11.6 (0.84) Not poor . . . . . . . . . . . . . . . . . . . . . 6.3 (0.77) Unknown . . . . . . . . . . . . . . . . . . . . . 6.8 (0.68)
5.8 (1.46) *3.8 (2.98) 14.8 (2.84) 7.4 (2.03) 10.0 (0.72) 12.7 (1.08) 8.4 (1.90) *2.3 (1.28) 9.8 (1.76) 8.2 (1.99) 10.7 (0.67) 12.2 (0.69) 2.9 (0.83) *4.2 (1.82) *5.5 (1.69) *4.0 (1.22) 5.5 (0.56) 3.9 (0.20)
*3.9 (1.53) *2.7 (2.62) 4.6 (1.25) 7.1 (1.98) 6.2 (0.54) 3.9 (0.31)
Region
Northeast . . . . . . . . . . . . . . . . . . . . *11.6 (5.04) Midwest . . . . . . . . . . . . . . . . . . . . . 8.4 (1.34) South . . . . . . . . . . . . . . . . . . . . . . . 11.2 (0.89) West . . . . . . . . . . . . . . . . . . . . . . . 7.4 (0.48)
4.4 (0.88) *7.0 (4.92) 8.4 (2.05) 3.3 (0.90) 5.5 (0.77) 4.6 (0.37) *10.2 (3.44) 0.0 (0.00) *5.8 (3.71) *11.1 (6.67) 8.3 (1.09) 5.4 (0.37) *5.0 (1.52) *3.5 (1.43) 5.4 (1.17) 8.0 (2.33) 9.4 (0.66) 5.8 (0.33) *5.0 (2.39) *3.7 (2.84) 10.2 (1.70) 8.0 (1.81) 7.7 (0.45) 6.8 (0.50)
Place of residence3
MSA . . . . . . . . . . . . . . . . . . . . . . . 8.6 (0.44) Central city . . . . . . . . . . . . . . . . . . 8.1 (0.57) Not central city . . . . . . . . . . . . . . . . 9.0 (0.65)
Not MSA . . . . . . . . . . . . . . . . . . . . . 10.4 (1.45)
4.8 (0.72) *3.8 (1.30) 7.6 (0.95) 5.9 (0.90) 7.7 (0.34) 5.1 (0.22) 4.0 (0.86) *6.2 (3.05) 8.8 (1.75) 5.0 (1.11) 7.4 (0.45) 5.2 (0.41) 6.0 (1.22) *3.1 (1.41) 6.7 (1.05) 6.9 (1.45) 8.0 (0.49) 5.1 (0.26)
*8.4 (5.20) *3.0 (3.36) *9.8 (5.27) *12.2 (7.41) 10.6 (1.32) 7.0 (0.40)
Urban/rural
Urban . . . . . . . . . . . . . . . . . . . . . . . 8.5 (0.42) 5.1 (0.75) *3.9 (1.29) 8.0 (0.99) 6.7 (1.03) 7.8 (0.33) 5.1 (0.22) Rural . . . . . . . . . . . . . . . . . . . . . . . 10.7 (1.47) *5.2 (3.53) 0.0 (0.00) *2.9 (1.71) *2.1 (1.10) 9.4 (1.25) 6.5 (0.36)
Highest education4
Less than high school diploma . . . . . . . 9.9 (0.50) 5.3 (0.83) High school or GED5 . . . . . . . . . . . . . *6.6 (4.82) *16.4 (16.10) More than high school. . . . . . . . . . . . . *6.1 (6.52) 0.0 (0.00)
*4.7 (1.55) 8.9 (1.15) 7.4 (1.18) 9.0 (0.39) 6.3 (0.23) 0.0 (0.00) *10.9 (7.92) 0.0 (0.00) *6.5 (3.50) *6.1 (2.16) 0.0 (0.00) 0.0 (0.00) 0.0 (0.00) *2.6 (2.75) 0.0 (0.00)
Citizenship
U.S. citizen . . . . . . . . . . . . . . . . . . . 8.4 (0.46) 5.1 (0.75) *3.1 (1.25) 7.5 (1.17) 6.2 (1.00) 7.6 (0.36) 5.6 (0.19) Not U.S. citizen . . . . . . . . . . . . . . . . . 10.6 (1.06) 0.0 (0.00) *7.4 (3.84) 8.4 (1.65) *8.0 (3.22) 9.9 (0.84) 6.4 (1.85)
Nativity6
U.S.-born. . . . . . . . . . . . . . . . . . . . . 8.3 (0.46) 5.1 (0.75) *2.9 (1.25) 7.4 (1.25) 6.3 (1.02) 7.5 (0.36) 5.6 (0.19) Foreign-born. . . . . . . . . . . . . . . . . . . 11.1 (1.07) 0.0 (0.00) *7.7 (3.97) 8.2 (1.50) *6.5 (2.69) 10.1 (0.82) 5.8 (1.51)
Years in United States7
Less than 5 years . . . . . . . . . . . . . . . 10.6 (1.47) 5–10 years. . . . . . . . . . . . . . . . . . . . 12.8 (2.27) 10 years or more . . . . . . . . . . . . . . . . 17.7 (5.12)
*5.3 (3.66) *6.4 (4.33) 7.4 (1.85) *9.1 (5.68) 9.2 (1.05) *5.6 (1.94) *8.2 (4.23) *12.5 (9.69) *8.5 (3.37) *8.4 (4.09) 11.3 (1.62) *5.3 (2.03) *3.6 (2.08) 0.0 (0.00) *11.8 (5.63) 0.0 (0.00) 13.7 (3.39) *16.0 (8.13)
Health insurance8
Uninsured . . . . . . . . . . . . . . . . . . . . 16.2 (1.02) 14.4 (3.73) *8.2 (4.49) 15.5 (2.25) 16.8 (3.58) 16.0 (0.86) 20.0 (1.16) Insured . . . . . . . . . . . . . . . . . . . . . . 5.9 (0.43) 4.2 (0.72) *3.0 (1.26) 5.0 (1.03) 4.8 (0.93) 5.4 (0.32) 4.5 (0.17)
* Estimate has a relative standard error of 30% or higher and should be used with caution as it does not meet the standard of reliability or precision.1Age-adjusted estimates for children are adjusted to the projected year 2000 standard U.S. population using three age groups: 2–4 years, 5–11 years, and 12–17 years.2Poverty status is based on family income and family size using the U.S. Census Bureau’s poverty thresholds for the previous calendar year. ‘‘Poor’’ persons are defined as below the povertythreshold, ‘‘near poor’’ persons have incomes of 100% to less than 200% of the poverty threshold, and ‘‘not poor’’ persons have incomes that are 200% of the poverty threshold or greater.3MSA is metropolitan statistical area.4Highest educational attainment is shown only for persons aged 25 years and over.5GED is General Educational Development high school equivalency diploma.6U.S.-born refers to persons born in the 50 States of the United States, the District of Columbia, Puerto Rico, Guam, and other outlying territories of the United States. Foreign-born refers topersons born outside the 50 States of the United States, the District of Columbia, Puerto Rico, Guam, and other outlying territories of the United States.7Includes only those who were not born in the United States.8Health insurance coverage is based on a hierarchy of mutually exclusive categories. The category ‘‘Uninsured’’ includes those who had no coverage as well as those who had only Indian HealthService coverage or a private plan that paid for one type of service.
DATA SOURCE: 2000–03 National Health Interview Surveys.

15 Advance Data No. 354 + May 12, 2005
Technical Notes
Definitions of selected terms
Poverty status—Poverty status is based on family income and family size using the U.S. Census Bureau’s poverty thresholds. The ‘‘poor’’ category includes families defined as below the poverty threshold. The ‘‘near poor’’ category includes families with incomes of 100% to less than 200% of the poverty threshold. The ‘‘not poor’’ category includes families with incomes that are 200% of the poverty threshold or more.
Geographic region—In the geographic classification of the U.S. population, States are grouped into the four regions used by the U.S. Census Bureau:
Region States included
Northeast Connecticut, Maine, Massachusetts, New Hampshire, New Jersey, New York, Pennsylvania, Rhode Island, and Vermont;
Midwest Illinois, Indiana, Iowa, Kansas, Michigan, Minnesota, Missouri, Nebraska, North Dakota, Ohio, South Dakota, and Wisconsin;
South Alabama, Arkansas, Delaware, District of Columbia, Florida, Georgia, Kentucky, Louisiana, Maryland, Mississippi, North Carolina, Oklahoma, South Carolina, Tennessee, Texas, Virginia, and West Virginia;
West Alaska, Arizona, California, Colorado, Hawaii, Idaho, Montana, Nevada, New Mexico, Oregon, Utah, Washington, and Wyoming.
Place of residence—Place of residence is classified as either inside a metropolitan statistical area (MSA) or outside an MSA. Place of residence inside an MSA is further subdivided as either central city or not central city. Generally, an MSA consists of a county or group of counties containing at least one city (or twin cities) having a population of 50,000 or more plus
adjacent counties that are metropolitan in character and economically and socially integrated with the central city. In New England, towns and cities rather than counties are the units used in defining MSAs. There is no limit to the number of adjacent counties included in the MSA if they are integrated with the central city, nor is an MSA limited to a single State; MSA boundaries may cross State lines. Central city includes the largest city in a metropolitan statistical area. One or two additional cities may be secondary central cities on the basis of either of the following criteria: (a) The additional city or cities must have a population one-third or more of that of the largest city and a minimum population of 25,000, or (b) The additional city or cities must have at least 250,000 inhabitants. Not central city includes all of the MSA that is not part of the central city itself. Not MSA generally refers to areas where persons are not living in an MSA area.
Urban or rural—The assignment of ‘‘urban’’ or ‘‘rural’’ is based on the 1990 census designation.
Education—Education level is based on the highest grade in school completed or highest degree obtained. Only years completed in regular school, where persons are given a formal education, are included. A ‘‘regular’’ school is defined as one that advances a person toward an elementary or high school diploma or a college, university, or professional degree. Furthermore, education outside the regular school system, such as vocational, trade, or business school, is not included in determining the highest grade of school completed. In addition, participation in adult education classes not taken for credit in a regular school system is not included. The highest educational attainment among all adults in a family is used in this report to measure educational background of the parents (in most cases) or guardians. In the NHIS, the educational attainment is not ascertained for the parent who is not present in the family, if a child is living with only one parent.
Nativity—Nativity is categorized as U.S. born or foreign born. The foreign-born category includes persons born outside the 50 States of the United
States, the District of Columbia, Puerto Rico, Guam, and other outlying territories of the United States. The U.S.-born category refers to persons who were born in the 50 States of the United States, the District of Columbia, Puerto Rico, Guam, and other outlying territories of the United States.
Citizenship—Citizenship is categorized as to whether a person is a citizen of the United States. People are U.S. citizens if they were born in the 50 States or the District of Columbia, as well as persons born in the U.S.-held territories, born abroad to U.S. parents, and naturalized citizens.
Years in the United States—For persons who were not born in the United States, the NHIS collects information on the number of years they have resided in the United States. This report uses the categories ‘‘less than 5 years,’’ ‘‘5–10 years,’’ and ‘‘10 years or more.’’
Health insurance coverage—NHIS respondents are asked if they are covered by any kind of health insurance or health care plan at the time of the interview. Those who respond ‘‘yes’’ are asked what kind of health insurance or health care coverage they have and are shown a list that includes private health insurance from an employer or workplace, private health insurance purchased directly, Medicare, Medi-Gap (supplemental Medicare coverage), Medicaid, military or Veterans Administration health care (as well as CHAMPUS/TRICARE/CHAMP-VA), a State-sponsored health plan, or a government program (other than those already mentioned). People are classified as uninsured if they do not have coverage under private health insurance, Medicare, Medicaid, public assistance, a State-sponsored health plan, other government-sponsored programs, or a military health plan. Persons who had only Indian Health Service coverage are also considered uninsured.

16 Advance Data No. 354 + May 12, 2005
Suggested citation
Scott G, Simile C. Access to dental care among Hispanic or Latino subgroups: United States, 2000–03. Advance data from vital and health statistics; no 354. Hyattsville, Maryland: National Center for Health Statistics. 2005.
U.S. DEPARTMENT OF HEALTH & HUMAN SERVICES
Centers for Disease Control and Prevention National Center for Health Statistics 3311 Toledo Road Hyattsville, Maryland 20782
OFFICIAL BUSINESS PENALTY FOR PRIVATE USE, $300
To receive this publication regularly, contact the National Center for Health Statistics by calling 1-866-441-NCHS (6247) E-mail: [email protected] Internet: www.cdc.gov/nchs
DHHS Publication No. (PHS) 2005-1250 05-0183 (04/05)
Copyright information National Center for Health Statistics
All material appearing in this report is in the Director public domain and may be reproduced or Edward J. Sondik, Ph.D. copied without permission; citation as to source, however, is appreciated.
Acting Co-Deputy Directors Jennifer H. Madans, Ph.D.
Michael H. Sadagursky
FIRST CLASS POSTAGE & FEES PAID
CDC/NCHS PERMIT NO. G-284