Embed Size (px)
Citation preview

4
Adrenal Causes ofHypertension
The adrenal gland is involved in the production of a variety ofsteroid hormones and catecholamines that influence bloodpressure. Thus, it is not surprising that several adrenal disorders
may result in hypertension. Many of these disorders are potentiallycurable or responsive to specific therapies. Therefore, identifyingadrenal disorders is an important consideration when elevated bloodpressure occurs suddenly or in a young person, is severe or difficult totreat, or is associated with manifestations suggestive of a secondaryform of hypertension. Because these occurrences are relatively rare, itis necessary to have a high index of suspicion and understand thepathophysiology on which the diagnosis and treatment of these problemsis based.
Three general forms of hypertension that result from excessive produc-tion of mineralocorticoids, glucocorticoids, or catecholamines are reviewedin the context of their normal production, metabolism, and feedbacksystems. The organization of this chapter provides the background forunderstanding the normal physiology and pathophysiologic changeson which effective screening and diagnosis of adrenal abnormalities arebased. Therapeutic options also are briefly considered. Primary aldos-teronism, Cushing’s syndrome, and pheochromocytoma are discussed.
Myron H. Weinberger
C H A P T E R

4.2 Hypertension and the Kidney
Adrenal Hypertension
PHYSIOLOGIC MECHANISMS IN ADRENAL HYPERTENSION
Disorder
Primary aldosteronism
Cushing’s syndrome
Pheochromocytoma
Cause
Autonomous hypersecretionof aldosterone (hyperminer-alocorticoidism)
Hypersecretion of cortisol(hyperglucocorticoidism)
Hypersecretion of catecholamines
Pathophysiology
Increased renal sodium andwater reabsorption,increased urinary excretion of potassiumand hydrogen ions
Increased activation of mineralocorticoid receptor (?), increasedangiotensinogen (reninsubstrate) concentration
Vasoconstriction, increasedheart rate
Pressure mechanism
Extracellular fluid volumeexpansion, hypokalemia(?), alkalosis
Extracellular fluid volumeexpansion (?), increasedangiotensin II (vasocon-striction and increasedperipheral resistance)
Increased peripheral resistance, increased cardiac output
FIGURE 4-1
The causes and pathophysiologies of thethree major forms of adrenal hypertensionand the proposed mechanisms by whichblood pressure elevation results.
Histology of the Adrenal
Capsule
Zona
glomerulosa
Zona
fasciculata
Zona
reticularis
Medulla
Normal human
suprarenal gland
Human suprarenal
gland after
administration
of crude ACTH
FIGURE 4-2
Histology of the adrenal. A cross section of the normal adrenalbefore (left) and after (right) stimulation with adrenocorticotropichormone (ACTH) [1]. The adrenal is organized into the outeradrenal cortex and the inner adrenal medulla. The outer adrenalcortex is composed of the zona glomerulosa, zona fasciculata, andzona reticularis. The zona glomerulosa is responsible for produc-tion of aldosterone and other mineralocorticoids and is chieflyunder the control of angiotensin II (see Figs. 4-3 and 4-5). Thezona fasciculata and zona reticularis are influenced primarily byACTH and produce glucocorticoids and some androgens (see Figs.4-3 and 4-19). The adrenal medulla produces catecholamines andis the major source of epinephrine (in addition to the organ ofZuckerkandl located at the aortic bifurcation) (see Fig. 4-25.)

4.3Adrenal Causes of Hypertension
Adrenal Steroid Biosynthesis
17-HydroxypregnenolonePregnenolone Dehydroepiandrosterone
CH3
CH3
C=OC=OOH
OHOH
17-Hydroxypregnenolone
CH3
C=O–OH
OO
OH
OHOH
Pregnenolone
CH3
C=O
O
11-Deoxycortisol
CH2OH
C=OOH
O11-Deoxycorticosterone
OH2OH
C=O
O
Cortisol
CH2OH
C=OOH
OCorticosterone
18-Hydroxylase18-OH-Dehrydrogenase
CH2OH
C=O
O
OH
Aldosterone
CH2OH
C=O
O
O
∆4 Androstene 3,17-dione
O
OHC
21-Hydroxylase
11β-Hydroxylase
3 β-OH-Dehydrogenase: ∆5 ∆4 Isomerase
17α−H
ydro
xylase
Zonaglomerulosa
only}
FIGURE 4-3
Adrenal steroid biosynthesis. The sequence ofadrenal steroid biosynthesis beginning withcholesterol is shown as are the enzymesresponsible for production of specific steroids[2]. Note that aldosterone production nor-mally occurs only in the zona glomerulosa(see Fig. 4-2). (From DeGroot and coworkers[2]; with permission.)

4.4 Hypertension and the Kidney
Morning 6 AM Noon 6 PM Morning
Aldosterone
Cortisol
PRA
ACTH
FIGURE 4-4
Circadian rhythmicity of steroid production and major stimulatoryfactors. Aldosterone and cortisol and their respective major stimulatoryfactors, plasma renin activity (PRA) and adrenocorticotropic hormone(ACTH), demonstrate circadian rhythms. The lowest values for all ofthese components are normally seen during the sleep period when theneed for active steroid production is minimal. ACTH levels increaseearly before awakening, stimulating cortisol production in prepara-tion for the physiologic changes associated with arousal. PRA increas-es abruptly with the assumption of the upright posture, followed byan increase in aldosterone production and release. Both steroidsdemonstrate their highest values through the morning and early after-noon. Cortisol levels parallel those of ACTH, with a marked declinein the afternoon and evening hours. Aldosterone demonstrates abroader peak, reflecting the postural stimulus of PRA.
↓Perfusion pressure
↓Sodium content
↑Extracellular fluid volume
↑Sodium reabsorption
Aldosterone
Juxtaglomerularapparatus
Renin
Angiotensin II
Adrenal complex
Zona glomerulosa
K+ ACTH
↑Perfusion pressure
↑Sodium content
↑Extracellular fluid volume
↑Sodium reabsorption
Aldosterone
Juxtaglomerularapparatus
Renin
Angiotensin II
Adrenal complex
Zona glomerulosa
K+ ACTH
Kidney Kidney
1 9
6 12
2 10
11
14 13
5 8
4 7
A BNormal Primary aldosteronism
FIGURE 4-5
Control of mineralocorticoid production. A, Control of aldosterone production under normal circumstances.A decrease in renal perfusion pressure or tubular sodium content (1) at the level of the juxtaglomerular apparatusand macula densa of the kidney triggers renin release (2). Renin acts on its substrate angiotensinogen to generateangiotensin I, which is converted rapidly by angiotensin-converting enzyme to angiotensin II. Angiotensin IIthen induces peripheral vasoconstriction to increase perfusion pressure (6) and acts on the zona glomerulosaof the adrenal cortex (3) (see Fig. 4-2) to stimulate production and release of aldosterone (4). Potassium andadrenocorticotropic hormone (ACTH) also play a minor role in aldosterone production in some circumstances.Aldosterone then acts on the cells of the collecting duct of the kidney to promote reabsorption of sodium (andpassively, water) in exchange for potassium and hydrogen ions excreted in the urine. This increased secretionpromotes expansion of extracellular fluid volume and an increase in renal tubular sodium content (5) that furthersuppresses renin release, thus closing the feedback loop (servomechanism). B, Abnormalities present in primaryaldosteronism. Autonomous hypersecretion of aldosterone (7) leads to increased extracellular fluid volumeexpansion and increased renal tubular sodium content. These elevated levels are a result of increased renal
sodium and water reabsorption (8) at theexpense of increasedpotassium and hydrogenion excretion in theurine. The increase insodium and volume thenincrease systemic bloodpressure and renal perfusion pressure andsodium content (9),thereby suppressing further renin release(10) and angiotensin IIproduction (11). Thus,in contrast to the nor-mal situation depicted in panel A, the levels ofangiotensin II are highlysuppressed and thereforedo not contribute to anincrease in systemicblood pressure (12). Inprimary aldosteronism,ACTH (13) has a domi-nant modulatory role ininfluencing aldosteroneproduction and hypo-kalemia, resulting fromincreased urinary potas-sium exchange for sodium, which has anegative effect on aldos-terone production (14).

4.5Adrenal Causes of Hypertension
FIGURE 4-6
Types of primary aldosteronism. (Data from Weinberger andcoworkers [3].)
Aldosteronism
TYPES OF PRIMARY ALDOSTERONISM
Relative frequency, %
65
30
2
<1
<1
<1
Types
Solitary adrenal adenoma
Bilateral adrenal hyperplasia
Unilateral adrenal hyperplasia
Glucocorticoid-remediable aldosteronism
Bilateral solitary adrenal adenomas
Adrenal carcinoma
SCREENING TESTS FOR PRIMARY ALDOSTERONISM
Specificity, %
≈20
40–60
60
60
98
100
Sensitivity, %
75
>99
70
90
99.8
96
Test
Serum potassium ≤3.5 mEq/L
Plasma renin activity ≤4 ng/mL/90 min
Urinary aldosterone ≥20 µg/d
Plasma aldosterone ≥15 ng/dL
Plasma aldosterone–plasma renin activity ratio ≥15
Plasma aldosterone–plasma renin activity ratio ≥30
FIGURE 4-7
Screening tests for primary aldosteronism. Serum potassium levelsrange from 3.5 to normal levels of patients with primary aldostero-nism. Most hypertensive patients with hypokalemia have secondaryrather than primary aldosteronism. The plasma aldosterone-to-plas-ma renin activity (PRA) ratio (disregarding units of measure) is themost sensitive and specific single screening test for primary aldos-teronism. However, because of laboratory variability, normal rangesmust be developed for individual laboratory values. A randomperipheral blood sample can be used to obtain this ratio even whilethe patient is receiving antihypertensive medications, when theeffects of the medications on PRA and aldosterone are considered.(Data from Weinberger and coworkers [3,4].)
LOCALIZING TESTS FOR PRIMARY ALDOSTERONISM
Specificity, %
≈60
≈65
≈80
?
>95
Sensitivity, %
≈50
≈50
≈70
?
>92
Test
Adrenal computed tomographic scan
Adrenal isotopic scan
Adrenal venography
Adrenal magnetic resonance imaging
Adrenal venous blood sampling withadrenocorticotropic hormone infusion
FIGURE 4-8
Localizing tests for primary aldosteronism. Adrenal venous bloodsampling with determination of both aldosterone and cortisol concentrations during adrenocorticotropic hormone stimulationprovides the most accurate way to identify unilateral hyperaldos-teronism. This approach minimizes artefact owing to episodicsteroid secretion and to permit correction for dilution of adrenalvenous blood with comparison of values to those in the inferiorvena cava. (see Fig. 4-12). (Data from Weinberger and coworkers [3].)
A
FIGURE 4-9
Normal and abnormal adrenal isotopic scans. A, Normal scan.Increased bilateral uptake of I131-labeled iodo-cholesterol of nor-mal adrenal tissue is shown above the indicated renal outlines.
(Continued on next page)

4.6 Hypertension and the Kidney
B
FIGURE 4-9 (Continued)
B, Intense increase in isotopic uptake by the left adrenal (as viewedfrom the posterior aspect) containing an adenoma.
A B
FIGURE 4-10
Adrenal venography in primary aldostero-nism. A, Typical leaflike pattern of the nor-mal right adrenal venous drainage. B, Incontrast, marked distortion of the normalvenous anatomy by a relatively large (3-cm-diameter) adenoma of the left adrenal.Most solitary adenomas responsible for pri-mary aldosteronism are smaller than 1 cmin diameter and thus usually cannot be seenusing anatomic visualizing techniques.
0
10
20
30
40
50
60
8 AM
SupineNoon
Upright8 AM
SupineNoon
Upright8 AM
SupineNoon
Upright
Normal Adenoma Hyperplasia
Pla
sma
ald
ost
ero
ne,
ng/
dL
A B C
In normal persons the increase in plasmarenin activity associated with upright postureresults in a marked increase in plasma aldos-terone at noon compared with that at 8 AM
(see Fig. 4-4). In adenomatous primaryaldosteronism, the plasma renin activity ismarkedly suppressed and does not increaseappreciably with upright posture. Moreover,aldosterone production is modulated byadrenocorticotropic hormone (which decreasesfrom high levels at 8 AM to lower values atnoon (see Fig. 4-4). Thus, these patientstypically demonstrate lower levels of aldos-terone at noon than they do at 8 AM. Inpatients with bilateral adrenal hyperplasia,the plasma renin activity tends to be moreresponsive to upright posture and aldos-terone production also is more responsiveto the renin-angiotensin system. Thus, pos-tural increases in aldosterone usually areseen. Exceptions to these changes occur inboth forms of primary aldosteronism, how-ever, making the postural test less sensitiveand specific [3].
FIGURE 4-11
Changes in plasma aldosterone with upright posture. A–C, Depicted are individual datafor persons showing temporal and postural changes in plasma aldosterone concentrationin normal persons (panel A), and in patients with primary aldosteronism owing to a solitaryadrenal adenoma (panel B) or to bilateral adrenal hyperplasia (panel C). Blood is sampledat 8 AM, while the patient is recumbent, and again at noon after 4 hours of ambulation.

4.7Adrenal Causes of Hypertension
ACTH ACTH
AC
AC
AC
A Bilateral aldosteronism
ACTH ACTH
AC
AC
AC
B Unilateral aldosteronism
FIGURE 4-12
Adrenal venous blood sampling during infusion of adrenocortico-tropic hormone (ACTH) [3]. A, Bilateral aldosteronism. A schematicrepresentation of the findings in primary aldosteronism owing tobilateral adrenal hyperplasia is shown on the left. When blood issampled from both adrenal veins and the inferior vena cava duringACTH infusion, the aldosterone-to-cortisol ratio is similar in bothadrenal effluents and higher than that in the inferior vena cava. Insuch cases, medical therapy (potassium-sparing diuretic combinationssuch as hydrochlorothiazide plus triamterene, amiloride, or spiro-lactone and calcium channel entry blockers) usually is effective. B,Unilateral aldosteronism. On the right is depicted the findings in apatient with a unilateral right adrenal lesion. This lesion can bediagnosed by an elevated aldosterone-to-cortisol ratio in right adrenal
venous blood compared with that of the left adrenal and the inferiorvena cava. Even if the venous effluent cannot be accurately sampledfrom one side (as judged by the levels of cortisol during ACTHinfusion), when the contralateral adrenal venous effluent has analdosterone-to-cortisol ratio lower than that in the inferior venacava, it can be inferred that the unsampled side is the source ofexcessive aldosterone production (unless there is an ectopic source).In such cases, surgical removal of the solitary adrenal lesion usuallyresults in normalization of blood pressure and the attendant metabolicabnormalities. Medical therapy also is effective but often requireshigh doses of Aldactone® (GD Searle & Co., Chicago) (200 to 800mg/d), which may be intolerable for some patients because of sideeffects. A—aldosterone; C—cortisol.

4.8 Hypertension and the Kidney
0 1 2 3 4 5 6 0 2 4 640
60
80
100
120
140
160
8
40
60
80
100
120
140
160
60
80
100
120
140
160
180
200100
200100
200100
SpironolactoneDexamethasone
mg
Father
Son 1
Son 2
Blo
od
pre
ssu
re
A
B
CWeeks Months
FIGURE 4-14
Glucocorticoid-remediable aldosteronism. A–C, Seen are the effectsof dexamethasone and spironolactone on blood pressure in a father(panel A) and two sons, one aged 6 years (panel B) and the otheraged 8 years (panel C). Blood pressure levels are shown before andafter treatment with dexamethasone (left) or spironolactone (right) [5].Note that the maximum blood pressure reduction with dexamethasonerequired more than 2 weeks of treatment. Similarly, the maximumresponse to spironolactone was both time- and dose-dependent.
FIGURE 4-13 (see Color Plate)
A section of a typical adrenal adenoma in primary aldosteronismpathology. A relatively large (2-cm-diameter) adrenal adenomawith its lipid-rich (bright yellow) content is shown.

4.9Adrenal Causes of Hypertension
0 1 2 3 4
0
1.0
0.8
0.6
0.4
0.2
5
0 1 2 3 4
5
10
15
20
25
5 0 1 2 3 4
5
10
15
20
25
5
0 1 2 3 4
10
20
30
40
50
5 0 1 2 3 4
3
4
5
6
7
Changes with dexamethasone
Dexamethasone
Plas
ma
ald
ost
ero
ne,
ng
/100
mL
Seru
m p
ota
ssiu
m, m
Eq/L
Plas
ma
ren
in a
ctiv
ity,
ng
AI/
mL-
3hr
Plas
ma
cort
iso
l,µg
/ 10
0 m
L
Uri
nar
y al
do
ster
on
e,µg
/ 24
h
Weeks
C D
A B
E
FIGURE 4-15
Humoral changes in glucocorticoid-remediable aldosteronism with dexamethasone. A–E, Depicted are the changesin plasma cortisol (panel A), urinary aldosterone (panel B), plasma renin activity (PRA) (panel C), plasma aldos-terone (panel D), and serum potassium (panel E) before and after dexamethasone administration in the patients in Figure 4-14. Note that before dexamethasone administration, serum cortisol was in the normal range and wasmarkedly suppressed after treatment. Urinary aldosterone was completely normal and plasma aldosterone was
elevated in only onepatient before dexametha-sone administration. Thediagnosis was made bydemonstrating that the plasma aldosteroneconcentration failed tosuppress normally afterintravenous saline infu-sion (2 L/4 h) [6]. Afterdexamethasone adminis-tration, both plasma andurinary aldosterone levelsdecreased markedly(except for one occasionwhen it is suspected thatthe patient did not com-ply with dexamethasonetherapy). PRA, which wasmarkedly suppressedbefore treatment,increased with dexa-methasone. Note also that serum potassium levels were normal in two of the three patientsbefore treatment withdexamethasone butincreased with therapy in all three [5]. All ofthese changes reverted tocontrol baseline valueswhen dexamethasonetherapy was discontinued.
Aldosterone Aldosterone
Aldosterone+
18–OH cortisol+
18–OXO cortisol
Cortisol
ACTH
AII
ACTH
AII
Cortisol+
Fasciculata Fasciculata
Glomerulosa Glomerulosa
Aldosterone Aldosterone
ChimericAldos
A B
FIGURE 4-16
Normal and chimeric aldosterone synthasein glucocorticoid-remedial aldosteronism(GRA). A, Normal relationship between thestimuli and site of adrenal cortical steroidproduction. Aldosterone synthase normallyresponds to angiotensin II (AII) in the zonaglomerulosa, resulting in aldosterone synthe-sis and release (see Figs. 4-2 and 4-3). B, InGRA, a chimeric aldosterone synthase generesults from a mutation, which stimulatesproduction of aldosterone and other steroidsfrom the zona glomerulosa under the controlof adrenocorticotropic hormone (ACTH)(Fig. 4-17). Thus, when ACTH production issuppressed by steroid administration, aldos-terone production is reduced.
4.10 Hypertension and the Kidney
3'5'3'5'3'5'
3'5' 3'5'
3'5'3'5'
11–OHase
Aldosterone synthase Chimeric gene 11–OHase
Unequal crossing over
FIGURE 4-17
Mutation of the (11-OHase) chimeric aldosterone synthase gene[8]. The unequal crossing over between aldosterone synthase and11-hydroxylase genes resulting in the mutated gene responsible forglucocorticoid-remedial aldosteronism is described.
Cushing’s Syndrome
A
B
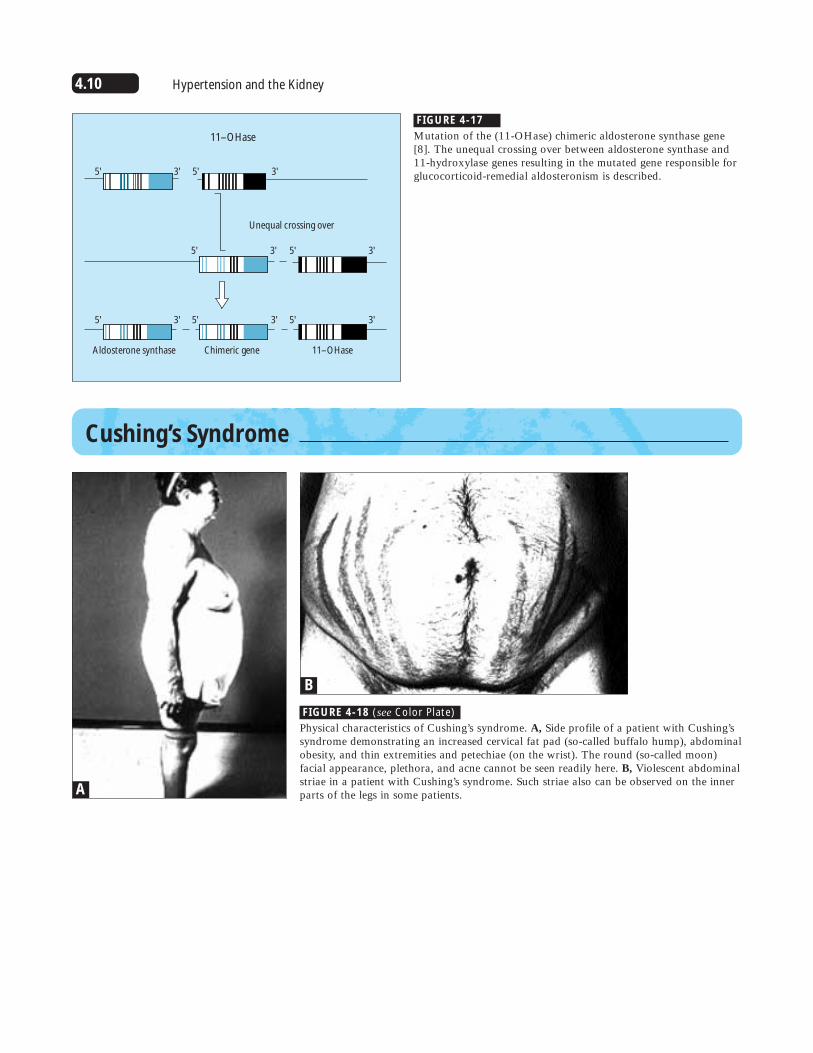
FIGURE 4-18 (see Color Plate)
Physical characteristics of Cushing’s syndrome. A, Side profile of a patient with Cushing’ssyndrome demonstrating an increased cervical fat pad (so-called buffalo hump), abdominalobesity, and thin extremities and petechiae (on the wrist). The round (so-called moon)facial appearance, plethora, and acne cannot be seen readily here. B, Violescent abdominalstriae in a patient with Cushing’s syndrome. Such striae also can be observed on the innerparts of the legs in some patients.

4.11Adrenal Causes of Hypertension
Pituitary
ACTH Cortisol
CRF
(–) (–)
Adrenal cortex(zona fasciculatazona reticularis)
Pituitary
ACTH ↑ Cortisol
Adrenal cortex(zona fasciculatazona reticularis)
Pituitary
↑ ACTH ↑ Cortisol
Adrenal cortex(zona fasciculatazona reticularis)
(–)
FIGURE 4-19
Normal pituitary-adrenal axis. Corticotropin-releasing factor (CRF) acts to stimulate therelease of adrenocorticotropic hormone(ACTH) from the anterior pituitary. ACTHthen stimulates the adrenal zona fasciculataand zona reticularis to synthesize and releasecortisol (see Figs. 4-2 and 4-3). The increasedlevels of cortisol feed back to suppress addi-tional release of ACTH. As shown in Figure4-4, ACTH and cortisol have circadian patterns.
FIGURE 4-20
Pituitary Cushing’s disease. Pituitary Cushing’sdisease results from excessive production ofadrenocorticotropic hormone (ACTH), typ-ically owing to a benign adenoma. ExcessACTH stimulates both adrenals to produceexcessive amounts of cortisol and results inbilateral adrenal hyperplasia. The increasedcortisol production does not suppress ACTHrelease, however, because the pituitary tumoris unresponsive to the normal feedback sup-pression of increased cortisol levels. Thediagnosis usually is made by demonstrationof elevated levels of ACTH in the face ofelevated cortisol levels, particularly in theafternoon or evening, representing loss ofthe normal circadian rhythm (see Fig. 4-4).Radiographic studies of the pituitary (com-puted tomographic scan and magnetic reso-nance imaging) will likely demonstrate thesource of increased ACTH production. Whenthe pituitary is the source, surgery and irra-diation are therapeutic options.
FIGURE 4-21
Adrenal Cushing’s syndrome. AdrenalCushing’s syndrome typically is caused by a solitary adrenal adenoma (rarely by carci-noma) producing excessive amounts of cortisol autonomously. The increased levelsof cortisol feed back to suppress release ofadrenocorticotropic hormone (ACTH) andcorticotropin-releasing factor. The findingof very low ACTH levels in the face of elevated cortisol values and a loss of thecircadian pattern of cortisol confirm thediagnosis (see Fig. 4-4). Additional anatomicstudies of the adrenal (computed tomographicscan and magnetic resonance imaging) usuallydisclose the source of excessive cortisol pro-duction. Surgical removal usually is effective.

4.12 Hypertension and the Kidney
Pituitary
ACTH
ACTH
Cortisol
Adrenal cortex(zona fasciculatazona reticularis)
EctopicTumor
Cushing's syndrome: ectopic etiology
(–)
SCREENING TESTS FOR CUSHING’S SYNDROME
Sensitivity, %
≈75
>90
>95
Specificity, %
≈60
≈60
>95
Test
Elevated PM serum cortisol
Elevated urinary 17-hydroxy corticosteroids
Elevated urinary free cortisol
FIGURE 4-22
Ectopic etiology of Cushing’s syndrome. Rarely, Cushing’s syn-drome may be due to ectopic production of adrenocorticotropichormone (ACTH) from a malignant tumor, often in the lung. Insuch cases, hypercortisolism is associated with increased levels ofACTH-like peptide; however, no pituitary lesions are found.Patients with ectopic Cushing’s syndrome often are wasted andhave other manifestations of malignancy.
FIGURE 4-23
Screening tests for Cushing’s syndrome. Whereas elevated eveningplasma cortisol levels typically indicate abnormal circadian rhythm,other factors such as stress also can cause increased levels late inthe day. Urinary levels of 17-hydroxy corticosteroids may beincreased in association with obesity. In such cases, repeat measure-ment after a period of dexamethasone suppression may be requiredto distinguish this form of increased glucocorticoid excretion fromCushing’s syndrome. The measurement of urinary-free cortisol isthe most sensitive and specific screening test.
the morning hours (see Fig. 4-4). In pitu-itary Cushing’s disease and ectopic forms of Cushing’s syndrome, elevated values areobserved, especially in the afternoon andevening. The next step in differentiation isan anatomic evaluation of the pituitary.When no abnormality is found, the nextstep is a search for a malignancy, typicallyin the lung. The finding of low ACTH lev-els points to the adrenal as the source ofexcessive cortisol production, and anatomicstudies of the adrenal are indicated. CT—computed tomography; MRI—magneticresonance imaging.
FIGURE 4-24
Algorithm for differentiation of Cushing’s syndrome. The first step in the differentiation of Cushing’s syndrome after diagnosing hypercortisolism is measurement of plasmaadrenocorticotropic hormone (ACTH) levels. Typically, these should be reduced after

4.13Adrenal Causes of Hypertension
FIGURE 4-25
Synthesis, actions, and metabolism of catecholamines. Depicted is the synthesis of catecholamines in the adrenal medulla [9].Epinephrine is only produced in the adrenal and the organ ofZuckerkandl at the aortic bifurcation. Norepinephrine and dopaminecan be produced and released at all other parts of the sympatheticnervous system. The kidney is the primary site of excretion of
catecholamines and their metabolites, as noted here. The kidney also can contribute catecholamines to the urine. The relative contributions of norepinephrine and epinephrine to biologic events is noted by the plus signs. BMR—basal metabolic rate; CNS—central nervous system; NEFA—nonesterified fatty acids;VMA—vanillylmandelic acid.
Catecholamines

4.14 Hypertension and the Kidney
Pheochromocytoma
8:30
PM
10
PM
2
AM
5:00
AM
7:45
AM
9
AM
10
AM
11
AM
12
Noon
1
PM
10
20
6070
8090
110120
130140
160170
180190
210220
230240
304050
100
150
200
250
0
Calibrate2-min intervals 5-min intervals
Blood pressure taken at
Blo
od
pre
ssu
re, m
m H
g
During the attack:Blood pressure, 192/100 mm HgPulse 108Respirations, 24
FIGURE 4-26
Paroxysmal blood pressure pattern in pheochromocytoma. Note the extreme variability of blood pressure in this patientwith pheochromocytoma during ambulatory blood pressuremonitoring [9]. Whereas most levels were within the normal
range, episodic increases to levels of 200/140 mm Hg wereobserved. Such paroxysms can be spontaneous or associatedwith activity of many sorts. (Adapted from Manger and Gifford[9]; with permission.)
FIGURE 4-27 (see Color Plate)
Neurofibroma associated with pheochromocytoma. Neurofibromasare sometimes found in patients with pheochromocytoma. Theselesions are soft, fluctuant, and nontender and can appear anywhereon the surface of the skin. These lesions can be seen in profile inFigure 4-28.
FIGURE 4-28
Café au lait lesionsin a patient withpheochromocytoma.These light-brown-colored (coffee-with-cream-colored)lesions, sometimesseen in patients withpheochromocytoma,usually are largerthan 3 cm in thelargest dimension.In this particularpatient, neurofibro-mas also are presentand can be seen inprofile.

4.15Adrenal Causes of Hypertension
DISORDERS ASSOCIATED WITHPHEOCHROMOCYTOMA
Cholelithiasis
Renal artery stenosis
Neurofibromas
Café au lait lesions
Multiple endocrine neoplasia, types II and III
Von Hippel-Lindau syndrome (hemangioblastoma and angioma)
Mucosal neuromas
Medullary thyroid carcinoma
FIGURE 4-29
Disorders associated with pheochromocytoma. In addition to the neurofibromas andcafé au lait lesions depicted in Figures 4-27 and 4-28, several other associated abnormal-ities have been reported in patients with pheochromocytoma. (From Ganguly et al. [9];with permission.)
COMMON SYMPTOMS AND FINDINGS IN PHEOCHROMOCYTOMA
Symptoms
Severe headache
Perspiration
Palpitations, tachycardia
Anxiety
Tremulousness
Chest, abdominal pain
Nausea, vomiting
Weakness, fatigue
Weight loss
Dyspnea
Warmth, heat intolerance
Visual disturbances
Dizziness, faintness
Constipation
Finding
Hypertension:
Sustained
Paroxysmal
Pallor
Retinopathy:
Grades I and II
Grades III and IV
Abdominal mass
Associated multiple endocrineadenomatosis
Patients, %
82
67
60
45
38
38
35
26
15
15
15
12
7
7
61
24
44
40
53
9
6
FIGURE 4-30
Common symptomsand findings in pheo-chromocytoma. Notethat severe hyperten-sive retinopathy,indicative of intensevasoconstriction, frequently isobserved. (Adaptedfrom Ganguly et al. [10].)
SCREENING AND DIAGNOSTIC TESTS IN PHEOCHROMOCYTOMA
Specificity, %
≈80
≈85
>99
Sensitivity, %
≈85
≈75
>99
Test
Elevated 24-h urinary catecholamines,vanillylmandelic acid, homovanillicacid, metanephrines
Abnormal clonidine suppression test
Elevated urinary “sleep” norepinephrine
FIGURE 4-31
Screening and diagnostic tests in pheochromocytoma. Drugs, incom-plete urine collection, and episodic secretion of catecholamines caninfluence the tests based on 24-hour urine collections in a patientwith a pheochromocytoma. The clonidine suppression test is fraughtwith false-negative and false-positive results that are unacceptablyhigh for the exclusion of this potentially fatal tumor. The “sleep”norepinephrine test eliminates the problems of incomplete 24-hoururine collection because the patient discards all urine before retiring;saves all urine voided through the sleep period, including the firstspecimen on arising; and notes the elapsed (sleep) time [10]. The sleepperiod is typically a time of basal activity of the sympathetic nervoussystem, except in patients with pheochromocytoma (see Fig. 4-32).

4.16 Hypertension and the Kidney
100
1000
0
10
Patient I
Patient II
Patient III
Patient IV
Patient V
Patient VI
Maximum for normal
Maximum for hypertensive
Slee
p u
rin
ary
no
rep
inep
hri
ne
excr
etio
n,
µg
Normalmean + SD
Hypertensivemean + SD
FIGURE 4-32
Nocturnal (sleep) urinary norepinephrine. The values for urinaryexcretion of norepinephrine are shown for normal persons andpatients with essential hypertension as mean plus or minus SD[10]. Values for patients with pheochromocytoma are indicated bysymbols. Note that the scale is logarithmic and the highest valuefor patients with normal or essential hypertension was less than 30µg, whereas the lowest value for a patient with pheochromocytomawas about 75 µg. Most patients with pheochromocytomas had val-ues an order of magnitude higher than the highest value forpatients with essential hypertension.
LOCALIZATION OF PHEOCHROMOCYTOMA
Sensitivity, %
≈40
≈60
≈85
>95
Specificity, %
≈50
≈75
≈85
>95
Test
Abdominal plain radiograph
Intravenous pyelogram
Adrenal isotopic scan (meta-iodobenzoylguanidine)
Adrenal computed tomographic scan
FIGURE 4-33
Localization of pheochromocytoma. Once the diagnosis ofpheochromocytoma has been made it is very important to localizethe tumor preoperatively so that the surgeon may remove it with aminimum of physical manipulation. Computed tomographic scanor MRI appears to be the most effective and safest techniques forthis purpose [10]. The patient should be treated with �-adrenergicblocking agents for 7 to 10 days before surgery so that the contractedextracellular fluid volume can be expanded by vasodilation.
FIGURE 4-34
Intravenous pyelo-gram in pheochro-mocytoma. Note thedisplacement of theleft kidney (right) bya suprarenal mass.

4.17Adrenal Causes of Hypertension
A B
C D
FIGURE 4-35
A–D, Computed tomographic scans in four patients with pheochro-mocytoma [10]. The black arrows identify the adrenal tumor in
A B
FIGURE 4-36 (see Color Plates)
A and B, Pathologic appearance of pheochromocytoma before(panel A) and after (panel B) sectioning. This 3.5-cm-diameter
these four patients. Three patients have left adrenal tumors, and inone patient (panel B) the tumor is on the right adrenal.
tumor had gross areas of hemorrhage noted by the dark areas visible in the photographs.

4.18 Hypertension and the Kidney
References
1. Netter FH: Endocrine system and selected metabolic diseases. In CibaCollection of Medical Illustrations, vol. 4; 1981:Section III, Plates 5, 26.
2. DeGroot LJ, et al.: Endocrinology, edn 2. Philadelphia: WB Saunders;1989:1544.
3. Weinberger MH, Grim CE, Hollifield JW, et al.: Primary aldostero-nism: diagnosis, localization and treatment. Ann Intern Med 1979,90:386–395.
4. Weinberger MH, Fineberg NS: The diagnosis of primary aldosteronismand separation of subtypes. Arch Intern Med 1993, 153:2125–2129.
5. Grim CE, Weinberger MH: Familial, dexamethasone-suppressiblenormokalemic hyperaldosteronism. Pediatrics 1980, 65:597–604.
6. Kem DC, Weinberger MH, Mayes D, Nugent CA: Saline suppressionof plasma aldosterone and plasma renin activity in hypertension. ArchIntern Med 1971, 128:380–386.
7: Lifton RP, Dluhy RG, Powers M: Hereditary hypertension caused bychimeric gene duplications and ectopic expression of aldosterone syn-thase. Nat Genet 1992, 2:66–74.
8. Lifton RP, Dluhy RG, Powers M: A glucocorticoid-remediable aldos-terone synthase gene causes glucocorticoid-remediable aldosteronismand human hypertension. Nature 1992, 355:262–265.
9. Manger WM, Gifford RW Jr: Pheochromocytoma. New York:Springer-Verlag; 1977:97.
10. Ganguly A, Henry DP, Yune HY, et al.: Diagnosis and localization ofpheochromocytoma: detection by measurement of urinary norepineph-rine during sleep, plasma norepinephrine concentration and computedaxial tomography (CT scan). Am J Med 1979, 67:21–26.