Embed Size (px)
Citation preview

Data from the Series 12 NATIONAL HEALTH SURVEY Number 20
Adm inistratorsof Nursingand PersonalCare Homes: ” Work Experience
United States - June-August 1969
Statistics on the number of nursing and personal care home administrators by length,of employment as an administrator, hours worked, and services performed, Based on data collected during June-August 1969.
DHEW Publication No. (HSM) 73-1705
U.S. DEPARTMENT OF HEALTH,EDUCATION, AND WELFARE Public Health Service
Health Services and Mental Health Administration National Center for Health Statistics
Rockville, Md. March 1973

NATIONAL CENTER FOR HEALTH STATISTICS
THEODORE D. WOOLSEY, Director EDWARD B. PERRIN, Ph.D., Deputy Director
PHILIP S. LAWRENCE, Sc.D., AssociateDirector OSWALD K. SAGEN, Ph.D., Assistant Director for Health Statistics Development
WALT R. SIMMONS,M.A., Assistant Director for Research and Scientific Development JOHN J. HANLON, M.D., Medical Advisor JAMES E. KELLY, D.D.S., Dental Advisor EDWARD E. MINTY, Executive Officer ALICE HAYWOOD, Information Officer
DIVISION OF HEALTH RESOURCES STATISTICS
SIEGFRIED A. HOERMANN, Director PETER L. HURLEY, Deputy Director
GRACE K. WHITE, Chief, Hospital Discharge Survey Brunch G. GLORIA NOLLIS, Chief, Health Facilities Statistics Branch HENRY S. MOUNT, Chief, Health Manpower Statistics Brunch
WILLIAM F. STEWART, Chief, Family Phznning Statistics Branch
COOPERATION OF THE BUREAU OF THE CENSUS
Under the legislation establishing the National Health Survey, the public Health Service is authorized to use, insofar as possible, the services or facilities of other Federal, State, or private agencies.
In accordance with specifications established by the National Center for Health Statistics, the Bureau of the Census, under a contractual arrangement, participated in planning the survey and collecting the data.
Vital and Health Statistics-Series 12-No. 20
DHEW Publication No. (HSM) 73-1705 Library of Congress Catalog Card Number 72-600216

----
--- ----
------- ----
----
--
CONTENTS Page
Introduction ________________________________________------------------Problem-----------------------------------------------------------Highlights of This &port ________________________________________----Establishment Information--------- ______ - - -____ ----___-- _____ -_____
Length of Employment as an Administrator------------------------------Total Employment _______ __ _ ---____ ______________ ______ _______ -_ Current Employment-----------------------------------------------Q-her Employment-------------------------------------------------
Hours Worked (Last.Week)--------------------------------------------- 8
Services Performed--------------------------------------------------- 9
11
List of Detailed Tables ________________________________________-------- 12
Appendix 1. Tech&al Notes on M&-&s _______________________________ 30 Survey Design----------------------------------------------------- 3Q General Qualifications---------------------------------------------- 32
Appendix Il. Definitions of Certain Terms Used in This Report----------- 34 Terms Relating to Administrators- ___-_- _______--____--__- ________ 34 Terms Relating to Homes or Resident- _____ __________- --__________ 34 Classification of Homes by Type of Service---------------------------- 34 Ownership Classification ____ -_-___ ___________ --------__-_ 35 Geographic Region------------------------------------------------- 35
Appendix III. Resident Places Survey-3: Forms and Questionnaires-------- 36 Introductory Letter------------------------------------------------- 36 Facility Questionnaire-- ____--_----- _____-----_- _______- ____________ 37 A&ninist--tor Questionnaire------ _______ _______________________ 39 Staff Questionnaire------------------------------------------------- 41 Staff Information and Control Record- _____- - - - - - ________ ___________ 43 Current patient Questionnaire-- ________-__----- _____-___-_ ______-___ _ 44
iii

--- SYMBOLS
Data not available--------------------------
Category not applicable--------------------- . . .
Quantity zero _____-______--_____ - __-___- -_- _
Quantity more than 0 but less than 0.05-------
Figure does not meet standards. of reliability or precision------------------------------- *
NOTE: Numbers and percents in tables may not add to totals due to rounding.
iv
0.0

ADMINISTRATORS OF NURSING AND PERSONAL CARE HOMES: WORK EXPERIENCE
Bernice Gibson Brown, Division
INTRODUCTION
During June-August 1969 the Division of Health Resources Statistics conducted Resident Places Survey-3 (RPS-3) in order to update the statistics from the 1964Resident Places Survey-2 (RPS-2) 1-g and to show changes which have occurred in the 5-year period since 1964 and since the beginning of Medicare. Resident Places Sur-vey-3 was a sample survey of nursing and personal care homes in the conterminous United States. In this survey data were collected about the sample establishment itself, the health of a sample of the patients or residents, the administrator of the establishment, and a sampleof the employees. (For further discussion of RPS-3, see appendix I).
This report, one in a series based on the findings of RPS-3, describes the work experience of nursing and personal care home administrators based on information obtained by questionnaire from the person who was designated as “administrator” by the owner or operator of an establishment. The survey was designed so that one and only one administrator was designated for each establishment. Assistant administrators were requested to complete a different questionnaire and are not included in this report.
Since the estimates for RPS-3 are basedona sample of administrators in nursing andpersonal care homes rather than all such administrators, they are subject to sampling variability. Tables of approximate sampling errors and illustrations of their use are given in appendix I. Definitions of certain terms used in this report may be
of Health Resources Statistics
found in appendix II. A review of these and of the questionnaires and related materials shown in appendix III should be helpful in understanding the data.
To provide a general picture of the work experience and activity of administrators, this report describes administrators of nursing and personal care homes in terms of length of employment in nursing and personal care homes, homes for the aged, and similar facilities; hours worked in the facility the week prior to the survey; and services performed in the facility. The data presented herein are arrayed by personal characteristics of administrators and the inter: relationship between these personalcharacter.. istics and characteristics of the nursing or personal care homes in which administrators were employed is analyzed. More detailed information about administrators is given in tables 1-17 ,which follow the text of this report.
Problem
The 1967 amendments to Title XIX (Medicaid) of the Social Security Act required all States and other jurisdictions participating in Medicaid to establish programs to license by waiver or fully license all nursing home administrators by July 1, 1970.
Federal guidelines proposed, among other things, that by July 1, 1970, each applicant for full licensure must (a) possess a high school diploma or the equivalent and (b) submit evidence of participation in an approved course of study innursing home administration. The Federal
1

and
guidelines further proposed as follows: applicants for licensure on or after January 1, 1975, must have successfully completed 2 years of college level study in an accredited institution, on or after January 1, 1980, must hold a bachelor’s degree, and on or after January 1, 1985, must hold a master’s degree.l’ In future years applicants could submit evidence of 4 years of practical experience in nursing home administration or in a related health administration area for each year of required post-high school education.
A major part of this report deals with length of experience as an administrator. The data presented will help to identify the characteristics and locations of administrators who would be most likely to substitute experience for education.
Table A summarizes the education and experience of the estimated 18,390 administrators. Slightly less than 80 percent had completed at least 12th grade. Only 35 percent had taken acourse in nursing home administration. About 71 percent had 4 years or more experience as an administrator of a nursing or personal care home, hospital, or similar facility. A previous report on nursing and personal care home administrators based on dat,a collected in Resident Places Survey-3 presented an indepth analysis of the administrators’ education and training. An important surveyfinding cited was that at the time of the survey only 31 percent had both attained at least 12th grade and taken a course in nursing home administration, proposed licensure requirements which would affect applicants on or after July 1, 1970. I1
Highlights of This Report
The median years of total employment as an administrator for the estimated 18,390nursing and personal care home administrators in the conterminous United States, June-August 1969, were 8.0 years. About 71 percent of administrators had worked 4 years or more as an administrator in a nursing or personal care home, home for the aged, hospital, or similar facility. The median years of experience as an administrator in the current nursing or personal care home were 5.3 years. About 59 percent had workedinthecurrent nursing or personal care home 4 years or more.
Table A. Number and percent distribution of nursing and personal care home administrators by education and experience: United States, June-August 1969
[Excludes Alaska Hawaid= IAdministrators
Education and experience
Number Percent
Tot-l-----,.------ 18,390 100.0
Highest gradecompleted
Less than 12th grade--- 3,84012th grade or above---- 14,550
Course in nursing home administration
Took a course---------- 6,440Did not take a course-- 11,950
Length of total employment as an
administrator
Less than 4 years------ 5,4004 years or more-------- 12,990
About 35 percent of the administrators had been previously employed as an administrator (table B). The median years of previous employment were 7.1 years.
Administrators generally worked long hours, the mean hours worked being 57 during the week prior to the survey. Only 11 percent worked less than 40 hours; 31 percent, 40-49 hours; and the remainder, 50 hours or more.
About 98 percent of the administrators spent some time the week prior to the survey per-forming professional services in the facilities; whereas only 60 percent spent time performing subprofessional services. Administrators were involved, most frequently in administration, clerical work, kitchen or dietary work, housekeeping, and nursing care, The greatest proportion (59 percent) of their time was spent in administration of the facility.
2

Table B. Number and percent distribution August 1969, which provided nursing or personalof nursing and personal
of care home ad- care to 815,130 aged or chronically ill residentsministrators by length employment as
or patients. About 63 percent of the facilities werean administrator: United States, June-August 1969 nursing care homes, the highest level of nursing
service. Nursing care homes maintained 78[Escludes Alaska and -Hawaii) percent of the beds and provided care to 78
percent of the residents. In contrast, personal care homes, the lowest level of nursing service,
Length of employment rAdministrators comprised 17 percent of. the facilities, main-as an administrator
Number Percent tained about 5 percent of the beds, and provided care to about 5 percent of the residents. In between these extremes were personal care with
All lengths of employment------ 18,390 100.0
nursing homes, the intermediate level of nursing service, which comprised 21 percent of the fa-cilities, maintained 17 percent of the beds, and
Total employment1 provided care to 17 percent of the residents. The overall occupancy was about 91 percent.
Less than 1 year------- 1,580 2i.g (See appendix II for explanation of the classi-1-3 years-------------- 3,820
4-9 years-------------- 5,630 30:6 fication of homes.) 10-19 years------------ 26.7 Information on Medicare participation was 20 years or more------- %, 13.3 obtained in RPS-3. An estimated 26 percent of the
Current employment” facilities at the time of survey reported they were certified by Medicare, whereas 74 percent re-
Less than 1 year------- 2,330 12.7 ported they were not certified.1-3 years _------------- 5,240 28.54-g years-------------- 6,070 33.0 10 years or more------- 4,750 25.8 LENGTH OF EMPLOYMENT AS AN
Other employment” ADMINISTRATOR 0 years---------------- 12,010 65.3 o+ _ 1 year------------ 290 Total Employment1-3 years-------------- 1,770 E4-9 years-------------- 2,210 12:o Data on length of total work experience refer 10 years or more------- 2,110 11.5 only to experience of the respondent as an ad
ministrator in nursing homes, homes for the lIncludes only experience as an admin- aged, hospitals, and similar facilities. On this
is trator in hospitals, nursing homes, homes basis the median total experience for all nursingfor the aged, and similar facilities.
%ncludes experience in the current and personal care home administrators was 8.0 nursing or personal care homes. years. About 9 percent had worked less than 1
31ncludes experience in other nursing year as an administrator, while 71 percent had
hospitals, and similar facilities. The median years of total work experience
ranged from 2.7 years for administrators under 35 years of age to 13.9 years for those 65 years
Establishment Information and over. These median values and others pre-sented in table D for total experience by age
or personal care homes, homes for the aged, worked 4 years or more.
To place the statistics on administrators in group indicate that considerable proportions of perspective, table C presents the number and administrators may have been engaged in other percent distribution of nursing and personal care related or unrelated careers prior to becoming homes, beds, and residents by type of home. administrators. Additional information is pro-There were an estimated 18,390 nursing and vided in table 1 which supports the hypothesis personal care homes in the United States, June- that increased experience accompaniedincreased
3

Table C. Number and percent distribution of nursing and personal care homes, beds,and ' residents by type of home: United States, June-August 1969
[Excludes Alaska and fIawaid
Type of home Homes Beds Residents
Number
Total------------------------------------ 18,390 1 897,180 1 815,130
Percent distribution
All,types of homes--------------------- 100 100 100
Nursing care--------------------------------- 63 78 78
Personal care with nursing------------------- 21 17 17 personal care ________________________________ 17 5 5
Table D. Number and percentofnursirig and personal care home administrators and median years of employment by age of administrator: United States, June-August 1969
bxcludes Alaska and Hawaii] - -
T Administrators TMedian years of employment
Age of administrator Number Percent
Total employ-
ment
Current employ-
ment home
employ-ment
All ages----------------------- 18,390 100.0 8.0 5.3 7.1
21-44 years-------------------------- 4,680 25.4 5.6 2.9 4.4
21-34 years------------------------ 1,550 8.4 2.7 2.0 3.3 35-44 years------------------------ 3,130 17.0 5.6 3.5 5.3
45 years and over-------------------- 13,710 74.6 9.5 6.9 7.8
45-54 years------------------------ 5,500 29.9 7.8 5.4 7.8 55-64 years------------ ____-_-___-_ 6,110 33.2 11.1 7.2 8.0 65 years and over------------------ 2,100 11.4 13.9 10.4 7.8
Other
4

Table E. Number and percentofnursing and personal care home administrators and median years of employment by type of home: United States, June-August 1969
[Excluded Alaska and Hawaii]
Administrators Median years of employment
Type of home OtherTotal Current homeNumber Percent employ- employ- employment ment ment
All types of homes------------- 18,390 100.0 8.0 5.3 7.1
Nursing care--------------------,------ 11,580 62.9 7.5 4.6 6.9
Personal care with nursing----------- 3,770 20.5 9.8 6.9 8.6
personal care--------------,---------- 3,040 16.6 8.0 6.9 5.7
age; about 70 percent of administrators under 35 years of age had less than 4 years’ experience, whereas at the other extreme about 67 percent of administrators 65 years of age or over had 10 years’ experience or more. Another fact to be noted is that the median ages for administrators with experience of less than 1 year and of 20 years or more were respectively, 46.1 and 58.7. The median age for all a.dministrators was 53.2 years.
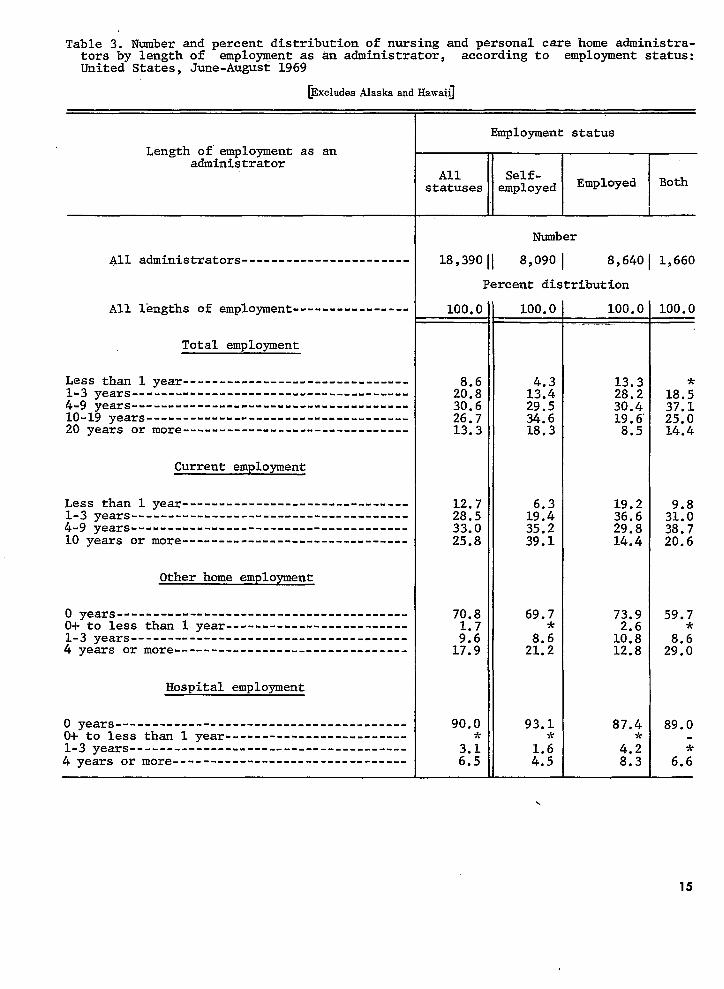
There was little variation in median length of total experience by type of home (table E). However, as might be expected, the median length of employment for self-employed administrators was longer than that for the employed (table F) with this tendency prevailing regardless of the type of service provided by the home (table 2). In fact, about 18 percent of the self-employed had less than 4 years’ experience as compared to 42 percent of the employed. At the other extreme, 53 percent of the self-employed compared to 28 percent of the employed had 10 years’ experience or more as administrators (table 3). Those administrators who considered themselves ‘both,” that is self-employed yet employees of the facility, generally had the second longest length of total experience. Although ownership . and
employment status are closely related, a significant relationship did not exist between type of ownership and length of employment (table 4) as it did between employment status and length of employment. For all ages the self-employed were more experienced than the employed (table 5). However, by size of home there existed the tendency for self-employed administrators to be more experienced than the employed, but the disparity in median length of experience between the employed and self-employed tended to be more pronounced in homes with 30-99 beds (table 7). Furthermore, homes with less than 30 beds, many of which were owner operated, had a greater proportion (49 percent) of administrators with 10 years’ experience or more (table 6).
Figure 1 presents the percent distribution of administrators by length of total experience and geographic region. This figure shows that administrators of the South and West generally had less total experience than administrators of the Northeast or North Central Regions. Specifically, about 75 percent of the administrators in the Northeast and 76 percent of administrators in the North Central Region had 4 years or more of experience compared to about 64 percent in the South and 65 percent in the West.
5
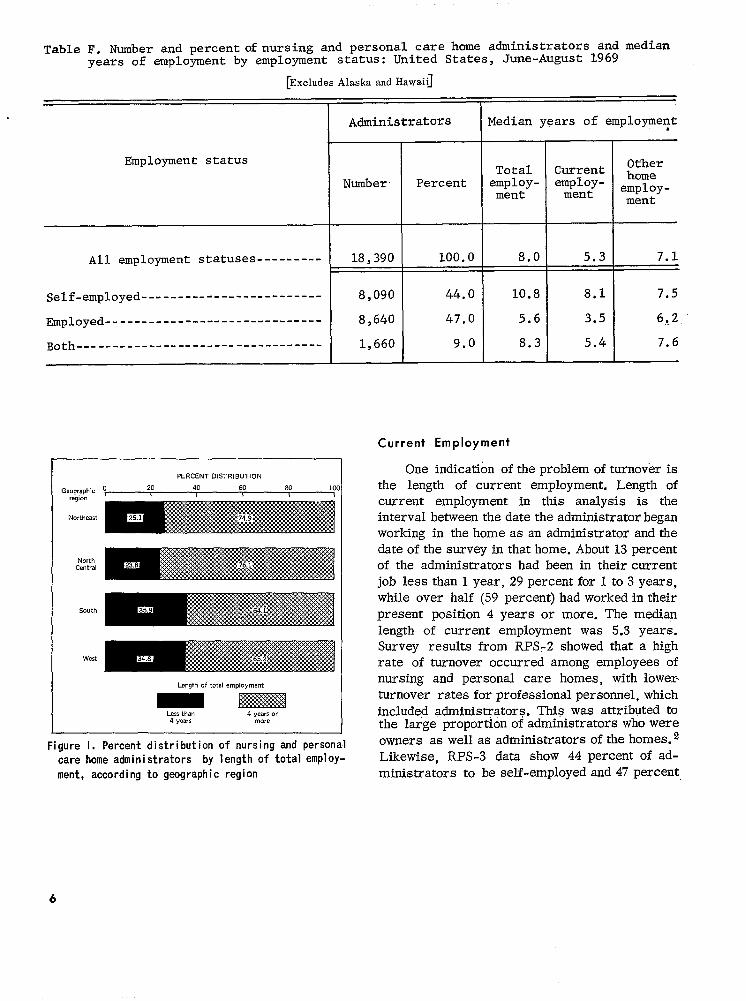
Table F. Number and percentofnursing and personal care home administrators and median years of employment by employment status: United States, June-August l.969
[Excludes Alaska and Hawaid
I I Administrators Median years of employmect
Employment status
Number, Percent Total
employ-ment
Current employ-
ment
Other home
employ-ment
All employment statuses--------- 18,390 100.0 8.0 5.3 7.1
Self-employed------------------------- 8,090 44.0 10.8 8.1 7.5
Employed------------------------------ 8,640 47.0 5.6 3.5 6,2
Both--- __ __ _ _ _ __ __ __ _ __ _ -_ __ __ _ ___ _ _ __ 1,660 9.0 8.3 5.4 7.6
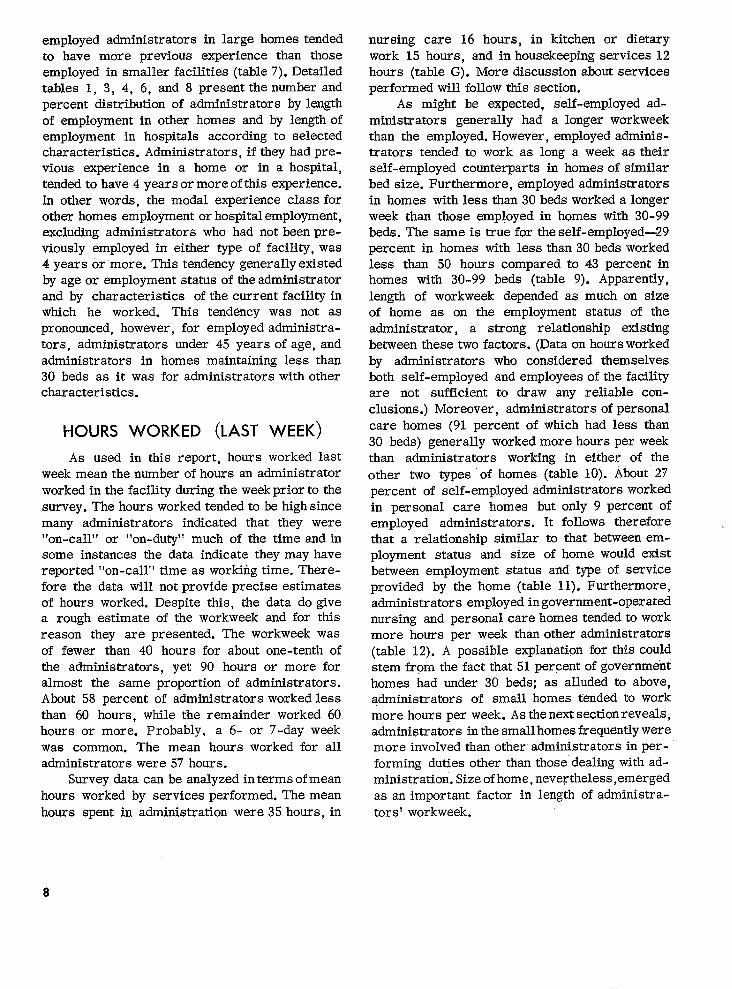
Current Employment
One indication of the problem of turnover is the length of current employment. Length of current employment in this analysis is the interval between the date the administrator began working in the home as an administrator and the date of the survey in that home. About 13 percent of the administrators had been in their current job less than 1 year, 29 percent for 1 to 3 years, while over half (59 percent) had worked in their present position 4 years or more. The median length of current employment was 5.3 years. Survey rate of nursing turnover included
results from RPSr2 showed that a high turnover occurred among employees of and personal care homes, with lower-rates for professional personnel, which administrators. This was attributed to
the large proportion of administrators who were
Figure I. Percent distribution of nursing and personal owners as well as administrators of the homes.2 care home administrators by length of total employ- Likewise, RPS-3 data show 44 percent of adment, according to geographic region ministrators to be self-employed and 47 percent
6

employed (table F), with 74 percent of the self-employed as compared to 44 percent of the employed having been in their current position 4 years or more (table 3). The median years of current employment as an administrator for employed and self-employed were 3.5 and 8.1 years, respectively (table F).
Table D indicates the mature age at which many administrators began working in their current job. The median years of current experience for administrators under 45 years of age were 2.9 and for those 45 years and over 6.9. Furthermore, the median age for administrators with less than 1 year of experience in their current job was 46.8 (table 1).
Self-employed administrators of nursing and personal care homes with nursing had generally been in their current job longer than their employed counterparts; however, this was not the situation for the self-employed and their employed counterparts in personal care homes (without nursing)-namely, the median lengths of current employment were approximately the same (table 2). Age did not alter the trend between employment status and length of current employment, which was longer for the self-employed at all ages (table 5). Since self-employed administrators worked predominantly in small homes, it was not surprising that about 73 percent of administrators in homes with less than 30 beds had 4 years or more current experience compared to about 49 percent and 43 percent, respectively, in homes with 30-99 beds and 100 beds or more (table 6).
The tendency, as discussed above, for administrators in the South and West Regions to be less experienced prevailed as regards length of current employment. Figure 2 shows 55, 53, 62, and 64percent of administrators, respectively, in the West, South, North Central, and Northeast had 4 years or more experience in their current job.
Other Employment
Other employment refers to previous experience of the respondent as an administrator of other nursing or personal care homes, homes for the aged, hospitals, and similar facilities. Survey results show that about 65 percent of adminis-
Figure 2. Percent distribution of nursing and personal care home administrators by length of correnternployment, according to geographic region
trators had no employment as an administrator prior to their current job. In fact, about 71 percent of administrators had no prior experience as an administrator of other nursing or personal care homes and 90 percent had no prior experience as an administrator of a hospital. This further supports the hypothesis that many administrators, in all probability, had been engaged in other careers before entering administration.
Many of the relationships which held in the analysis of total and current employment generally hold in the analysis of other employment. One exception is the relationship between age and length of employment, in which case administrators in all the designated age groups 45 years and over tended to have been employed in other facilities about the same length of time (table D). So in the case of other employment increasedage is not necessarily accompanied by increased experience. Another exception appeared in the relationship between employment status, size of home, and length of employment. It has previously been pointed out that administrators employed in large homes tended to have been in their current positions a shorter period than their counterparts employed in small homes. The reverse is true for other employment--the
7
employed administrators in large homes tended to have more previous experience than those employed in smaller facilities (table 7). Detailed tables 1, 3, 4, 6, and 8 present the number and percent distribution of administrators by length of employment in other homes and by length of employment in hospitals according to selected characteristics. Administrators, if they had previous experience in a home or in a hospital, tended to have 4 years or more of this experience. In other words, the modal experience class for other homes employment or hospital employment, excluding administrators who had not been previously employed in either type of facility, was 4 years or more. This tendency generally existed by age or employment status of the administrator and by characteristics of the current facility in which he worked. This tendency was not as pronounced, however, for employed administrators, administrators under 45 years of age, and administrators in homes maintaining less than 30 beds as it was for administrators with other characteristics.
tiouRs WORKED (LAST WEEK) As used in this report, hours worked last
week mean the number of hours an administrator worked in the facility during the week prior to the survey. The hours worked tended to be high since many administrators indicated that they were “on-call” or “on-duty” much of the time and in some instances the data indicate they may have reported “on-call” time as working time. There-fore the data will not provide precise estimates of hours worked. Despite this, the data do give a rough estimate of the workweek and for this reason they are presented. The workweek was of fewer than 40 hours for about one-tenth of the administrators, yet 90 hours or more for almost the same proportion of administrators. About 58 percent of administrators worked less than 60 hours, while the remainder worked 60 hours or more. Probably, a 6- or 7-day week was common. The mean hours worked for all administrators were 57 hours.
Survey data can be analyzed in terms of mean hours worked by services performed. The mean hours spent in administration were 35 hours, in
nursing care 16 hours, in kitchen or dietary work 15 hours, and in housekeeping services 12 hours (table G). More discussion about services performed will follow this section.
As might be expected, self-employed administrators generally had a longer workweek than the employed. However, employed administrators tended to work as long a week as their self-employed counterparts in homes of similar bed size. Furthermore, employed administrators in homes with less than 30 beds worked a longer week than those employed in homes with 30-99 beds. The same is true for the self-employed-29 percent in homes with less than 30 beds worked less than 50 hours compared to 43 percent in homes with 30-99 beds (table 9). Apparently, length of workweek depended as much on size of home as on the employment status of the administrator, a strong relationship existing between these two factors. (Data on hours worked by administrators who considered themselves both self-employed and employees of the facility are not sufficient to draw any reliable conclusions.) Moreover, administrators of personal care homes (91 percent of which had less than 30 beds) generally worked more hours per week than administrators working in either of the other two types ‘of homes (table 10). About 27 percent of self-employed administrators worked in personal care homes but only 9 percent of employed administrators. It follows therefore that a relationship similar to that between employment status and size of home would exist between employment status and type of service provided by the home (table 11). Furthermore, administrators employed in government-operated nursing and personal care homes tended to work more hours per week than other administrators (table 12). A possible explanation for this could stem from the fact that 51 percent of government homes had under 30 beds; as alluded to above, administrators of small homes tended to work more hours per week. As thenext sectionreveals, administrators in the small homes frequently were more involved than other administrators in per-forming duties other than those’dealing with ad-ministration. Size of home, neveytheless,emerged as an important factor in length of administrators’ workweek.
8

Table G. Number and percent of nursing and personal care home administrators, percentof time spent performing specific services, and mean hours, by service performed:United States, June-August 1969
@xcludes Alaska and Hawaig-Service performed by administrator T Administrators
Percent Mean of time hours
Number Percent
18,390 100.0 1oo:o .57
professional servicesl------------------- 18,010 97.9 71.5 42
Administration-- - _ -_ _ __ _ __- ___ __ -__ ____ 17,630 95.9 58.8 35
Nursing care--------------------------- 5,080 27.6 7.5 16
Medical and dental care---------------- 980 5.3 0.4 5
physical therapy----------------------- 1,110 6.0 0.4 4
Occupational therapy------------------- 1,250 6.8 0.6 5
Recreational therapy------------------- 2,810 15.3 1.5 6
Speech and hearing therapy------------- 590 3.2 0.3 5
Social work---------------------------- 3,460 18.8 2.0 6
Subprofessional servicesl---------------- 10,970 59.6 25.3 24
Clerical work -------I--------_--------- 7,590 41.3 6.4 9
Kitchen or dietary work---------------- 9,010 49.0 12.5 15
Housekeeping services------------------ 5,690 30.9 6.3 12
Other services--------------------------- 3,210 17.5 3.2 11 -
IService categories do not addtototal since categories are not mutually exclusive.
SERVICES PERFORMED
Administrators surveyed were asked how many hours they spent the week prior to the survey performing certain services in the facility. These services included administration, nursing care, medical and dental care, physical therapy, occupational therapy, recreational therapy, speech and hearing therapy, social work, clerical work, kitchen or dietary work, house-keeping services, and other services not speci
fied. In the text and tables of this report, ‘the first 11 services have been collasped into two categories-professional and subprofessional services. The “other services” category became a catchall for such services as laundry, yard and maintenancework, meetings, andconferences. Obviously administrators could be included in one or more of the major categories and could have performed one or more of services. The services as listed on the questionnaire lent, themselves to a wide range of interpretation by
9

the respondents and there is no way to deter-mine the degree of sophistication or complexity of the services rendered. Nevertheless, this data can be used as a rough means of evaluating the activity of nursing home administrators.
Almost all administrators (96 percent) spent some time in administration. Nursing care, social work, and recreational therapy also were among the tasks reportedly performed by relatively large proportions of administrators as were clerical work, kitchen and dietary work, and housekeeping services. Administration of the facility generally took up the majority of the time worked in the facilities. Kitchen or dietary work took up the second highest proportion of administrators’ time (table G).
It was not surprising to find in 1969 a relatively large proportion of administrators engaging in nursing care, for at the time of RPS-2 (1964) about 34 percent of administrators and assistant administrators were performing additional duties as registered nurses, licensed practicalnurses, or nurse’s aides.2 Furthermore, table 13 indicates that the self-employed administrator generally spent more time than other administrators in providing nursing care but also spent more time than other administrators doing kitchen or dietary work. On the other hand, employed administrators spent a-good proportion of their time in ‘administration of the facility. Those administrators who considered themselves both self-employed yet employees of the facility were more like employed administrators than self-employed in the amount of time they spent in administration of the facility.
By ownership, administrators of nonprofit homes spent 72 percent of their time in ad-ministration of the facility compared to about 57 and 53 percent, respectively, for administrators of proprietary and government-operated homes. Furthermore, administrators of non-profit homes spent the least time the week prior to the survey performing kitchen or dietary work (table 14). Among the many factors which may have had a bearing on this relationship
between allotment of time and ownership was education of the administrator and size of the home. Namely, administrators of nonprofit homes were generally among the better formally trained. In addition, nonprofit homes maintained on the average 69 beds, compared to 60 and 44, respectively, for government-operated and proprietary homes.11
Administrator activity in personal care homes (without nursing) was directed about as often towards professional as subprofessional services. However, the majority of administrator activity in personal care homes withnursing and nursing care homes was concentrated on professional services (table 15). Since type of home and size of home are interrelated, these observations tie in with the fact that a direct relationship tended to exist between the amount of time spent performing professional services and the size of the home, that is, administrators of the larger homes tended to have been more involved in professional services. For example, administrators of homes with 100 beds or more spent 91 percent of their time in providing professional services and 7 percent providing subprofessional services (table 16).
Age, a significant factor in that facet of experience pertaining to length of employment as an administrator, deserves attention in this analysis of services performed. There was a slight tendency for the older administrators to be involved more frequently in subprofessional services although they spent a significant amount of time providing nursing care. The younger administrators were more involved in administration than their older colleagues (table 17). The first report on administrators of nursing and personal care homes based on the findings of RPS-3. revealed that 2 or 3 years of nursing school occurred more often among administrators 45 years and over than among younger administrators. In addition, 24 percent of administrators 45 years and’over were licensed as a registered nurse, licensed practical nurse, or licensed vocational nurse compared to 20 percent under 45 years of age.11
10

REFERENCES
1NationaI Center for Health Statistics: Employees in nursing and personal care homes, United States, May-June 1964. Vita2 &d Health Statistics. PHS Pub. No. lOOO-Series 12-No. 5. Public Health Service. Washington. U.S. Government Printing Of&e, Sept.‘1966.
ZNationaI Center for Health Statistics: Employees in nursing and person4 care homes: number, work experience, special training, and wages, United States, May-June 1964. Vital and Health Statistics. PHS Pub. No. 1000Series 12-No. 6. Public Health Service. Washington. U.S. Government Printing Office, Jan. 1967.
3NationaI Center for Health Statistics: Chronic illness among residents of nursing and personal care homes, United States, May-June 1964. Vital and Health Statistics. PHS Pub. No, lOOO-Series 12-No. 7. Public Health Service. Washington. U.S. Government Printing Office, Mar. 1967.
4NationaI Center for Health Statistics: Prevalence of chronic conditions and impairments among residents of nursing and personal care homes, United States, MayJune 1964. Vital and Health Statistics. PHS Pub. No. 1000~Series 12-No. 8. Public Health Service. Washington. U.S. Government Printing Office, July 1967.
5Nationd Center for Health Statistics: Charges for care in institutions for the aged and chronically ill, United States, May-June 1964. Vital and Health Statistics. PHS Pub. No. 1000Series 12-No. 9. Public Health Service. Washington. U.S. Government Printing Office, Aug. 1967.
6NationaI Center for Health Statistics: Nursing and personal care services received by residents of nursing and personal care homes, United States, May-June 1964. vital and Health Statistics. PHS Pub. No. 1000Series 12-No. 10. Public Health Service. Washington. U.S. Government Printing Office, Sept. 1968.
-000
7Nationd Center for Health Statistics: Use of special aids in homes for the aged and chronically ill, United States, May-June 1964. Vital and Health Statistics. PHS Pub. No. lOOO-Series 12-No. 11. Public Health Service. Washington. U.S. Government Printing Office, Dec. 1968.
8National Center for Health Statistics: Marital status and living arrangements before admission to nursing and personal care homes, United States, May-June 1964. Vital and Health Statistics. PHS Pub. No. lOOO-Series 12-No. 12. Public Health Service. Washington. U.S. Government Printing Office, May 1969. .
9NationaI Center for Health Statistics: Arrangements for physician services to residents in nursing and personal care homes, United States, May-June 1964. Vita2 and Health Statistics. PHS Pub. No. 1000Series 12-No. 13. Public Health Service. Washington. U.S. Government Printing Office, Feb. 1970.
10Medical Services Administration: Rules and Regulations (with Guidelines) for State Licensing Boards of Nursing Home Administration. Recommended by the National Advisory Council on Nursing Home Administration. S0cia.I and Rehabilitation Service. Washington, D.C., Nov. 1969.
1lNational Center for Health Statistics: Administrators of nursing and personal care homes: Education and training, United States, June-August 1969. Vita2 and HeaZth Statistics. PHS Pub. No. lOOO-Series 12-No. 18. Public Health Service. Washington. U.S. Government Printing Office.
1ZNational Center for Health Statistics: Design and methodology of the 1967 Master Facility Inventory Survey. Vital and Health Statistics. PHS Pub. No. 1000Series l-No. 9. Public Health Service. Washington. U.S. Government Printing Office, Jan. 1971.
11

LIST OF DETAILED TABLES
Page
Table 1. Number and percent distribution of nursing and personal care home administrators by length of employment as an administrator, according to age: United.States,June-August 1969----------------------------------------------------------------- 13
2. Number and percent of nursing and personal care home administrators and median years of employment, by employment status and type of home: United States, June&gust 1969---------------------------------------------------------------------- 14
3. Number and percent distribution of nursing and personal care home administrators by length of employment as an administrator; according to employment status: United States, June-August 1969-------------------------------------------------- 15
4. Number and percent distribution of nursing and personal care home administrators by length of employment as an administrator,according to ownership of home: United States, June-August 1969--------------------------------------------------------- 16
5. Number and percent or nursing and personal care home administrators and median p;;;s of employment, by employment status and age: United States, June-August
----------_------------------------------------------------------------------ 17
6. Number and percent distribution of nursing and personal care home administrators by length ofemployment as an administrator,according to bed size of home: United States, June-August 1969--------------------------------------------------------- , 18
7. Number and percent of nursing and personal care home administrators and median years of employment, by employment status and bed size of home: United States,June-August 1969----------------------------------------------------------------- 19
8. Number and percent distribution of nursing and personal care home administrators by length of'employment as an administrator, according to type of home: United States, June-August 1969--------------------------------------------------------- 20
9. Number and percent distribution of nursing and personal care home administrators by hours worked last week, according to bed size of home and employment status: United States, June-August 1969-------------------------------------------------- 21
10. Number and percent distribution of nursing and personal care home administrators by hours worked last week, according to type of home and bed size: United States,June-August 1969----------------------------------------,------------------------- 22
11. Number and percent distribution of nursing and personal care administrators byhours worked last week, according to employment status and type of home: United States, June-August 1969--------------------------------------------------------- 23
12. Number and percent distribution. of nursing and personal care home administrators by hours worked last week, according to bed size and ownership of home: United Stat-s, June-August 1969--------------------------------------------------------- 24
13. Percent distribution of time administrators spent performing specific services byemployment status: United States, June-August 1969------------------------------- 25
14. Percent distribution of time administrators spent performing specific services byownership of home: United States, June-August 1969------------------------------- 26
15. Percent distribution of time administrators spent performing specific services by type of home: United States, June-August 1969------------------------------------ 27
16. Percent distribution of time administrators spent performing specific services bybed size of home: United States, June-August 1969-------------------------------- 28
17. Percent distribution of time administrators spent performing specific services by age: United States, June-August 1969--------------------------------------------- 29
12
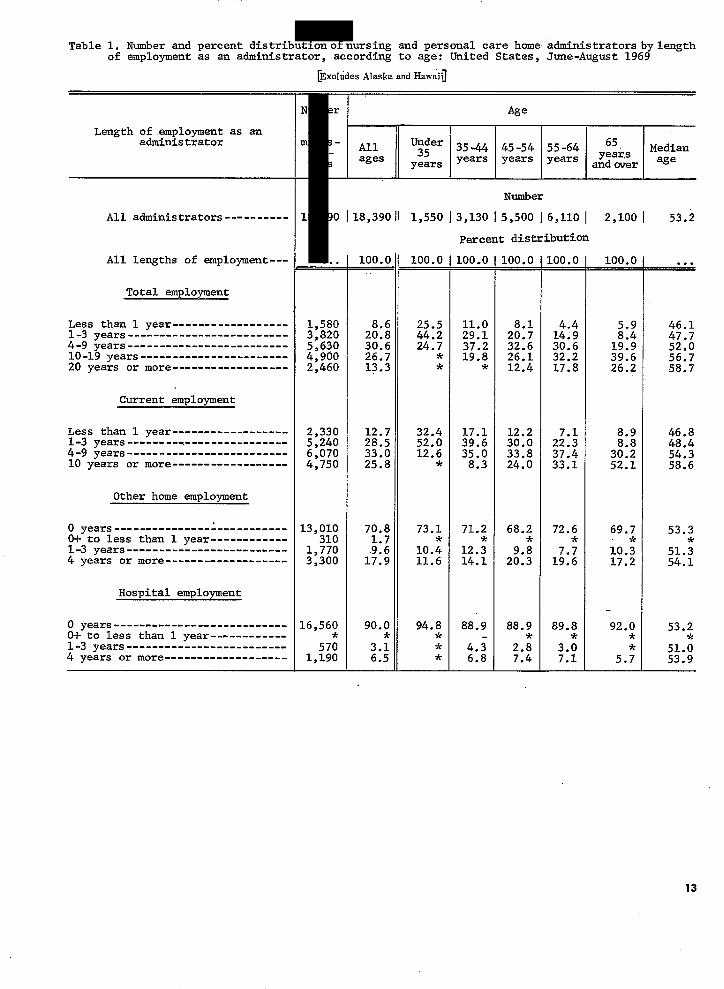
Table 1. Number and percent distributionofnursing and personal care home administratorsbylengthof employment as an administrator, according to age: United States, June-August 1969
bxcl;des Alaska and Hawaii
Length of .employment as an administrator
Number
All administrators---------- 18,390 118,39011 1,550 13,130 15,500 16,110 1 2,100 1 53.2
Percent distribution
All lengths of employment--- 100.0 100.0 100.0 100.0 100.0 100.0 ...- - - - - - -Total employment
Less than 1 year------------------ 1,580 25.5 11.0 4.4 5.91-3 years------------------------- 3,820 2:*: 29.1 2x 14;9 :;*5 lo-19 years----------- -_-__ a -_____20 years or more------------------ xi ,
26.7 13.3 *
1x '*
26.1 12.4
32.2 17.8
39:6 26.2
56.7 58.7
Current emnlovment
Less than 1 year------------------1-3 years---------.----------------4-9 years-------------------------10 years or more------------------
2,3305,2406,0704,750
12.7 28.5 33.0 25.8
32.4 52.0 12.6
*
17.1 39.6 35.0
8.3
12.2 30.0 33.8 24.0
227-i 37:4 33.1
E 30:2 52.1
46.8 48.4 54.3 58.6
Other home employment
0 years---------------I----,,,,,,,
1 year------------0+ to less than
4 13
year-years-------------------------
13,010310
1,770
70.8
.;-i
73.1
10.;:
71.2
12.;
68.2-k
72.6*
1;::
69.7*
10.3
53.3
51.;
4-9 years---------------- ____ - ____ 5,630 30:6 ::*: '*
32:6 30.6 1E 52:0
or more------------------- 3,300 17:9 11.6 14.1 2::: 17.2 54.1
Hospital employment
0 years---------------------------
O+ to less than 1 year------------16,560 90.0 94.8
* 88.9 88.9 89.8 92.0
* 53.2
4 1-3
years years------------------------- 57: 3.: * 4.; 2.: 3.;: 51.:or more------------------- 1,190 6.5 * 6.8 7.4 7.1 5.: 53.9
13

Table 2. Number and percentofnursing and personal care home administrators and median years of employment,by employment status and type of home:United States, June-August1969
[Excludes Alaska and Hawaii)
Administrators Median years of employment
Employment status and type of home OtherTotal
w Current home.Number Percent p;:y- employ- employment ment ment
All types of homes------------------- 18,390 100.0 8.0 5.3 7.1
Self-employed
Nursing care------------------------------- 3,890 21.1 12.0 8.4 8.4 Personal care with nursing----------------- 2,010 11.0 12.4 8.9 7.9 Personal care------------------------------ 2,190 11.9 8.1 6.9 6.0
Employed
Nursing care------------------------------- 6,300 34.3 5.0 3.2 6;l Personal care with nursing--------------A-- 1,590 8.6 7.2 4.1 9.7 personal care------------------------------ 750 4.1 7.4 7.2 *
Both
Nursing care I------------------------------ 1,390 7.6 8.0 5.7 6.8 Personal care with nursing----------------- 170 0.9 8.9 3.7 * Personal care------------------------------ 100 0.6 12.1 3.4 *
14
-------------------------------------- ----------------------------
Table 3. Number and percent distribution of nursing and personal care home administrators by length of employment as an administrator, according to employment status: United States, June-August 1969
[Excludes Alaska and Hawaid
Employment status Length of'employment as an
administrator
Number All administrators----------------------- 18,390 11 8,090 1 8,640( 1,660
Percent distribution
All lengths of employment---------------- 100.0 100.0 100.0 100.0
I===-
20 years or more ----1----------_----I__________
Current employment
Less than 1 year-------------------------------1-3 years--------------------------------------4-9 years----------------------------------------10 years or more ---1----------------____I______
Other home employment
0 years---------------------------------------o+ to less than 1 year-------------------------1-3 years--------------------------------------4 years or more -c------------------------------
Hospital employment
0 years --------------------------------------"-o+ to less than 1 year-------------------------1-3 years 4 years or more----
Total employment
Less than 1 year-------------------------------1-3 years -III-I-"-"--I----__"_-----I---"---I- 2E If;*:4-9 years --"-_""1"-1_"--111_-11---11--11111---"""""---" 30:6 29:slo-19 years------------------------------------ 26.7 34.6
13.3 18.3
12.7 28.5 1X 33.0 35:2 25.8 39.1
70.8 69.7*1.7
197:; 281:;
90.0 I93.1 * *
63:; 41::
.
13.3 28.2 18.; 30.4 37.1
25.0 "98':' 14.4.
19.2 36.6 391': 29.8 38:7 14.4 20.6
59.7 *7?:
10:8 12.8 2%
87.4 *
89.0
$2 6.:
15
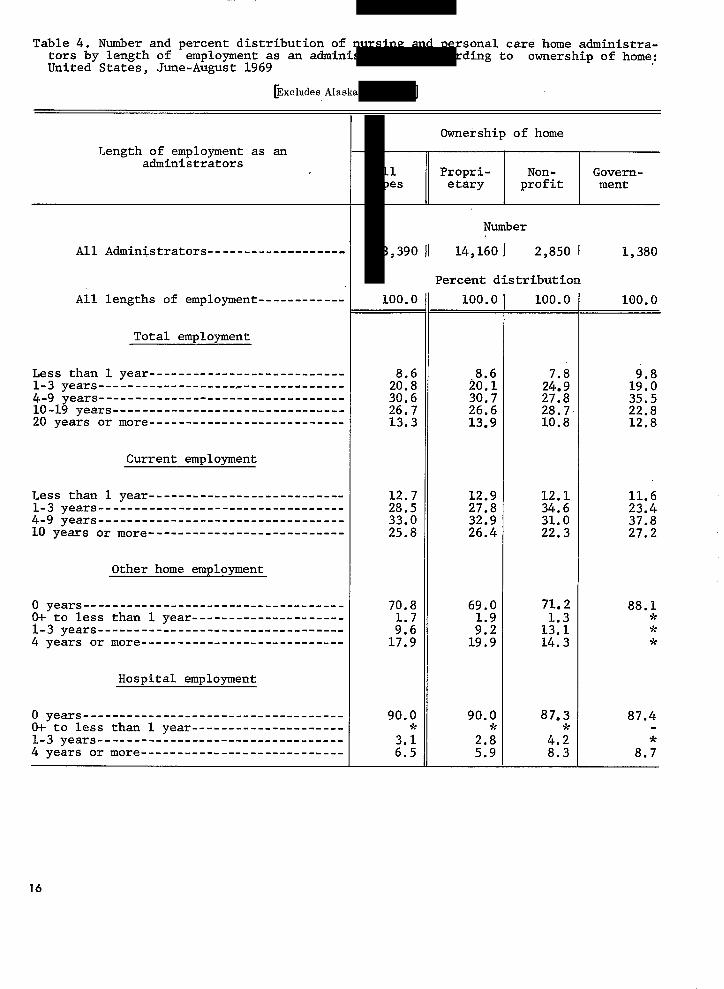
Table 4. Number and percent distribution of nursing and personal care home administrators by length of employment as an administrator, according to ownership of home: United States, June-August 1969
bxcludes Alaska and ij[awaii]
All types
18,390
Ownership of home T,ength of employment as an
administrators Propri- Non- Govern
etary profit ment
Number
All Administrators------------------- 11 14,160 1 2,850 1 1,380
Percent distribution All lengths of employment------------ 100.0 100.0 100.0 100.0
Total employment
Less than 1 year---------------------------1-3 years-------------------.---------------4-9 years----------------------------------10-19 years--------------------------------20 years or more---------------------------
2FE i80’6L 30:6 30:7 26.7 26.6 13.3 13.9
1E 35:5 22.8 12.8
Current employment
Less than 1 year---------------------------1-3 years----------------------------------4-9 years----------------------------------10 years or more---------------------------
12.7 12.9 12.1 28.5 27.8 34.6 33.0 32.9 31.0 25.8 26.4 22.3
11.6 23.4 37.8 27.2
Other home employment
0 years------------------------------------o+ to less than 1 year---------------------1-3 years----------------------------------4 years 01: more----------------------------
70.8 69.0 71.2 1.7
9'2 li'31 1E 19:9 14:3
88.1Jc * *
Hospital employment
0 years------------------------------------ 90.0*
90.0*
87.3 87.4 O+ to less than 1 year---------------------1-3 years---------------------------------- 4.;4 years or more---------------------------- 63:; 52:: 8.3 8.;
16

Table 5. Number and percentofnursing and personal care home administrators and median years of employment, by employment status and age: United States, June-August 1969
bxcludes Alaska and Hawaid
Administrators Median,years' of employment
Employment status and age Total Current Other
homeNumber Percent pzy- employ- employment mevt ment
All ages----------------------------- 18,390 100.0 8.0 5.3 7.1
Self-employed
21-44 years-------------------------------- 1,320 7.2 6.5 4.5 5.9 45 years and over-------------------------- 6,770 36.8 12.2 9.0 7.8
Employed
21-44 years ----_--------------------------- 2,830 15.4 3.2 2.3 3.9 45 years and over-------------------------- 5,810 31.6 7.4 4.8 7.7
Both
21-44 years-------------------------------- 530 2.9 6.7 4.1 4.5
45 years and over-------------------------- 1,130 6.1 8.9 5.9 8.4
17

------------------------------------
--------------------------
--------------------------------------
--------------------------------------
Table 6. Number and percent distribution of nursing and personal care home administrators by length of employment as an administrator, according to bed size of home: United States, June-August 1969
[Excludes Alaska and Hawaifl
Bed size of home Length of employment as an
administrator
Number All administrators----------------------- 18,390 11 8,lOOl 8,1401 2,150
Percent distribution
All lengths of employment---------------- 1oo.c 100.0 1oo.c 100.0
Total employment
Legs than 1 year------------------------------- 6.1 10.71-3 years-------------------------------------- 2E 15.1 24.84-9 years-------------------------------------- 3ok 29.7 31.610-19 years 26.7 32.1 22.220 years or more------------------------------- 13.3 17.0 10.7
Current employment
Less than l.year----- 12.7 20.0l-3 years -------------------i------------------ 28.5 1:*; 365': 37.54-9 years 33.0 36:5 30:o 31.010 years or more------------------------------- 25.8 36.4 19.0 11.5
Other home employment
0 years---------------------------------------- 72.2 70.6 65.8 O+ to legs than 1 year------------------------- 'E .1-3 years 10.: 22 10.:4 years or more-------------------------------- 197:; 15.8 18:9 22.1
Hospital employment
0 years---------------------------------------- 90.0 90.5*
91.0 84.8 O+ to legs than 1 year------------------------- * * 1-3 years -----_-__-----------------------------4 years or more-------------------------------- 63:: 62:: E 10.;
18

Table 7. Number and percentofnursing and personal care home administrators and median years of employment, by employment status and bed size of home: United States, June-August 1969
[Excludes Alaska and Hawaii]
Administrators Median years of employment
Employment status and bed size of home Other
Number Percent Total Current home pg- employ- employsent ment ment
All bed sizes------------------------ 18,390 100.0 8.0 5.3 7.1
Self-employed
Less than 30 beds -------------------------- 5,570 30.3 10.6 8.4 7.4 30-99 beds ----r--r--r--r-r--r----r-r- =i=2,270 12.3 11.3 7.6 8.1 100 beds or more ------------_-------------- 250 1.3 8.9 5.1 Jr
Employed
Less than 30 beds -------------------------- 2,230 12.1 8.2 6.2 3.9 30-99 beds -----------------3--------------- 4,760 25.9 4.4 3.1 6.0 100 beds or more ----------_--_------------- 1,650 9.0 6.3 3.0 7.5
Both
Less than 30 beds ---------_--I_------______ 300 1.6 9.1 5.9 *
30-99 beds --------_------------------------ 1,110 6.1 8.3 5.4 7.2 100 beds or more ---------_----_------------ 250 1.3 7.0 4.8 7.9
19

Table 8. Number and percent distribution of nursing and personal care home administrators by length,of employment as an administrator, according to type of home: United States, June-August 1969
@Excludes Alaska and Hawaig
Type of home
Length of employment as an administrator
T,E
Number All administrators----------------- 18,390 II 11,580 1 3,770
Percent distribution
All lengths of employment---------- 100.0 100.0 100.0
Total employment
Less than 1 year-------------------------1-3 years--------------------------------4-9 years--------------------------------10-19 years------------------------------20 years or more-------------------------
Current employment
Less than 1 year-------------------------1-3 years--------------------------------4-9 years--------------------------------10 years or more-------------------------
Other home employment
0 years----------------------------------O+ to less than 1 year-------------------1-3 years--------------------------------4 years or more--------------------------
Hospital employment
0 years----------------------------------O+ to less than 1 year-------------------1-3 years~-------------------------------4 years or more--------------------------
280': 30:6 26.7 23' 13.3 13:2
12.7 14.4 28.5 32.2 2E
30.8 35:o 280. 22.6 32.3
70.8 69.7 70.4 2.3 *
2;17:9 1x 1;::
90.0Jr
88.7 88.4
3.; 3.;2:; 7.3 7.6
I 3,040
100.0
244 36:l 30.7
7.4
11.2 19.8
75.1
195:!
97.23k
J(
20
I

Table 9. Number and percent distributionofnursing and personal care home administrators by hours worked last week, according to bed size of home and employment status:, United States, June-August 1969
[Excludes Alaska and Hawaii]
Hours worked (last week) Number
Bed size of home of and employment status adminis- Less 90
40 i%:: hours hours hours hours or hours more
Percent distribution
All bed sizes-------- 18,390 100.0 10.9 30.5 17.0 12.1 11.9 9.2 8.5
Self-employed------------- 8,090 100.0 11.3 21.9 13.2 12.8 15.6 12.4 12.9 Employed------------------- 8,640 100.0 9.6 37.1 20.2 11.4 9.4 7.1 5.3 Both----------------------- 1,660 100.0 15.4 38.6 19.5 12.0 5.9 * *
Less than 30 beds------ 8,100 100.0 11.5 19.7 12.5 10.6 17.4 14.0 14.3
Self-employed-------------- 5,570 100.0 11.7 16.9 11.4 12.0 18.5 14.2 15.3 Employed------------------- 2,230 109.0 8.9 25.7 14.7 6.7 17.1 14.4 12.5 Both----------------------- 300 100.0 * * * * * *
30-99 beds------------- 8,140 100.0 11.3 39.7' 19.3 12.6 7.8 5.7 3.8
Self-employed-------------- 2,270 100.0 10.8 32.3 16.3 14.9 9.8 8.8 7.1 Employed------------------- 4,760 100.0 10.8 42.0 20.6 12.4 7.2 4.7 2.4 Both----------------------- 1,110 100.0 14.4 44.9 19.5 * * * *
100 beds or more-------- 2,150 100.0 6.9 36.8 25.8 15.7 6.3 *
Self-employed-------------- 250 100.0 * * * * * * Employed------------------- 1,650 100.0 7.2 38.4 26.2 15.0 * * Both----------------------- 250 100.0 * * * * * *
trators Total than 50-59 60-69 70-79 80-89 hours
21
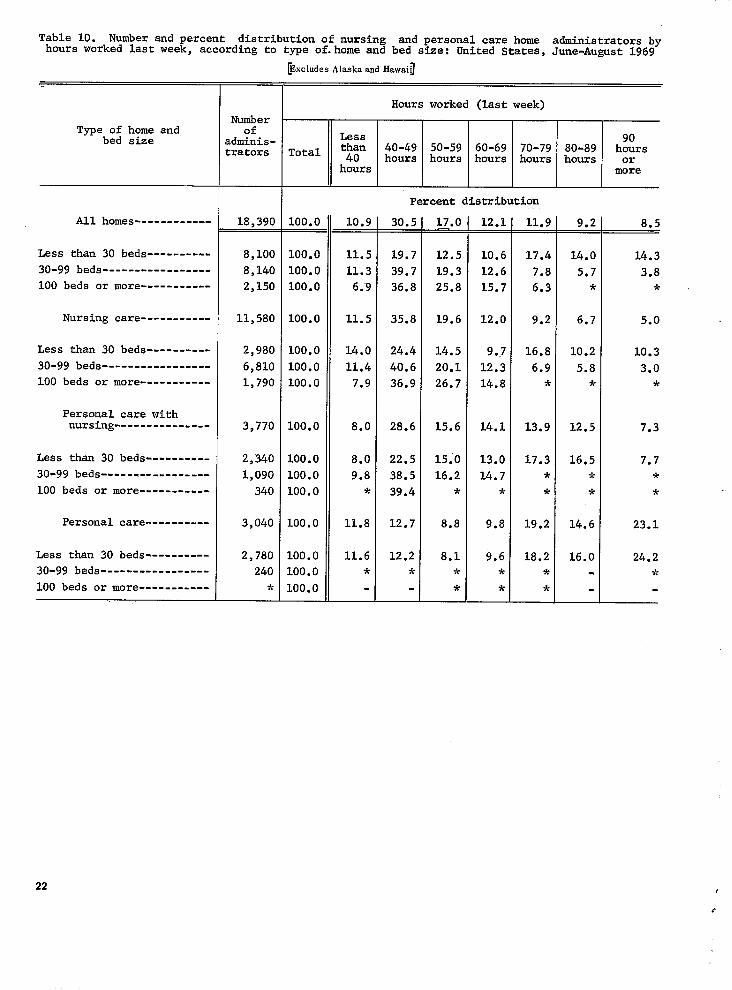
Table 10. Number and percent distribution of nursing and personal care home administrators byhours worked last week, according to type of-home and bed size: United States, June-August I.969
[Excludes Alaska and Hawaii] -
NumberType of home and of
bed size administrators
All homes------------ 18,390
Less than 30 beds---------- 8,100 30-99 beds----------------- 8,140 100 beds or more----------- 2,150
Nursing care----------- 11,580
Less than 30 beds---------- 2,980 30-99 beds----------------- 6,810 100 beds or more----------- 1,790
Personal care withnursing--------------- 3,770
Less than 30 beds---------- 2,340 30-99 beds----------------- 1,090 100 beds or more----------- 340
Personal care---------- 3,040
Less than 30 beds---------- 2,780 30-99 beds----------------- 240 100 beds or more----------- *
22
Hours worked (last week)
Less 90 Total than 40-49 50-59 60-69 70-79 80-89 hours4. hours hours hours hours hours or
hours more
Percent distributFon
100.0 - 10.9 30.5 _L17.0 12.1 11.5 9.2 8.5-
100.0 100.0 100.0
100.0
100.0 100.0 100.0
100.0
100.0 100.0 100.0
100.0
100.0 LOO.0 LOO.0
11.5 19.7 12.5 10.6 17.4 14.0 14.3 11.3 39.7 19.3 12.6 7.E 5.7 3.8
6:9 36.8 25.8 15.7 6 .r * *
11.5 35.8 19.6 12.0 9.2 6.7 5.0
14.0 24.4 14.5 9.7 16.8 10.2 10.3 11.4 40.6 20.1 12.3 6.9 5.8 3.0
7.9 36.9 26.7 14.8 * * *
8.0 28.6 15.6 14.1 13.9 12.5 7.3
8.0 22.5 15.0 13.0 17.3 16.5 7.7 9.8 38.5 16.2 14.7 * * *
* 39.4 * * * * *
11.8 12.7 8.8 9.8 19.2 14.6 23.1
11.6 12.2 8.1 9.6 18.2 16.0 24.2 * * * * * *
* * *
,

Table 11. Number and percent distribution of nursing and personal care home administrators byhours worked last week, according to employment status and type of home: United States, June-August 1969
bxcludes Alaska and Hawaii]
Number Employment status and of
type of home administrators
All employmentstatuses------------ 18.390
Nursing care--------------- 11,580 Personal care with
nursing------------------- 3,770 personal care-------------- 3,040
Self-employed---------- 8,090
Nursing care--------------- 3,890 Personal care with
nursing------------------- 2,010 personal care-------------- 2,190
Employed--------------- 8,640
Nursing care--------------- 6,300 personal care--------------
nursing------------------- 1,590
Hours worked (last week)
Less 90 Total than 40-49 50-59 60-69 70-79 80-89 hours4. hours hours hours hours hours or
hours more
Percent distribution
10.9 30.5 17.0 12.1 11.9 9.2 8.5
11.5 35.8 19.6 12.0 9.2 6.7 5.0
8.0 28.6 15.6 14.1 13.9 12.4 7.3 11.8 12.7 8.8 9.8 19.2 14.6 23.1
11.3 21.9 13.2 12.8 15.6 12.4 12.9
11.7 28.5 15.7 12.7 11.1 11.0 9.2
9.3 23.4 15.3 13.6 18.3 13.6 6.5 12.2 8.8 6.7 12.2 21.2 13.6 25.3
9.6 37.1 20.2 11.4 9.4 7.1 5.3
11.1 39.5 21.9 11.8 8.6 4.5' 2.6
6.3 33.9 15.1 14.7 9.6 11.3 9.0 * 23.7 15.9 * 16.1 19.6 19.8
15.4 38.6 19.5 12.0 5.9
13.0 39.8 20.3 10.9 *
* * * * * * * *
100.0
100.0
100.0 100.0
100.0
100.0
100.0 100.0
100.0
100.0
100.0 personal care-------------- 750 100.0
Both------------------- 1,660 100.0
Nursing care--------------- 1,390 100.0 Personal care with
nursing------------------- 170 100.0 personal care-------------- 100 100.0
23

Table 12. Number and percent distribution of nursing and personal care home administrators by:;XIF worked last week, according to bed size and ownership of home: United States, June-August
Excludes Alaska and Hawaii
Hours worked (last week) Number
Bed size and of Less 90ownership of home idminis- Total than 40-49 50-59 60-69 70-79 80-89 hoursxators 4. hours hours hours hours hours or hours more
percent distribution
All bed sizes-------- 18,390 100.0 10.9 30.5 17.0 12.1 11.9 9.2 8.5 -
Proprietary---------------- 14,160 100.0 11.0 31.1 16.9 12.3 11.7 9.2 7.8 Nonprofit------------------ 2,850 100.0 10.4 29.8 22.6 15.1 9.5 5.7 6.9 Government----------------- 1,380 100.0 10.0 26.1 * * 18.2 16.7 18.3
Less than 30 beds------- 8,100 100.0 11.5 19.7 12.5 10.6 17.4 14.0 14.3
Proprietary---------------- 6,670 100.0 12.3 20.9 11.6 11.8 17.0 13.4 13.1 Nonprofit------------------ 720 100.0 * * 33.0 * 16.9 * 18.0 Government----------------- 710 100.0 * 17.9 22.1 25.9 22.1
30-99 beds------------- 8,140 100.0 11.3 39.7 19.3 12.6 7.8 5.7 3.8
Proprietary---------------- 6,190 100.0 10.7 41.2 20.3 11.7 7.5 5.6 3.1 Nonprofit------------------ 1,540 100.0 15.8 34.4 16.8 17.3 7.4 * * Government----------------- 410 100.0 * 35.6 * * * * *
100 beds or more------- 2,150 100.0 6.9 36.8 25.8 15.7 6.3 *
Proprietary---------------- 1,300 100.0 * 35.2 28.3 * * * Nonprofit------------------ 590 100.0 * 41.5 25.0 * * * Government----------------- 260 100.0 * * * * * *
24

----------------------------------
-Table 13. Percent distribution of time administrators spent performing specific services by employment status: .-. United States, June-August 1969
. [Excludes Alaska and
IHawaig
Employment status
Service performed by administrator All Self-
statuses employed Employed Both
Percent distribution of time
All services ---__------------------------ ‘100.0 100.0 100.0 100.0
professional services-------------------------- 71.5 61.6 79.8 84.3
Administration --_-_-_--_----_-----___________ 58.8 46.3 69.5 73.5 Nursing care--------------------------------- 7.5 10.2 5.2 3.8 Medical and dental care---------------------- 0.5 0.4 0.5 0.4 physical therapy----------------------------- 0.4 0.5 0.3 0.4 Occupational therapy------------------------- 0.6 0.6 0.5 1.3 Recreational therapy------------------------- 1.5 1.7 1.2 1.4 Speech and hearing therapy------------------- 0.3 0.2 0.3 0.2 Social work 2.0 1.6 2.2 3.3
Subprofessional services----------------------- 25.3 34.7 17.5 12.6
Clerical work ----------_---------____________ 6.5 6.3 6.7 6.0 Kitchen or dietary work---------------------- 12.5 19.1 7.0 4.6 Housekeeping services------------------------ 6.3 9.3 3.9 2.1
Other services--------------------------------- 3.3 3.8 2.7 3.0
25

Table 14. Percent distribution of time ices by ownership of home:
~[Excludes
Service performed by administrator
All services------------------------
professional se&ices _-_--_-_-_--_-_-------
Administration---------------------------Nursing care-----------------------------Medical and dental care---------------i-physical therapy-------------------------
Occupational therapy---------------------
Recreational therapy---------------------
Speech and hearing therapy---------------Social work -_----_--_-----_-_------------
Suj-$~~f&.<~#<& services-------------------
Clerical work----------------------------
Kitchen or dietary work------------------Housekeeping services--------------------
Other services------- _______________ - ____
26
administrators spent performing specific serv-United States, June-August 1969
Alaska and Hawaii]
Ownership of home'
All Propri- Non- Governtypes etary profit ment
Percent distribution of time
100.0 lOOI 100.0 100.0
75.1 70.4 81.5 63.8
58.8 56.8 72.1 53.4 7.5 8.2 4.5 6.2. 0.5 0.4 0.4 0.6 0.4 0.5 0.3 * 0.6 0.7 0.6 0.3 1.5 1.5 1.5 1.3 0.3 0.2 0.2 0.5 2.0 2.1 1.9 1.5
25.3 26.8 14.6 30.8
6.5 6.7 6.4 4.2 12.5 13.4 6.7 15.0
6.3 6.6 1.7 11.5
-_ 3.3 2.9 3.8 5.4

Table 15. Percent distribution of time administrators spent performing specific services by type of home: United States, June-August 1969
Type of home I
Service performed by administrator Personal care All Nursing
types care 2L,
Percent distribution of time All services------------------------ 100.0 100.0 100.0 100.0
Professional services--------------------- 71.5 81.3 68.1 46.4
Administration-------------------------- 58.8 67.9 52.2 39.0 Nursing care---------------------------- 7.5 7.0 11.3 4.7 Medical and dental care----------------- 0.5 0.5 0.7 0.2 Physical therapy------------------------ 0.4 0.5 0.6 Occupational therapy-------------------- 0.6 0.9 0.4 0.4 Recreational therapy-------------------- 1.5 1.6 1.4 1.4 Speech and hearing therapy-------------- 0.3 0.3 0.2 0.2 Social work----------------------------- 2.0 2.6 1.5 1.5
Subprofessional services----------------- 25.3 16.6 27.2 48.9
Clerical work--------------------------- 6.5 7.9 5.9 2.9 Kitchen or dietary work----------------- 12.5 5.8 14.8 29.9 Housekeeping services------------------- 6.3 2.9 6.5 16.2 ._
Other services---------------------------- 3.3 2.2 4.9 4.7
27

---------------------------------
Table 16. Percent distribution of time administrators spent performing specific services by bed size of home: United States, June-August 1969
[Excludes Alaska and Hawaii
Service performed by administrator
All services -------------------_---------
Professional services ---_-------------__-------
Administration -_-----3_----------------------Nursing care ------I-------_----_-------------Medical and dental care-------------~--------Physical therapy ---,---,,,-,,,,,,,,,,,,,,,,, Occupational therap’y-------------------------
Recreational therapy--------------------------
Speech and hearing therapy-------------------Social work----------------------------------
Subprofessional services-----------------------
Clerical work --------------------------------Kitchen or dietary work----------------------Housekeeping services------------------------
Other services
Bed size of home
qji-+$g
Percent distribution of time
100.0 100.0 100.0 100.0
71.5 58.0 82.9 90.5
58.8 42.2 72.6 82.5 7.5 11.1 4.6 0.5 0.4 0.5 0.4 0.5 0.4 0.6 0.6 0.7 1.5 1.7 1.3 0.3 0.3 0;3 2.0 1.2 2.5
25.3 38.2 14.6
6.5 5.7 8.0 12.5 21.5 4.5
6.3 10.9 2.1
3.3 4.0 2.6
1.8 r-0.6 0.4 0.6 1.1 0.2 3.4
7.1
3.9 2.0 1.2
2.5
28

Table 17. Percent distribution of time administrators spent performing specific services by age: United States, June-August 1969
[Fzcludes Alaska and Hawaii]
Age Service performed by administrator lg@q+p
Percent distribution of time
All services------------------------- 100.0 LOO.0 100.0 LOO.0 100.0 100.0
professional services---------------------- 71.5 76.3 79.0 71.4 69.6 64.5
Administration --_--__-_--_--_-___-_______ 58.8 65.1 68.8 56.6 57.2 51.9 Nursing care ---__--__-___----__---------- 7.5 6.1 5.2 9.0 7.5 7.4 Medical and dental care------------------ 0.5 0.3 0.3 0.3 0.6 0.6 physical therapy------------------------- 0.4 0.3 0.3 0.5 0.4 0.7 Occupational therapy--------------------- 0.6 -k 0.6 0.5 0.8 0.8 Recreational therapy--------------------- 1.5 1.0 1.1 1.6 1.6 1.5 Speech and hearing therapy--------------- 0.3 0.5 0.1 0.4 0.2 0.3 Social work -_-----_-_----_--___---------- 2.0 3.0 2.5 2.5 1.4 1.3
Subprofessional services------------------- 25.3 22.1 17.3 25.1 27.0 33.3
Clerical work ---__------------_---------- 6.5 8.1 6.8 7.3 4.9 7.7 kitchen or dietary work------------------ 12.5 7.4 6.4 11.7 15.3 17.5 Housekeeping services-------------------- 6.3 6.6 4.0 6.2 6.8 8.1
Other services --__-__--_----_-__-_--------- 1.6 3.8 3.5 3.4 2.4
29

APPENDIX I
TECHNICAL NOTES ON METHODS
Survey Design
General. -The Resident Places Survey- 3 (RPS- 3) was conducted during June-August 1969 by the Division of Health Resources Statistics in cooperation with the U.S. Bureau of the Census. This was a sample survey of nursing and personal care homes in the conterminous United States which provide care to the aged and infirm. Collected in the survey were data about the sample establishment itself, the health of a sample of the patients or residents, the administrator of the establishment, and a sample of the employees.
Resident Places Survey-3 is the third of a series of institutional population surveys. The institutional population surveys are a part of the National Health Survey program. The previous surveys have been designated as Resident Places Surveys 1 and 2, or RPS-1 and RPS-2. Several reports on the results of RPS-1 and RPS-2 have been published.“li
ScampZingframe.-The list of nursing and personal care homes included in the 1967 Master Facility Inventory (MFI) was the primary sampling frame (universe) for Resident Places Survey-3. The MFI was supplemented by a list of new homes, “births ‘I which were possibly within scope of RPS-3 but were iot confirmed in the 1967 MFI survey. The “births” hadbeen reported in the Agency Reporting System (ARS)as being in operation at the time of the survey. A description of the MFI and ARS has been published.r2
To be eligible for the survey, establishments must have maintained at least three beds and routinely provided some level of nursing or personal care. Thus a home providing only room and board or domiciliary care to its residents was not eligible for RPS-3 even if it was a home for the aged. The classification scheme for homes is described in appendix II.
Sample design.-The sample was a stratified two-stage probability design; the first stage was a selection of establishments and their administrators and the second stage a selection of residents and employees of the sample establishments. In preparation for the first-
NOTE:ThL:list of references followsthe text.
stage sample selection, establishments listed in the MFI were sorted into three type of service strata: nursing care homes, personal care homes with nursing, and personal care homes. The “births” from the Agency Reporting System were treated as a fourth type of service stratum. Each of these four strata was sorted into seven bed-size groups, producing 28 primary strata, as shown in table I. MFI establishments were ordered by type of ownership, State, and county. The sample of MFI establishments and the “births” were then selected systematically after a random start within each primary stratum. Table I shows the distributionof establishments in the sampling frame and the finaldisposition of the sample with regard to response and in-scope status.
The second-stage sample selection of residents and employees was carried out by Bureau of thecensus interviewers at the time of their visits to the establishments in accordance with specific instructions given for each sample establishment. The sampling frame for residents was the total number of residents on the register of the establishment on the day of the survey. The sampling frame for employees was the Staff Information and Control Record (HRS-4e, appendix III), on which the interviewer listed the names of all employees of the establishment and sampled only professional and semiprofessional employees by using pre-designated sampling instructions that appeared at the head of each column of this form.
Survey procedures.-The Bureau’ of the Census collected the data according to specifications of the Division of Health Resources Statistics. The initial contact with an establishment was a letter (HRS-4g-1, appendix III) signed by the Director of the Bureau of the Census mailed prior to a personal visit to each sample facility. This letter was accompanied by the facility and administrator questionnaires (HRS-4a and HRS-4b, appendix III). The respondent for the facility questionnaire was usually the administrator or another member of the staff designated by the operator of,the establishment. Information on the administrator questionnaire was self-enumerative and was completed by the person who was designated as “administrator” by
30
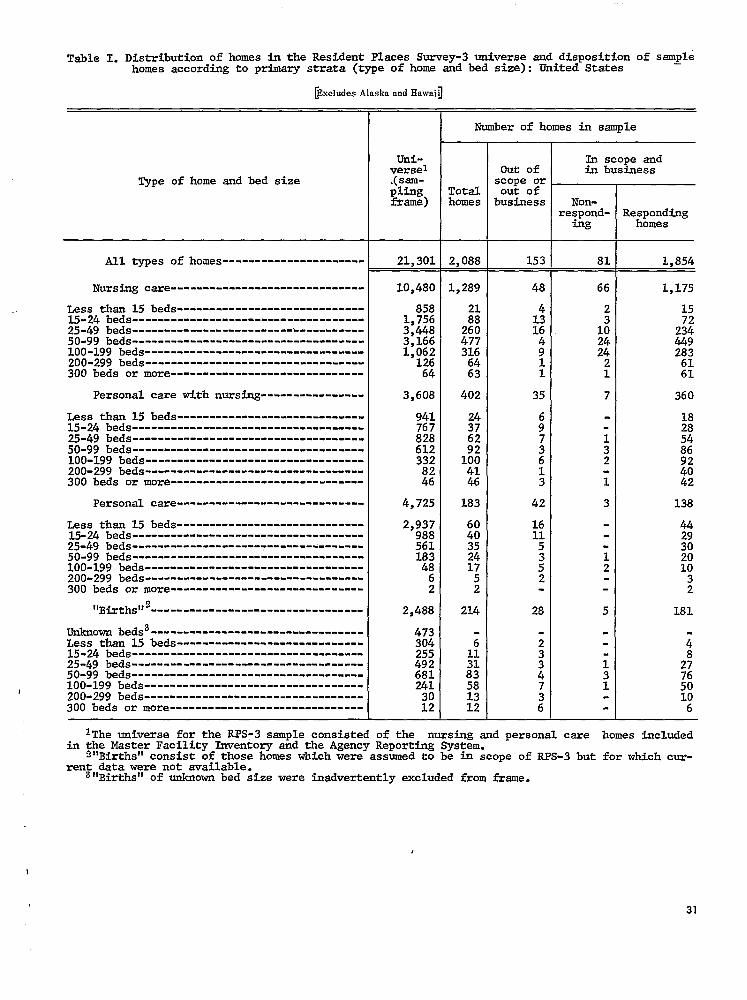
Table I. Distribution of homes in the Resldent Places Survey-3 universe and disposition of samplehomes according to primary strata (type of home and bed size): United States
@xcludes Alaska and Hawaii] -
T Number of homes in sample
Uni- In scope and verse1 out of in business
Type of home and bed size *(Sam- scope or pling Total out of frame) homes business Non-
respond-w3
All types of homes---------------------- 21,301 2,088 153 81 1,854
Nursfng care _--__------------_------------ 10,480 1,289 48 66 1,175 ~~~~ than 15 beds----------------------------- 858 1515-24 beds _--------__---__-------------------- 1,756 i?3: 3
260 10 23:50-99 beds ----_------------------------------- m 477 449loo-199 beds ---------------_--_-_____________I 1:062 316 2 283200-299 beds -------_-___--_-_----------------- 126 61300 beds or more -------_--_-----__-___________ 64 2 f
Personal care with nursFng---------------- 3,608 402 7 Less than 15 beds-----------------------------15-24 beds --------_---_-_--___________________ 25-49 beds -_------_----------_----------------50-99 beds------------------------------------100-199 beds --__-__--_-_-----_----------------200-299 beds----------------------------------300 beds or more -_-_--_-_-_--_----_-__________
personal care----------------------------- 4,725 183 42
Less than 15 beds _-----_-----__---_-_--------- 1615-24 beds------------------------------------
25-49 beds ------------------------------------50-99 beds -----__----_-__--_--________________ loo-199 beds --_---------_-----_--------------- i
2200-299 beds----------------------------------300 beds or more -_---_-------_--__-___________
"Births"P --_-----------_--_--_____________ 2,488 214 28
Unknown beds3 -__-----_-----_-_-__-------------Less than 15 beds-----------------------------15-24 beds ----__--_-_----_-_------------------25-49 beds --_--------_------------------------50-99 beds --_-----_--_--_--_--________________ loo-199 beds _---------------------------------200-299 beds _--_-----_--------__--------------300 beds or more --_--__--_-_------_-__________
473304 ;;255
2872% 76
2:k % 12 6
IThe universe for the RPS-3 sample consisted of the nursing and personal care homes includedin the Master Facility Inventory and the Agency Reporting System.
2"Births" consist of those homes which were assumed to be in scope of RPS-3 but for which cur-rent data were not available.
S"Births" of unknown bed size were inadvertently excluded from frame.
31

the owner or operator of the sample facility. These two forms were collected by an interviewer during the personal visit to the facility and were edited for completeness and consistency at that time. The resident information was obtained during the personal inter-view at the sample establishment. The sample of residents within an establishment was selected systematically according to predetermined sampling schemes. The interviewer was asked to list on the back of the Current Patient Questionnaire (HRS-4f, appendix III) all the residents or patients in the sample and to complete the health information for each of the sample patients from personal knowledge of a staff member of the establishment who had close contact with the resident and firsthand knowledge of the resident’s health condition.
The staff information was obtained by means of a self-enumeration questionnaire (HRS-4c, appendix III).
The usual checks and followups were performed during the course of the survey. The completed questionnaires were edited and coded by the National Center for Health Statistics, and the data were processed on an electronic computer. ‘This processing included assignment of weights, ratio adjustments, and other related procedures necessary to produce national estimates from the sample data.
General Qualifications
Nonresponse and imputation of missing data.-Statistics presented in this report were adjusted for failure of a home to respond. Data were also adjusted for nonresponse which resulted from failure to complete one of the questionnaires or the failure to complete an item on a questionnaire.
NOTE: The list of references follows the text.
Round&g of numbers.-Estimates relating to residents and employees have been rounded to the nearest hundred and homes or administrators to the nearest’ ten. For this reason detailed figures within tables do not always add to totals. Percents were calculated on the basis of original, unrounded figures and will not necessarily agree with percents which may be calculated from rounded data.
Est ima@z procedure.-The statistics presented in this report are essentially the result of ratio estimation techniques. These techniques have been described in the appendixes of earlier publications.3-11
Reliability of estimates. -Since statistics presented in this report are based on a sample, they will differ somewhat from figures that would have been obtained if a complete census had been taken using the same schedules, instructions, and procedures. As in any survey, the results are also subject to reporting and processing errors and errors due to nonresponse. To the extent possible, these types of errors were kept to a minimum by methods built into surveyprocedures.
The sampling error (or standard error) of a statistic is inversely proportional to the square root of the number of observations in the sample. Thus as the sample size increases, the standard error decreases. The standard error is primarily a measure of the variability that occurs by chance because only a sample rather than the entire universe is surveyed. As calculated for this report, the standard error also reflects part of the measurement error, but it does not measure any systematic biases in the data. The chances are about 2 out of 3 that an estimate from the sample differs from the value which would be obtained from a complete census by less than the standard error. The chances are about 95 out of 100 that the difference is less than twice the standard error and about 99 out of 100 that it is less than 2% times as large.
32

Relative standard error in
percent
Size of estknate
--
-------
Relative standard errors of aggregates shown in this report can be determined from table II. The relative standard error of an estimate is obtained by dividing the standard error of the estimate by the estimate itself and is expressed as a percent of the estimate. Standard errors of estimate! percentages are shown in tabie III.
‘Lable II. Approximate relative standard errors of esttited numbers of administrators
Relative Relative Size of standard Size of standard estimate error in estknate error in
Rules for determining the standard error of a mean value, of a median value, ‘or of. the difference between two statistics are published.
Table III. Approximate standard errors of percentages for administrators
Estimated percent Base of
estimated percent m
percent
loo----- 3,000---200..--- 22 4,000---300------ 25:6 5,000---
22.1 6 ,OOO------m-- 19.8 7,000---%------
18.0 8,000---: “,;,“::I::: 16.6 9,000---
800-----m 15.5 ;;,;;;-goI)----- -14.6 l,OOO---- 18: OOO-- 2,000---- 758.
percent:
200-----.---500~--------------1,000----L----2,000----------3,000------------4,000~--------w---5,000-------------7,000---w-“ f3,1-3)0--------g,ooo----------10,000----------18,0()&--------
L
Standard error expressedin percentage points
4.4 6.9
E 2: 114 212 1.1 1.8 1.0 1.5
E 5 017 1:1 0.7 1.0 0.6 1.0 0.4 0.7
33

APPENDIX II
DEFINITIONS OF CERTAIN TERMS USED IN THIS REPORT
Terms Relating to Administrators Due to the P-year interval between the MFI survey and the RPS-3 survey, it was felt that for pro-
AdminisCmtor.--An administrator is the person ducing statistics by type of service from the RPS-3 designated as “administrator” by the owner or man- survey the homes should be reclassified on the basis ager of each sample home. of the current data collected in the survey. This
Length of work [email protected] Data on length of work classification procedure is essentially the same as the experience refer to length of employment as an admin- MFI scheme. The three types of service classes deistrator in the position currently held and any previous lineated for RPS-3 are defined as follows: employment as an administrator of other nursing homes,
1. A nursing care home is defined as one in whichhomes for the aged, or similar facilities or hospitals. Length of current employment.--length of current 50 percent or more of the residents received
employment is the time between the date the survey was nursing care (see definition of nursing care)
conducted in the sample home and the date the admin- during the week prior to the survey in the
istrator began working as anadministrator in that home. home and a registered nurse (RN) or a licensed practical nurse (LPN) was employed.
Terms Relating to Homes or Residents 2. A personal care home with nursing is defined as one in which either (a) over SOpercent of the
Bed.-A bed is defined as one set up and regularly residents received nursing care during the week maintained for patients or residents. Beds maintained prior to the survey, but there were no RN’s or for staff and beds used exclusively for emergency, LPN’s on the staff or (b) some, but less than 50 services are excluded. percent, of the residents received nursing care
Resident.-A resident is defined as a person who during the week prior to the survey regardless has been formally admitted but not discharged from an of the presence of RN’s or LPN’s on the staff establishment. All such persons were included in the but in which one or more of the following con-survey whether or not they were physically present at ditions were met: the time. l Medications and treatments were admin-
Nursing care. -Nursing care isdefined as a service istered in accordance with physicians’ orders. that provides one or more of the following treatments: l Supervision over self-administered medicahypodermic injection; intravenous injection; intramus- tions was provided. cular injection; taking of temperature, pulse, respi- 0 Three or more personal services were rouration, or blood pressure; application of dressings or tinely provided. bandages; bowel and bladder retraining; nasal feeding; 3. A personal care home is defined as one in which catheterization; irrigation; oxygen therapy; full bed residents routinely received personal care bath; and enema. but no residents received nursing care during
the week prior to the survey and one or more Classification of Homes by Type of Service of the following criteria were met:
l Medications and treatments were admin-For purposes of stratification of the universe istered in accordance with physicians’ orders,
prior to selection of the sample, the homes on the or supervision over medications which may MFI were classified as nursing care, personal care be self-administered was provided. with nursing, and personal care. Details of the clas- l Three or more of the criterion personal sification procedure in the MFI have been published. services were routinely provided.
34

-------
--
--
Ownership Classification
proprietary home. -A propretary home is one operated under private commercial ownership.
Nonprofit home. -A nonprofit home is one operated under voluntary or nonprofit auspices, including both church-related institutions and institutions that are not church-related.
Government home .-A government home is one operated under Federal, State, or local government au-spices.
Geographic Region
The regions of the United States (excluding Alaska and Hawaii), which correspond to U.S. Bureau of the Census regions are:
Region States Included
Northeast Maine, New Hampshire, Vermont, Massachusetts, Rhode Island,
ooo-
North Central
South___________
West ___-----_
Connecticut, New York, New Jersey, Pennsylvania
Michigan, Ohio, Indiana, IllinOiS, Wisconsin, Minnesota, Iowa, Missouri, North Dakota, South Dakota, Nebraska, Kansas
Delaware, Maryland, District of Columbia, Virginia, West Virginia, North Carolina, South Carolina, Georgia, Florida, Kentucky, Tennessee, Alabama, Mississippi, Arkansas, Louisiana, Oklahoma, Texas
Montana, Idaho, Wyoming, Colorado, New Mexico, Arizona, Utah, Nevada, Alaska, Washington, Oregon, California, Hawaii
35
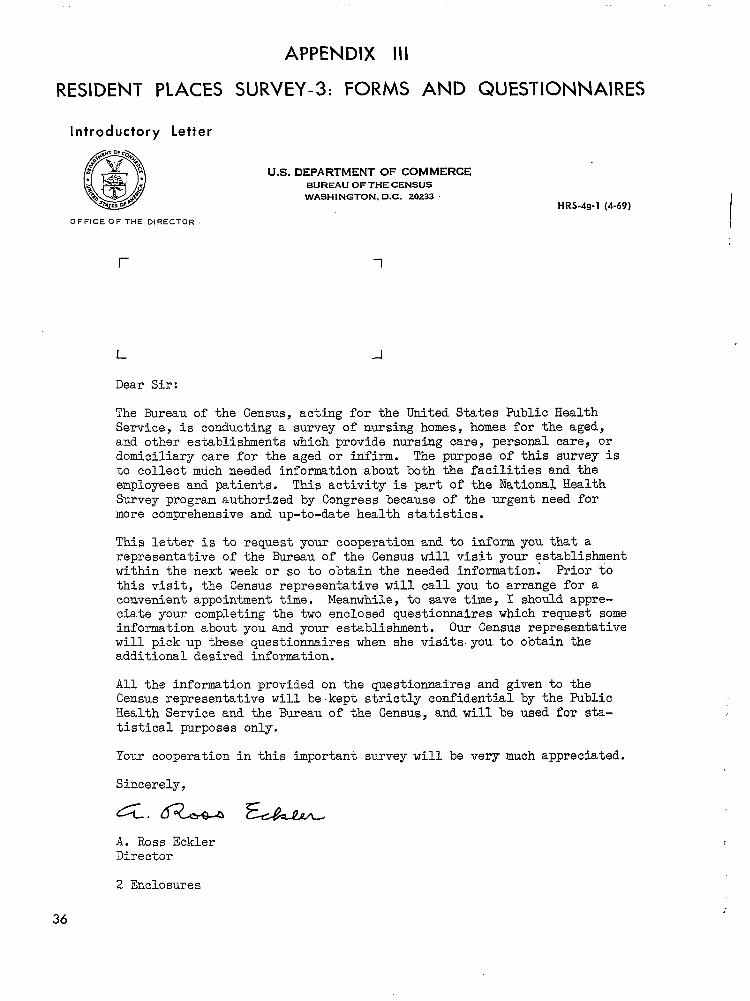
APPENDIX III
RESIDENT PLACES SURVEY-3: FORMS AND QUESTIONNAIRES
Introductory Letter
U.S. DEPARTMENT OF COMMERCE BUREAU OF THE CENSUS
WASHINGTON. D.C. 20233 HRS-49-l (4-69)
OFFICE OF THE DIRECTOR.
r 1
L -I
Dear Sir:
The Bureau of the Census, acting for the United States Public Health Service, is conducting a survey of nursing homes, homes for the aged,and other establishments which provide nursing care, personal care, or domiciliary care for the aged or infirm. The purpose of this survey is to collect much needed information about both the facilities and the employees and patients. This activity is part of the National Health Survey program authorized by Congress because of the urgent need for more comprehensive and up-to-date health statistics.
This letter is to request your cooperation and to inform you that a representative of the Bureau of the Census will visit your establishment within the next week or so to obtain the needed information. Prior to this visit, the Census representative will call you to arrange for a convenient appointment time. Meanwhile, to save time, I should appreciate your completing the two enclosed questionnaires which request some information about you and your establishment. Our Census representative will pick up these questionnaires when she visits. you to obtain the additional desired information.
All the information provided on the questionnaires and given to the Census representative will be.kept strictly confidential by the Public Health Service and the Bureau of the Census, and will be used for statistical purposes only.
Your cooperation in this important survey will be very much appreciated.
Sincerely,
A. Ross Eckler Director
2 Enclosures
36

Facility Questionnaire
rruoger Dureau L”0. DO-mY”Zz; npprovar JLxpres August 31, 1965
NOTICE - All information which would permit identification of the facility will be hold in strict confidence, wil l be used onlyby persons engaged in and for the purposes of the survey, and will not be disclosed or released to others for any purposes.
ORM HRS.40 (PIease correct &y error in name and address including ZIP code)L.?,.c.D)
U.S. DEPARTMENT OF COMMERCE BtJRE*U OF THE CENSUS
*C~NG AS cot-iEcstb40 *Cimcr FOR THE U.S. PUBLIC HEALTH SERVICE
FACILITY QUESTIONNAIRE
1. What was the riumber of inpatients in this facility on December 31, 1968? Number
2, During the seven days prior to December 31, 1968, how many of the PERSONS in question 1 received “Nursing care”? Count each person only once. Consider that an inpatient received nursing care if he received any of the following services:
Nasal feeding Catheterization Irrigation , No. of Oxygen therapy Fu I I bed-bath Enema perSO”* Hypodermic injection Intravenous injection Temperature-pulse-respiration Blood pressure Application of dressing Bowel and bladder retraining
or bandage
3. In 1968, what was the total inpatient doys of core provided? (The sum of the number of DWS
days of caregiven to each patient from l/l/68 through 12/31/68)
4. In 1968, how many admissions did this facility have? Number
5. In 1968, how many of the admissions were Medicare patients? Number
60. In 1968, how many discharges, excluding deaths, did this facility have? Number
Total How many were No. Msdicorepotisnts
b. How many patients were discharged to the following places -
(1) general or short-stay hospital? . . . . . . . . . . . . . . . . . . . . . . . - nw=
(2) long-term specialty hospital (except mental)?. , . . . . . . . . . . . . - 0 No”e
(3) mental hospital? . . . . . . . . . . . . . . . . . . . . . . . . . . . . . . . . - aNone
(4) another nursing home?. . . . . . . . . . . . . . . . . . . . . . . . . . . . . - nNone
(5) personal care or domiciliary home? . . . . . . . . . . . . . . . . . . . . n None
(6) patient’s home or family?. . . . . . . . . . . . . . . . . . . . . . . . . . - n None
(7) other places? (specify plocel n None
7. In 1968, how many persons died while patients of this facility? n None
8. What is the tot.1 number of patient beds regularly maintained Beds (set up and staffed for use) in this facility?
9. What is the total NUMBER OF INPATIENTS (patients or residents) Number
who stayed in your facility lost night. ? (DO NOT 1NCLUDE EMPLOYEES OR OWkERS)
IO. Euring the post seven days, how many of the INPATIENTS in question 9 received Nursing care”? Count each person only once. Consider that an inpatient received
nursing care if he received any of the following services:
Nasal Oxygen therapy Full bed-bath Enema perSO”*
Hypodermic injection intravenous injection Temperature-pulse-respiration Blood pressure Application of dressing Bowel and bladder retraining
or bandage
Please continue on reverse side
feeding Catheterization Irrigation No. of
37

. Which of the following services are ROUTINELY provided?
a. Supervision over medications which may be self -administered. . . . . . . . . . . . . . . . rnyes 2nNo
lOYes 2nNob. Medications and treatments administered in accordance with physicians’ orders . . . . .
lOYes 2nNo c.Rubandmassage . . . . . . . . . . . . . . . . ...’ . . . . . . . . . . . . . . . . . . . . . . . . . .
lOYes 2nNo d. Help with dressing . . . . . . . . . . . . . . . . . . . . . . . . . . . . . . . . . . . . . . . . . . . .
lOYes 20No e. Help with correspondence or shopping . . . . . . . . . . . . . . . . . . . . . . . . . . . . . ;..
lOYes 2C3No f. Help with walking or.getting about . . . . . . . . . . . . . . . . . . . . . . . . . . . . . . . . . . _
ll-JYes 2nN-a g. &lp with eating.. . . . . . . . . . . . . . . . . . . . . . . . . . . . . . . . . . . . . . . . . . . . .
h. None of the above services ROUTINELY provided, room and board provided only . . . . 0
I aYes 20No
2. Is this FACILITY participating in the Medicare program? ‘I%’ fo Number
5. How many beds are certified for Medicare? Number
la. For how many patients is this facility now receiving Medicare payments? Number
b. How many of these Medicare patients lived (had their home) in this State when admitted to this facility?
5. In addition to two physicians, does the Utilization Review Committee include
loYes 2aN.z a. the nursing director? . . . . . . . . . . . . . . . . . .
lOYes 20Nob. a social worker? . . . . . . . . . . . . . . . . . . . . .
lOYes 20No c. the nursing home administrator? . . . . . . . . . . .
d. a physical therapist? . . . . . . . . . . . . . . . . . . lOYes 2dN0
e. any other members? (Specify occupations lOYes 20No
5. How many persons are employed in this facility? Total employees
(Include members of religious organizations and orders who provide their services.)
7. Last month, were the following services provided on a regular How many persons Last month, how many
basis through contracts or other fee arrangements? provided this hours did they spend service? providing this service?
a. Physician (M.D. or D.O.)
b. Dental
c. Pharmaceutical
d. Physical therapy
e. Occupational therapy
f. Recreational therapy
g. Speech therapy
h. Social worker
i. Dietary (Dietitian)
i. Food service (meal preparation)
k. Housekeeping I. None of above 0
am.4 HRS48 W-3-89,
No. of persons Hours
10 Yes-
1 D Yes--+
1 aYes-+
1~Yes-w
1 DYes +
10 Yes -+
1 OYes +.
1 0 Yes -w
1 0 Yes +
i DYes +
1 0 Yes --c
“SCOt”W
38

Administrator Questionnaire
Budget Bureau No. 68-.%9022; Approval Expires August 31. 1969
NOTICE - Al l information which would permit identification of the indi+idual wil l be held in strict confidenke. wil l be used only by persons engaged in and for the purposes of the survey. and wil l “or be disclosed or released to others foy.any purposes.
;o~~~~RS-~~ U.S. DEPARTMENT OF COMMERCE A. Name of administrator- . . B”RE*” OF THE CENSU5 ACTlNG AS COLLECTING *GENT FOR THE
U.S. PUBLK HEALTH SERVICE B. Establishment No.
ADMlNlSTRATOR QUESTIONNAIRE
The U.S. National Health Survey of the Public Health Your answers will be given confidential treatment by’ Service is conducting a nationwide survey in nursing the U.S. National Health Survey and the Bureau of homes, homes for the aged, and other related types of the Census. The information will be used for statisestablishments. The purpose of the survey is to tical purposes only, and will be presented in such a obtain certain information about the staff employed in manner that no individual person or establishment these establishments as well as about the health of can be identified. patients or residents in the establishments. Thank you for your cooperation.
I. When were you born? Month Yea,
!. In what State (or foreign country) were you born? State OF foreign country
How long have you been the administrator - No. of years No. of months
a. in this faciliiy? . . . . . . . . . . . . . . . . . . . . . . . . . . . . . . . No. of years No. of months
b. in other nursing homes, homes for the aged, or similar facilities? . . . . . . . . . . . . . . . . . . . . . . . . . . . . NO. of years No. of months
c. in hospitals? . . . . . . . . . . . . . . . . . . . . . . . . . . . . . . . . . la. Are you the administrator for more than one NURSING HOME? I 0 Yes (461 .
2n No (Skip to C’S]
b. For how many other NURSING HOMES? Number
c. What is the number of patient beds in EACH of the other NURSING HOMES? II II IIia. How many hours did you work LAST W E E K IN THIS FACILITY ONLY? HClU,S
b. How many of these hours did you spend LAST W E E K performing EACH of the following services IN THIS FACILITY ONLY -
(1) administration of the facility?. . . . . . . . . . . . . . . . . . . . . . 0 None
(2) nursing care?. . . . . . . . . . . . . . . . . . . . . . . . . . . . . . . . . 0 None
(3) medical and dental care? . . . . . . . . . . . . . . . . . . . . . . . . . 0 None
(4) physical therapy?. . . . . . . . . . . . . . . . . . . . . . . . . . . . . . 0 None
(5) occupational thempy? . . . . . . . . . . . . . . . . . . . . . . . . . . . 0 None
(6) recreational therapy? . . . . . . . . . . . . . . . . . . . . . . . . . . . u None
(7) speech and hearing therapy?. . . . . . . . . . . . . . . . . . . . . . . 0 None
(8) social work? . . . . . . . . . . . . . . . . . . . . . . . . . . . . . . . . . /-J None
(9) clerical work? . . . . . . . . . . . . . . . . . . . . . . . . . . . . . . . . 0 None
(10) kitchen/dietary work, grocery shopping? . . . . . . . . . . . . . . 0 None
(11) housekeeping services?. . . . . . . . . . . . . . . . . . . . . . . . . . i-J None
(12)ottter? [Specify service) 0 None
5. Besides the hours worked IN THIS FACILITY, how many additional hours did you work in your profession LAST WEEK? 0 None
7. As an administrator, are you self-employed or a salaried employee? 1 0 Self-employed
2 0 Employee 3 0 Both
Please continue on reverse ride
39
L

Circle highest grade completed
8. What is the highest grade you completed in school?
9. Which of the following degrees do you have?
IO. Which of the following professional degrees, licenses, or association registrations do you have?
a. Elementary school. . . . . . . . I 2 3 4 5 6 7 8 ;k ‘7~0 b. High school . . . . . . . . . . . . I 2 3 4 1 *
c. Junior col lege . . . . . . . . . . I 2
d. Nursing school (diploma). . . . I 2 3
e. College. . . . . . . . . . . . . . . I 2 3 4 5 or more
Major field of study Mark all that apply
0 Associate degree or certificate . . . . . . . . . . . . . . .
0 Bachelor’s degree. . . . . . . . . . . .
0 Master’s degree . . . . . . . . . . . . . _
0 Doctorate (M.D., D.O., or Ph.D., etc.) . . . . . . . . . . . . . .
n None of these
Mark all hot apply
0 Physician (M.D.)
0 Physician (D.O.)
0 Registered Nurse (R.N.)
0 Licensed Practical or Vocational Nurse (L.P.N. or L.V.N.)
0 Registered Physical Therapist (R.P.T.)
0 Registered Occupational Therapist (O.T.R.)
n Other professional degree, license, or association registration (SpeclfyJp
0 None of the above
la. Have you ever taken any courses in nursing home administration? 1 0 Yes (1 lb) 2 0 No (Skip to Q. 7.20)
b. How many of these courses have you taken? Number
C. What were the TOTAL hours of class instruction? (For each course, Hours number of hours per week,t imes number of weeks attended)
2a. Did you ever receive any “on-the-iob” training to be a nursing home administrator? I c] Yes (12b) 2 0 No (Skip to Q. 131
b. How long did this training last? Months
c. Where did you receive this training? Name of place
3. Have you had any other education or training in I 0 Yes - Descrtbe 2 0 No nursing home administration? . below
40
I,

Staff Questionnaire
Budget Bureau No. 68469022; Approval @xpires Aufiust 31, 1969
IOTlCE - Al l information which would permit identification of the individual wil l be held in strict confidence. wil l be used only y persons engaged in and for the purposes of the survey. and wil l not be disclosed or released to others for any purposes.
DRM HRS-i lc U.S.. DEPARTMENT OF COMMERCE A. Establishment No. B. Line No.1-3-68) BUREAU or= THE CENSUS /+CTING AS COLLECTlNG AGENT FOR THE
U.S. PUBLIC HEALTH SERVICE C. Name of person completing form
STAFF QUESTIONNAIRE
The U.S. National Health Survey of the Public Health Your answers will be given confidential treatment by Service is conducting a nationwide survey in nursing the U.S. National Health Survey and the Bureau of the homes, homes for the aged, and other related types of Census. The information will be used for statistical establishments. The purpose of the survey is to purposes only, and will be presented in such a manner obtain certain information about the staff employed in that no individual person or establishment can be these establishments as well as about the health of identified. patients or residents in the establishments.
Please complete the form and return it within 5 days Thank you for your cooperation. to the Bureau of the Census, Washington, D.C 20233, in the postage-paid envelope provided.
. When were you born?
I. How many years hove you worked OS o a. in this facility?. . . . .
b. in other nursing homes, or similar facilities? .
c. in hospitals? (NOTE special duty or private
10. How many hours did you work LAST W E E K
MOflth Year
No. of years No. of months. ?
. . . . . . . . . . . . . . . . . . . . . . . . . . No. of years No. of months
homes for the aged, . . . . . . . . . . . . . . . . . . . . . . . . . .
No. of years No. of months TO NURSES: Do not include
duty nursing.) . . . . . . . . . . . . . . . .
HOUIS
IN THIS FACILITY ONLY? b. How many of these hours did you spend LAST W E E K performing
EACH of the following services IN THIS FACILITY ONLY
(1) administration of the facility?. . . . , . . . . . . . . . . . . . . . .
(2) nursing care?. . . . . . . . . . . . . . . . . . . . . . . . . . . . . . . .
(3) medical and dental care? . . , . . . . . . . . . . . . . . . . . . . . .
(4) physical therapy? . . . . . . . . . . . . . . . . . . . . . . . . . . . .
(5) occupational therapy? . . . . . . . . . . . . . . . . . . . . . . . . . .
(6) recreational therapy? . . . . . . . . . . . . . . . . . . . . . . . . . .
(7) speech and hearing therapy? . . . . . . . . . . . . . . . . . . . . .
(8) social work? . . . . . . . . . . . . . . . . . . . . . . . . . . . . . . . .
(9) clerical work? . . . . . . . . . . . . . , . . . . . . . . . . . . . . . .
(10) kitchen/dietary work, grocery shopping? . . . . . . . . . . . . .
(11) housekeeping services? . . . . . . .,. . . . . . . . . . . . . . . . .
(12) other services? (Specify service) . . . . . . . . . . . . . . . . . .
1. Besides the hours worked IN THIS FACILITY, how many additional hours did you work in your profession LAST WEEK? . . . . . . . . . . . . . . . . . . .
Please continue on reverse side
0 None
n None
0 None
0 None
0 None
0 None
0 None
0 None
0 None
0 None
0 None
0 None
0 None
41

Cirr ie highest grade completed What is the highest grade you completed a. Elementary school. . . . . . . .I 2 3 4 5 6 7 8 in school? b. High school . . . . . . . . . . . .I 2 3 4 > sp to
c. Junior col lege . . . . . . . . . .I 2 d. Nursing school (diploka) . . .123’ e. College. . . . . . . . . . . . . . .I 2 3 4 5 or more
Mark al/ that apply Major field of study Which of the following degrees do you hove?
0 Associate degree or certificate . . . . . . . . . . . . .
n Bachelor’s degree . . . . . . . . . .
n Master’s degree. . . . . . . . . . .
u Doctorate (M.D., D.O., Ph. D., etc.) . . . . . . . . . . . . .
0 None of these
Mark oli that apply
Which of the following professional degrees, 0 Physician licenses, or association registrations do you have? 0 Physician
n Registered 0 Licensed
n Registered
0 Registered
(M.D.) (D.0.)
Nurse (R.N.) Practical or Vocational Nurse (L.P.N. or L.V.N.
Physical Therapist (R.P.T.)
Occupational Therapist (O.T.R.)
0 Other professional degree, license, or association registration (Specify)
7
,n None of the above
Fill Cols. (2)-(4) for each ‘Yes” answer in Co/. (I)
How many What were the TOTAL
Have you ever taken any of COURSES were HOURS of class
TOTALNUMBER taken while instruction? the following courses: 7 of courses taken working for a Number of hours per week
degree or t imes number of weeks diploma? attended per course
(1) (2) (3) (4)
a. Nursing core of the aged I OYes
or chroni&lly ill? 2 0 No (86)
b. Medical or dental core of I l-JYes-+
the aged of chronically ill? 2 0 No (8~)
lOYesC. Mental or social problems of
the aged or chronically ill? 2 0 No (8d)
1nyes-h
d. Physical therapy or.rehabilitotion? 2 0 No (Be)
1q Yes-+ e. Occupational therapy? zONo(Bf)
1q Yes-w f. Nutrition or food services? 2 0 No W
10 Yes4
g. Nursing home administration? 2nNo
ORM HRS4C (4-3.891 “SCOMM-DC
42

Staff Information and Control Record
STAFFlNFORMATlONANDCONTROLRECORD -
OCCUPATIONS STAFF SEX RACE
I
W-White .I& N-New3 NO. O-Other
Note: Be sure to list admlnlstraror and assistant adminia*rawr. (W
l-rI 2
T-
6-7-
8-
9-IO
n -
12-13-
14
ii-
16
0
Isi-
F -20
43
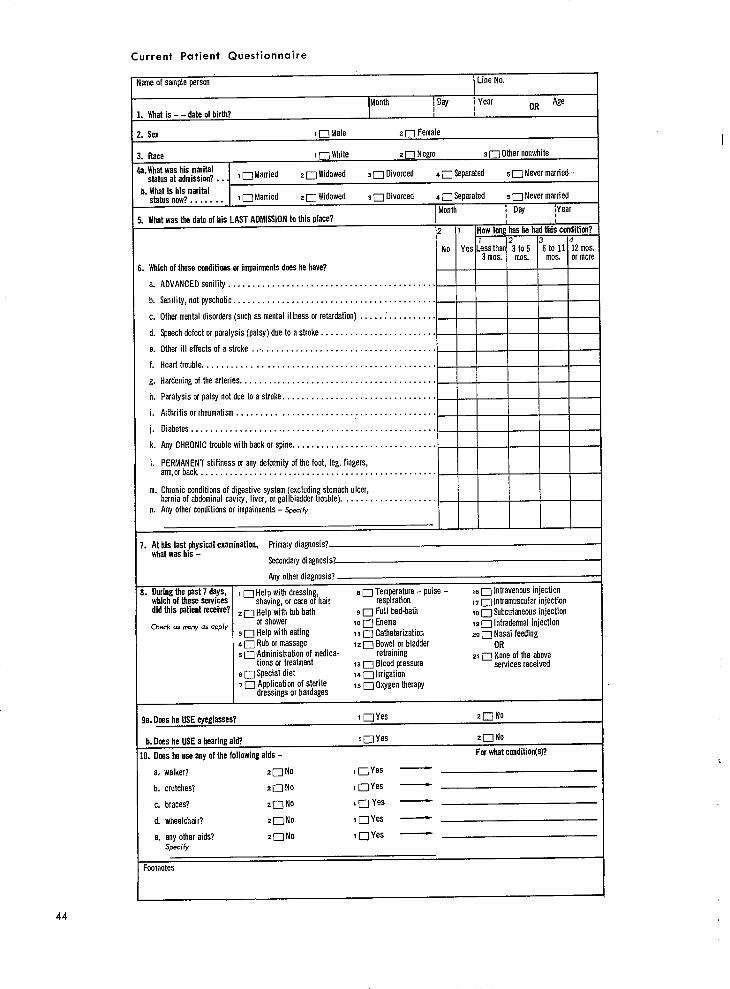
Current Patient Questionnaire
3meof sampleperson Line No. I
Month If Day 1 Year OR *@
Whatis - - date of birth? I I
Sex I 0 Male a 0 Female
Whichof these conditionsor impairmentsdoeshe have?
a. AOVANCEOsenility...........................................
b. Senility,not pyschotic.. . . . . . . . . . . . . . . . . . . . . . . . . . . . . . . . . . . . . . .
c. Othermentaldisorders(such as mentalillness or retardation). . . . . . . . . . . . . . . .
d. Speechdefect or paralysis (palsy) due to a stroke. . . . . . . . . . . . . . . . .
e. Otherill effects of a stroke . . .. . . . . . . . . . . . . . . . . . . . . . . . . . . . . .
f. Hearttrouble.. . . . . . . . . . . . . . . . . . . . . . . . . . . . . . . . . . . . . . . . .
g. Hardeningof the arteries. . . . . . . . . . . . . . . . . . . . . . . . . . . . . . . . . . .
h. Paralysis or palsy not due to a stroke. . . . . . . . . . . . . . . . . . . . . . . . . . . . .
i. Arthritis or rheumatism. . . . . . . . . . . . . . . . . . . . . . . . . . . . . . . . . . . . . . . . .
j. Diabetes. . . . . . . . . . . . . . . . . . . . . . . . . . . . . . . . . . . . . . . . . . . . . . . . . . .
k. Any CHRONICtroublewith back or spine. . . . . . . . . . . . . . . . . . . . . . . . . .
I. PERMANENTstiffness or any deformityof the foot, leg, fingers, arm,orback.. . . . . . . . . . . . . . . . . . . . . . . . . . . . . . . . . . . . . . . . . .
m. Chronicconditionsof digestive system(excludingstomachulcer, herniaof abdominalcavity, liver, or gallbladdertrouble). . . . . . . . . . . . . . . . . .
n. Any otherconditionsor impairments- &crry
‘. At his last physicalexamination, Primarydiagnosis?whatwas his -
I. Owing the past7 days, I 0 which of theseservices did this patientreceive? 2 o
Check OS many as opph a q 4 0 s 0
e 0 7 0
)a. Oceshe USEeyeglasses?
b. Ooeshe USEa hearingaid7
Secondarydiagnosis?
Any otherdiagnosis?
Help with dressing,shaving,or care of hair Help with tub bath or shower Help with eating Rubor massage Administrationof medications or treatment Specialdiet Applicationof sterile dressingsor bandages
e ~Temperabue - pulse - 160 Intravenousinjection respiration 17t-~lntramuscularinjection
e 0 Full bedbath 180 Subcutaneousinjection 100 Enema re q lntradermalinjection 13q Catheterization zoq Nasalfeeding ~a0 Bowelor bladder OR
retraining ~$0 Noneof the above 13q Blood pressure services received 14nlrrigation IS 0 Oxygentherapy
I q Yes z=No
lOYes ZI-JNO
Fw whatcondition(s)?
lOYes
,OYes
tOYes -
InYes
lOYes -
0. Doeshe use any of the folIowine.aids -
a. walker? ZI-JNO
b. crutches? zONo
c. braces? ZI-JNO
d. wheelchair? amNo
e. any other aids? ZI-JNO Speclb
Footnotes
44

Il. Whichof thesecategoriesbest describeshis Mity to moveabout7
a. No morethan usual
b. Slightly more
c. Moderatelymore d. Muchmore
fEfAA: If patientwas not here for full month,check here 0 andgo to next Parson.
ti.bst month,what was the chargefor his lodging,meals,and nursingcare?DJ not rn~rvdewlwte dti MS~. S
b. Whatwas the TOTAL chargefor his care last month? s’ . k. Wht WKt ffE SOKCCS Of WYSBOtfK hfs Cal.2 bst mdh? Check 011 rhotopply
q Own incomeor family support(private plans, retirementfunds,
DOther public assistance 0 nlnitial payment- life care
or welfare social security, etc.) q Churchsupport
Other- spe~iF/
nhtedicart (Tftle XVIII) OVA contract DMedicaid (Title XIX)
b. Whatwas thePRMARYsourceof paymentfor his care last month?,v,,& Oneon,y I q Own incomeor family support 4OOther public assistance a mother - Speci+
(private plans, retirementfunds, or welfare social security, etc.) sOChurch support
aUh!edicare (Title XVIII) s OVA contract a aMedicaid (Title XIX) v 0 Initial payment- life care
q Saintas 17a-b OhMicaid (Title XIX) OVA contract q own incomeor family support
(private plans, retirementfunds, mother public assistance Olnitial payment- lift care
or welfare social security, etc.) OChurch support
nOther -Speciry
OMedicart (Title XVIII)
*U. S. GOVE-NT PFWTING OFFICE:1975 5l5-211/43 45

VITAL AND HEALTH STATISTICS PUBLICATION SERIES
Originally Public Health Service Publication No. 1000
Series 1. Programs and collection procedures.- Reports which describe the general programs of the National Center for Health Statistics and its offices and divisions, data collection methods used, definitions, and other material necessary for understanding the data.
Series 2. Data evaluation and methods research.-Studies of new statistical methodology including: experimental tests of new survey methods, studies of vital statistics collection methods, new analytical techniques, objective evaluations of reliability of collected data, contributions to statistical theory.
Series 3. Analvtical studies--Reports presenting analytical or interpretive studies basedon vital and health statistics, carrying the analysis further than the expository types of reports in the other series.
Series 4. Documents and committee reports .-Final reports of major committees concerned with vital and health statistics, and documents such as recommended model vital registration laws and revised birth and death certificates.
Series 10. Data from the Health Interview Survev.- Statistics on illness, accidental injuries, disability, use of hospital, medical, dental, and other services, and other health-related topics, based on data collected in a continuing national household interview survey.
Series II. Data from the Health Examination Survey. -Data from direct examination, testing, and measurement of national samples of the civilian, noninstitutional population provide the basis for two types of reports: (1) estimates of the medically defined prevalence of specific diseases in the United States and the distributions of the population with respect to physical, physiological, and psycho-logical characteristics; and (2) analysis of relationships among the various measurements without reference to an explicit finite universe of persons.
Series 12. Data from the Institutional Population Surveys -Statistics relating to the health characteristics of persons in institutions, and their medical, nursing, and personal care received, based on national samples of establishments providing these services and samples of the residents or patients.
‘\ Series 13. Data from the Hospital Discharge Survey. -Statistics relating to disch‘lrged patients in short-stay hospitals, based on a sample of patient records in a national sample of hospitals.
Series 14. Data on health resources: manpower and facilities. -Statistics on the numbers, geographic distribution, and characteristics of health resources including physicians,dentists, nurses, other health occupations, hospitals, nursing homes, and outpatient facilities.
Series 20. Data on mortality.-Various statistics on mortality other than as included in regular annual or monthly reports- special analyses by cause of death, age, and other demographic variables, also geographic and time series analyses.
Series 21. Data on nutality, marriage, and divorce. -Various statistics on natal&y, marriage, and divorce other than as included in regular annual or monthly reports--special analyses by demographic variables, also geographic and time series analyses, studies of fertility.
Series 22. Data from the National Natality and Mortality Surveys.-Statistics on characteristics of births and deaths not available from the vital records, based on sample surveys stemming from these records, including such topics as mortality by socioeconomic class, hospital experience in the last year of life, medical care during pregnancy, health insurance coverage, etc.
For a list of titles of reports published in these series, write to: Office of Information National Center for Health Statistics Public Health Service, HSMHA Rockville, Md. 20852