Embed Size (px)
Citation preview
Production & Operation Management
ADL 14
[Type the abstract of the document here. The abstract is typically a short summary of the contents of the document. Type the abstract of the document here. The abstract is typically a short summary of the contents of the document.]
ACeL
Table of Contents
Chapter 1 : PRODUCTION MANAGEMENT
Chapter 2 : PLANT LOCATIONS
Chapter 3 : PRODUCTION SYSTEMS & CAPACITY PLANNING
Chapter 4 : PLANT LAYOUT & MATERIAL HANDLING
Chapter 5 : PRODUCT DEVELOPMENT
Chapter 6 : MATERIAL MANAGEMENT – INVENTORY CONTROL
Chapter 7 : QUALITY CONTROL & TOTAL QUALITY MANAGEMENT
Chapter 8 : INDUSIRJAL ENGINEERING : JOB DESlGN & WORK - MEASUREMENT
Chapter 9 : USE OF QUANTITATIVE TECHNIQUES IN SOLVING PRODUCTION PROBLEMS

Chapter 1. PRODUCTION MANAGEMENT
1.1 PRODUCTION DEFINED:
Production may be defined as the convertion Inputs (Men, Machines, Materials, Money and management) into an output through a transformation process. Output may be Goods produced or Services rendered. Goods produced is by the manufacturing concerns and services rendered is by the service/operations unit such as Banking, Hospitals, Hotels/Restaurants etc. In this sense, production management is sometimes viewed as Operations Management.
Diagrammatically this can be shown as below:
( Ref : fig 1.2 )
Feedback from the output stage is used to adjust the changes required to the Inputs or the Transformation Process i.e. Production Control is done to take care on the deficiency of resources if any.
1.2 DECISION MAKING IN PRODUCTION MANAGEMENT:
Decision Management in production management determines the firm's mission and strategy and how the firm's resources can be utilized most effectively. A production manager who understands his company's goals can maximize his contribution to developing an effective operational strategy.
POM {Productions Operations Management) involves all the three both Strategies plan and decision:
Strategic plans and decisions: Long-range plans and decisions involving product lines, facilities and equipments, conducted at the highest
levels of an organisation.
Tactical plans and decisions: Intermediate-range plans and decisions involving resources allocation and utilization, conducted at the middle levels of an organisation.
Operational plans and decisions: Shot-range plans and decisions involving resource allocation and :utilization, conducted at the middle levels of an organisation.
( Ref: fig 1.1 )
Various major decisions required in Production Management areas are:
Product Design: To lead in research and engineering competitions in all areas of out primary business, designing and producing products and services with outstanding quality and inherent customer value.
Process Designing & Equipment Selection: To determine and design the production process and equipment than will be compatible with the cost product and high quality.
Layout: To achieve effectiveness and efficiency in production through skills imagination, resourcefulness in plans layout and for methods.
Location & Facility Engineering: To locate design, built efficiency, economic facilities that will yield high value to the company.
Human Resource Management: To provide a good quality of word life with well designed safe rewarding jobs stable employment and equitable pay in exchange for outstanding individual contribution from employees at all levels.
Production Control: To achieve high utilization of manufacturing facilities through effective scheduling
Maintenance: T o achieve high utilization of equipment.
Quality Assurance Control: To attain the exceptional quality that is consistent with company's policy & marketing objective.
Materials Management: To cooperate with supplies and subcontracts to develop stable effective and efficiency sources of supply for those components that are to be processed from outside sources.
Inventory Control: To achieve the investment through scientific inventory control. such as A B C, V E D, F S N & R O L techniques and through appropriate customer service levels and high facility utilization.
1.3 RESPONSIBILITIES OF A PRODUCTION MANAGER:
The types of activities involved in Production Function are:
Organizing work
Selecting Process / Processes
Locating Facilities
Designing Jobs
Assigning Jobs & Allocation of Duties
Achieving Higher Productivity
Controlling Quality
Planning and Scheduling Production including Inventory Control etc.
A successful Production Manager is one who is able to manage all the above mentioned functions well.
1.4 HISTORICAL EVOLUTION OF PRODUCTION OPERATIONS MANAGEMENT:
Production Management is today more than 200 years old and in its present form is the result of contribution by a number of CONTRIBUTORS. Evolution of Production Operations Management can be studied by dividing the total period into six ERAS.
Each Era is briefly described below:
(1) INDUSTRIAL REVOLUTION:
Concept of Modern Factories: During the 18th century the concept of Large Scale Production came through in which small shops
were converted into large manufacturing concerns employing mass production techniques .Notable among them being the Textiles. Metal Fabrication and Machine Tool Industries .The major contributors were by Spinning Jenny and Carteright's Powerloom in Textiles, James Watt's Steam Engine and Maudslay's Screw Cutting Lathe for mechanization in industries).
Division of Labour: Adam Smith (1776) advocated Division of Labour. He gave three distinct advantages i.e.
i. Workmen performing work in repetition develop higher skill. ii. Saving in Time results while changing from one activity to another. iii. Improvements in production methods result when workers are made to specialise on certain tasks.
Charle's Babbage (1883) gave the fourth advantage of 'Division of Labour called Specialisation giving rise to cutting cost of production through better managerial and organisational structures, human relations, product development and Management accountability through profit/volume (P/V) relationship.
Concept of Inter-changeability: Along with the Division of Labour the concept of inter-changeability grew. The major contributor
being Ele Whitne (1790) whose this concept of inter-changeability revolutionised the modem manufacturing methods.

(2) THE ERA OF SCIENTIFIC MANAGEMENT:
The era of scientific management began in the United States during the early 20th century.
Contribution by F. W. Taylor: He gave a number of contributions notable among them being:
i. Work-measurement and Wages Payment based on Performance. ii. Measuring work for each element of men's work. iii. Selection of best worker for each particular task and the Training and Development the workmen. iv. Rewarding performance of the worker (Taylor 's Differentiation Piece Rate System). v. Division of work between Management and workmen. He advocated that Management's job is Planning, Organising Staffing,
Directing and controlling and that of the workmen to do the assigned jobs well.
Due to his various contributions which came largely through his own experience (he rose from a workers level to chief Engineer's level) as a result he is often called ‘ father of scientific management.
(b) Contributions by Frank B. Gilbrethand his wife Lilian Gilbreth (a psychologist) in 1917 they developed ‘ Motion Study' classifying basic motions in 17 divisions called ‘ Therbligs' which helped in Methods Improvement.
(c) Contribution by Henry Gantt (1913) He developed the technique of scheduling and monitoring work popularly called Gantt Chart.
(d) Other contributors who helped in Scientific Management were:
i. H Emerson's Efficiency plan for Payment wages. ii. Wilson 's EOQ (Economic Order Quantity) formula for Inventory Control iii. W Schewart's Control chart for Statistical Production Control (SPC) iv. L.H.C. Tippet's Work sampling to determine the machine and Manpower utilization. v. Dodge Romig and Schewarts Development of sampling plans for inspection of incoming (Raw Material) and Outgoing (finished
goods). vi. On basis of concepts of ‘ Division of Labour' and Parts interchangeability Henry Ford developed the concept of Mass Production
through organised work-stations of a conveyorised Assembly line.
(3) ERA OF HUMAN RELATION:
Scientific Management approach emphasised the physical and Technical aspects of work whereas the ‘ How thorn Studies' (conducted in 1931 at Western Electric} suggested that the Behaviour Considerations are also vitally important to ‘ Productivity'. Major contributions being by Elton Mayo for ‘ Howthorn Studies'(1930), Motivational theories by A. Maslow (1940) F.Herzberg (1950) and Douglas McGregos (1960).
Their concepts helped in ‘ JOB DESIGNS' and ‘ Employee Motivation'.
(4) ERA OF QUANTITATIVE TECHNIQUES/MANAGEMENT SCIENCE (1940-1980):
During the world-war II and thereafter the use of Quantitative Techniques in Decision Making (popularly knownas O.R. techniques )has further revolutionised the production (Operations) Management not only for performing the operations better but also aiding the Decision-Making through the use of Statistical Techniques Probability and Sampling Distributions and Mathematical Modeling (PERI/CPM, Linear Programming, Inventory Control, Simulations and Dynamic Programming etc.) The development of COMPUTERS further aided in the development of these techniques of Management Decision Making through it speed and capability of handling Voluminous work that can be undertaken by it.
(5) ERA OF ADVANCED TECHNIQUES (1970-80):
With the advent of Computer and its use in the design of layouts (CRAFT -Computerized Relative Allocation of Facilities Techniques, Production Design (CAD/CAM) and Manufacturing System). CIM -Computerized Integrated Manufacturing System. All these have given rise to the Advanced Technology. Hi-Technological Developments being ROBOTS and MICROCOMPUTERS.

(6) ERA OF QUALITY REVOLUTION:
Since 1980's there has been strategic emphasis on Manufacturing --the in-built quality. TQM System converted ‘ Q C—Q A' and this gave the customs not only customer satisfaction but also the customer delightness. ISO 9000 series is called ‘ Quality Friendly' and ISO 14000 is called ‘ Environmental Friendly'.The major thrust has been an adoption of the Japanese Management Technology, Quality circle and the J I T concept.
Present Day Scenario:
The change in Technology has brought in various improvements in Production Function and as a result of this our industrialists today are well informed of the most modern techniques. The new name ‘ Operations Management' has broadened our fields to service sector which has become more prominent. Previously there was a big emphasis on integration of operations activities through emphasis on Marketing and Finance, however, today the operations function is experiencing a renewal role as a vital strategic element. There has been a tremendous growth of most modern techniques and today's Manager is required to have knowledge of commerce and economics also in addition to Information Technology. A number of training centers for workers and Management Institutes for Managers are there to impart training as per requirement of the Manufacturing and Service Systems.
1.5 SCHOOLS OF THOUGHT:
Operation Management Defined:
Management of the conversion process which converts land labour capital and management materials inputs into “ Desires Outputs of Goods and Services” .
Schools of Thought There are basically three schools of thought (i) Classical (ii) Behavioral (iii) Modeling.
(i) Classical Management
Classical Management Emphasises: (a) Economic Efficiency as the production are of the Organisation ---> Scientific Management. (b) Management as a continuous Process of Planning, Organising and controlling. --->Process Management.
(ii) Behavioral Management
Behavioral Management emphasis (a) Human Relations (b) Behavioral Sciences
(a) Human Relationship: Behavioral Scientists recognise that people are complete and have multiple needs and that the subordinate- supervisor relationship directly affect productivity.
(b) Behavioral Science: The science which explored how human behavior is affected by leadership, motivation, Communication Inter-
personnel relationships and Attitude change.
(iii) Modeling as Management:
Modeling as Management emphasis:
(a) Decision Making (b) System (c) Mathematical Modeling
1.6 PRODUCTIVITY AND WASTIVITY:
Effectiveness of production management is measured by the efficiency with which the inputs are converted into outputs i.e. Effectiveness Outputs and Inputs. This efficiency is called Productivity of the system.
The higher the Productivity the more efficiency is the Production system.
Conceptually Productivity is defined as an attitude of mine and prevent on of all kinds of waste.
Where output = Goods produced or Services rendered Inputs = Capital, Manpower, Material, Machine, Land and Building etc
When both output and input are expressed in the same units productivity reduces to a number. Quite often it is expressed as Output per Man shift (OMS) such as Tonnes of coal produced per man per day for better understanding in an industry.
National Productivity is given as per capita income, in Agriculture sector output per hectare etc.
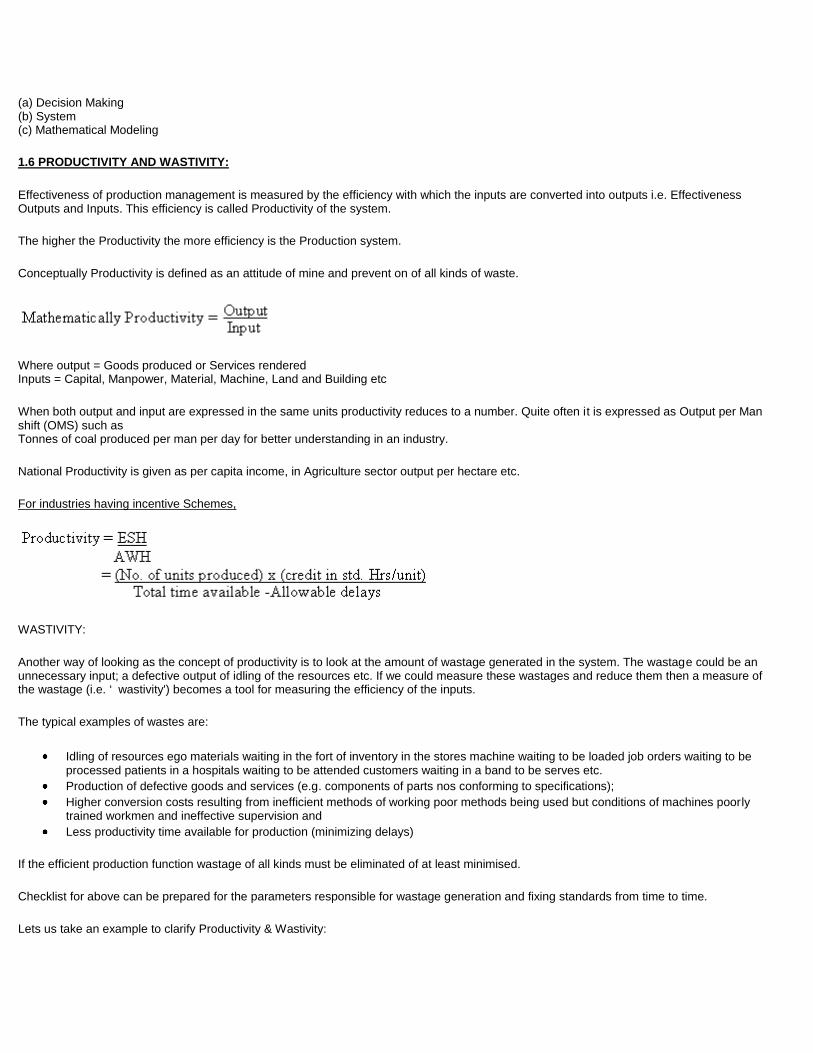
For industries having incentive Schemes,
WASTIVITY:
Another way of looking as the concept of productivity is to look at the amount of wastage generated in the system. The wastage could be an unnecessary input; a defective output of idling of the resources etc. If we could measure these wastages and reduce them then a measure of the wastage (i.e. ‘ wastivity') becomes a tool for measuring the efficiency of the inputs.
The typical examples of wastes are:
Idling of resources ego materials waiting in the fort of inventory in the stores machine waiting to be loaded job orders waiting to be processed patients in a hospitals waiting to be attended customers waiting in a band to be serves etc.
Production of defective goods and services (e.g. components of parts nos conforming to specifications);
Higher conversion costs resulting from inefficient methods of working poor methods being used but conditions of machines poorly trained workmen and ineffective supervision and
Less productivity time available for production (minimizing delays)
If the efficient production function wastage of all kinds must be eliminated of at least minimised.
Checklist for above can be prepared for the parameters responsible for wastage generation and fixing standards from time to time.
Lets us take an example to clarify Productivity & Wastivity:
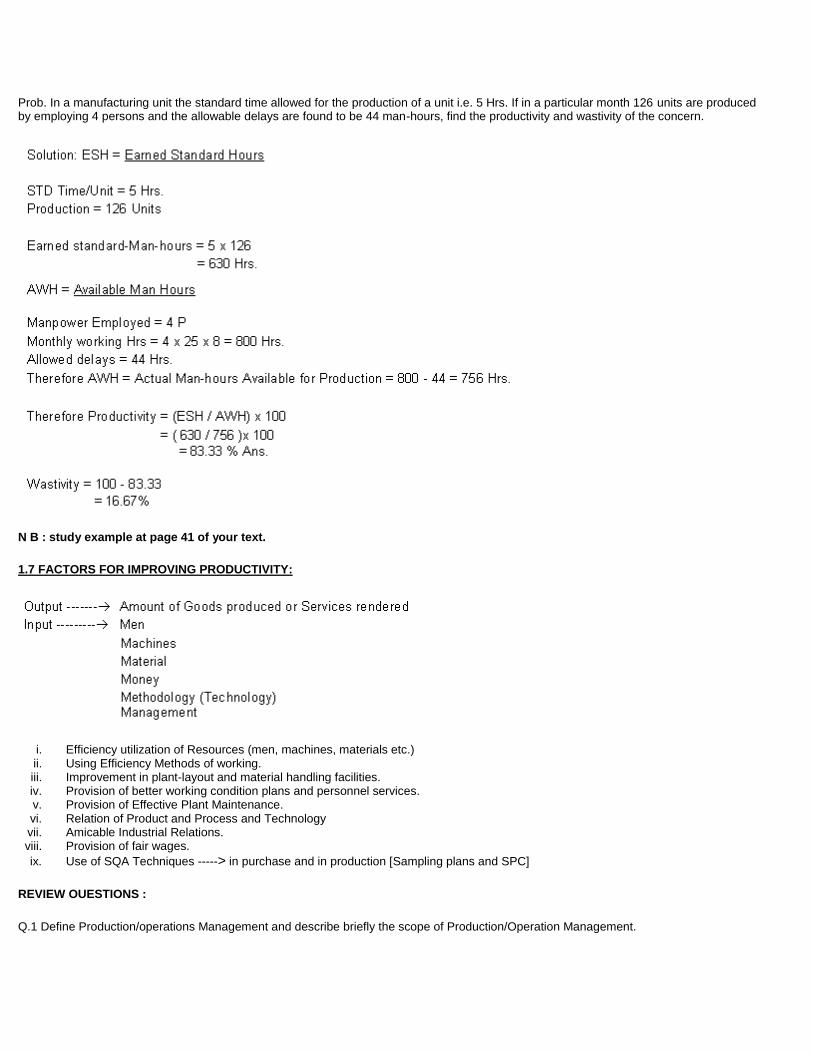
Prob. In a manufacturing unit the standard time allowed for the production of a unit i.e. 5 Hrs. If in a particular month 126 units are produced by employing 4 persons and the allowable delays are found to be 44 man-hours, find the productivity and wastivity of the concern.
N B : study example at page 41 of your text.
1.7 FACTORS FOR IMPROVING PRODUCTIVITY:
i. Efficiency utilization of Resources (men, machines, materials etc.) ii. Using Efficiency Methods of working. iii. Improvement in plant-layout and material handling facilities. iv. Provision of better working condition plans and personnel services. v. Provision of Effective Plant Maintenance. vi. Relation of Product and Process and Technology vii. Amicable Industrial Relations. viii. Provision of fair wages.
ix. Use of SQA Techniques -----> in purchase and in production [Sampling plans and SPC]
REVIEW OUESTIONS :
Q.1 Define Production/operations Management and describe briefly the scope of Production/Operation Management.
Q.2 What do you understand by the term Production Management?
Q.3 What arc the three schools of thought in Production Operations Approaches? Describe the silent features of each?
Q4. What do you understand by the term ‘ Effective Management'? List various methods of improving Productivity.
Q5 What do you understand by the term ‘ Wastivity'? How does it help in better understanding of the Productivity Concept?
Q6 Summarise the contributions of various contributors in “ Evolution of Production/Operations Management” in a tabular form.
PROBLEMS FOR PRACTICE:
Q.1 A fast-food restaurant has a drive-through window and during peak lunch times can handle a maximum of 80 cars per hour with one person taking orders, assembling them, and acting as a cashier. The average sale per order is Rs 100/-. A proposal has been made to add two additional workers and divide the tasks among them. One will take orders, the second will assemble them, and the third will act as cashier. With this system it is estimated that 120 cars per hour can be serviced. All workers earn the minimum wage. Use productivity arguments to recommend whether or not to change the current system.
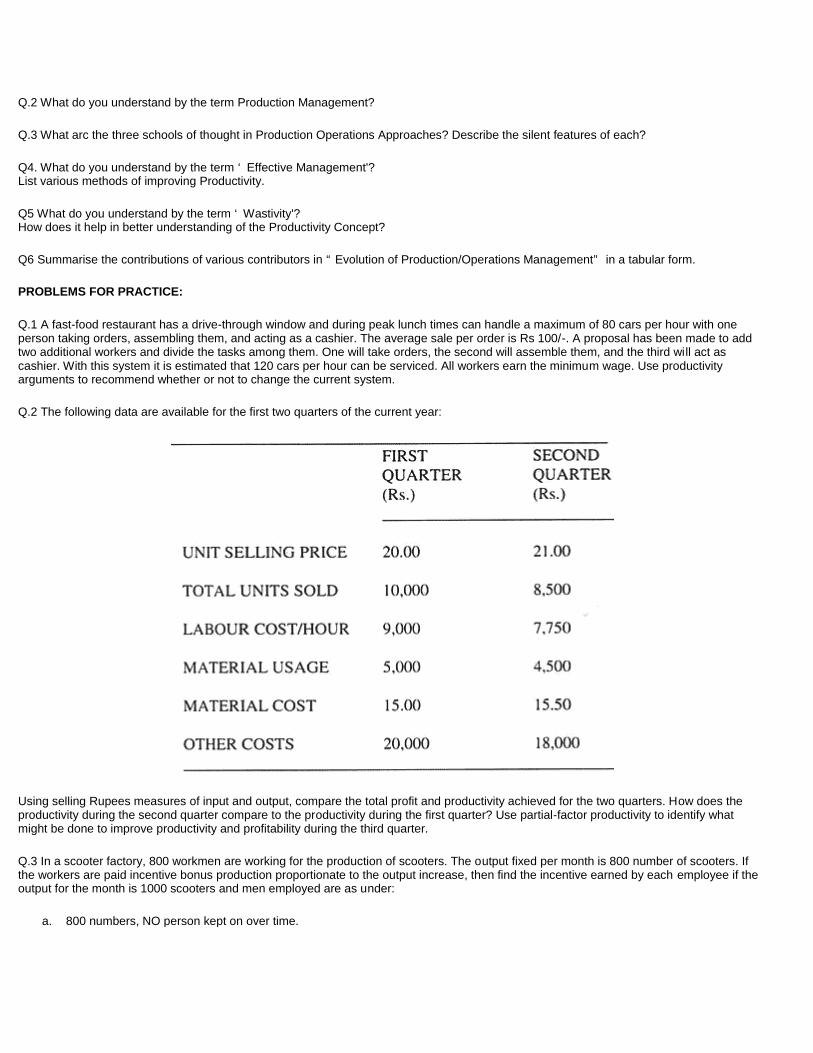
Q.2 The following data are available for the first two quarters of the current year:
Using selling Rupees measures of input and output, compare the total profit and productivity achieved for the two quarters. How does the productivity during the second quarter compare to the productivity during the first quarter? Use partial-factor productivity to identify what might be done to improve productivity and profitability during the third quarter.
Q.3 In a scooter factory, 800 workmen are working for the production of scooters. The output fixed per month is 800 number of scooters. If the workers are paid incentive bonus production proportionate to the output increase, then find the incentive earned by each employee if the output for the month is 1000 scooters and men employed are as under:
a. 800 numbers, NO person kept on over time.
b. 800 numbers with 10,000 man hours put on overtime.
** CASE STUDY
**Develop a model to illustrate the operation system for a ‘ Departmental Store'. (Hint: Explain Inputs, Conversion Process, Output and Feedback)
* Role of a Production Manager in the New Millennium.

Chapter 2. PLANT LOCATIONS
2.1 FACTORY:
Any place in which the factors or production:
land
labour
capital and
enterprise
are brought together for creation of goods or services.
The term ‘ Plant Layout' is used synonymously with ‘ Factory Layout'.
2.2 FACTORY PLANNING:
The formulation of a complete plan for the creation of goods or services. The term embraces the determination of:
location
production process
equipment
physical arrangement
provisions for personnel
offices and
all functions that are necessary for completion of the goods.
2.3 LOCATION OF AN ORGANISATION:
Location of an organisation is an important operations management decision.
It can be viewed as a two step decision:
The choice of the region and
The choice of a site within the region.
The first step is largely dependent on the organisation's long term strategies such as:
technological
marketing
resource mobilization and
financial strategies
Keeping it view the nature of the organisation.
However, the choice of site (second step) is best determined by comparing the relative availability and costs of the needed resources such as:
transport
power
water
land
labour law &
materials in alternate sites.
Additionally, the intangible costs associated with a site, such as:
labour relations
climate
community support
recreational facility and
quality schools availability etc.
2.4 LIKE THE PROBLEM OF LOCATING FACILITIES:
The layout of facilities is also a crucial problem. One of the main considerations in layout work-areas is the ease in the flow of work. The flow of work may take place through the movement of
(a) Materials e.g. in a factory
(b) People e.g. in a hospital where patients, nurses, doctors and others come from one department or to another; and
(c) Information e.g. the movement of papers and people as in an administrative office.
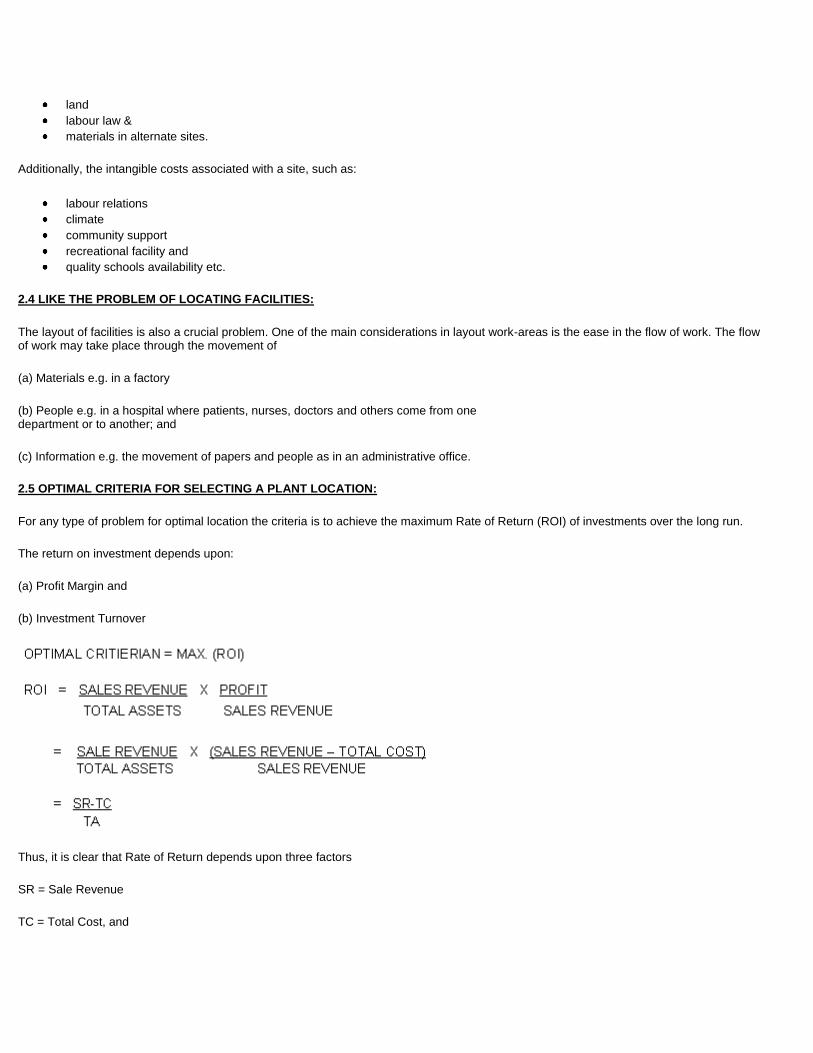
2.5 OPTIMAL CRITERIA FOR SELECTING A PLANT LOCATION:
For any type of problem for optimal location the criteria is to achieve the maximum Rate of Return (ROI) of investments over the long run.
The return on investment depends upon:
(a) Profit Margin and
(b) Investment Turnover
Thus, it is clear that Rate of Return depends upon three factors
SR = Sale Revenue
TC = Total Cost, and
TA = Total Assets.
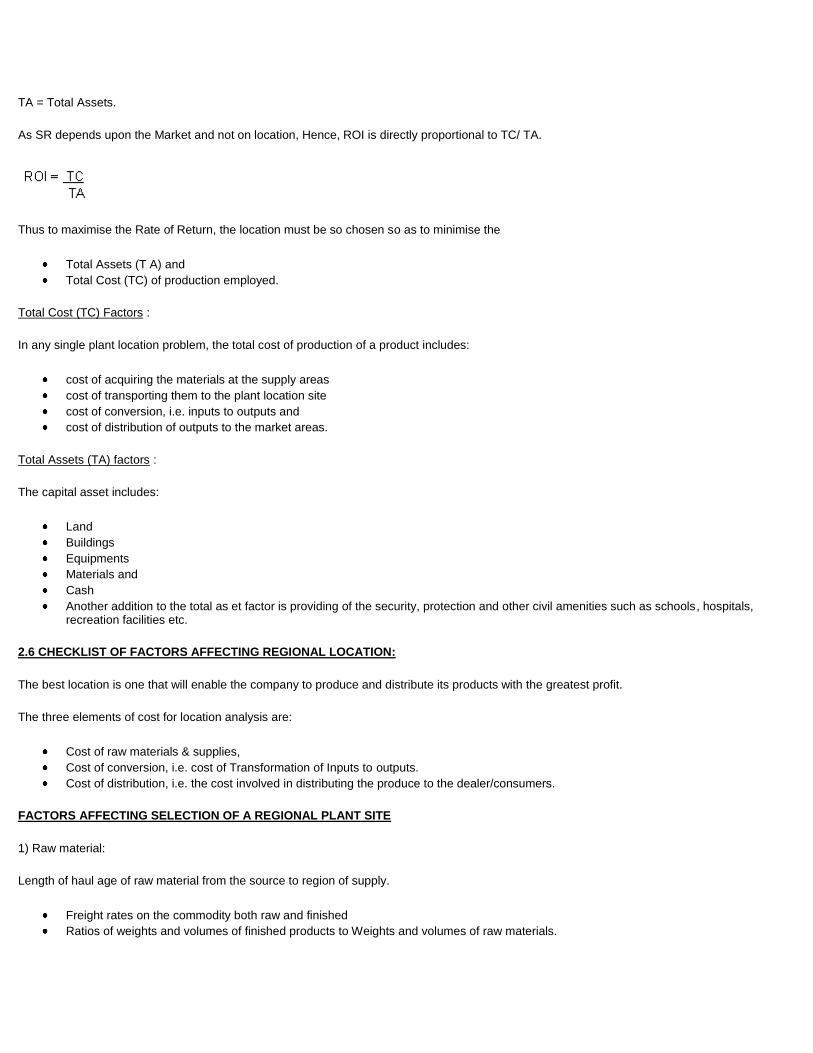
As SR depends upon the Market and not on location, Hence, ROI is directly proportional to TC/ TA.
Thus to maximise the Rate of Return, the location must be so chosen so as to minimise the
Total Assets (T A) and
Total Cost (TC) of production employed.
Total Cost (TC) Factors :
In any single plant location problem, the total cost of production of a product includes:
cost of acquiring the materials at the supply areas
cost of transporting them to the plant location site
cost of conversion, i.e. inputs to outputs and
cost of distribution of outputs to the market areas.
Total Assets (TA) factors :
The capital asset includes:
Land
Buildings
Equipments
Materials and
Cash
Another addition to the total as et factor is providing of the security, protection and other civil amenities such as schools, hospitals, recreation facilities etc.
2.6 CHECKLIST OF FACTORS AFFECTING REGIONAL LOCATION:
The best location is one that will enable the company to produce and distribute its products with the greatest profit.
The three elements of cost for location analysis are:
Cost of raw materials & supplies,
Cost of conversion, i.e. cost of Transformation of Inputs to outputs.
Cost of distribution, i.e. the cost involved in distributing the produce to the dealer/consumers.
FACTORS AFFECTING SELECTION OF A REGIONAL PLANT SITE
1) Raw material:
Length of haul age of raw material from the source to region of supply.
Freight rates on the commodity both raw and finished
Ratios of weights and volumes of finished products to Weights and volumes of raw materials.
2) Labour supply:
Adequacy of supply of desired type in region
Competition for the existing supply
Union organisation and strength Race relations dependability on the type of labour available and
Aptitude for factory work, training and upgrading.
3) Marketing:
Market area to be served by the plant.
Concentration of market and stability of demand
Effects of location on number of warehouses and inventories
Freight rates to principal market areas
Transportation facilities available to market areas
Travel expense for salesmen a d service personnel
Competition for the market a d relative location of competitor's plants.
4) Factory Services:
Adequacy of supply of power, water, fuel etc. for present and prospective plant size.
Availability of external plant services--sewerage disposal system, repair and replacement parts fire protection
Public transportation for personnel etc.
Available supply of trained management personnel
Attractions of region; cultural, climatic, etc. for professional management personnel.
5) Climatic Conditions:
Cost of construction to with stand forces of nature such as earthquakes. winds. snow, etc.
Heating or air-conditioning costs for either personnel comfort or process control.
Probability of absenteeism caused by weather;
Probabilityof work stoppages or interruption of supply of raw materials by weather:
Necessity for premium wages because of weather conditions and
Cost of maintenance
6) Laws and Codes:
Scope of work permitted
Fair Employment Practices Acts .Workman's compensation
Retirement insurance and similar benefits.
Waste disposal smoke abatement and nuisance regulations.
Local tax laws on real property,
Corporate income etc.
Building codes, safety and health regulations etc.
7) Community facilities
8) Community attitudes

9) Industrial relations
2.7 MULTIPLANT LOCATION PROBLEM:
"When the same market areas have to be supplied from more than one manufacturing unit the problem of adding new plans is said to be a Multiplant Location Problem."
The first step in solving the Multi plant Location Problem is solving the regional product distribution strategy into which the new unit has to be fitted in .
If no such strategy is involved then the second step in solving Multi plant Location problem is allocation of output from each plant to various
destinations. The technique which helps in allocation of output$ from origins to destinations is called Transportation Problem.
Transportation is a special technique of finding Optimum Cost of Transportation which has been discussed in detail.
2.8 ECONOMIC CONSIDERATIONS:
Let us consider an example to clarify this:
PROB. Four locations are under the consideration of a management. The fixed costs and variable costs pet unit are given against each location in a table given below:
Find out which location is best for the following demand ranges:
(a) 4000, 6000, 8000, 10000, 112000, 14000 units per annum.
(b) Also find the best location for 11,500 units.
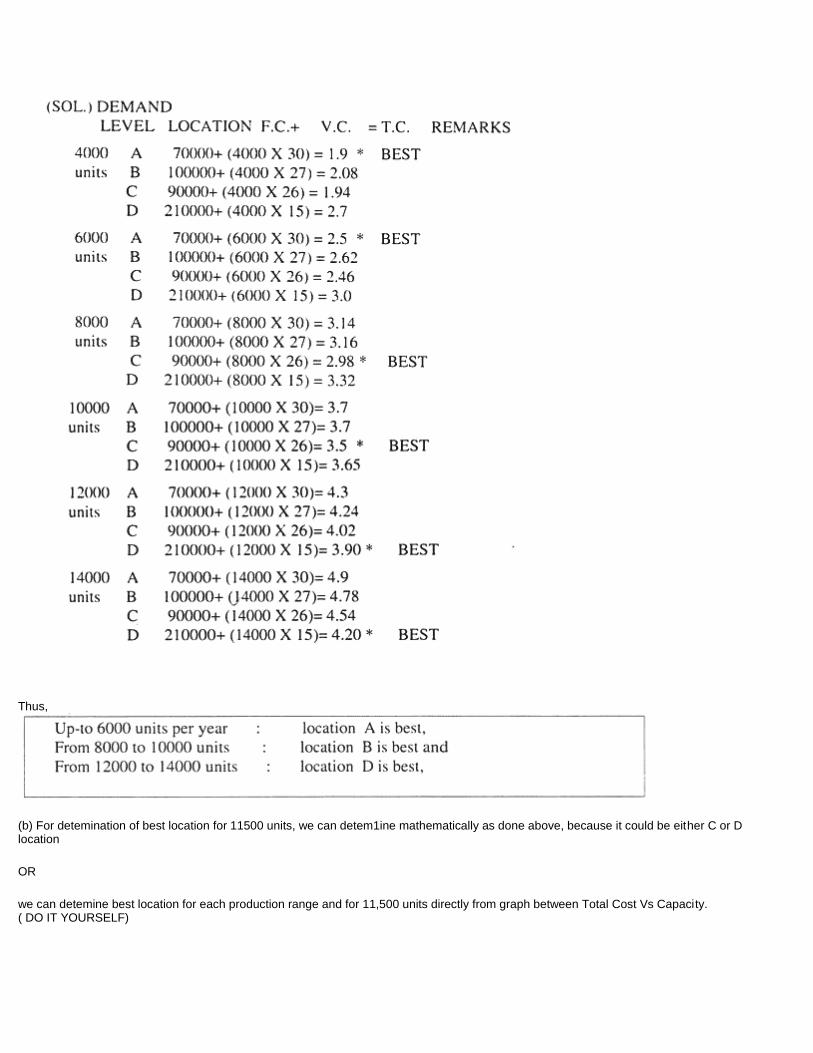
Thus,
(b) For detemination of best location for 11500 units, we can detem1ine mathematically as done above, because it could be either C or D location
OR
we can detemine best location for each production range and for 11,500 units directly from graph between Total Cost Vs Capacity. ( DO IT YOURSELF)
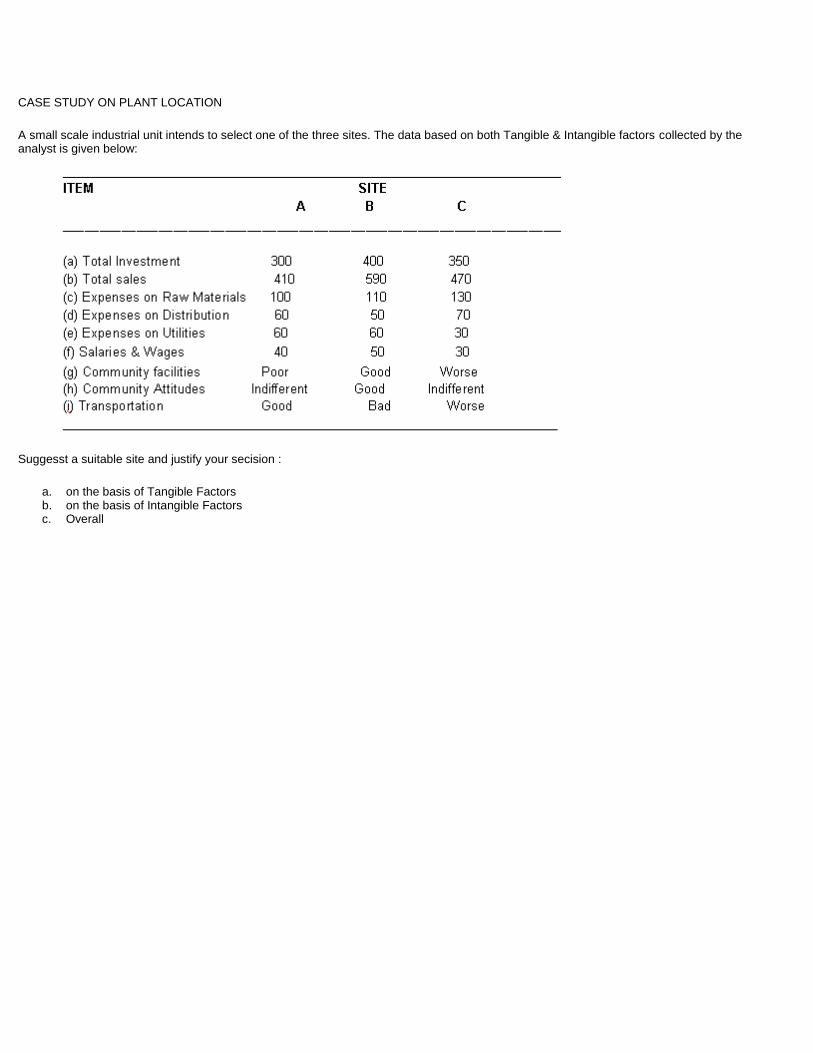
CASE STUDY ON PLANT LOCATION
A small scale industrial unit intends to select one of the three sites. The data based on both Tangible & Intangible factors collected by the analyst is given below:
Suggesst a suitable site and justify your secision :
a. on the basis of Tangible Factors b. on the basis of Intangible Factors c. Overall
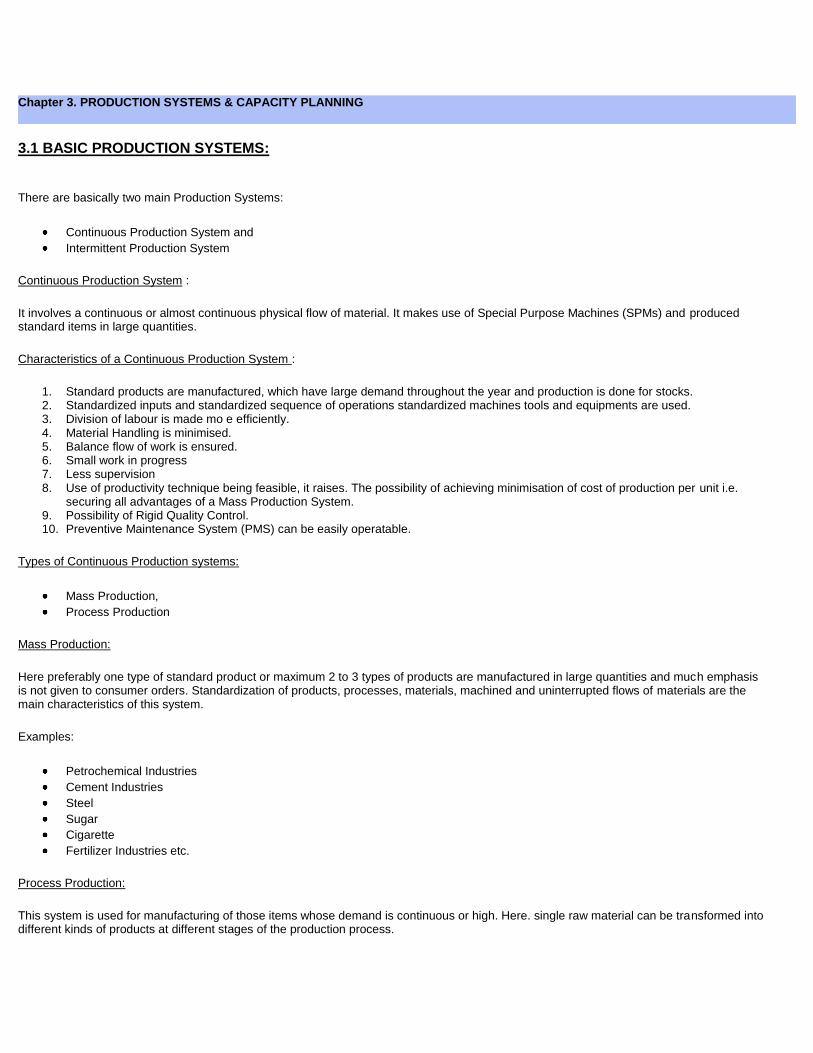
Chapter 3. PRODUCTION SYSTEMS & CAPACITY PLANNING
3.1 BASIC PRODUCTION SYSTEMS:
There are basically two main Production Systems:
Continuous Production System and
Intermittent Production System
Continuous Production System :
It involves a continuous or almost continuous physical flow of material. It makes use of Special Purpose Machines (SPMs) and produced standard items in large quantities.
Characteristics of a Continuous Production System :
1. Standard products are manufactured, which have large demand throughout the year and production is done for stocks. 2. Standardized inputs and standardized sequence of operations standardized machines tools and equipments are used. 3. Division of labour is made mo e efficiently. 4. Material Handling is minimised. 5. Balance flow of work is ensured. 6. Small work in progress 7. Less supervision 8. Use of productivity technique being feasible, it raises. The possibility of achieving minimisation of cost of production per unit i.e.
securing all advantages of a Mass Production System. 9. Possibility of Rigid Quality Control. 10. Preventive Maintenance System (PMS) can be easily operatable.
Types of Continuous Production systems:
Mass Production,
Process Production
Mass Production:
Here preferably one type of standard product or maximum 2 to 3 types of products are manufactured in large quantities and much emphasis is not given to consumer orders. Standardization of products, processes, materials, machined and uninterrupted flows of materials are the main characteristics of this system.
Examples:
Petrochemical Industries
Cement Industries
Steel
Sugar
Cigarette
Fertilizer Industries etc.
Process Production:
This system is used for manufacturing of those items whose demand is continuous or high. Here. single raw material can be transformed into different kinds of products at different stages of the production process.
Examples:
Wire Drawing
Alloy Steel Manufacturing (ASP, Durgapur )
Rolled Products
Crude oil refinery -One gets kerosene, gasoline etc. at different stages of production.
Advantages of Continuous Production System
1. Reduced labour cost (cost low), 2. High accuracy (Quality) - better quality and 3. High productivity, 4. Reduced Material Handling, 5. Minimum Wastage as products are standardized, 6. Better methods of material control/inventory, and 7. Better R.O.I (Return On Investments).
Disadvantages
1. Strict maintenance becomes necessary to avoid production hold-ups, and 2. Adjustment to new situations and specifications becomes difficult, particularly in the
present period where stock demand is causing huge losses.
(b) Intermittent Production system
In this system, the goods are manufactured specifically to fulfill orders by customers rather than producing against stock. Here the flow of materials is intermittent.
Intermittent systems are those where the production facilities are flexible enough to handle a wise variety of products and size (e.g. Switchgear Industry).
Considerable storage between operations is required so that individual operations can be carried out independently for further utilization of men and machines.
Types of intermittent Production:
a. Job Production, and b. Batch Production
(a) Job Production :
Job Production is production of single complete unit by one operator or a group of operators, e.g. bridge building, dam construction, ship building etc. Here whole project is considered as one operation and work is completed on each project before passing on to the next. Each product is a class by itself and required a distinct and separate job for production process. The system required versatile and highly skilled labour with high capital investment.
(b) Batch Production:
Here, items are processed in lot. or batches and new batch is undertaken for production only when the production on all items of a batch is complete. In fact, batch type production can be considered as an extension of Job type system.
The best example of Batch type system is of Chemical Industry, where different medicines are manufactured in batches.
Other examples: Production of machine Tools and Printing Press, etc.
Characteristics of Intermittent Production
1. Products are manufactured in small quantity 2. Machines and equipment laid as per processes 3. Unbalanced workloads 4. Highly skilled workers are required 5. Large work in progress 6. Flexible to suit production varieties
Advantages
1. Can adjust new situations & specifications 2. Items can be manufactured according to order & hence fluctuation in demand can easily be taken care.
Disadvantages
1. As production is in small quantities, the cost of production per unit is high 2. As high skilled people are required which are not easily available & moreover their own de ands are costly 3. New high investment 4. More Inventory & large storage space required
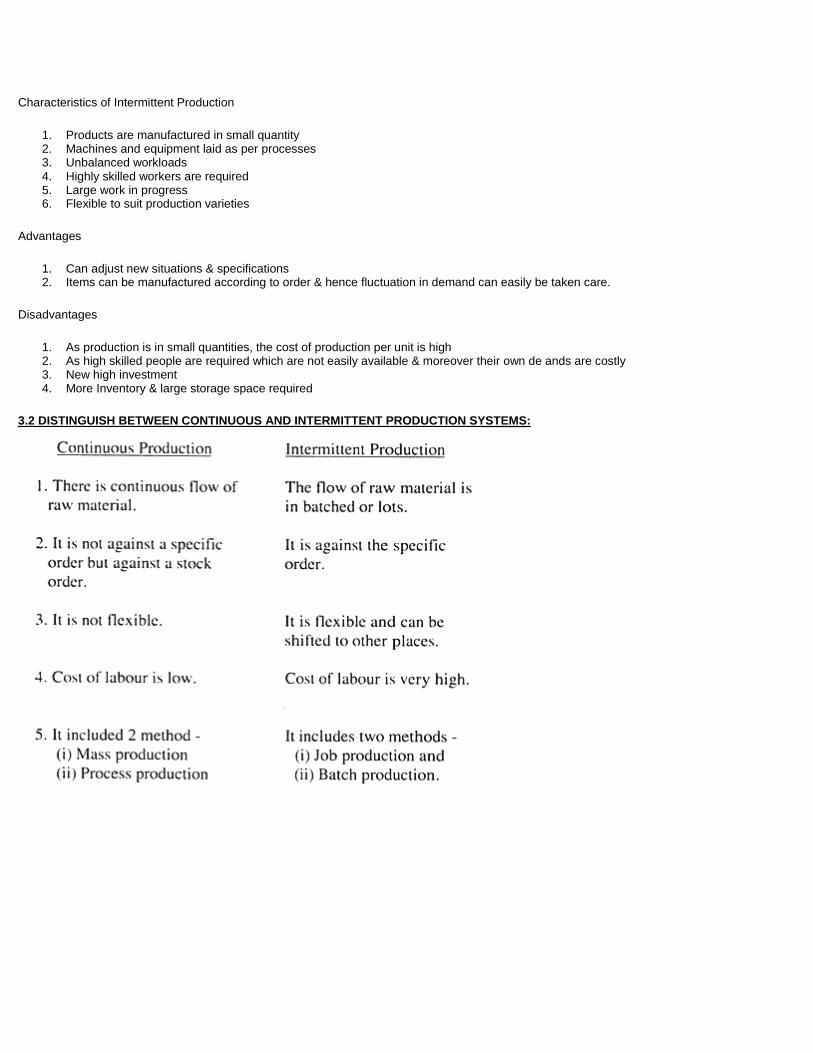
3.2 DISTINGUISH BETWEEN CONTINUOUS AND INTERMITTENT PRODUCTION SYSTEMS:
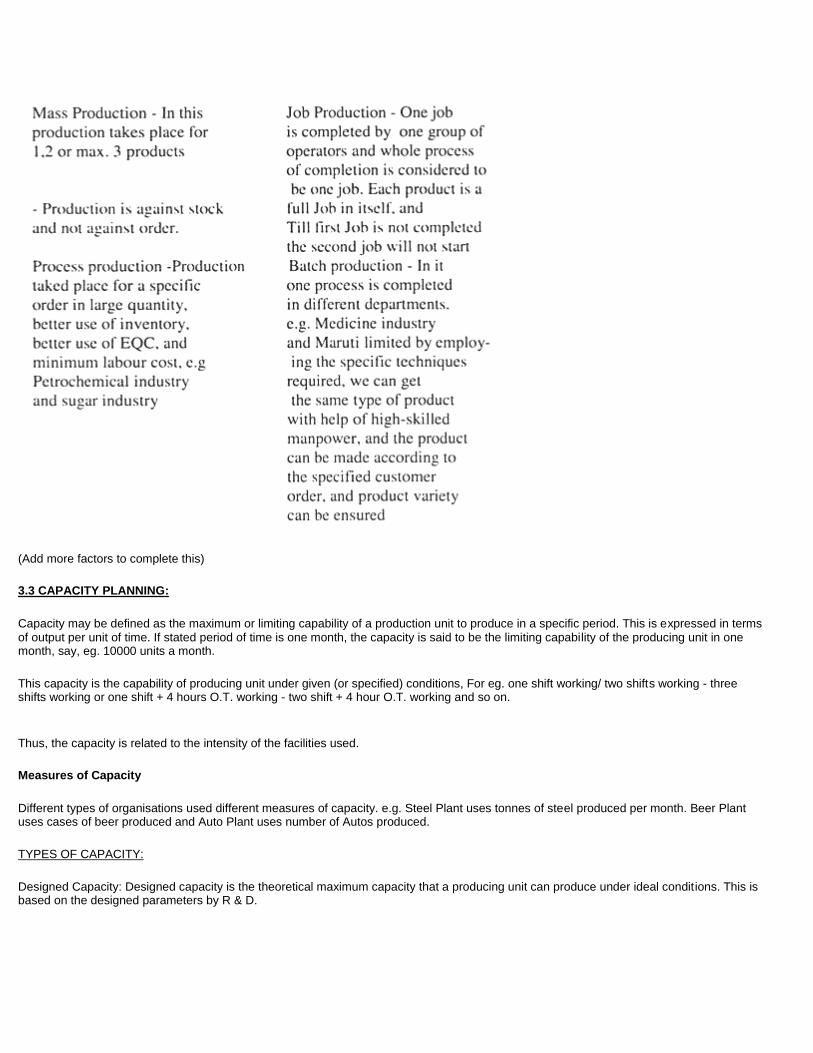
(Add more factors to complete this)
3.3 CAPACITY PLANNING:
Capacity may be defined as the maximum or limiting capability of a production unit to produce in a specific period. This is expressed in terms of output per unit of time. If stated period of time is one month, the capacity is said to be the limiting capability of the producing unit in one month, say, eg. 10000 units a month.
This capacity is the capability of producing unit under given (or specified) conditions, For eg. one shift working/ two shifts working - three shifts working or one shift + 4 hours O.T. working - two shift + 4 hour O.T. working and so on.
Thus, the capacity is related to the intensity of the facilities used.
Measures of Capacity
Different types of organisations used different measures of capacity. e.g. Steel Plant uses tonnes of steel produced per month. Beer Plant uses cases of beer produced and Auto Plant uses number of Autos produced.
TYPES OF CAPACITY:
Designed Capacity: Designed capacity is the theoretical maximum capacity that a producing unit can produce under ideal conditions. This is based on the designed parameters by R & D.
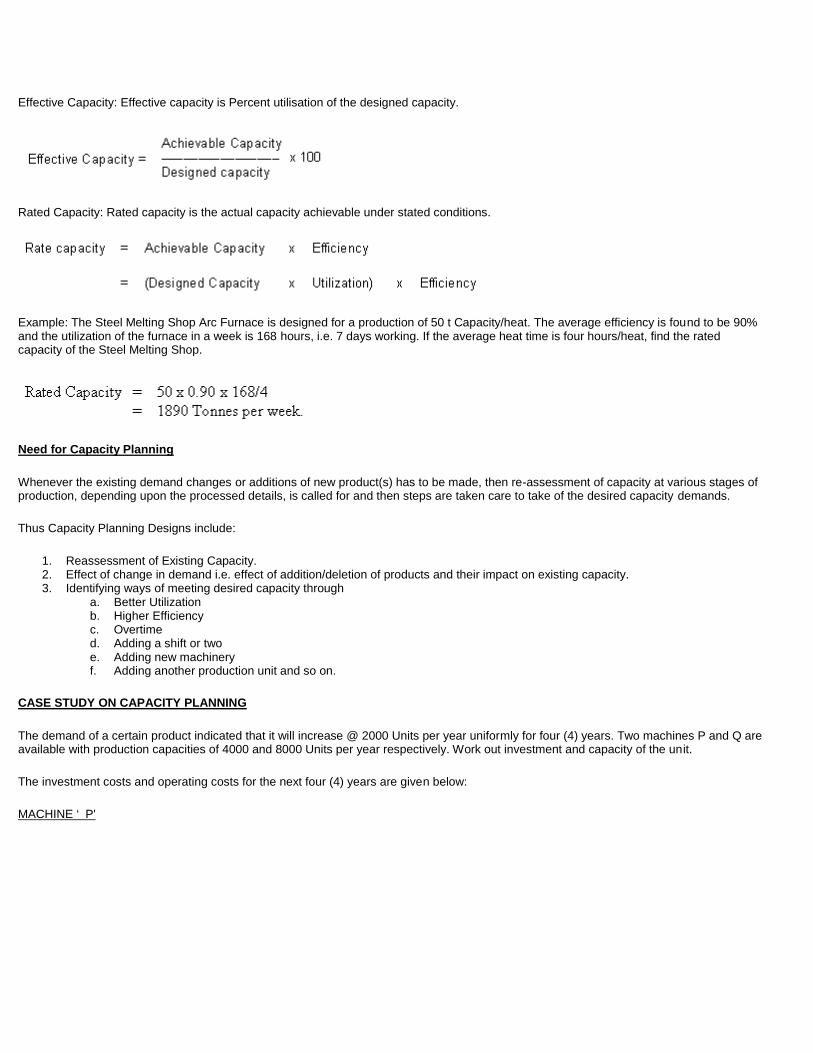
Effective Capacity: Effective capacity is Percent utilisation of the designed capacity.
Rated Capacity: Rated capacity is the actual capacity achievable under stated conditions.
Example: The Steel Melting Shop Arc Furnace is designed for a production of 50 t Capacity/heat. The average efficiency is found to be 90% and the utilization of the furnace in a week is 168 hours, i.e. 7 days working. If the average heat time is four hours/heat, find the rated capacity of the Steel Melting Shop.
Need for Capacity Planning
Whenever the existing demand changes or additions of new product(s) has to be made, then re-assessment of capacity at various stages of production, depending upon the processed details, is called for and then steps are taken care to take of the desired capacity demands.
Thus Capacity Planning Designs include:
1. Reassessment of Existing Capacity. 2. Effect of change in demand i.e. effect of addition/deletion of products and their impact on existing capacity. 3. Identifying ways of meeting desired capacity through
a. Better Utilization b. Higher Efficiency c. Overtime d. Adding a shift or two e. Adding new machinery f. Adding another production unit and so on.
CASE STUDY ON CAPACITY PLANNING
The demand of a certain product indicated that it will increase @ 2000 Units per year uniformly for four (4) years. Two machines P and Q are available with production capacities of 4000 and 8000 Units per year respectively. Work out investment and capacity of the unit.
The investment costs and operating costs for the next four (4) years are given below:
MACHINE ‘ P'

MACHINE ‘ Q'
Find which of the following two (2) plans is more economical.
PLAN I
Capacity added in increments of 4000 Units, taking outside help, if needed, during first and third years.
PLAN II
Capacity added in increments of 4000 units, taking outside help in first year.
The outside help is available @ Rs 80 per unit. Take average rate of interest @15 %
PLAN I
Capacity added in increments of 4000Units, taking outside help, if needed, during first and third years.
(a) Fixed Costs
(b) Operating Costs

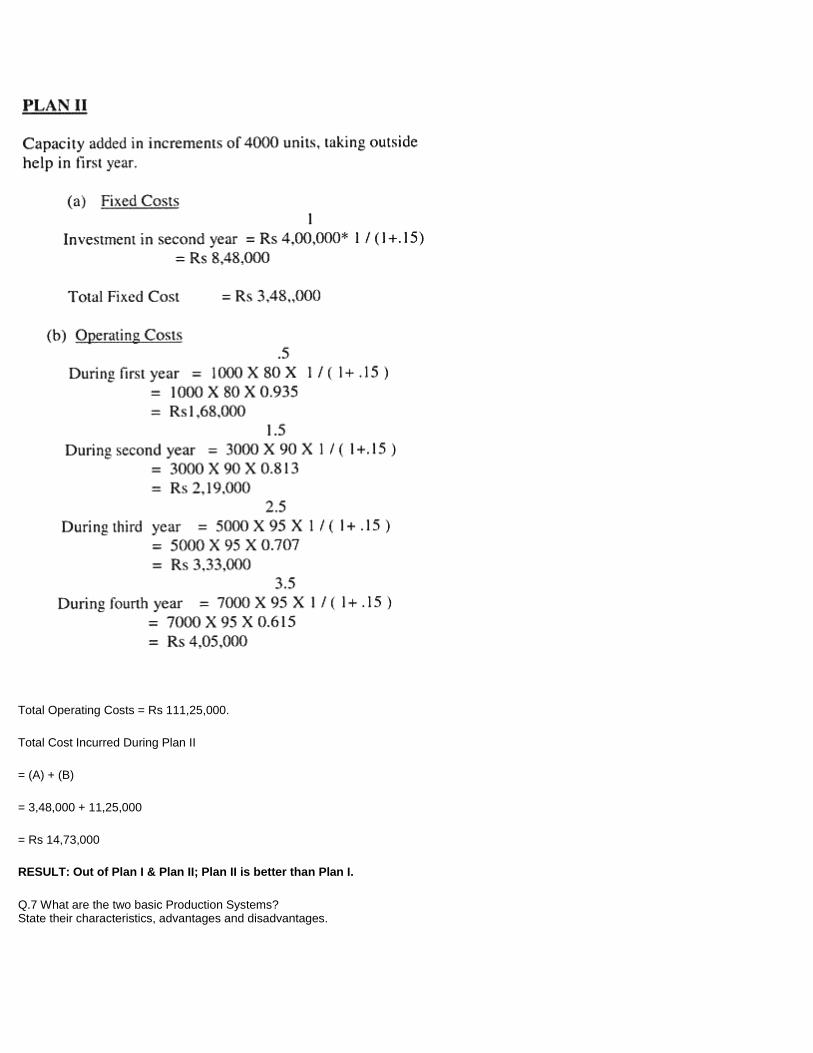
Total Operating Costs = Rs 111,25,000.
Total Cost Incurred During Plan II
= (A) + (B)
= 3,48,000 + 11,25,000
= Rs 14,73,000
RESULT: Out of Plan I & Plan II; Plan II is better than Plan I.
Q.7 What are the two basic Production Systems? State their characteristics, advantages and disadvantages.
Q.8 Distinguish between Continuous Production and Intermittent Production systems.
Q.9 Define Capacity. What do you understand by the following: (a) Designed Capacity (b) Effective Capacity (c) Rated capacity (d) Need for Capacity Planning

Chapter 4. PLANT LAYOUT & MATERIAL HANDLING
4.1
4.4 Advantages of a Good Plant Layout
Planning of the layout of machines and equipment has always been given priority in the operations. A successful plant layout depends to a large extent upon the layout of physical facilities in an organisation.
A layout is the physical Configuration of work stations, Departments and equipments in an organisation for conversion process.
i. Basically, a good layout helps in the smooth production process in an organization. ii. A Systemic and planned layout cuts down various production costs which may arise only because of unplanned or disorganised
layout. iii. It also reduces the time of production of the product or service. iv. A good plant layout will organise the requirement of the facilities in such a manner that most of the time it is useful for the production
process. Therefore, we can say that layout helps in optimal utilization of time constraint. v. A good layout also helps to improve and maintain the quality of the product. vi. Another important benefit of a good plant layout is that it considerably improves the delivery rate of the supplier, as there is low time
wastage and standardised quality.
Thus, in short, we can say that a good plant layout helps in smooth production, reduction idle time, helps maintaining the quality of the product and improve delivery rate of the system.
4.5 GUIDING PRINCIPLES IN DESIGNING A PRODUCTION LAYOUT:
1. The layout should be able to produce the forecasted amount of finished goods or services. 2. The layout planner should take all the departments and work stations into consideration. 3. While planning the layout, the activities interconnected with each other should be closely placed. 4. Layout planner should see that there is enough space to move around and breath after allocating spaced to the machines, work
stations and the equipment. 5. The layout planner should into consider alone the possibility of future modernisation and expansion plan. 6. The production layout should also take various maintenance factors into account. 7. The layout should be diversification designed to help in the maximization of profits and reduced so as in a production costs. 8. The layout should also take various steps keeping emergency handling into consideration. 9. Finally, in a production layout, all the elements necessary for the production should be taken care of and each factor discussed
above given due weightage. As a layout designing is a long term strategic decision, involving heavy investment on the system, a layout should be designed with utmost care. Care and perfection is also necessary for layout planning because most of the times it might not be possible to reverse the decision once taken.
4.6 TYPES OF LAYOUTS:
The types of layouts can be divised into three (3) major classes:
(1) Line Layout
(2) Functional Layout
(3) Combination of the above Two
Each of these methods of layouts had certain advantage and disadvantages. The decision to choose depends upon the requirements and conditions that must be met.
(1) Line or product layout
In the line layout, all the equipment required for one part or product is grouped together in one department in the sequence of the operations performed, so that the part is completed there and does not have to be moved from one department to another for processing. The line is “ balanced” , in that the output capacity of each different type of equipment (or process) is the same or as nearly so as practicable.
Ordinarily, only one product is processed by one line department. However, it is frequently possible to change the tooling on the machines and thereby use the same sequence of machines for production of some similar part.
A line layout is not usually a straight line. In fact, a straight line usually indicated inefficient use of floor space and greater intra-departmental handling costs. The ideal line is one in which the product of one machine gets automatically fed into the next, and so on. If each machine must be attended by workmen, it is desirable to arrange the machines in such a way that each operator can pick up the part from the place where it was deposited by the previous operator.
Conveyer belts, chutes and roller conveyer are used when size and shape of the machines make the direct arrangement inconvenient. In practice movement of parts is more likely to be similar to the shape of letters like S, U, L, M, N or O rather than a straight line.
It depends upon:
the number of machines involved
shape and size of the floor available
the size and weight of the product, and
the number and duration of the operations performed on the part.
Advantages of Line Layout:
1. Low total flow time for the product; 2. Higher rate of output, because there are no interruptions to the flow; 3. High division of work and specialization resulting in high productivity level; 4. Lower cost of manufacture; 5. Simple production planning; 6. Less inspection; 7. Low work in processed so that the time manufacture can be used just in time; 8. Lower material handling costs and 9. Better labour and machine utilization.
Disadvantages of Line Layout:
1. No variety is possible; 2. No flexibility with regard to design changes; 3. Very high stoppage costs as lines are highly integrated and if one part of the line stops, the entire line is affected; 4. High maintenance cost. 5. High capital cost and capital investment; 6. Less Job satisfaction for labour; 7. High line reliability is required resulting in duplication of critical machines and 8. More coordination required between materials, production and Job shop floor manager.
(2) PROCESS OR FUNCTIONAL LAYOUT
In the process or functional method of layout, the department is made up of machines, equipments or process that fall into one category, according to the functions performed. The product is fabricated by moving it from department to department according to the sequence of operations to be performed on it. The operations performed in each department are assigned to a particular machine within the department according to :
the capacity required
availability of machines
precision required and so forth.
Functional layout is general purpose layout and provided for:
great flexibility in output
flexibility in design of products and methods of production
minimizes the seriousness of a breakdown.
Advantages of a Process Layout :
1. A high degree of variety of products can be manufactured; 2. Flexibility and adaptability to change is high; 3. Machine break downs do not cause complete stoppage of work 4. Worker scan pick up a variety skills within their respective field of specification; 5. It is easier to give Job satisfaction to workers; 6. Coordination and supervision is simpler.
Possible Disadvantages:
1. Higher flow time of the product due to zig-zag flow through the system. 2. Larger number of machine setups; 3. High in-process inventory; 4. Low machine utilization; 5. More material handling and 6. Complex production planning;
(3) COMBINATION LAYOUT
Many companies employ combination method (i.e. the combination of product or line and Process or functional).
Examples:
layout of fabrication and processing line method for assembly and
for some particular component and process layout for painting or finishing and packaging for shipment.
The objective, of course, is to minimize the cost of production per unit of output.
The combination method of layout is feasible when a number of products require about the same sequence of functional operations but none enjoys sufficient volume justify individual production line. The principle of this method lies in the arrangement of functional departments across the building at right angles to the flow of product and in the required sequence of operations. Particular sections of each department are assigned the different lines of products, but the sections can be adjusted as volumes change to accommodate larger or smaller orders.
4.7 ASSEMBLY LINE:
An Assembly Line is the most common type of line layout in which the jobs are transported between the work stations. Each work-station carried out one or more tasks of the work. When tasks are over as per the technological sequence, the Job is said to be completed.
Various steps involved are
1. Breaking jobs into different tasks; 2. Identifying the preceding and succeeding relationship between various tasks; 3. Estimating or determining the performance time of each task through work measurement or motion study and 4. Processing each job as per the technological sequence till all tasks are completed.
The ideal time is developed when the number of machines and operations is balanced perfectly, so that each one is taking the same amount
of time and there is no idle time at anyone of the stations.
How to do it?
Let us consider an example:
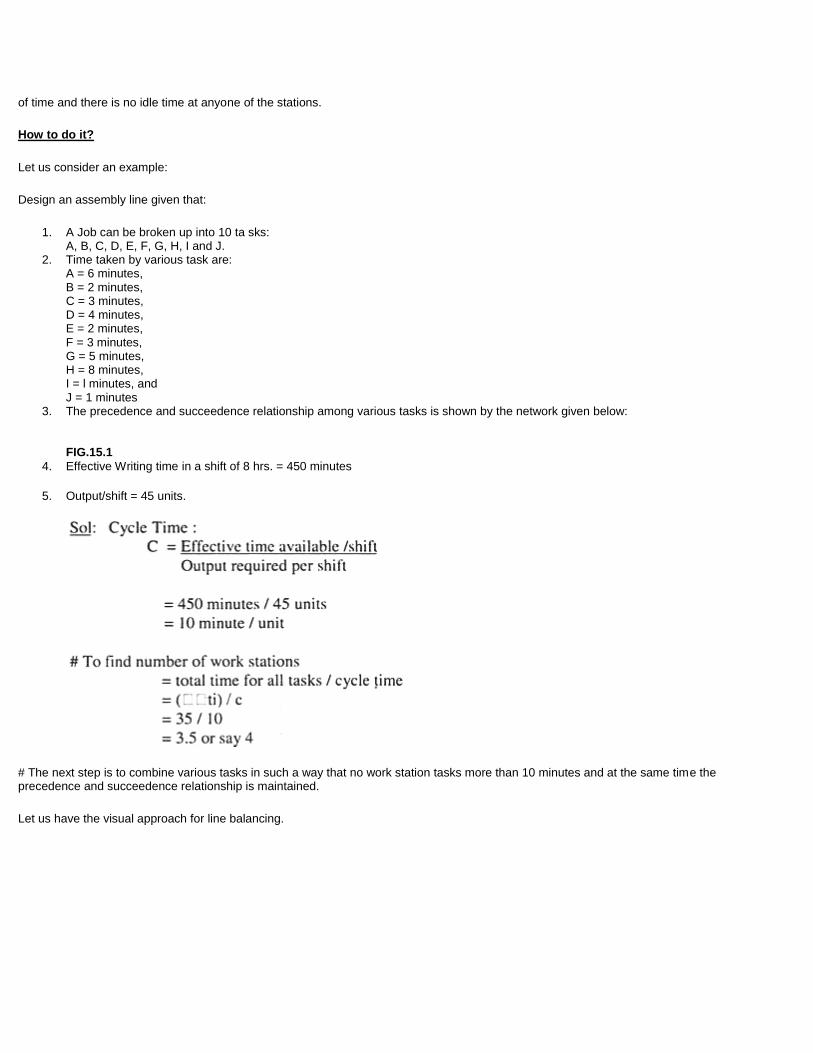
Design an assembly line given that:
1. A Job can be broken up into 10 ta sks: A, B, C, D, E, F, G, H, I and J.
2. Time taken by various task are: A = 6 minutes, B = 2 minutes, C = 3 minutes, D = 4 minutes, E = 2 minutes, F = 3 minutes, G = 5 minutes, H = 8 minutes, I = l minutes, and J = 1 minutes
3. The precedence and succeedence relationship among various tasks is shown by the network given below: FIG.15.1
4. Effective Writing time in a shift of 8 hrs. = 450 minutes
5. Output/shift = 45 units.
# The next step is to combine various tasks in such a way that no work station tasks more than 10 minutes and at the same time the precedence and succeedence relationship is maintained.
Let us have the visual approach for line balancing.

Step 1
A + B + C cannot be taken and it is 11 which is greater than 10.
A and D violated the relationship. Hence, take (A + B) as one work station.
Step 2
Take C + D + F = 3 + 4 + 3 = 10 minutes
Step 3
E + H = 2 + 8 = 10
Step 4
G + I + J = 7 minutes
n = 4, c = 10, E ti = 35
We have reached an optimal solution easily as number of tasks and stations is comparatively very low. However, under practical Assembly line Balancing, the problems we have large number of tasks up to 1000, and workstations up to 200 and complex precedence and succeedence relationships among tasks.
To solve such complex assembly line problems, there are a number of techniques. One such technique is given by Moodie & Young which is given briefly as follows:
Moodie & Young Method for an Assembly Line:
(1) Job consists of various Tasks (10 in number) A, B, C, D, E, F, G, H, I and J.
(2) The preceding and succeeding relationship is shown in the diagram given below:
PROCEDURE:
Various steps involved in Moodie and Young Method are:
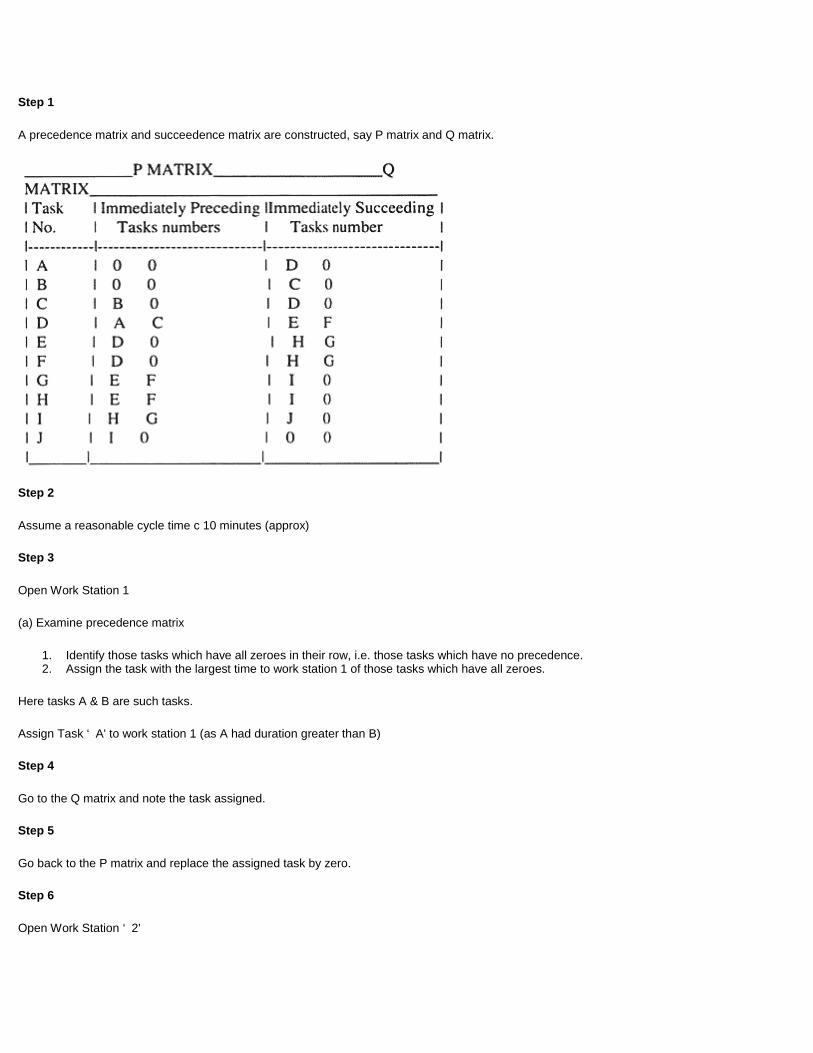
Step 1
A precedence matrix and succeedence matrix are constructed, say P matrix and Q matrix.
Step 2
Assume a reasonable cycle time c 10 minutes (approx)
Step 3
Open Work Station 1
(a) Examine precedence matrix
1. Identify those tasks which have all zeroes in their row, i.e. those tasks which have no precedence. 2. Assign the task with the largest time to work station 1 of those tasks which have all zeroes.
Here tasks A & B are such tasks.
Assign Task ‘ A' to work station 1 (as A had duration greater than B)
Step 4
Go to the Q matrix and note the task assigned.
Step 5
Go back to the P matrix and replace the assigned task by zero.
Step 6
Open Work Station ‘ 2'
Step 7
Repeat steps III, IV, V and then open next work station.
Step 8
Repeat till all the tasks are assigned.
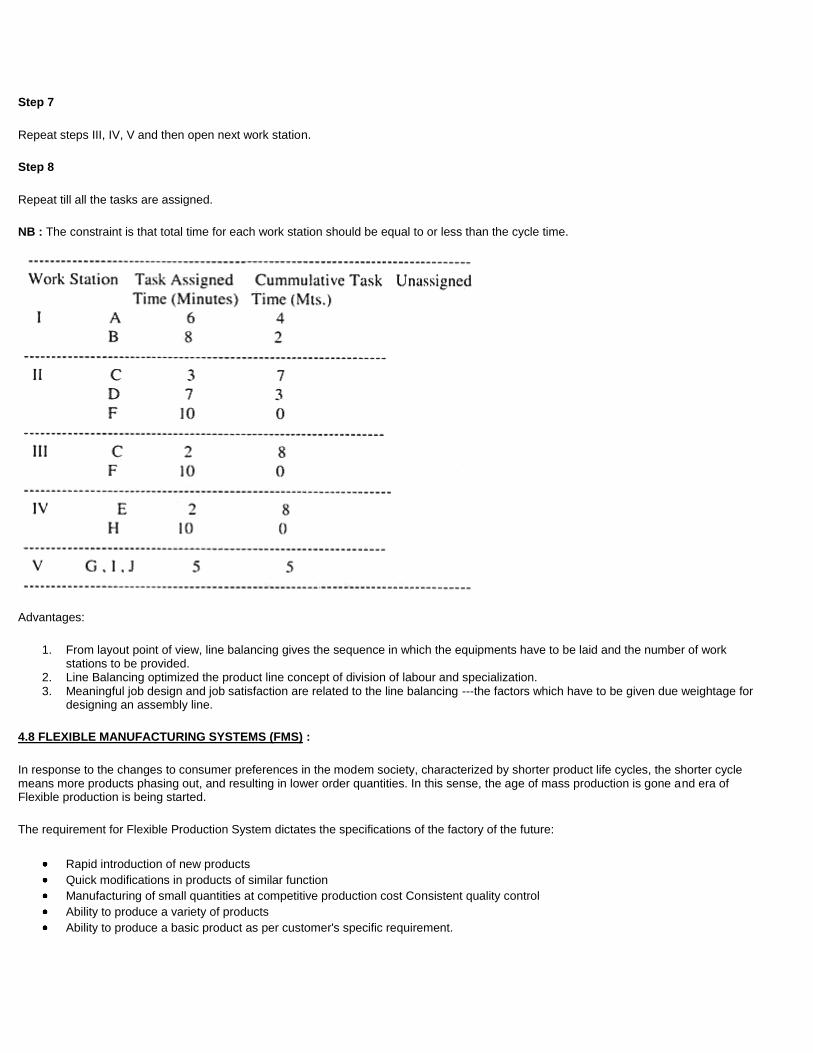
NB : The constraint is that total time for each work station should be equal to or less than the cycle time.
Advantages:
1. From layout point of view, line balancing gives the sequence in which the equipments have to be laid and the number of work stations to be provided.
2. Line Balancing optimized the product line concept of division of labour and specialization. 3. Meaningful job design and job satisfaction are related to the line balancing ---the factors which have to be given due weightage for
designing an assembly line.
4.8 FLEXIBLE MANUFACTURING SYSTEMS (FMS) :
In response to the changes to consumer preferences in the modem society, characterized by shorter product life cycles, the shorter cycle means more products phasing out, and resulting in lower order quantities. In this sense, the age of mass production is gone and era of Flexible production is being started.
The requirement for Flexible Production System dictates the specifications of the factory of the future:
Rapid introduction of new products
Quick modifications in products of similar function
Manufacturing of small quantities at competitive production cost Consistent quality control
Ability to produce a variety of products
Ability to produce a basic product as per customer's specific requirement.
THE FMS CONCEPT
A Flexible Manufacturing System (FMS) is a logical extension of CAM . An FMS consist of two or more computer-controlled machines linked
by handling devices such as robots and transport systems. Computers direct the overall sequence of operations and route the workpiece to the appropriate machine, select and load the proper tools, and control the operations performed by the machine. More than one different workpiece may be machined simultaneously and many different parts can be processed in random order.
The advantages of FMS include the following:
1. Increased productivity 2. Shorter preparation time for net products 3. Reduction of inventory parts in the plant 4. Saving of labour cost 5. Improved product quality 6. Attracting skilled people to manufacturing, and 7. Improved operator safety.
By making the use of FMS technology it should be possible to reduce the cost of producing parts in small and medium quantities.
General Electric modernized its locomotive plant in Erie , Pennsylvania , using an FMS.
The machining time for engine-frame parts was reduced from 16 days to 16 hours; overall productivity was increased by 240 percent; capacity was increased by 38 percent; and design flexibility was increased.
FMS provide the ability economically to manufacture small volumes of many different parts. This reduce work-in-process inventory, provides increased capacity due to reductions in setup times, better predictability and control of operations and scheduling, reduction in material-handling cost and greater sensitivity to market requirements. All these advantages can only help increase profitability and competitive position.
4.9 FACTORS FOR SELECTION OF MATERIAL HANDLING SYSTEM AND MATERIAL HANDLING EQUIPMENT :
Plant Layout & Material Handling go side by side. While working out details of Plant Layout details of Material Handling for movement of men & materials have to be worked out simultaneously. Knowing the details of materials & personnel required to be moved, we have to know the type of equipments required for the same.
Factors for selection of material handling system :
1. The amount of material to be handled from one work station to another (Load Summary). 2. To know the capacity of equipment required for handling the quantum of material in (1) we have to have the rate of handling & the
frequency. 3. The flow of materials. Normally it is kept Unidirectional. 4. Then nature of material required to be handled with respect to its shape, size, chemical, physical properties etc. 5. The dimensions such as length, width, height (normally ceiling height), column spacing, door openings & floor load capacity etc 6. The existing material handling system & its similarity for the system under consideration. 7. Proposed Extension - Expansion programmes etc.
FACTORS FOR SELECTION OF MATERIAL HANDLING EQUIPMENTS :
Major classification of Material Handling can be done into the following three groups:
(1) Conveyors (2) Trucks, Trailors, Forklifts etc. (3) Crane and Hoists
Group I
Conveyors:
A conveyor is a device to move material from one place to another, between two fixed points, in a horizontal or vertical direction.
Different types of conveyors used are: Belt conveyors Roller conveyors Screw conveyors Spiral chutes Trolley conveyors
Conveyors are normally used to handle bulk chemicals, bulk materials, fragile materiald such ad T. V. Picture tubes. The conveyors are normally installed where the frequency of handling is high - almost continuous. Ad they occupy a large space continuously.
Group II
Trucks, trailors, Fork Lifts etc.
As the trucks, Trailors & Fork lifts can move from one Location to another, hence the handling of materiald can be done almost in any direction. However, a path must be marked for the travelling of these equipments for the safety of men, machined & materials. Handling of materials by fork lift can be done in horizontal ad well ad vertical direction. They are generally used in Proceed Oriented Layout such ad Job ship, maintenance shops, airputs, hospitals etc.
Group 3
Crane & Hoists
Cranes & hoists type of handling equipment are of intermediate type. They can move material to laterally or vertically locations over a limited radius. These are commonly used in Heavy Engineering Workshops, Construction Projects, Ports etc. for large volumes & heavy lifting.
REVIEW QUESTIONS:
Q. 1 Define factory and factory planning.
Q.2 What do you understand by Location of an Industry.
Q.3 Describe briefly the Optimal Criteria for selecting a plant location
OR
Show that the Optimal Criterion or a Plant Location is minimum of total cost and total assets.
Q.4 What are the factors affecting the selection of a Regional Plant Site?
Q.5 What do you understand by Multi-plant Location Problem?
Q.6 What are the advantages of a good plant layout? State the various guidelines which help in achieving a good plant layout.
Q.7 What are the various types of layouts? Describe them.
Q.8 Describe Moodie and Young method for an Assembly Line.
Q.9 Discuss “ Use of Computers in Modern Production (Operations) Management” .
Q.10 Describe Flexible Manufacturing System (FMS) .State its importance in to-days context in India .
Q .11 Discuss “ Role of computers in design of Layouts” .
Q.12 Discuss briefly the factors for selection of:
(a) Material handling system (b) Material handling equipment

Chapter 5. PRODUCT DEVELOPMENT
5.1 MEANING AND ROLE OF PRODUCT:
As consumer we buy different kinds of products so as to satisfy our various needs. We buy food-grains, textiles pens, books etc. in our daily life. However, our decision to buy a product is based not only on tangible attributes but also on a variety of non-tangible and psychological attributes such as services, brand, package, warranty, image etc.
According to ALDERSON, Product is a bundle of utilities consisting of various product features and accompanying services. The bundle of utilities is composed of those physical and physiological attributes that the buyer receives when he buys the product and which the seller pro ides by selling a particular combination of product features and associated services.
According to SCHWARTZ, “ a product is something a firm markets that will satisfy a personal want or fill a business or community need, “ and includes” , all the peripheral factors that may contribute to consumer's satisfaction.”
These factors may include reputation of the manufacturer, the warranty, credit and delivery term, the brand name and the courtesy shown by the sales and service personnel.
From these definitions it is clear that a product is something which offers not only the tangible but also the non-tangible services and psychological attributes such as prestige Image etc. e.g.
Nirlon Synthetic Fibres and Chemicals Ltd., Bombay , offers a 3 tier after sales service called NASA 4, along with its tangible product - conveyor belts. These services include
i. A highly qualified Technical Survey Group which studies the customer's needs in depth and suggest the most suitable conveyor belts for the most stringent individual requirements.
ii. Then the Maintenance Consultancy Cell for the Customer's Technical Personal where the conveyor's technical experts and engineers arrange courses and services on the maintenance and proper usage of conveyor belting.
iii. The third service is the on-site Belt Splicing and repair Services by the company's skilled supervisors.
Like wise Hindustan Level Ltd., Bombay, offers a Pear's soap, it docs not merely offer a bathing soap--> a tangible attribute -but also 'mother's love' for a child --> a psychological attribute. These essentially made Levitt to that “ Management must think of itself not as producing product but as providing a customer with bunch of value satisfaction. The organisation must learn to think of itself not as producing goods or services but as buying customers” .
5.2 MAJOR CLASSIFICATION OF PRODUCTS:
I. Consumer and Industrial Product:
Consumer product are those products which are destined for use by ultimate customers or households and in such form that they can be used without further commercial processing. Whereas industrial product are those which are destined to be used by buyers (customers) as inputs in producing other products and for further commercial processing.
In other words, consumer products are meant for personal and non-business use whereas industrial products are meant for non-personal and business use. e.g. Soap, Toothpaste, Wristwatch, Cigarette etc. are meant for personal use and hence are called CONSUMER GOODS. While Machine Tools, Computers, Trucks, Machinery etc. are meant for Non-personal and business use of providing other products and hence are called Industrial Products.
However, no product may be exclusively classified as Customer or Industrial Product. It depends upon the specific purchase situation. e.g. COCONUT OIL when purchased by a housewife is a consumer product but when purchased by a hair-oil or soap manufacturer who buys it as an input, process it and then sells it to ultimate consumers as a different product is called an Industrial Product.
II. Durable and Non-durable Products:
Durable Products are those tangible products which normally survive many uses like e.g. Machinery, Cars, Scooters, Furniture, Cooler,

Refrigerator etc.
Whereas Non-Durable products are those tangible products which normally survive a few uses or consumed in one use itself, e.g. Lubricating oils, Soap, toffees and cornflakes etc.
Services are those intangible products like activities, benefits or satisfaction which are offered for sale e.g. hairdressing, banking. insurance etc.
III. Convenience, Shopping and speciality Product:
The consumer products have been divided into 3 following classes:
a. Convenience Products: Convenience Products are those consumer products which a customer usually purchases frequently, immediately and within the minimum of effort e.g. soap, toothpaste, bread, chewingum, biscuits etc.
b. Shopping Products: Shopping Products are those consumer products which the customer, in the process of selection and purchase characteristically compares on such bars as suitability, quality, price and style etc. e.g. refrigerator, fans, cooler, mopeds, suiting etc.
c. Speciality Products: Speciality products are those consumer products with unique characteristics and/or brand identification for which a significant group of people (buyers) are habitual willing to make a special purchasing effort. e.g. Ice-cream, special eating items, fancy goods etc.
5.3 DESIGN OF A PRODUCT:
Design of a product may be defined as determining its shape, specifications and pattern of the product. According to the feature or shape, configuration, pattern or ornament, applied to any article by any industrial process, whether manual, mechanical or chemical, which in the furnished article appeal to and are judged solely by the eye, but does not include any mode or principle of construction or anything which is a mere mechanical device and does not include any trade mark".
Types of Design
Product design may be divided into four groups:
a. Functional b. Aesthetic c. Production d. Packaging
(a) Functional Design:
Developing an idea: Making a rough sketch of the proposed product which gives an idea of its overall shape and the parts necessary to accomplish the task.
Drafting Specifications: The next step is to draft the correct dimensions of the product.
Experimental Model: Then experimental models are proposed and tasted thoroughly starting actual production.
(b) Aesthetic Design:
Now, it is not sufficient that the functional design of the product is good and economical, but it must appeal to the customers' eyes and induce them to buy the product. Thus its better if before commencing “ Commercial Product” , the feedback from a few potential customers is obtained.
(c) Production Design:
The functional design has to be translated to Production Design without sacrificing the functional efficiency, the product design must conform to the fact that the production can be carried out in an economic manner and also the design of gig-sand fixtures needed in production should be done simultaneously.

(d) Packaging Design:
The design of labels and packaging must be aesthetical as well as give complete information (minimum required information in the Mandatory one) and must be strong and sturdy so that the product does not get damaged during transit or handling. The aesthetic look of the packaging acts as a silent salesman particularly for the consumer products sold through bog departmental stores or superbazars where there is no salesman on the spot.
Moreover, especially for EXPORT Products, the strength and toughness of the Packaging must be good enough to withstand long journey and rough handling at various stages. It is said that if our Packaging and Packing for Export Products are accepted by Importers, we can have increase in our Exports gains by 33%.
Various factors required to be kept in mind are:
i. The customers' satisfaction and requirement. ii. The aesthetic look of products. iii. The production process including the tools and tackles, gigs and fixtures etc. required by the operator and smooth functioning of the
process such that high productivity can be achieved. iv. The selection of type of material and method/technology should be very carefully done as this is very costly and change of
Technology, in particular, is not so easy. v. Modem method of working - use of CAD/CAM, FMS, CNCM/CS, Line Balancing etc.
5.4 PRODUCT DEVELOPMENT:
It means devising a product to meet the requirement of the market or the customer. It involves two main aspects:
1. Introduction of new product confirming the demands of the customer. 2. Improvement of existing product in order to satisfy the needs of the customer.
The steps of the product development procedure can be best explained by a diagram (fig.4.3of your text at page 83)
( Fig. 4.3)
Needs of Product Development: The need of product development is to get its objectives. There are two main aspects:
(1) Immediate objectives include:
Stimulation of sales function
Offer of new look; quality advantages to the public;
Utilization of existing equipment and skilled men;
Fulfillment of immediate requirement of the customer.
(2) Ultimate Objectives include:
Monopolisation of market;
Making possible its manufacture on quality basis;
Pursuasion of the person to only branded product;
Reduction in the cost of production by creating demand and producing on large scale basis;
Supply the goods to the customer at a lower price due to reduction in cost of production.
Factors responsible for product development
A well organised and coordinated plan of production of development, if it successfully implemented will benefit the producers, consumers and whole of the society.
The question or factors are:
1. Does the product satisfy the customers' preference; size; color; shape etc.? 2. Has the product been designed or economy in the factory production to ensure a reasonable price? 3. What is the possibility of product protection? 4. What will be the probable effect of product development on their products line? 5. What are the manufacturing and distribution facilities available for the product. 6. Is the stock and display of the product convenient? 7. To what extent will the by-product or waste be utilized? 8. Can the product be sold/distributed through existing distributing channels? 9. Is the product within the buy in capacity of the consumer? 10. Will the product afford stable supply? 11. Is the product convenient to handle, carry out of stores to use? 12. Whether the product is durable and can prevent the spoilage during the course of its transfer to the customer? 13. Is the quantity of the product a pealing to the people which may help increasing the demand continuously? 14. What relationships stand between development research and manufacturing costs and return expected due to development plan
which is going to be embarked upon? 15. Is the product pleasing to the eyes?
5.5 PRODUCT STANDARDIZATION:
It means fixation of Standard dimensions for the product with a view to having large production of only limited number of varieties.
Objects and Importance:
The object is to measure; to identify; to compare; to describe product process; activities and performance in an organization. It helps in controlling function of management.
Advantages:
i. Standardization facilitates large scale production. ii. It eliminates the wastage in designing and purchasing. iii. It helps in introducing mechanization. iv. It helps in assisting the controlling function of the production system. v. It gives incentives to management for producing new style. vi. Loan on standard commodities are easier to act. vii. Service and maintenance cost are reduced. viii. Higher Productivity. ix. Purchasing or selling becomes easier.
Disadvantages
i. Standardization promotes rigidity. ii. Not suitable for small entrepreneurs. iii. Excessive Standardisation has deleterious effect.
(2) SIMPLIFICATION
“ It refers to the elimination of superfluous varieties; sizes; dimensions etc." -W.R.SPRIEGEL and R.H. LAUSBURG.
Advantages:
(A) To Producer:
i. Reduction in the manufacturing costs. ii. Use of specialized plants. iii. Reduction in inventories.

iv. Increase in efficiency. v. Better market control. vi. Increased profit. vii. Use of skilled persons. viii. Reduces involvement in plants. ix. Reduces cost of after sales. x. Saves storage space. xi. Eliminetes order queues. xii. Makes supervision and production planning easier.
(B) To Consumer:
i. Quality products at cheaper rates. ii. Greater repair and services facilities. iii. Steady supply of products.
Disadvantages:
i. Effects of seasonal fluctuations. ii. Low of competitive position is especially in complementary products.
(3) AUTOMATION
It means replacment of manual and human workby machines which are capable of doing physical and mental work.
Stages:
i. Material handling stages. ii. Manufacturing. iii. Finished Product stage.
Advantages:
i. Reduction in production costs due to reduce in direct labour cost. variable cost, wastages. ii. Improved quality because possibility of human errors does not exist. iii. Higher standard of living due to improved quality and lower cost/unit. iv. Better working condition tor workers. v. Benefit to firm-higher profit and goodwill.
Disadvantages:
i. Displacement of personnel. ii. Involvement of high cost -initial cost; replacement cost; maintenance cost. iii. Increased working cost -hish fixed cost and Break even point. iv. Non-stop work. v. High skilled operations. vi. Difficulties in designing; procuring and building processes.
Feasibility:
Automation is feasible if:
i. Large scale production is planned. ii. Total production time is excessive. iii. Floor space is not available. iv. Financial position of the firm is sound.
v. High labour cost continue a major part of the total cost of product.
5.6 PRODUCT LIFE CYCLE:
The demand for a product generally tends to follow a predictable pattern called the Product Life Cycle (PLC). Product Life Cycle has been defined as “ an attempt to recognise different distinct stages in the sales history of the product;” and “ a generalised model of sales and profit trends for a product class or category over a period of time.”
The various stages through which a product passes are shown in the graph given below:
Fig. 5.6
Introduction
Growth
Maturity
Saturation
Decline
Brief description:
The ‘ INTRODUCTION ' is the first stage which begins with the launching of a new product. The product entry into the market requires a large investment which gradually comes down as sales price up.
The sales at this stage are fairly low and the competitors arc already there in the field.
The next stage is ‘ GROWTH ' stage. Both sales and profit begin to rise (as shown in the graph) At the end of this stage, the arrangement of distribution is likely to get completed.
The third stage is called ‘ MATURITY ' stage. During this stage the manufacturers introduce new models or adopt new techniques for
production of product with a view to retaining their position in the market. This stage is marked by stiff competition. Though the number of buyers continues to increase but the rate of growth is quite low.
The fourth stage is called ‘ SATURATION ' stage. This stage is marked by a point of stagnation. The products sale goes up sluggishly but the profit decline.
The last stage is ‘ DECLINE (DECAY) '. The sales decline and the profit reduce down as the new competitors appear in the market with newer and better products and the customers start using them. It is here, the story of a product ends.
REVIEW QUESTIONS :-
Q.1 What do understand by product Development? Discuss its needs and explain the factors which would be taken into consideration while developing a new product.
Q.2 Write short notes on
(1) Standardization
(2) Simplication
(3) Automation.
Q.3 What do you understand by PLC (Product Life Cycle)? Explain various issues involved.

Q.4 (a) Define the Meaning and role of Product.
(b) What are the Major Classifications of products? Describe briefly.
Q.5 What do you understand by the term “ Design of a Product” ? Describe briefly the various factors taken into account while designing a product.

Chapter 6. MATERIAL MANAGEMENT – INVENTORY CONTROL
6.1 MATERIAL MANAGEMENT DEFINED:
MATERIAL MANAGEMENT is defined as the integrated function of Purchasing and allied activities so as to achieve the maximum coordination and optimum expenditure in the area of MATERIALS.
Various factors served by MATERIAL MANAGEMENT include
MATERIAL Planning
Purchasing
Receiving
Stores
Inventory Control
Scrap and surplus disposal
Keeping above functions in mind, MM is the function responsible for the coordination of planning, sourcing, purchasing, moving, stocking and controlling MATERIAL in a optimum manner so as to provide a pre-decided service to the organisation at a minimum cost.
MATERIAL Planning and Control
Based on the Sales forecast and Production Plans, the MATERIAL planning and control is done:
This involves estimation of individual requirements of parts, preparing MATERIAL budgets, forecasts the levels of inventories, scheduling the orders a d monitoring the performance in relation to production and sales.
Purchasing
This includes:
selection of sources of supply (sourcing)
finalization of terms of purchasing
placement of purchase orders
follow-up
maintenance of smooth relations with suppliers
approval of payment to suppliers
evaluation and rating suppliers (Vender Rating)
Stores and Inventory MANAGEMENT :
This involves:
physical control of MATERIAL
preservation of stores
minimisation of obsolescence and damage, through timely disposal and efficient handling
Stores are also responsible for physical handling and verification of stocks and reconciling for the book figures. Also stocks are responsible for -classification, codification, ABC Analysis, fixing EOQs, setting safety stock levels, lead time analysis and reporting i.e. all aspects of inventory control. Also functions of storekeeping such as Perceiving, Storing, issuing as well as MATERIAL handling within the stores.
Also (Traffic or C and F)

Clearing incoming MATERIALs (both inland and foreign) Dispatching finished goods.
Advantages of Material Management can be explained by the following three aspects:
The modern concepts of Material Management are the keys to the cost reduction and profitability.
This can be explained well with the following:
Supply Chain Management
Logistic Management
Integrated Material Management.
(i) Supply Chain Management:
Supply management is a process responsible for the development and management of a firm's total supply system -both the internal and the external components. At an operational level, it includes and expands the activities of the purchasing function and the procurement process. Its major focus; however is strategic. This is reflected in the activities added to the scope of its responsibilities all of which have two characteristics:-
1. They deal with activities that have great potential for impacting the success of the firm. 2. They tend to be interdisciplinary in nature and integrate supply actions with those of other key players in the firm :-
Specific activities generally included in supply management are :-
1. Early purchasing involvement (EPI) and early supplier involvement (ESI) in product design and subsequent specification development for important items, typically through the use of cross-functional teams.
2. Conduct of all purchasing function and procurement process activities. 3. Heavy use of cross -functional teams in supplier qualification and selection. 4. Heavy use of purchasing partnering arrangements and strategic alliances with supplier -to develop close and mutually beneficial
linkage with key suppliers in the value chain and to control quality and costs. 5. Continuous identification of treats and opportunities in a firm's supply environment. 6. Development of strategic, long- term acquisition plans for all major materials. 7. The monitoring of continuous improvement in the supply chains. 8. Active participation in the corporate strategic planning process.
Fig 1 The Supply Chain (Network) Exploded.
(ii) LOGISTIC MANAGEMENT:
Logistic management is managing the things keeping in mind all the scenarios and thinking logistically regarding each and every step which is involved.
The practical problems should be highlighted first and the solutions should be given to them. Also the effect of one process over the other and their causes and effects should be studied. e.g. in case of processing through transportation: all the routes should be studied well from where the transport will pass. The mode of transportation should be decided keeping in mind the most cost and time effective manner. For taking these kinds of decisions manager should be aware of all the different alternatives which could be used and then take out the most cost effective decision.
(iii) INTEGRATED MATERIAL MANAGEMENT:
The importance of materials management lies in its capacity to reduce the material cost. It has scope and the material manager can devise ways and means to administer saving in material cost. To meet this aspect, the management is functionally divided into three broad
segments of management. These are:-
1. Arranging for finance: Making provisions for the operation of the enterprise for which the management has to make all efforts to arrange for adequate finance so that the organisation may run smoothly without any interruption.
2. Assembly, acquisition, storage land production of material : It is the function of actual operation of the enterprise. For an efficient and purposeful operation of the enterprise materials are to be assembled, acquired, stored and produced so that the organisation may move ahead uninterrupted with speed and goodwill.
3. Distribution: The organisation operates for the ultimate consumer. It is the basic function of any management to arrange the distribution so as to get the goods and services reach the ultimate consumer .Material management integrates and coordinates the functions of management to ensure success of an enterprise. Every manufacturing concern is engaged in budgeting, purchasing and procuring, receiving, production scheduling, producing, maintaining, controlling the inventory, controlling the quality, standardising and also storing and warehousing, distributing and transporting. Materials management is required to plan, organise, staff, direct, control and coordinate its own efforts in the light of the predetermined objectives of the entire organisation.
Advantages in Integrated MANAGEMENT Concept
1. Better Accountability 2. Better coordination 3. Better Performance 4. Adaptability to EDP 5. Miscellaneous Advantages
Miscellaneous Advantages:
Under a central MM, a team spirit is inculcated. This results in better morale and cooperation. The opportunity for growth and development arc better and an individual is not confined to one function alone but gets exposed to broader aspects of MATERIAL function.
What are 5 Rights?
Right Quality Right Quantity Right Price Right Sources at Right Time (Timed supply)
Integrated Approach
All Departments must work for the one corporate goal --> growth of the company.
a true, correct and timely exchange of information between the various departments will lead to integrated approach and aimed inter-departmental conflicts.
The user Department's responsibility is to requisite right Quality/Specifications of the MATERIALS needed by it is not the final/ultimate authority to decide which MATERIAL is adequate or not.
6.2 INVENTORY CONTROL:
Inventory is the stock of items or resources required in an organisation for running production smoothly. Inventory is necessary because of the following reasons:
1. To meet customers requirement. 2. Smooth functioning of product on process. 3. Uncertainty due to irregular de and supply. 4. Economics of scale. 5. Best utilization of equipment and resources.
There are two basic questions required to be answered in any Inventory Control System. They are
1. When to Order?

2. How much to Order?
Differences between P and Q types of Inventory Control Systems:
Major Inventory related Costs:
Major Inventory related costs can be classified into the following four categories;
a. Inventory carrying cost b. Ordering cost c. Cost of under-stocking d. Cost of over- stocking
(a) Inventory carrying cost:

Carrying inventory costs money. This is the cost a company has to incur for maintaining stocks to run the works smoothly. It involves the following costs:
i. Blocking working capital- such as Interest on Capital and Depreciation etc. ii. Occupying Space, thereby incurring Warehouse rent and cost of facilities like bins, racks etc. iii. Increasing risks of spoilage, obsolescence, theft, leakage etc. iv. Salary of stores staff etc. v. Insurance premium.
Thus cost is measured in terms of Per unit/per year or as a % of the inventory value.
The Inventory carrying cost varies and is generally taken as 25 %.
(b) Ordering cost:
Every time an order is placed for replenishment, certain costs are involved.
The ordering cost involves paper work expenses, follow-up cost, cost of transporting the MATERIAL and its receipt and inspection every time the MATERIAL is procured. The average ordering cost is Rs.100 in India .
(c) Under stocking cost:
This cost Ku, is the cost incurred when an item is out of stock. It includes the cost of lost production during the period of stock out and the extra cost per unit, which might have to be paid for an Emergency Purchase.
(d) Over stocking cost:
This cost Ko, is the inventory carrying cost (which is calculated per year) for a specific period of time. Based on above costs several scientific inventory models have been developed.
6.3 INVENTORY MODEL UNDER CERTAINITY:
In case of Inventory Model under Certainty
Demand is certain and hence constant
Supply is timely and hence no overstocking or under stocking
Thus the only two costs relevant in this case are:
X Cost of inventory carrying
X Cost of Ordering
(Ref: Fig.12.6 at page 389 of your text)
Depending on quantity to be ordered for purchase, the inventory carrying cost increases with increase in purchase quantity whereas the ordering cost decreases as the number of orders to be placed decreases. Thus Ordering costs and inventory carrying costs oppose each other. This indicates that there exists a point at which the total inventory carrying cost is Minimum.

6 SOLVED PROBLEMS ON INVENTORY CONTROL :
PROB (I) for an item costing Rs 50 per unit, there is a constant demand of 15,000 units per annum. The estimated cost of placing an order is
Rs 150 and the inventory carrying cost is 24 %. Find the Economic Order Quantity (E O Q).

PROB 1(b): For the above given data, the supplier offers 5% discount if the order quantity is made double of the E O Q. Should he accept the discount offer or not?
Find TC = D x C + Y2 Qci + D/Q A TC 1 = DC 1 + + 1/2 Q 1 C 1 i + D/Q 1 A Accept Discount if TC 1 < TC .Ans
Prob.2: For the data given below
d = 60 units per year Q = 15 units per order L = 1 month or 1/12 of a year r = 9 units (here r = re-order level)
The demand during lead time is Poisson distribution. Find the number of stock outs per year.
Sol: Number of orders per year = D / Q
=60/15=4
Average demand in lead time = 60 x 1/12 = 5 units
Hence, from Poisson's table,
probability of stock out = 1 -P(9)

= 1 -0.968 = 0.032
Thus number of stock outs per year = 0.032 x 4
=0.12
Or one stock out in roughly 8.33 years.
Q. Find E O Q and how often the Production run should be made for the following data:
Q. A contractor has to supply 10,000 bearings per day to an authorized manufacturer. He finds that, when he starts a production run, he can produce 25,000 bearings per day. The cost of holding a bearing per day is @ Rs 0.0020 per bearing per day and the set up cost of a production run is @ Rs 720.
How frequently should the production be planned?
Therefore the production should be planned every 11th day.
------------------------------------------------------------------------------------------------------------------------------------------------------------------------------------------- TRY YOURSELF :
Q. A manufacturer receives an order for 6890 items to be delivered over a period of one year, as follows:
At end of Week 1: 5 items
At end of Week 2: 10 items
At end of Week 3: 15 items
and so on.
The cost of carrying inventory is Rs 2.60 per item per year and the cost of a set up is Rs 450 per production run.
(a) Compute the cost for the following policies:
i. Make all 6890 at start of the year. ii. Make 3445 now and 3445 in 6 months. iii. Make half of the order each month. iv. Make 1/52 th of the order each week.
ANSWERS:
i. Rs 1200 ii. Rs 8000 iii. Rs 9000 iv. Rs 27000
(b) Attempt to devise a more rational policy.
-------------------------------------------------------------------------------------------------------------------------------------------------------------------------------------------
6.4 USE OF COMPUTERS IN MATERIALS MANAGEMENT:
MATERIALS MANAGEMENT is an interactive MATERIALS requirement planning and control system. The object of the system is to make it easier to deal with the complexities of operating a manufacturing company by taking into account various aspects of information flow and MANAGEMENT. It is primarily designed for manufacturers who build standard product to stock in discrete manufacturing steps (Fabricators and Assemblers). These companies have a significant investment in inventory, and the system can help them balance their inventory levels with customer demands for timely shipments. MATERIALs MANAGEMENT System consist of ten major modules:
1. Master production scheduling (MPS):
This is a MANAGEMENT planning and production scheduling tool. It is used by the master scheduler to generate a production schedule for the plant's marketable products. Input to the module includes current customer orders, forecast customer orders, the current production schedule, and the current level of product inventory. The output of the MPS calculations is called the master production schedule. This schedule contains suggested manufacturing orders including quantities and starting dates. The schedule is then input to the MATERIALs requirement planning (MRP) module the plan to manufacture and purchase of the required component parts.
2. Rough-cut resource planning (RRP):
This is a MANAGEMENT tool used by a master scheduler to help produce a realistic master schedule by comparing the resources needed to implement the master schedule with the available critical resources. The example of critical resources are labour hours, floor space, investment in work- in-process inventory, and MATERIALS supply. The (RRP) reports highlight the capacity constraints and help the user resolve competing demands for critical resources.
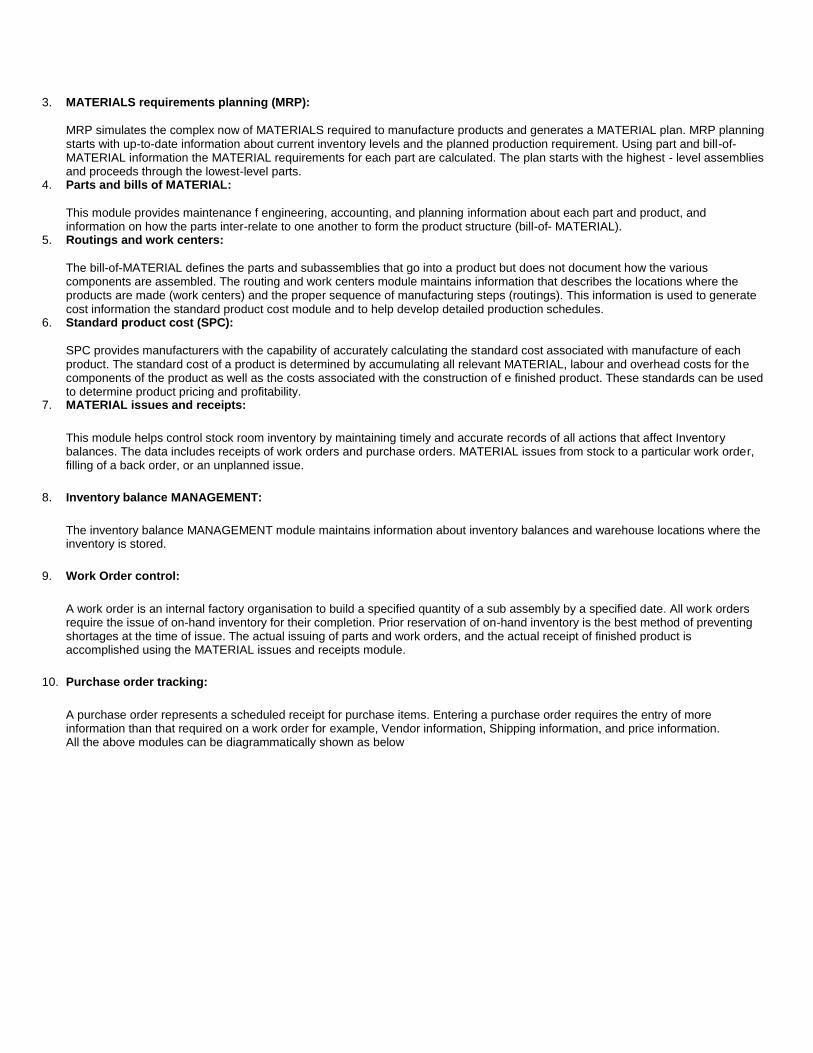
3. MATERIALS requirements planning (MRP):
MRP simulates the complex now of MATERIALS required to manufacture products and generates a MATERIAL plan. MRP planning starts with up-to-date information about current inventory levels and the planned production requirement. Using part and bill-of-MATERIAL information the MATERIAL requirements for each part are calculated. The plan starts with the highest - level assemblies and proceeds through the lowest-level parts.
4. Parts and bills of MATERIAL:
This module provides maintenance f engineering, accounting, and planning information about each part and product, and information on how the parts inter-relate to one another to form the product structure (bill-of- MATERIAL).
5. Routings and work centers:
The bill-of-MATERIAL defines the parts and subassemblies that go into a product but does not document how the various components are assembled. The routing and work centers module maintains information that describes the locations where the products are made (work centers) and the proper sequence of manufacturing steps (routings). This information is used to generate cost information the standard product cost module and to help develop detailed production schedules.
6. Standard product cost (SPC):
SPC provides manufacturers with the capability of accurately calculating the standard cost associated with manufacture of each product. The standard cost of a product is determined by accumulating all relevant MATERIAL, labour and overhead costs for the components of the product as well as the costs associated with the construction of e finished product. These standards can be used to determine product pricing and profitability.
7. MATERIAL issues and receipts:
This module helps control stock room inventory by maintaining timely and accurate records of all actions that affect Inventory balances. The data includes receipts of work orders and purchase orders. MATERIAL issues from stock to a particular work order, filling of a back order, or an unplanned issue.
8. Inventory balance MANAGEMENT:
The inventory balance MANAGEMENT module maintains information about inventory balances and warehouse locations where the inventory is stored.
9. Work Order control:
A work order is an internal factory organisation to build a specified quantity of a sub assembly by a specified date. All work orders require the issue of on-hand inventory for their completion. Prior reservation of on-hand inventory is the best method of preventing shortages at the time of issue. The actual issuing of parts and work orders, and the actual receipt of finished product is accomplished using the MATERIAL issues and receipts module.
10. Purchase order tracking:
A purchase order represents a scheduled receipt for purchase items. Entering a purchase order requires the entry of more information than that required on a work order for example, Vendor information, Shipping information, and price information. All the above modules can be diagrammatically shown as below
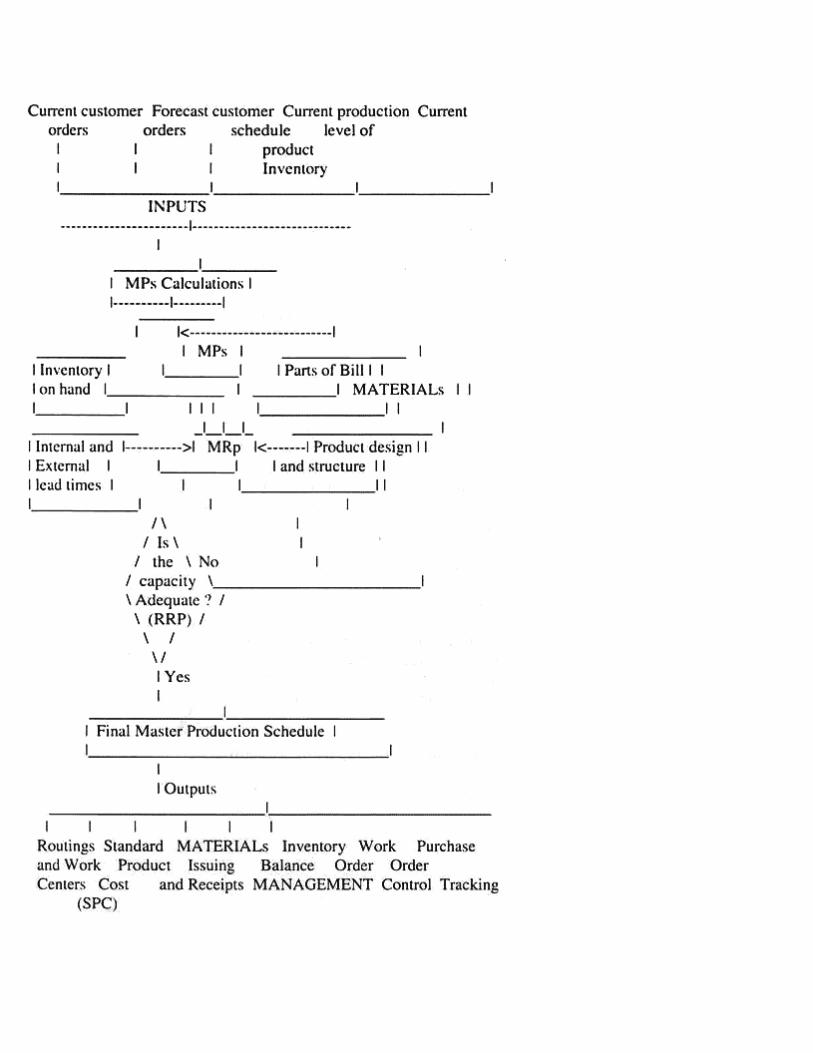
REVIEW QUESTIONS :-
Q.1 Highlight the Importance and Role of MATERIAL MANAGEMENT.
Q.2 (a) Define the term Inventory Control.
(b) State the basic two questions involved in any Inventory Control System.
(c) Differentiate between P and Q types of Inventory Control System.
Q.3 What are Major Inventory related Costs?
Q.4 Discuss Inventory Model under Certainty.
Q.5 Discuss Production Lot Size Model where
p -Production Rate and
d -Demand Rate
Q.6 Discuss briefly ‘ USE OF COMPUTERS IN MATERIALS MANAGEMENT'.
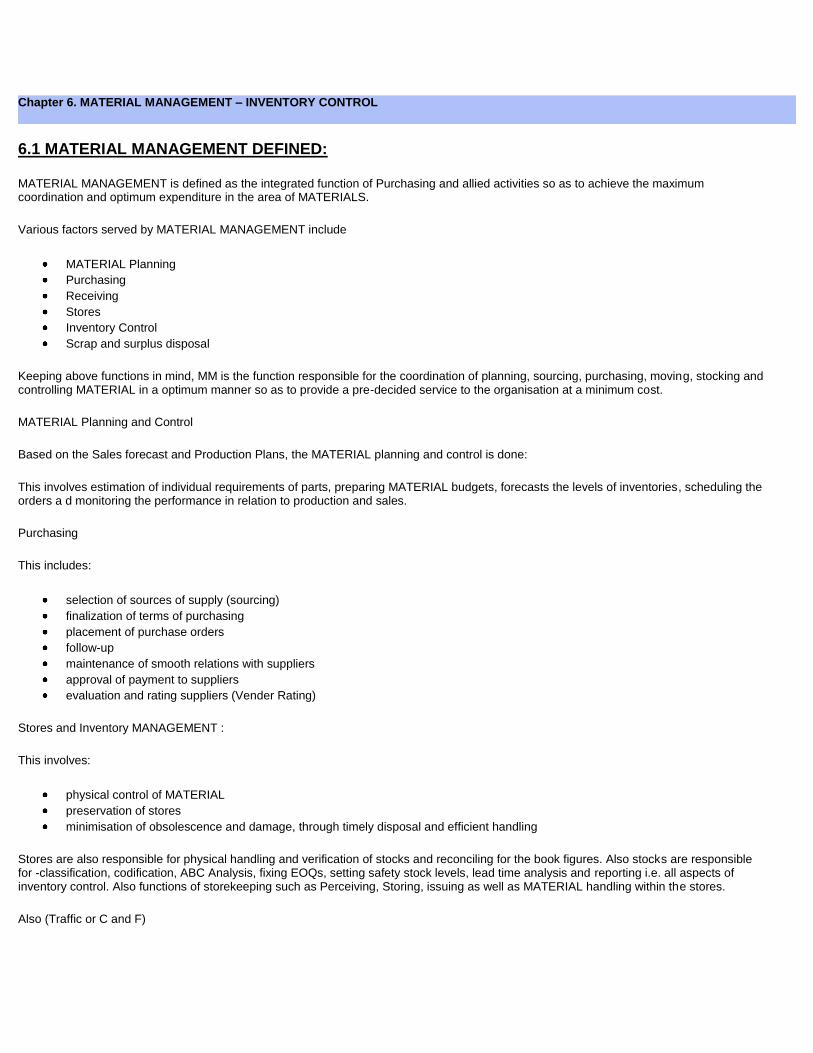
Chapter 6. MATERIAL MANAGEMENT – INVENTORY CONTROL
6.1 MATERIAL MANAGEMENT DEFINED:
MATERIAL MANAGEMENT is defined as the integrated function of Purchasing and allied activities so as to achieve the maximum coordination and optimum expenditure in the area of MATERIALS.
Various factors served by MATERIAL MANAGEMENT include
MATERIAL Planning
Purchasing
Receiving
Stores
Inventory Control
Scrap and surplus disposal
Keeping above functions in mind, MM is the function responsible for the coordination of planning, sourcing, purchasing, moving, stocking and controlling MATERIAL in a optimum manner so as to provide a pre-decided service to the organisation at a minimum cost.
MATERIAL Planning and Control
Based on the Sales forecast and Production Plans, the MATERIAL planning and control is done:
This involves estimation of individual requirements of parts, preparing MATERIAL budgets, forecasts the levels of inventories, scheduling the orders a d monitoring the performance in relation to production and sales.
Purchasing
This includes:
selection of sources of supply (sourcing)
finalization of terms of purchasing
placement of purchase orders
follow-up
maintenance of smooth relations with suppliers
approval of payment to suppliers
evaluation and rating suppliers (Vender Rating)
Stores and Inventory MANAGEMENT :
This involves:
physical control of MATERIAL
preservation of stores
minimisation of obsolescence and damage, through timely disposal and efficient handling
Stores are also responsible for physical handling and verification of stocks and reconciling for the book figures. Also stocks are responsible for -classification, codification, ABC Analysis, fixing EOQs, setting safety stock levels, lead time analysis and reporting i.e. all aspects of inventory control. Also functions of storekeeping such as Perceiving, Storing, issuing as well as MATERIAL handling within the stores.
Also (Traffic or C and F)
Clearing incoming MATERIALs (both inland and foreign) Dispatching finished goods.
Advantages of Material Management can be explained by the following three aspects:
The modern concepts of Material Management are the keys to the cost reduction and profitability.
This can be explained well with the following:
Supply Chain Management
Logistic Management
Integrated Material Management.
(i) Supply Chain Management:
Supply management is a process responsible for the development and management of a firm's total supply system -both the internal and the external components. At an operational level, it includes and expands the activities of the purchasing function and the procurement process. Its major focus; however is strategic. This is reflected in the activities added to the scope of its responsibilities all of which have two characteristics:-
3. They deal with activities that have great potential for impacting the success of the firm. 4. They tend to be interdisciplinary in nature and integrate supply actions with those of other key players in the firm :-
Specific activities generally included in supply management are :-
9. Early purchasing involvement (EPI) and early supplier involvement (ESI) in product design and subsequent specification development for important items, typically through the use of cross-functional teams.
10. Conduct of all purchasing function and procurement process activities. 11. Heavy use of cross -functional teams in supplier qualification and selection. 12. Heavy use of purchasing partnering arrangements and strategic alliances with supplier -to develop close and mutually beneficial
linkage with key suppliers in the value chain and to control quality and costs. 13. Continuous identification of treats and opportunities in a firm's supply environment. 14. Development of strategic, long- term acquisition plans for all major materials. 15. The monitoring of continuous improvement in the supply chains. 16. Active participation in the corporate strategic planning process.
Fig 1 The Supply Chain (Network) Exploded.
(ii) LOGISTIC MANAGEMENT:
Logistic management is managing the things keeping in mind all the scenarios and thinking logistically regarding each and every step which is involved.
The practical problems should be highlighted first and the solutions should be given to them. Also the effect of one process over the other and their causes and effects should be studied. e.g. in case of processing through transportation: all the routes should be studied well from where the transport will pass. The mode of transportation should be decided keeping in mind the most cost and time effective manner. For taking these kinds of decisions manager should be aware of all the different alternatives which could be used and then take out the most cost effective decision.
(iii) INTEGRATED MATERIAL MANAGEMENT:
The importance of materials management lies in its capacity to reduce the material cost. It has scope and the material manager can devise ways and means to administer saving in material cost. To meet this aspect, the management is functionally divided into three broad

segments of management. These are:-
4. Arranging for finance: Making provisions for the operation of the enterprise for which the management has to make all efforts to arrange for adequate finance so that the organisation may run smoothly without any interruption.
5. Assembly, acquisition, storage land production of material : It is the function of actual operation of the enterprise. For an efficient and purposeful operation of the enterprise materials are to be assembled, acquired, stored and produced so that the organisation may move ahead uninterrupted with speed and goodwill.
6. Distribution: The organisation operates for the ultimate consumer. It is the basic function of any management to arrange the distribution so as to get the goods and services reach the ultimate consumer .Material management integrates and coordinates the functions of management to ensure success of an enterprise. Every manufacturing concern is engaged in budgeting, purchasing and procuring, receiving, production scheduling, producing, maintaining, controlling the inventory, controlling the quality, standardising and also storing and warehousing, distributing and transporting. Materials management is required to plan, organise, staff, direct, control and coordinate its own efforts in the light of the predetermined objectives of the entire organisation.
Advantages in Integrated MANAGEMENT Concept
6. Better Accountability 7. Better coordination 8. Better Performance 9. Adaptability to EDP 10. Miscellaneous Advantages
Miscellaneous Advantages:
Under a central MM, a team spirit is inculcated. This results in better morale and cooperation. The opportunity for growth and development arc better and an individual is not confined to one function alone but gets exposed to broader aspects of MATERIAL function.
What are 5 Rights?
Right Quality Right Quantity Right Price Right Sources at Right Time (Timed supply)
Integrated Approach
All Departments must work for the one corporate goal --> growth of the company.
a true, correct and timely exchange of information between the various departments will lead to integrated approach and aimed inter-departmental conflicts.
The user Department's responsibility is to requisite right Quality/Specifications of the MATERIALS needed by it is not the final/ultimate authority to decide which MATERIAL is adequate or not.
6.2 INVENTORY CONTROL:
Inventory is the stock of items or resources required in an organisation for running production smoothly. Inventory is necessary because of the following reasons:
6. To meet customers requirement. 7. Smooth functioning of product on process. 8. Uncertainty due to irregular de and supply. 9. Economics of scale. 10. Best utilization of equipment and resources.
There are two basic questions required to be answered in any Inventory Control System. They are
3. When to Order?
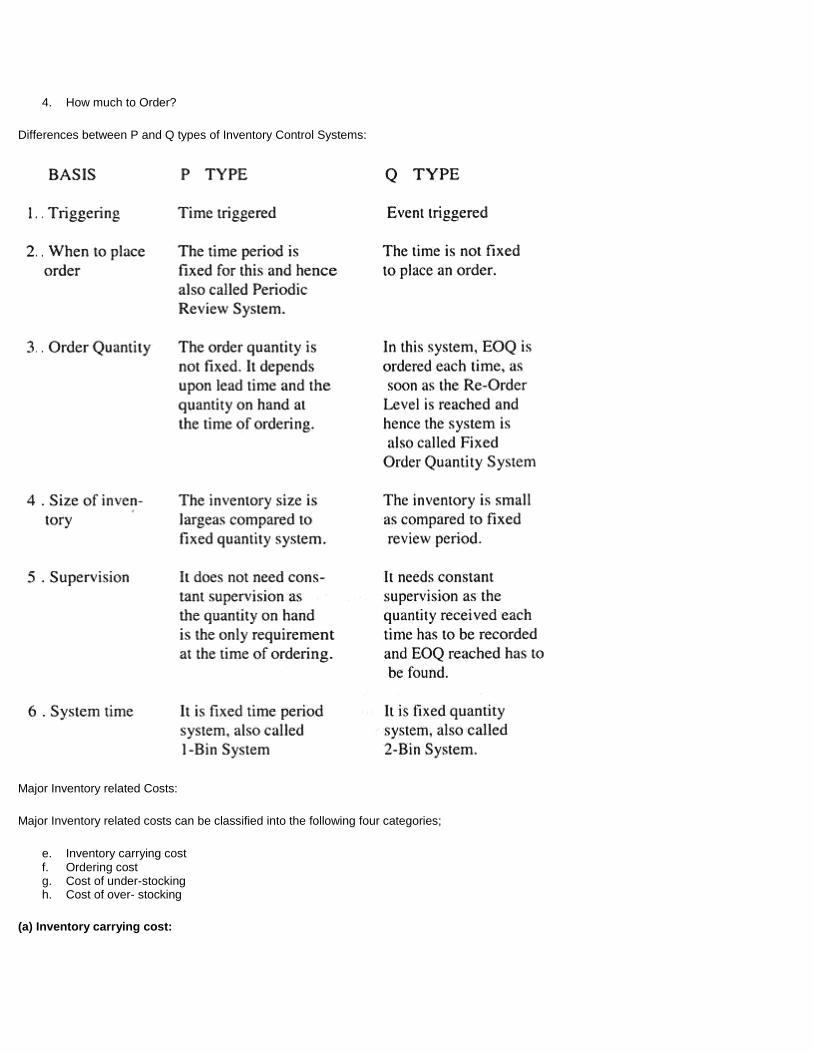
4. How much to Order?
Differences between P and Q types of Inventory Control Systems:
Major Inventory related Costs:
Major Inventory related costs can be classified into the following four categories;
e. Inventory carrying cost f. Ordering cost g. Cost of under-stocking h. Cost of over- stocking
(a) Inventory carrying cost:
Carrying inventory costs money. This is the cost a company has to incur for maintaining stocks to run the works smoothly. It involves the following costs:
vi. Blocking working capital- such as Interest on Capital and Depreciation etc. vii. Occupying Space, thereby incurring Warehouse rent and cost of facilities like bins, racks etc. viii. Increasing risks of spoilage, obsolescence, theft, leakage etc. ix. Salary of stores staff etc. x. Insurance premium.
Thus cost is measured in terms of Per unit/per year or as a % of the inventory value.
The Inventory carrying cost varies and is generally taken as 25 %.
(b) Ordering cost:
Every time an order is placed for replenishment, certain costs are involved.
The ordering cost involves paper work expenses, follow-up cost, cost of transporting the MATERIAL and its receipt and inspection every time the MATERIAL is procured. The average ordering cost is Rs.100 in India .
(c) Under stocking cost:
This cost Ku, is the cost incurred when an item is out of stock. It includes the cost of lost production during the period of stock out and the extra cost per unit, which might have to be paid for an Emergency Purchase.
(d) Over stocking cost:
This cost Ko, is the inventory carrying cost (which is calculated per year) for a specific period of time. Based on above costs several scientific inventory models have been developed.
6.3 INVENTORY MODEL UNDER CERTAINITY:
In case of Inventory Model under Certainty
Demand is certain and hence constant
Supply is timely and hence no overstocking or under stocking
Thus the only two costs relevant in this case are:
X Cost of inventory carrying
X Cost of Ordering
(Ref: Fig.12.6 at page 389 of your text)
Depending on quantity to be ordered for purchase, the inventory carrying cost increases with increase in purchase quantity whereas the ordering cost decreases as the number of orders to be placed decreases. Thus Ordering costs and inventory carrying costs oppose each other. This indicates that there exists a point at which the total inventory carrying cost is Minimum.
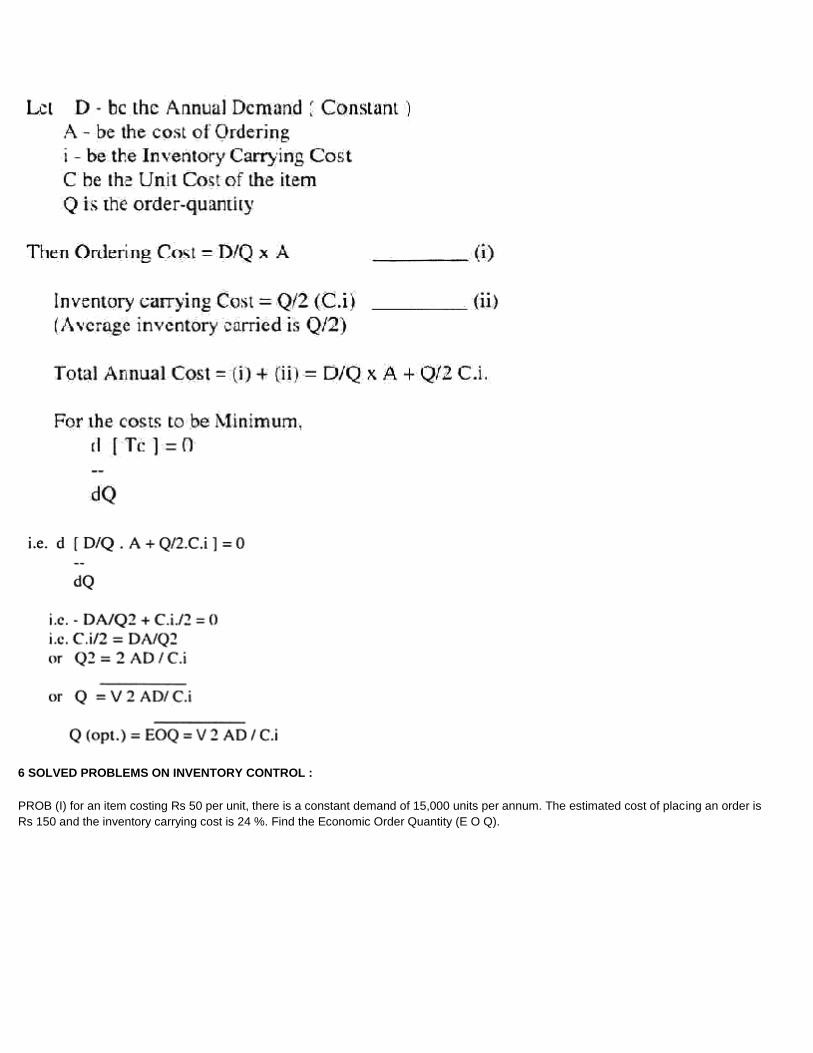
6 SOLVED PROBLEMS ON INVENTORY CONTROL :
PROB (I) for an item costing Rs 50 per unit, there is a constant demand of 15,000 units per annum. The estimated cost of placing an order is
Rs 150 and the inventory carrying cost is 24 %. Find the Economic Order Quantity (E O Q).

PROB 1(b): For the above given data, the supplier offers 5% discount if the order quantity is made double of the E O Q. Should he accept the discount offer or not?
Find TC = D x C + Y2 Qci + D/Q A TC 1 = DC 1 + + 1/2 Q 1 C 1 i + D/Q 1 A Accept Discount if TC 1 < TC .Ans
Prob.2: For the data given below
d = 60 units per year Q = 15 units per order L = 1 month or 1/12 of a year r = 9 units (here r = re-order level)
The demand during lead time is Poisson distribution. Find the number of stock outs per year.
Sol: Number of orders per year = D / Q
=60/15=4
Average demand in lead time = 60 x 1/12 = 5 units
Hence, from Poisson's table,
probability of stock out = 1 -P(9)
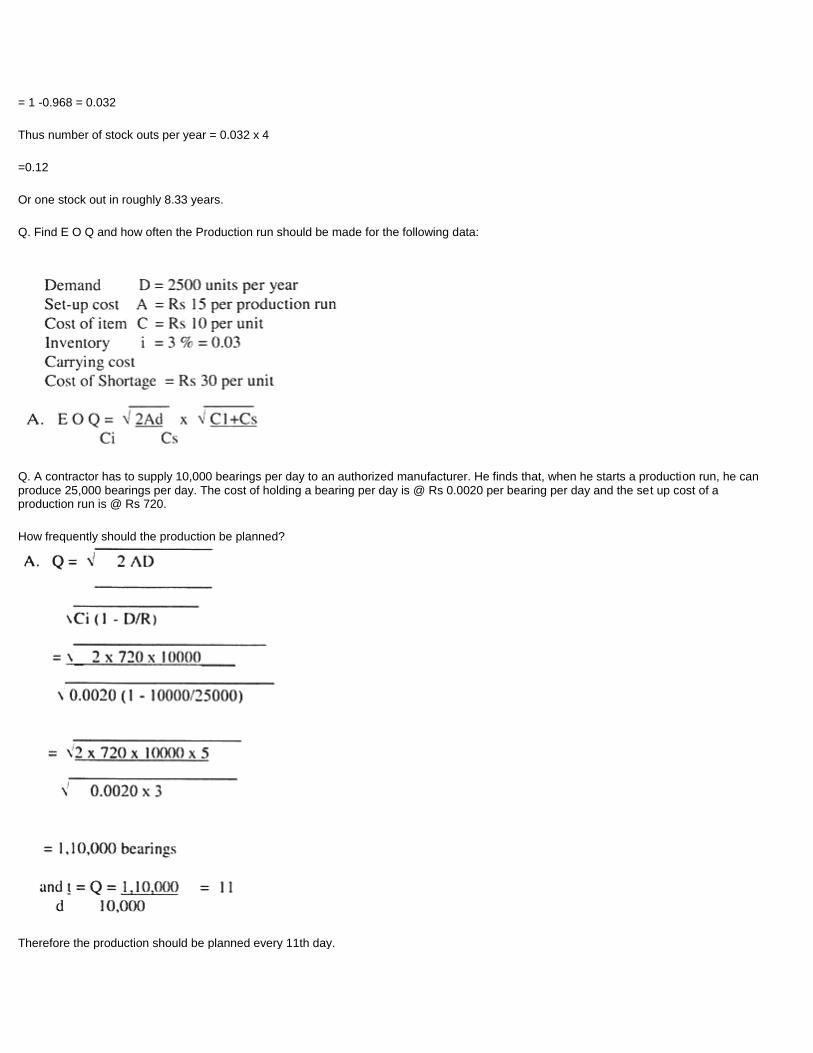
= 1 -0.968 = 0.032
Thus number of stock outs per year = 0.032 x 4
=0.12
Or one stock out in roughly 8.33 years.
Q. Find E O Q and how often the Production run should be made for the following data:
Q. A contractor has to supply 10,000 bearings per day to an authorized manufacturer. He finds that, when he starts a production run, he can produce 25,000 bearings per day. The cost of holding a bearing per day is @ Rs 0.0020 per bearing per day and the set up cost of a production run is @ Rs 720.
How frequently should the production be planned?
Therefore the production should be planned every 11th day.

------------------------------------------------------------------------------------------------------------------------------------------------------------------------------------------- TRY YOURSELF :
Q. A manufacturer receives an order for 6890 items to be delivered over a period of one year, as follows:
At end of Week 1: 5 items
At end of Week 2: 10 items
At end of Week 3: 15 items
and so on.
The cost of carrying inventory is Rs 2.60 per item per year and the cost of a set up is Rs 450 per production run.
(a) Compute the cost for the following policies:
v. Make all 6890 at start of the year. vi. Make 3445 now and 3445 in 6 months. vii. Make half of the order each month. viii. Make 1/52 th of the order each week.
ANSWERS:
v. Rs 1200 vi. Rs 8000 vii. Rs 9000 viii. Rs 27000
(b) Attempt to devise a more rational policy.
-------------------------------------------------------------------------------------------------------------------------------------------------------------------------------------------
6.4 USE OF COMPUTERS IN MATERIALS MANAGEMENT:
MATERIALS MANAGEMENT is an interactive MATERIALS requirement planning and control system. The object of the system is to make it easier to deal with the complexities of operating a manufacturing company by taking into account various aspects of information flow and MANAGEMENT. It is primarily designed for manufacturers who build standard product to stock in discrete manufacturing steps (Fabricators and Assemblers). These companies have a significant investment in inventory, and the system can help them balance their inventory levels with customer demands for timely shipments. MATERIALs MANAGEMENT System consist of ten major modules:
11. Master production scheduling (MPS):
This is a MANAGEMENT planning and production scheduling tool. It is used by the master scheduler to generate a production schedule for the plant's marketable products. Input to the module includes current customer orders, forecast customer orders, the current production schedule, and the current level of product inventory. The output of the MPS calculations is called the master production schedule. This schedule contains suggested manufacturing orders including quantities and starting dates. The schedule is then input to the MATERIALs requirement planning (MRP) module the plan to manufacture and purchase of the required component parts.
12. Rough-cut resource planning (RRP):
This is a MANAGEMENT tool used by a master scheduler to help produce a realistic master schedule by comparing the resources needed to implement the master schedule with the available critical resources. The example of critical resources are labour hours, floor space, investment in work- in-process inventory, and MATERIALS supply. The (RRP) reports highlight the capacity constraints and help the user resolve competing demands for critical resources.

13. MATERIALS requirements planning (MRP):
MRP simulates the complex now of MATERIALS required to manufacture products and generates a MATERIAL plan. MRP planning starts with up-to-date information about current inventory levels and the planned production requirement. Using part and bill-of-MATERIAL information the MATERIAL requirements for each part are calculated. The plan starts with the highest - level assemblies and proceeds through the lowest-level parts.
14. Parts and bills of MATERIAL:
This module provides maintenance f engineering, accounting, and planning information about each part and product, and information on how the parts inter-relate to one another to form the product structure (bill-of- MATERIAL).
15. Routings and work centers:
The bill-of-MATERIAL defines the parts and subassemblies that go into a product but does not document how the various components are assembled. The routing and work centers module maintains information that describes the locations where the products are made (work centers) and the proper sequence of manufacturing steps (routings). This information is used to generate cost information the standard product cost module and to help develop detailed production schedules.
16. Standard product cost (SPC):
SPC provides manufacturers with the capability of accurately calculating the standard cost associated with manufacture of each product. The standard cost of a product is determined by accumulating all relevant MATERIAL, labour and overhead costs for the components of the product as well as the costs associated with the construction of e finished product. These standards can be used to determine product pricing and profitability.
17. MATERIAL issues and receipts:
This module helps control stock room inventory by maintaining timely and accurate records of all actions that affect Inventory balances. The data includes receipts of work orders and purchase orders. MATERIAL issues from stock to a particular work order, filling of a back order, or an unplanned issue.
18. Inventory balance MANAGEMENT:
The inventory balance MANAGEMENT module maintains information about inventory balances and warehouse locations where the inventory is stored.
19. Work Order control:
A work order is an internal factory organisation to build a specified quantity of a sub assembly by a specified date. All work orders require the issue of on-hand inventory for their completion. Prior reservation of on-hand inventory is the best method of preventing shortages at the time of issue. The actual issuing of parts and work orders, and the actual receipt of finished product is accomplished using the MATERIAL issues and receipts module.
20. Purchase order tracking:
A purchase order represents a scheduled receipt for purchase items. Entering a purchase order requires the entry of more information than that required on a work order for example, Vendor information, Shipping information, and price information. All the above modules can be diagrammatically shown as below


REVIEW QUESTIONS :-
Q.1 Highlight the Importance and Role of MATERIAL MANAGEMENT.
Q.2 (a) Define the term Inventory Control.
(b) State the basic two questions involved in any Inventory Control System.
(c) Differentiate between P and Q types of Inventory Control System.
Q.3 What are Major Inventory related Costs?
Q.4 Discuss Inventory Model under Certainty.
Q.5 Discuss Production Lot Size Model where
p -Production Rate and
d -Demand Rate
Q.6 Discuss briefly ‘ USE OF COMPUTERS IN MATERIALS MANAGEMENT'.
Chapter 8. INDUSTRIAL ENGINEERING: JOB DESlGN & WORK - MEASUREMENT
8.1 Industrial Engineering:
Industrial Engineering field has continued to expand since the end of the 11th century when the development of scientific management concept started: Originally concerned mainly with Time Study, Method Improvement, Motion Study, Design and Administration of Payment System, today Industrial Engineering activities have progressed in many ways: Development of new statistical and management tools, electronic computers and increased application of industrial engineering to areas outside the engineering activities together with the changes that have taken place in size of organisation and production technology has completely modified the past concepts: Mathematical and statistical programming, inventory models, computer applications, simulation, forecasting, system designs, PERT and applications of various other new techniques are now becoming routine area of working of Industrial Engineers: Today Industrial Engineering is concerned with the design, improvement and installation of integrated system of men, materials and equipment: It draws upon the specialised knowledge and skill in the mathematical, Physical and Social Science, together with the principles and methods of Engineering Analysis and Design to specify, predict and evaluate the results to be obtained from such systems: Work Study is considered as synonymous to Industrial Engineering. Industrial engineering started in India about the year 1136 when a consulting firm named Eastern Bedaux was established as a branch of Bedaux International, USA : In the early days the industrial engineering job was generally entrusted to consulting firms and its application was limited mainly to manufacturing spheres: Since then the functional applications have been largely diversified and expanded covering industries, Govt: organisations, Railways, Airlines, Shipping, Defence organisations and it is now, in fact, difficult to identify any major activity to which Industrial Engineering is not applied to some degree. The concept of productivity is of fundamental importance in understanding the objective functions of Industrial Engineering: It must be understood that productivity is not the same as production: To be able to produce something or to provide any service, some resources in the form of men, materials, machinery, energy, land and capital are always necessary: Productivity is the relationship between the output, which is the products and services created, and the input that is the resources of power, men ,equipment, materials etc: utilised for the same output: The cumulative productivity for all sectors of economy -Agriculture, Industry, Transport. Communications, Administration -constitutes the national productivity:
Production can be increased without the consideration of the cost» whereas, for increasing productivity the production is no doubt required to be maximised but at the same time the cost aspect optimisation of production has to take place at minimum cost:
8.2 WORK MEASUREMENT: It is the application of techniques designed to establish the work content of a specified task, by determining the time required for carrying it out at a defined standard of performance by a qualified worker:
Stated in simple words “ Work Measurement” is a technique to find out the time required by a normal worker to do a job at a normal efficiency".
Two Principal techniques of Work Measurement are:
(1) Activity sampling (2) Time study
Others being: Production study, Analytical Estimating & Predetermined Motion Time Standard (PMTS)
ACTIVITY SAMPLING:
This consists of a series of instantaneous random observations of defined activities and delays: The major advantage f this technique is that it can be applied simultaneously to a number of equipments: The percentage of observations s recorded for a particular activity or delay is a measure 0 the percentage of time during which that activity or delay occurs.
TIME STUDY:
Time Study is a technique for determining as accurately as possible, from a limited number of observations the time necessary to carry out a given activity at defined standard of performance.
The necessary things for taking a time-study are –
Stop Watch
Study Board and Time Study forms
Slide rule and Measuring instruments for distances and speed etc.
Stop Watch time study is the basic technique for determining accurate time standards: They are economical for repetive types of work but can be used for long cycles & non- repetitive work also: Continuous Method or snap back method of stop watch can be employed for time measurement.
In continuous timing: The stop watch is started at the beginning of the cycle and stopped at the end of the cycle, observing the readings of stop watch at the start of each new element: The time of individual element can be found by subtracting two successive elements.
Steps in taking a time study:
The basic steps taken in carrying out time study are as under:
Select - The job to be studied
Record - All the relevant data, regarding the job, method of work (breaking the job in identifiable elements, Layout working conditions etc.
Measure - each element in terms of time over a sufficient number of the cycles of the activity to ensure a representative element time.
Examine -The recorded data &the element times critically to ensure that unproductive or random elements are separated out from productive elements.
RATING
The operator's effective speed of work relative to the observer's concept of 'normal' pace or speed is called RATING and it is denoted by a numerical value.
Normal Rating corresponds to the average rate at which qualified workers will naturally work at a job provided they know and adhere to the specified methods and work under capable supervision but without the stimulus of any financial incentive.
Rating Norm:
The normal pace of a person is said to be "100" when he walks at a rate of 3 Miles (approx: 5 km.) per hour.
Or
When a person deals a pack of 52 cards in 0.5 minute, at the four corners of a square of one foot side: Left hand holds the pack and helps to pick up one card at a time and the right hand deals.
Factors affecting performance
Variations on actual times of a specific element may be due to certain factors beyond or within the control of the workers.
Beyond the control of the workers
1. Variations in the quality of materials used within the prescribed tolerance limits. 2. Changes in the operating efficiency of the tools and equipment within their usual life. 3. Minor changes in the method or conditions of operating performance of certain of the elements. 4. Changes in the surrounding conditions of light, temperature, humidity etc.
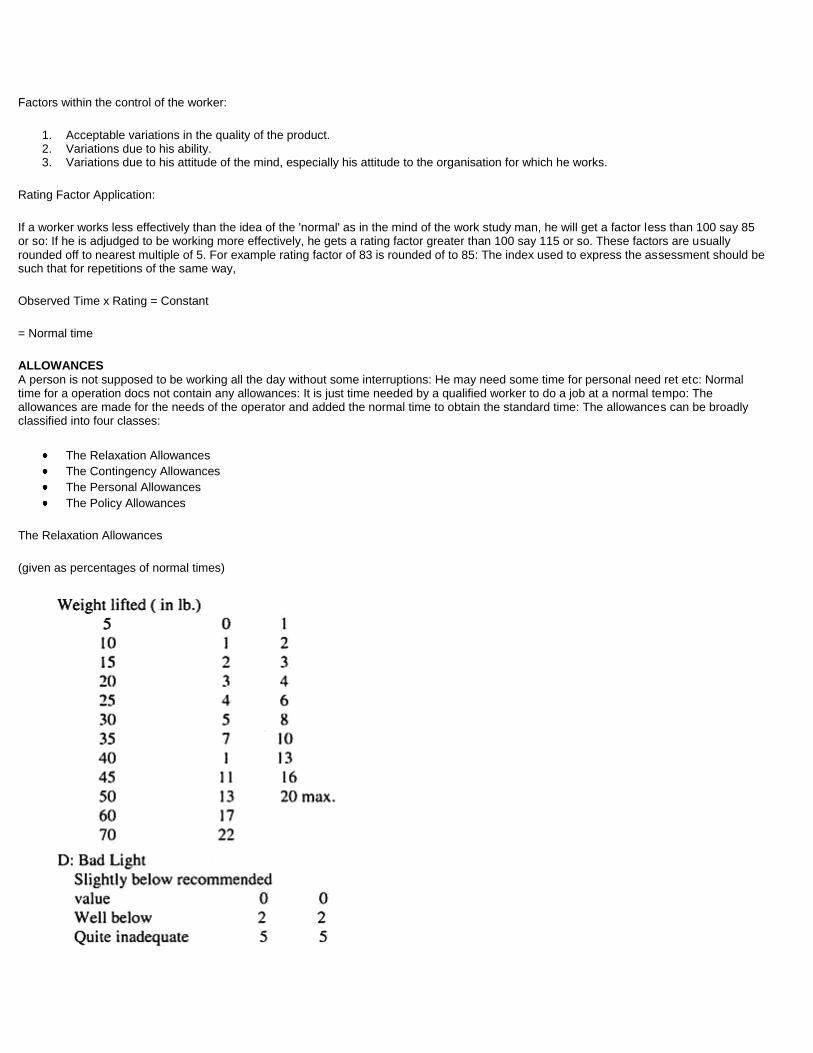
Factors within the control of the worker:
1. Acceptable variations in the quality of the product. 2. Variations due to his ability. 3. Variations due to his attitude of the mind, especially his attitude to the organisation for which he works.
Rating Factor Application:
If a worker works less effectively than the idea of the 'normal' as in the mind of the work study man, he will get a factor less than 100 say 85 or so: If he is adjudged to be working more effectively, he gets a rating factor greater than 100 say 115 or so. These factors are usually rounded off to nearest multiple of 5. For example rating factor of 83 is rounded of to 85: The index used to express the assessment should be such that for repetitions of the same way,
Observed Time x Rating = Constant
= Normal time
ALLOWANCES
A person is not supposed to be working all the day without some interruptions: He may need some time for personal need ret etc: Normal time for a operation docs not contain any allowances: It is just time needed by a qualified worker to do a job at a normal tempo: The allowances are made for the needs of the operator and added the normal time to obtain the standard time: The allowances can be broadly classified into four classes:
The Relaxation Allowances
The Contingency Allowances
The Personal Allowances
The Policy Allowances
The Relaxation Allowances
(given as percentages of normal times)
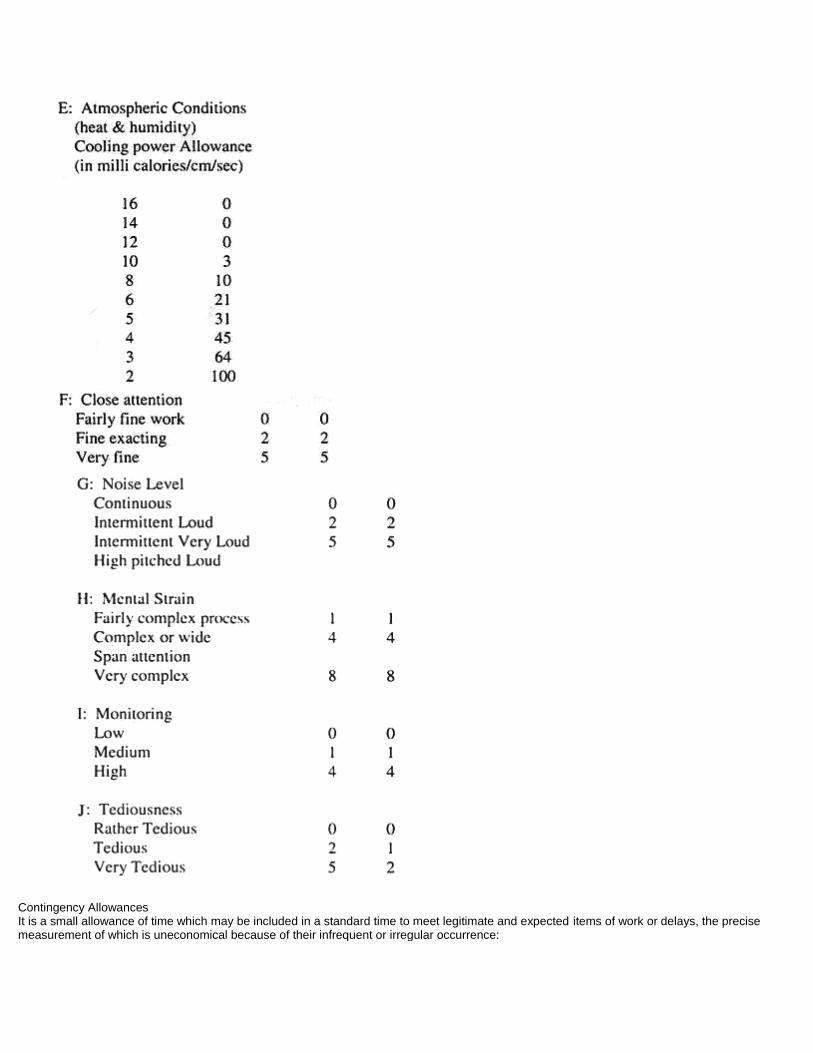
Contingency Allowances It is a small allowance of time which may be included in a standard time to meet legitimate and expected items of work or delays, the precise measurement of which is uneconomical because of their infrequent or irregular occurrence:
Contingency allowances should not be greater than 5 %.
Personal Allowance: This is the allowance given to an operator for his personal needs and is generally less than 5 %: This depends upon the type of work - light or heavy, particularly in hot humid atmosphere: (This is normally the constant allowance in Relaxation allowances)
Policy Allowances: Sometimes certain policy allowances are also given in certain companies to meet certain contingencies outside the work place etc.
Standard Work or Work Unit: It is the unit of measurement of output of work: It represents the output of work in one minute of the allowed time for any operation.
Standard minute = Work = Rest
USE OF WORK MEASUREMENT
The time standards developed from the various techniques of Work Measurement can be for the following:
1. Production Scheduling 2. Estimates for tenders, selling prices, and delivery promises. 3. Balance Work Load at different stage. 4. Reveals unproductive operations and idle time of equipment 5. Basis for a sound INCENTIVE SCHEME. 6. Comparison of the efficiency of alternate methods.
8.3 METHOD STUDY:
METHOD STUDY DEFINED:
Method study, according to British standards Institutions (Bs 3138) is defined as:
"Method study is the systematic recording & critical examination of existing ways of doing work and proposing new ways as a means of developing and applying easier and more effective methods thereby reducing costs.
BASIC PROCEDURE:
Method study is an organised approach: The basic technique rests on the following six(6) steps:
1. SELECTION: Select the work to be analysed: The kinds of priorities could be: Economic Consideration, Technical consideration & Human consideration.
2. RECORD: Record the existing method using the charting symbols: The symbols used are:
...Operation
...Inspection
...Operation & Inspection together
...Transport
...Delay
...Storage
3. CRITICAL EXAMINATION:
Examine the facts of existing process critically but impartially so as to have easier & effective ways of doing work:
The step includes "My Six Servants: - What, Why, How, When, Where & Who.
i. What is the job to be studied & analysed ? (Definition) ii. Why it is being done? (Purpose) iii. How it is being done? (Ways & Means of doing the job) iv. When it is being done? (Sequence of the process) v. Where it is being done? (Place) vi. Who is doing it? (Person- whether the job is being done by the right person)
4. DEVELOP: Develop the alterations, though critical examination and choose the most effective, efficient & economical method as the proposed method: All aspects like change of technology, elimination of operations, change of layout or any other suggestions should be developed fully before Installation of the new method.
5. INSTALLA TION:
Installation (or implementation) of the proposed method involve preparation of recommendations, making oral preparation to top management & securing approval of the decision maker, assisting the line management (production deptt.) during implementation & training of workmen getting new standards /target set for the proposed way of doing the job/ operations.
6. MAINTENANCE (To maintain):
'Maintenance' phase is the follow up phase after implementation and could be termed as Monitoring & Controlling' mechanism after the Planning Phase: It helps in checking up proposed ways of working and carrying out changes/ modifications, if any, so that the proposed way of working is really easier & more effective & economical than the existing one.
8.4 Work Study leads to Higher Productivity:
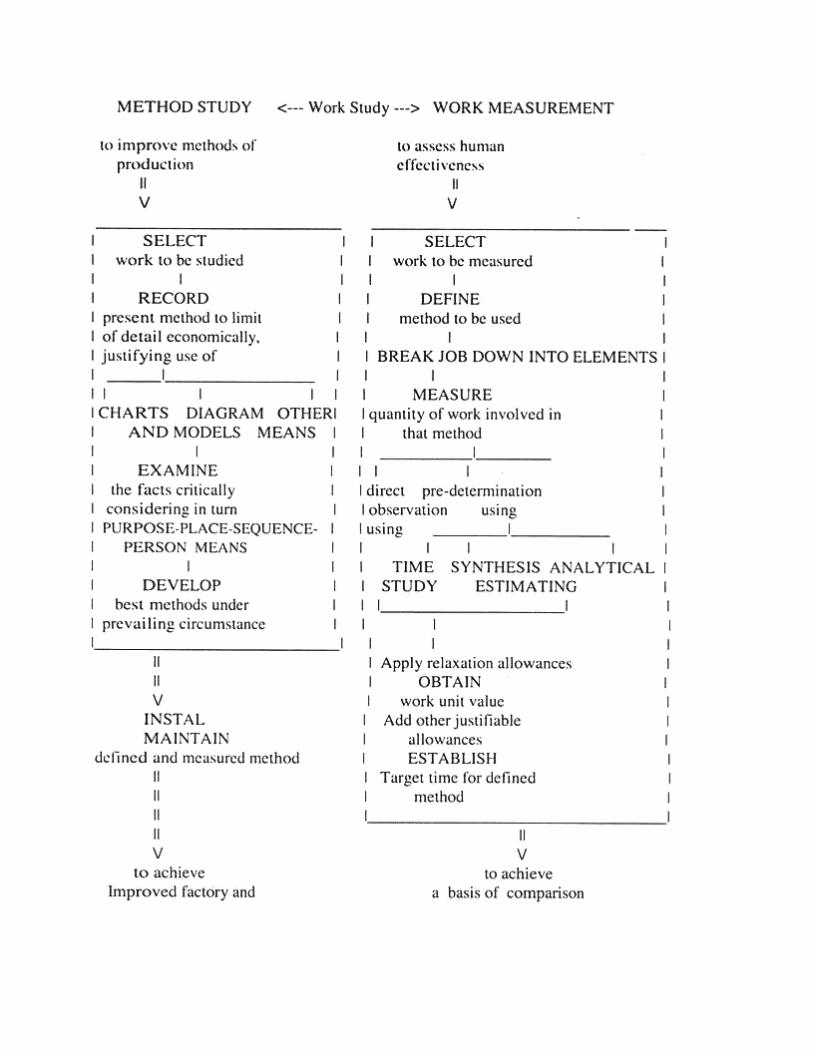
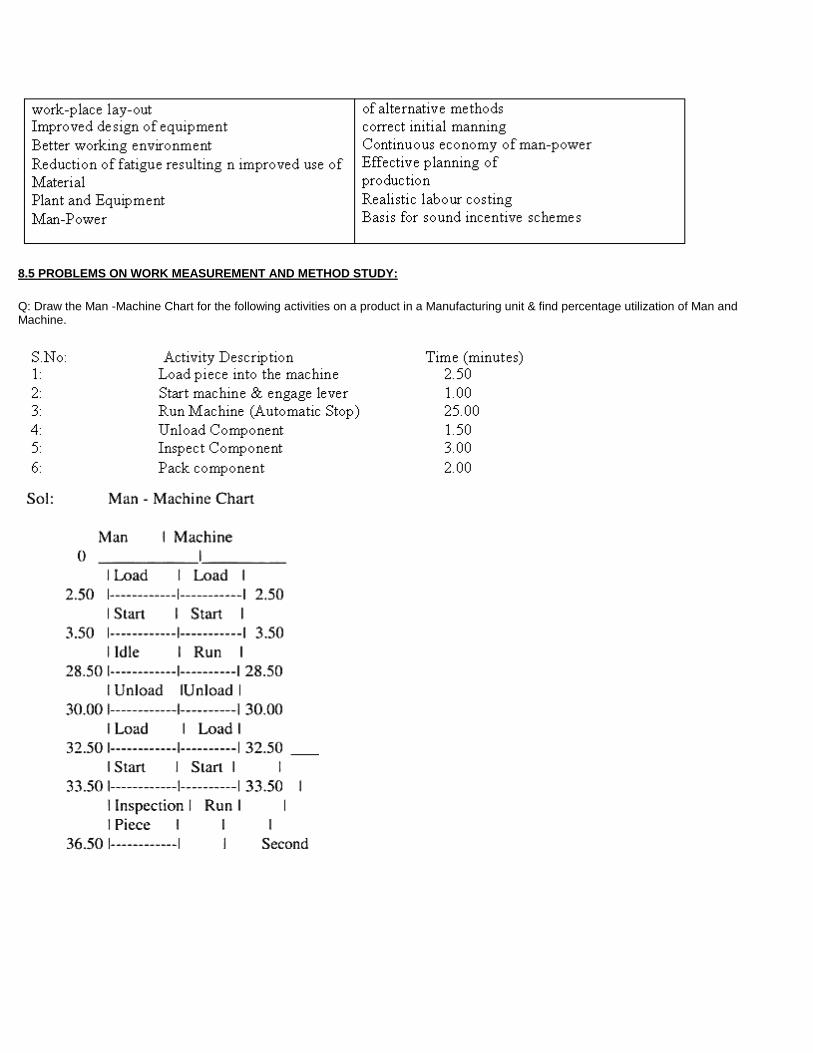
8.5 PROBLEMS ON WORK MEASUREMENT AND METHOD STUDY:
Q: Draw the Man -Machine Chart for the following activities on a product in a Manufacturing unit & find percentage utilization of Man and Machine.

Cycle Time = 30.00 minutes Idle time of Machine = Nil Idle time of Man = 20 minutes % utilization of man = (30 -20) /30 x 100 = 33.33 % % utilization of machine = 30/ 30 x 100 = 100 %
Q2: If a man works on two identical machines and the activities on the machine are given below.
1. Load machine = 2.50 2. Start machine & engage lever = 1.00 3. Run Machine = 15.00 4. Inspect piece = 5.00 5. Pack piece = 3.00 6. Unload piece from machine = 1.50 7. Clean Machine = 2.50
(1) Find the % utilization of man & machine (2) If the hourly labour rate is Rs.1 0 and that of machine Rs.100,
then what is your recommendation as an Industrial Engineer to the Management?
Sol.
Q3: In an electrical industry, a group of 15 girls working 8 hours a day on an assembly line produce 600 MCBs per day: During a sampling study for the work shift it was found that 10% of the time the girls were found to be 'Working':
However, the average rate of performance was 80% for the whole group: Calculate Standard time for producing one MCB.
Assume the Relaxation plus other allowances allowed are 15%.
Sol:
To = Overall Time per MCB = (8 x 60 x 15) /600
= 12 minutes
Te = Effective Time = 12 x 0.10
= 10.80 minutes
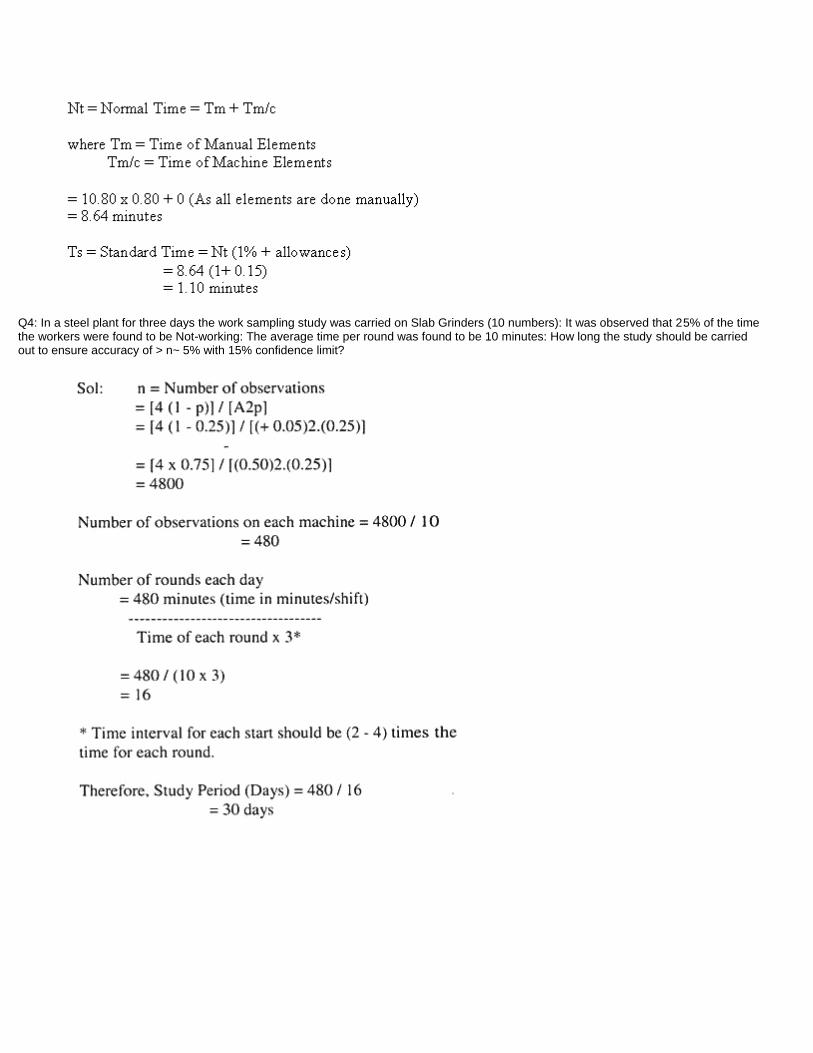
Q4: In a steel plant for three days the work sampling study was carried on Slab Grinders (10 numbers): It was observed that 25% of the time the workers were found to be Not-working: The average time per round was found to be 10 minutes: How long the study should be carried out to ensure accuracy of > n~ 5% with 15% confidence limit?
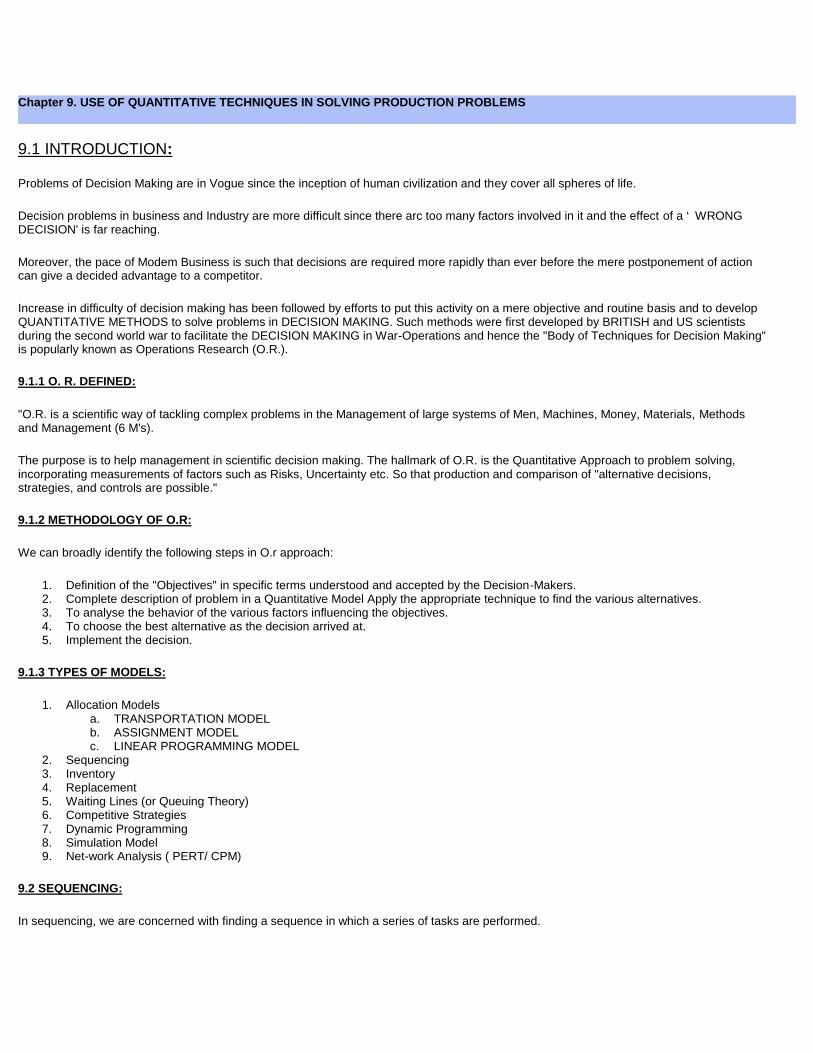
Chapter 9. USE OF QUANTITATIVE TECHNIQUES IN SOLVING PRODUCTION PROBLEMS
9.1 INTRODUCTION:
Problems of Decision Making are in Vogue since the inception of human civilization and they cover all spheres of life.
Decision problems in business and Industry are more difficult since there arc too many factors involved in it and the effect of a ‘ WRONG DECISION' is far reaching.
Moreover, the pace of Modem Business is such that decisions are required more rapidly than ever before the mere postponement of action can give a decided advantage to a competitor.
Increase in difficulty of decision making has been followed by efforts to put this activity on a mere objective and routine basis and to develop QUANTITATIVE METHODS to solve problems in DECISION MAKING. Such methods were first developed by BRITISH and US scientists during the second world war to facilitate the DECISION MAKING in War-Operations and hence the "Body of Techniques for Decision Making" is popularly known as Operations Research (O.R.).
9.1.1 O. R. DEFINED:
"O.R. is a scientific way of tackling complex problems in the Management of large systems of Men, Machines, Money, Materials, Methods and Management (6 M's).
The purpose is to help management in scientific decision making. The hallmark of O.R. is the Quantitative Approach to problem solving, incorporating measurements of factors such as Risks, Uncertainty etc. So that production and comparison of "alternative decisions, strategies, and controls are possible."
9.1.2 METHODOLOGY OF O.R:
We can broadly identify the following steps in O.r approach:
1. Definition of the "Objectives" in specific terms understood and accepted by the Decision-Makers. 2. Complete description of problem in a Quantitative Model Apply the appropriate technique to find the various alternatives. 3. To analyse the behavior of the various factors influencing the objectives. 4. To choose the best alternative as the decision arrived at. 5. Implement the decision.
9.1.3 TYPES OF MODELS:
1. Allocation Models a. TRANSPORTATION MODEL b. ASSIGNMENT MODEL c. LINEAR PROGRAMMING MODEL
2. Sequencing 3. Inventory 4. Replacement 5. Waiting Lines (or Queuing Theory) 6. Competitive Strategies 7. Dynamic Programming 8. Simulation Model 9. Net-work Analysis ( PERT/ CPM)
9.2 SEQUENCING:
In sequencing, we are concerned with finding a sequence in which a series of tasks are performed.
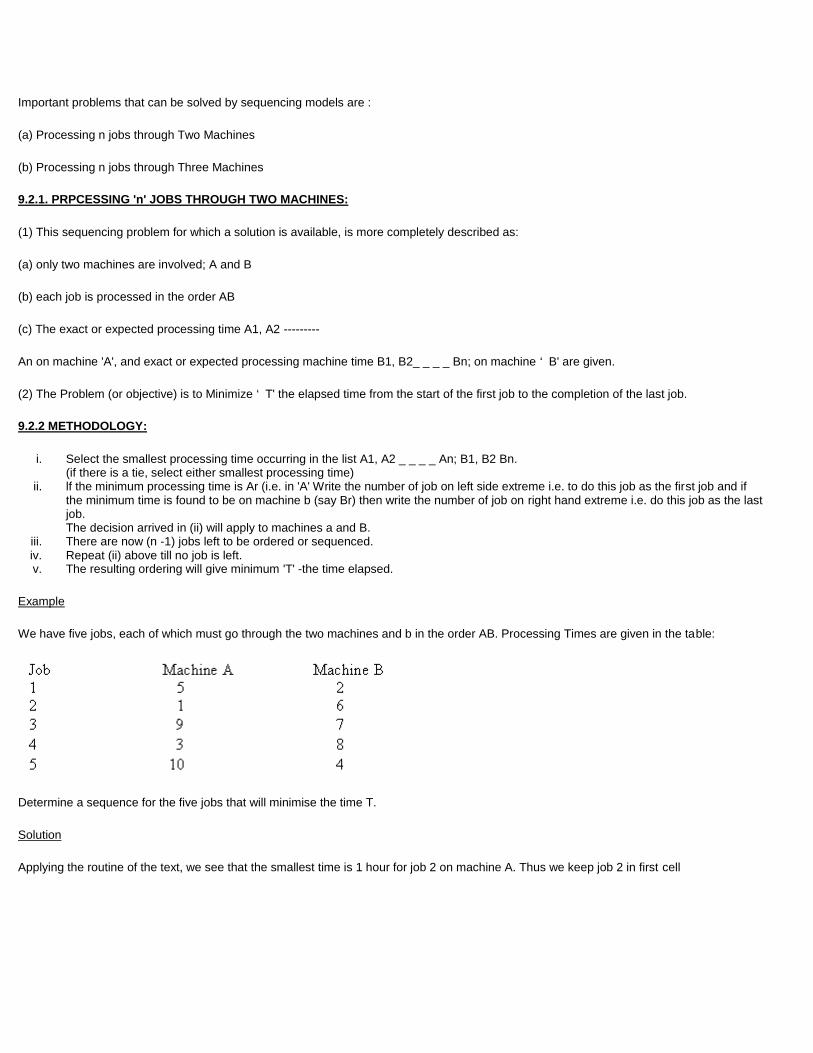
Important problems that can be solved by sequencing models are :
(a) Processing n jobs through Two Machines
(b) Processing n jobs through Three Machines
9.2.1. PRPCESSING 'n' JOBS THROUGH TWO MACHINES:
(1) This sequencing problem for which a solution is available, is more completely described as:
(a) only two machines are involved; A and B
(b) each job is processed in the order AB
(c) The exact or expected processing time A1, A2 ---------
An on machine 'A', and exact or expected processing machine time B1, B2_ _ _ _ Bn; on machine ‘ B' are given.
(2) The Problem (or objective) is to Minimize ‘ T' the elapsed time from the start of the first job to the completion of the last job.
9.2.2 METHODOLOGY:
i. Select the smallest processing time occurring in the list A1, A2 _ _ _ _ An; B1, B2 Bn. (if there is a tie, select either smallest processing time)
ii. lf the minimum processing time is Ar (i.e. in 'A' Write the number of job on left side extreme i.e. to do this job as the first job and if the minimum time is found to be on machine b (say Br) then write the number of job on right hand extreme i.e. do this job as the last job. The decision arrived in (ii) will apply to machines a and B.
iii. There are now (n -1) jobs left to be ordered or sequenced. iv. Repeat (ii) above till no job is left. v. The resulting ordering will give minimum 'T' -the time elapsed.
Example
We have five jobs, each of which must go through the two machines and b in the order AB. Processing Times are given in the table:
Determine a sequence for the five jobs that will minimise the time T.
Solution
Applying the routine of the text, we see that the smallest time is 1 hour for job 2 on machine A. Thus we keep job 2 in first cell
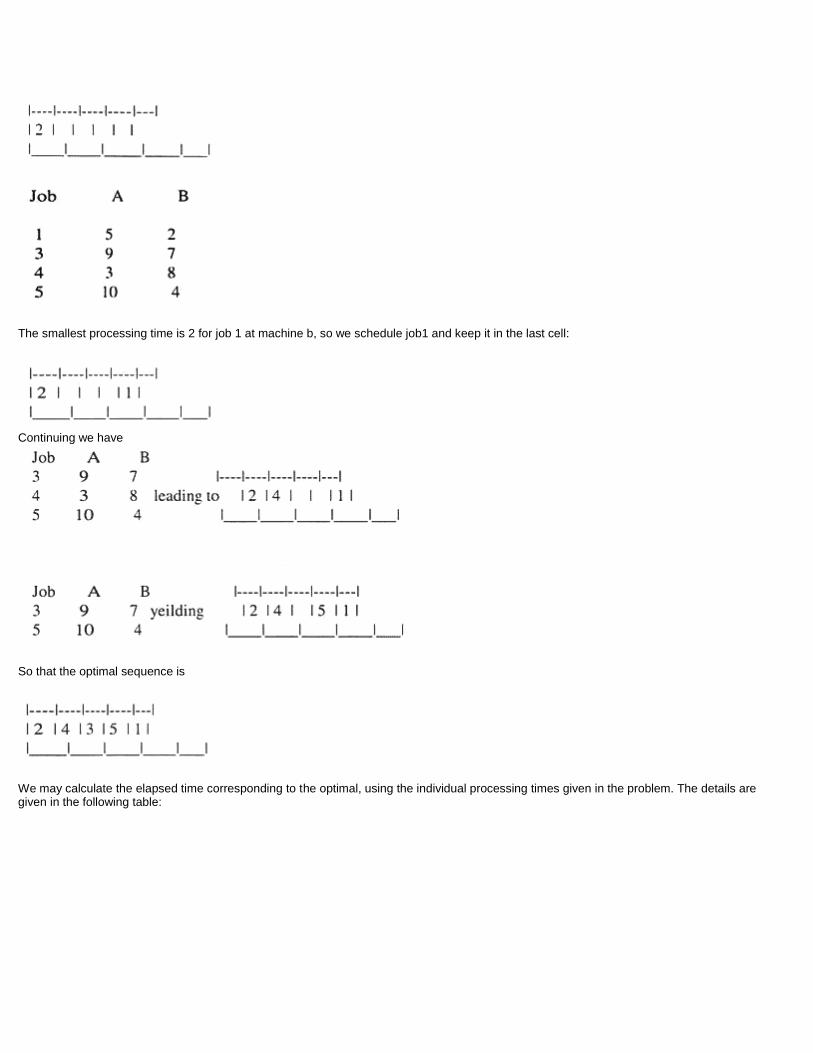
The smallest processing time is 2 for job 1 at machine b, so we schedule job1 and keep it in the last cell:
Continuing we have
So that the optimal sequence is
We may calculate the elapsed time corresponding to the optimal, using the individual processing times given in the problem. The details are given in the following table:
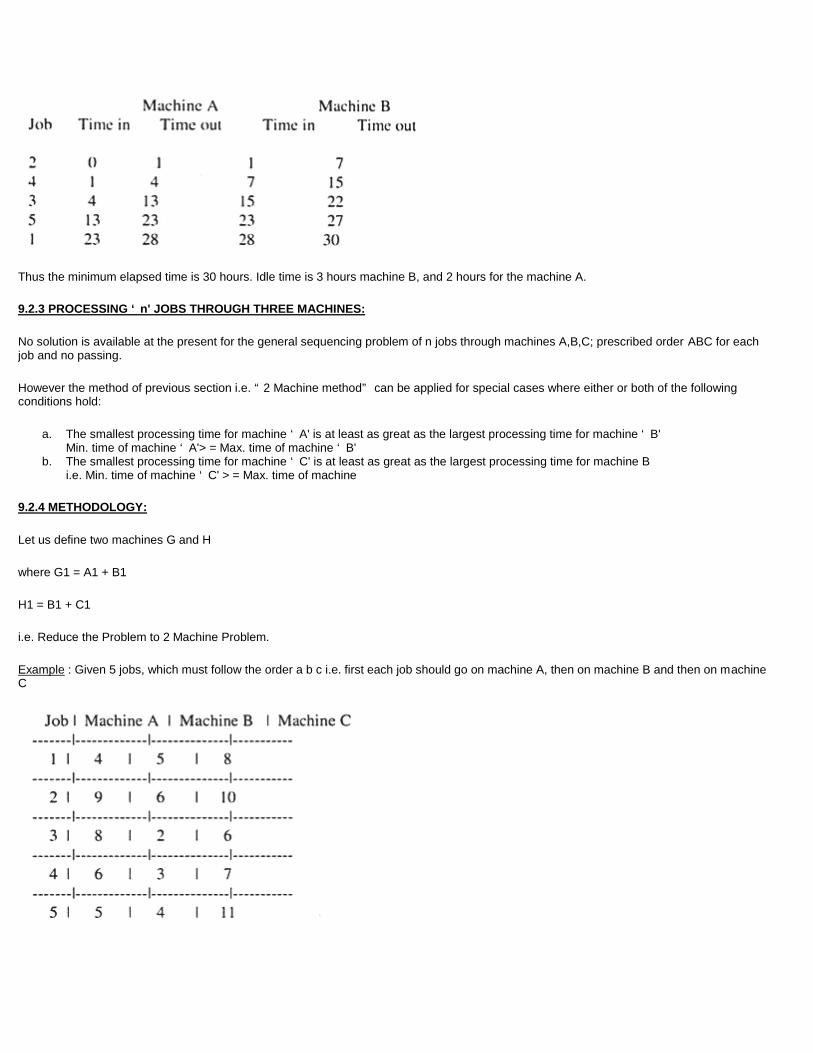
Thus the minimum elapsed time is 30 hours. Idle time is 3 hours machine B, and 2 hours for the machine A.
9.2.3 PROCESSING ‘ n' JOBS THROUGH THREE MACHINES:
No solution is available at the present for the general sequencing problem of n jobs through machines A,B,C; prescribed order ABC for each job and no passing.
However the method of previous section i.e. “ 2 Machine method” can be applied for special cases where either or both of the following conditions hold:
a. The smallest processing time for machine ‘ A' is at least as great as the largest processing time for machine ‘ B' Min. time of machine ‘ A'> = Max. time of machine ‘ B'
b. The smallest processing time for machine ‘ C' is at least as great as the largest processing time for machine B i.e. Min. time of machine ‘ C' > = Max. time of machine
9.2.4 METHODOLOGY:
Let us define two machines G and H
where G1 = A1 + B1
H1 = B1 + C1
i.e. Reduce the Problem to 2 Machine Problem.
Example : Given 5 jobs, which must follow the order a b c i.e. first each job should go on machine A, then on machine B and then on machine C
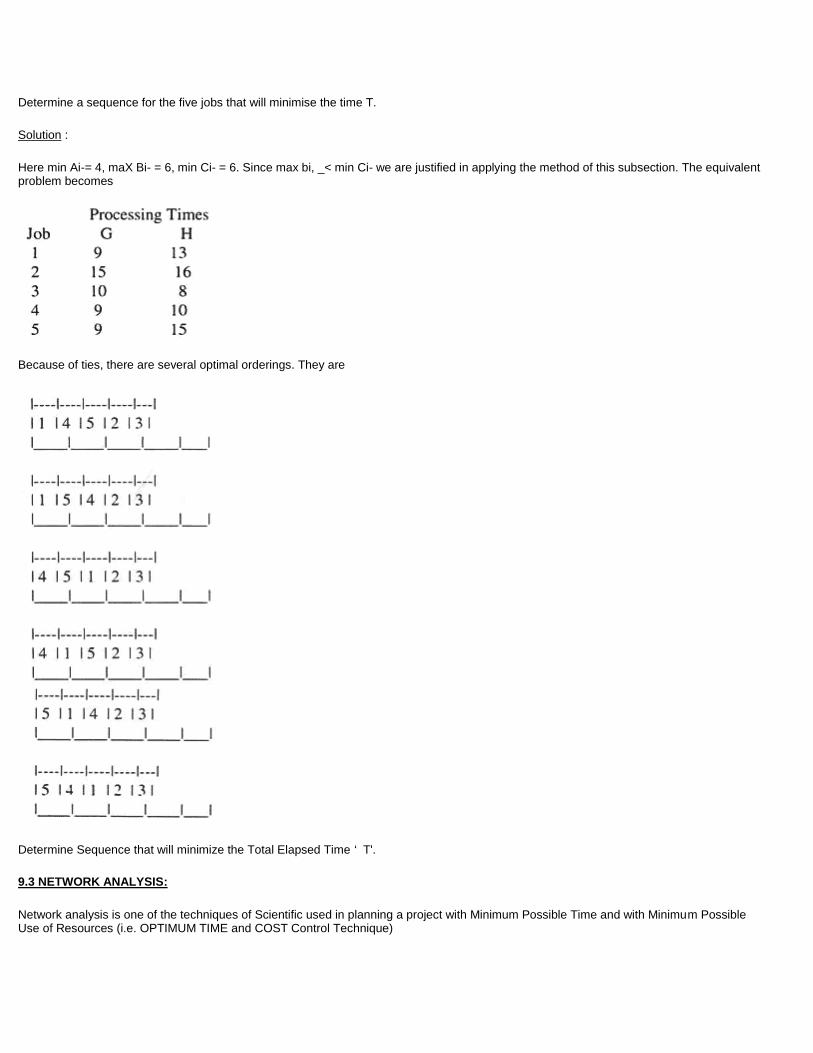
Determine a sequence for the five jobs that will minimise the time T.
Solution :
Here min Ai-= 4, maX Bi- = 6, min Ci- = 6. Since max bi, _< min Ci- we are justified in applying the method of this subsection. The equivalent problem becomes
Because of ties, there are several optimal orderings. They are
Determine Sequence that will minimize the Total Elapsed Time ‘ T'.
9.3 NETWORK ANALYSIS:
Network analysis is one of the techniques of Scientific used in planning a project with Minimum Possible Time and with Minimum Possible Use of Resources (i.e. OPTIMUM TIME and COST Control Technique)
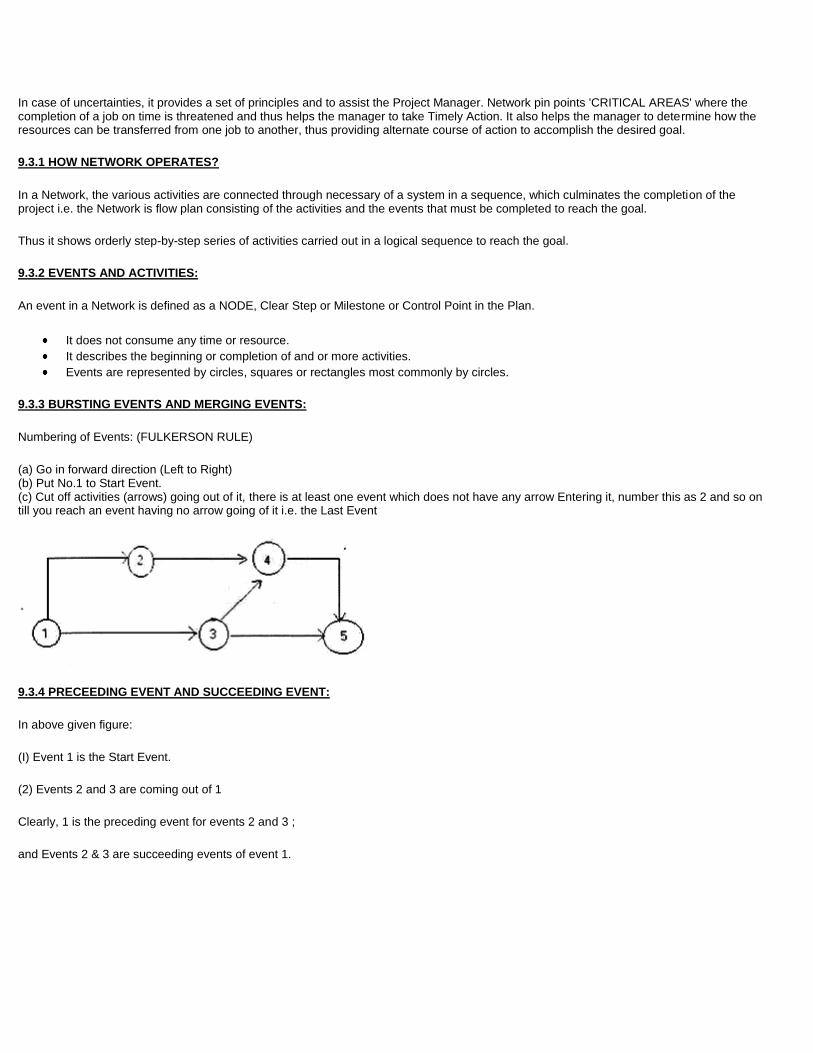
In case of uncertainties, it provides a set of principles and to assist the Project Manager. Network pin points 'CRITICAL AREAS' where the completion of a job on time is threatened and thus helps the manager to take Timely Action. It also helps the manager to determine how the resources can be transferred from one job to another, thus providing alternate course of action to accomplish the desired goal.
9.3.1 HOW NETWORK OPERATES?
In a Network, the various activities are connected through necessary of a system in a sequence, which culminates the completion of the project i.e. the Network is flow plan consisting of the activities and the events that must be completed to reach the goal.
Thus it shows orderly step-by-step series of activities carried out in a logical sequence to reach the goal.
9.3.2 EVENTS AND ACTIVITIES:
An event in a Network is defined as a NODE, Clear Step or Milestone or Control Point in the Plan.
It does not consume any time or resource.
It describes the beginning or completion of and or more activities.
Events are represented by circles, squares or rectangles most commonly by circles.
9.3.3 BURSTING EVENTS AND MERGING EVENTS:
Numbering of Events: (FULKERSON RULE)
(a) Go in forward direction (Left to Right) (b) Put No.1 to Start Event. (c) Cut off activities (arrows) going out of it, there is at least one event which does not have any arrow Entering it, number this as 2 and so on till you reach an event having no arrow going of it i.e. the Last Event
9.3.4 PRECEEDING EVENT AND SUCCEEDING EVENT:
In above given figure:
(I) Event 1 is the Start Event.
(2) Events 2 and 3 are coming out of 1
Clearly, 1 is the preceding event for events 2 and 3 ;
and Events 2 & 3 are succeeding events of event 1.

Event 1 - Star of the Project having no arrow Entering it. Event 5 - Last of the Project (Completion of the Project) going out of it.
9.3.5 ACITIVITY:
An activity is a Task, Job or Assignment.
It consumes Resources.
An activity is represented by an arrow or line drawn between two events in the network diagram.
“ Activities are the channels of flow of the network and the Manager can control this flow of material, investments, expenses, human efforts, time spent etc. utilized to achieve the final project goal.
9.3.6 DUMMY ACTIVITY:
A dummy activity is defined as an activity which does not consume time or resource but it is a useful and necessary constraint, completion of which depends on other activities.
In Fig. above, we have common destinations (events)
Event 1 and Event 2 represent DELHI & AMBALA but we have two different routes 1 to 2 and 1 to 3 which is the only way to indicate. Thus using a dummy event, we have completed the logic, without consuming any resource.
9.3.7 Major difference between PERT and CPM:
1. PERT stands for Program Evaluation and Review technique and CPM stands for CRITICAL PATH METHOD. 2. PERT is Event Oriented and CPM technique is Activity Oriented. 3. In PERT, there are 3 times estimates, whereas in CPM there is only 1 time estimate called the Average Time.
9.3.8 SYSTEM OF 3 TIME ESTIMATES:
In PERT, the activity or time duration associated with each activity has three time estimates -
Optimistic (to or a) Most likely (tm or m)
Pessimistic (tp or b)
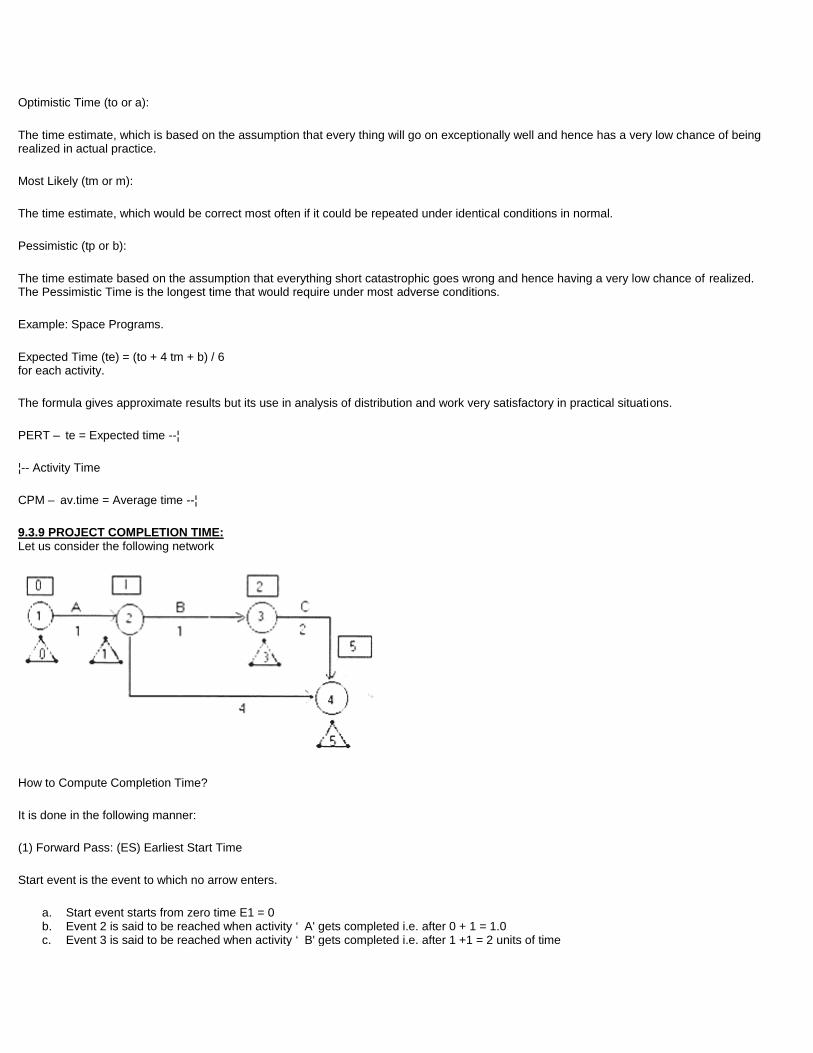
Optimistic Time (to or a):
The time estimate, which is based on the assumption that every thing will go on exceptionally well and hence has a very low chance of being realized in actual practice.
Most Likely (tm or m):
The time estimate, which would be correct most often if it could be repeated under identical conditions in normal.
Pessimistic (tp or b):
The time estimate based on the assumption that everything short catastrophic goes wrong and hence having a very low chance of realized. The Pessimistic Time is the longest time that would require under most adverse conditions.
Example: Space Programs.
Expected Time (te) = (to + 4 tm + b) / 6 for each activity.
The formula gives approximate results but its use in analysis of distribution and work very satisfactory in practical situations.
PERT – te = Expected time --¦
¦-- Activity Time
CPM – av.time = Average time --¦
9.3.9 PROJECT COMPLETION TIME: Let us consider the following network
How to Compute Completion Time?
It is done in the following manner:
(1) Forward Pass: (ES) Earliest Start Time
Start event is the event to which no arrow enters.
a. Start event starts from zero time E1 = 0 b. Event 2 is said to be reached when activity ‘ A' gets completed i.e. after 0 + 1 = 1.0 c. Event 3 is said to be reached when activity ‘ B' gets completed i.e. after 1 +1 = 2 units of time
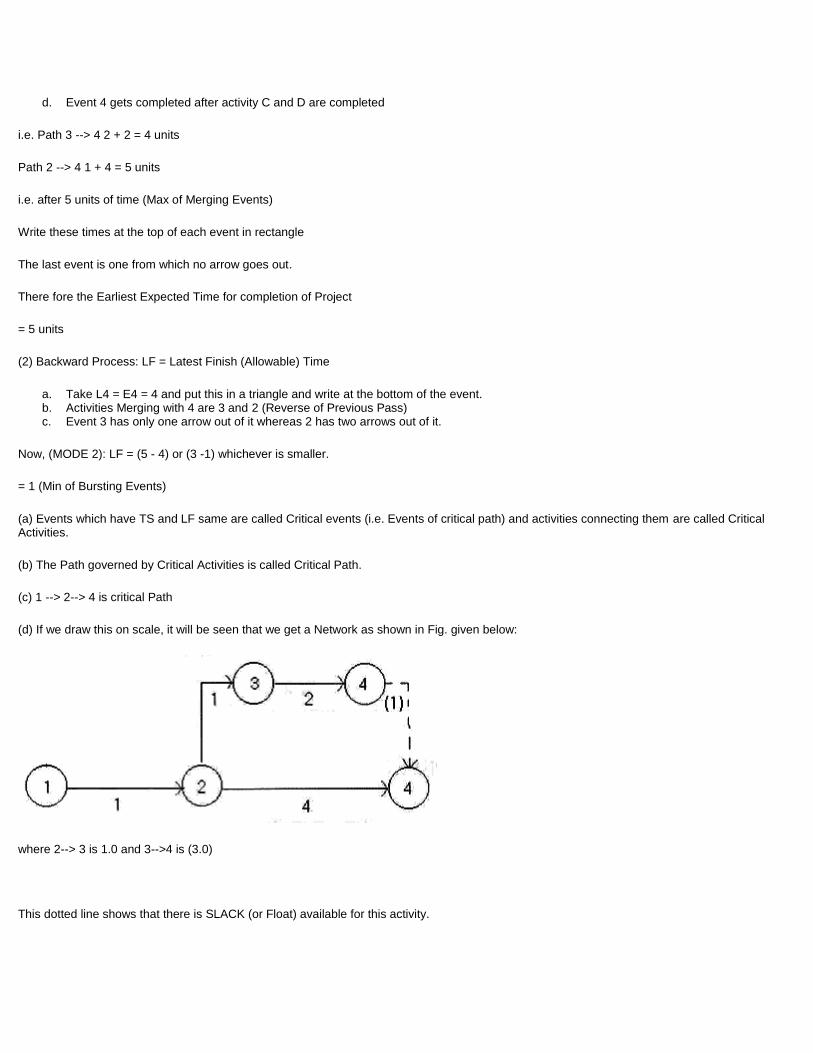
d. Event 4 gets completed after activity C and D are completed
i.e. Path 3 --> 4 2 + 2 = 4 units
Path 2 --> 4 1 + 4 = 5 units
i.e. after 5 units of time (Max of Merging Events)
Write these times at the top of each event in rectangle
The last event is one from which no arrow goes out.
There fore the Earliest Expected Time for completion of Project
= 5 units
(2) Backward Process: LF = Latest Finish (Allowable) Time
a. Take L4 = E4 = 4 and put this in a triangle and write at the bottom of the event. b. Activities Merging with 4 are 3 and 2 (Reverse of Previous Pass) c. Event 3 has only one arrow out of it whereas 2 has two arrows out of it.
Now, (MODE 2): LF = (5 - 4) or (3 -1) whichever is smaller.
= 1 (Min of Bursting Events)
(a) Events which have TS and LF same are called Critical events (i.e. Events of critical path) and activities connecting them are called Critical Activities.
(b) The Path governed by Critical Activities is called Critical Path.
(c) 1 --> 2--> 4 is critical Path
(d) If we draw this on scale, it will be seen that we get a Network as shown in Fig. given below:
where 2--> 3 is 1.0 and 3-->4 is (3.0)
This dotted line shows that there is SLACK (or Float) available for this activity.
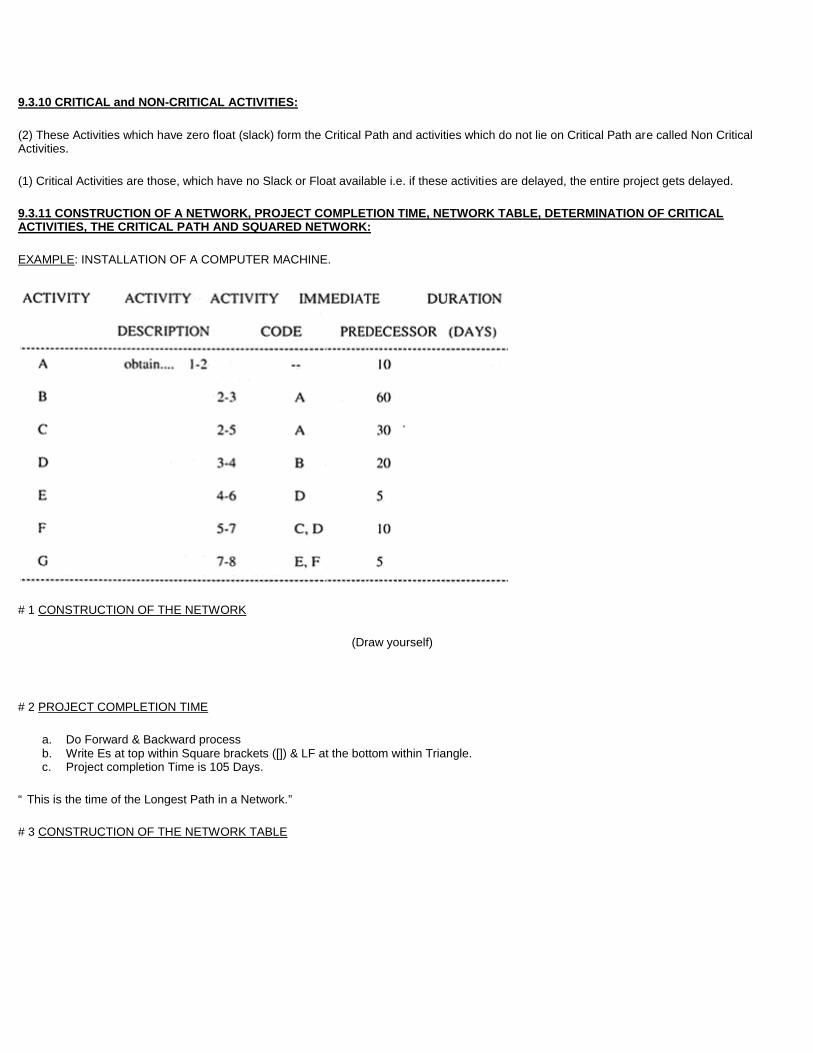
9.3.10 CRITICAL and NON-CRITICAL ACTIVITIES:
(2) These Activities which have zero float (slack) form the Critical Path and activities which do not lie on Critical Path are called Non Critical Activities.
(1) Critical Activities are those, which have no Slack or Float available i.e. if these activities are delayed, the entire project gets delayed.
9.3.11 CONSTRUCTION OF A NETWORK, PROJECT COMPLETION TIME, NETWORK TABLE, DETERMINATION OF CRITICAL ACTIVITIES, THE CRITICAL PATH AND SQUARED NETWORK:
EXAMPLE: INSTALLATION OF A COMPUTER MACHINE.
# 1 CONSTRUCTION OF THE NETWORK
(Draw yourself)
# 2 PROJECT COMPLETION TIME
a. Do Forward & Backward process b. Write Es at top within Square brackets ([]) & LF at the bottom within Triangle. c. Project completion Time is 105 Days.
“ This is the time of the Longest Path in a Network.”
# 3 CONSTRUCTION OF THE NETWORK TABLE
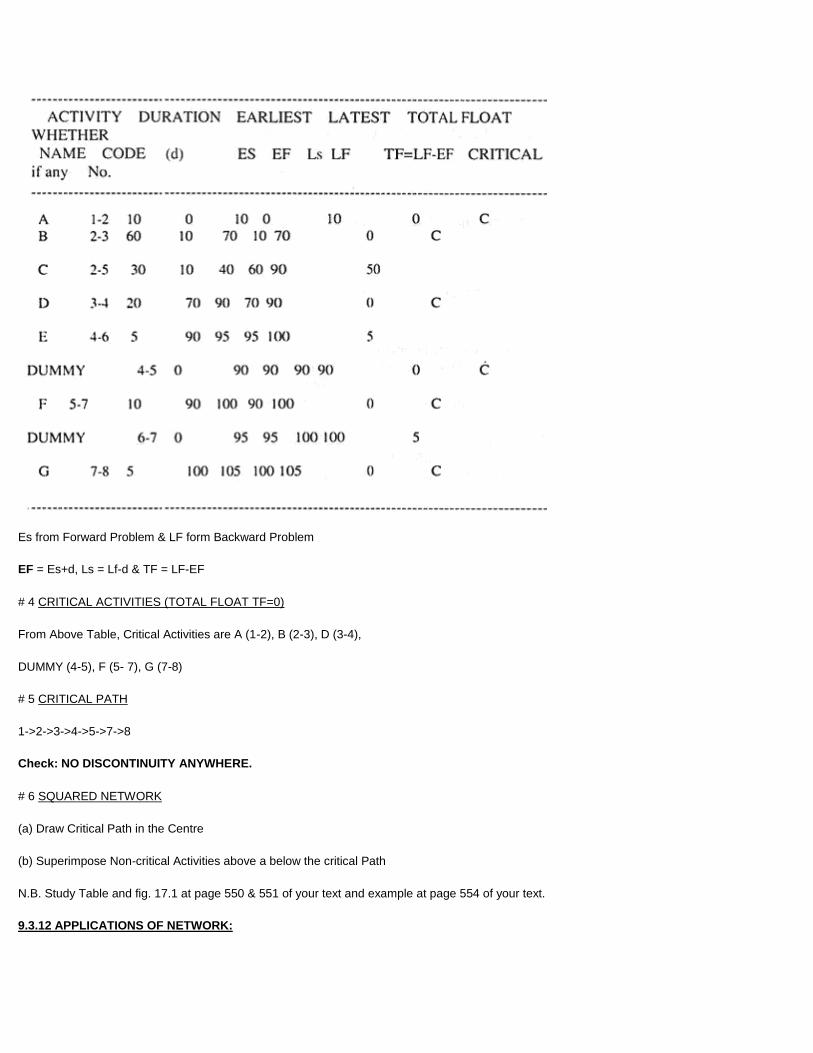
Es from Forward Problem & LF form Backward Problem
EF = Es+d, Ls = Lf-d & TF = LF-EF
# 4 CRITICAL ACTIVITIES (TOTAL FLOAT TF=0)
From Above Table, Critical Activities are A (1-2), B (2-3), D (3-4),
DUMMY (4-5), F (5- 7), G (7-8)
# 5 CRITICAL PATH
1->2->3->4->5->7->8
Check: NO DISCONTINUITY ANYWHERE.
# 6 SQUARED NETWORK
(a) Draw Critical Path in the Centre
(b) Superimpose Non-critical Activities above a below the critical Path
N.B. Study Table and fig. 17.1 at page 550 & 551 of your text and example at page 554 of your text.
9.3.12 APPLICATIONS OF NETWORK:
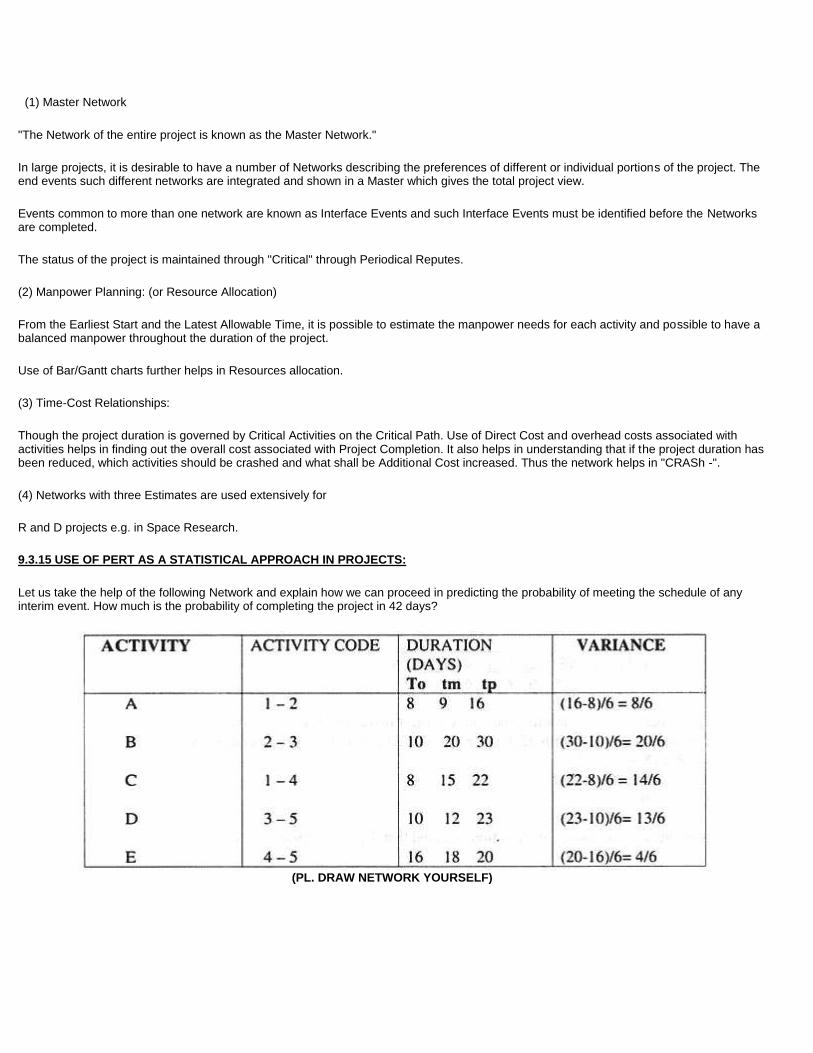
(1) Master Network
"The Network of the entire project is known as the Master Network."
In large projects, it is desirable to have a number of Networks describing the preferences of different or individual portions of the project. The end events such different networks are integrated and shown in a Master which gives the total project view.
Events common to more than one network are known as Interface Events and such Interface Events must be identified before the Networks are completed.
The status of the project is maintained through "Critical" through Periodical Reputes.
(2) Manpower Planning: (or Resource Allocation)
From the Earliest Start and the Latest Allowable Time, it is possible to estimate the manpower needs for each activity and possible to have a balanced manpower throughout the duration of the project.
Use of Bar/Gantt charts further helps in Resources allocation.
(3) Time-Cost Relationships:
Though the project duration is governed by Critical Activities on the Critical Path. Use of Direct Cost and overhead costs associated with activities helps in finding out the overall cost associated with Project Completion. It also helps in understanding that if the project duration has been reduced, which activities should be crashed and what shall be Additional Cost increased. Thus the network helps in "CRASh -".
(4) Networks with three Estimates are used extensively for
R and D projects e.g. in Space Research.
9.3.15 USE OF PERT AS A STATISTICAL APPROACH IN PROJECTS:
Let us take the help of the following Network and explain how we can proceed in predicting the probability of meeting the schedule of any interim event. How much is the probability of completing the project in 42 days?
(PL. DRAW NETWORK YOURSELF)
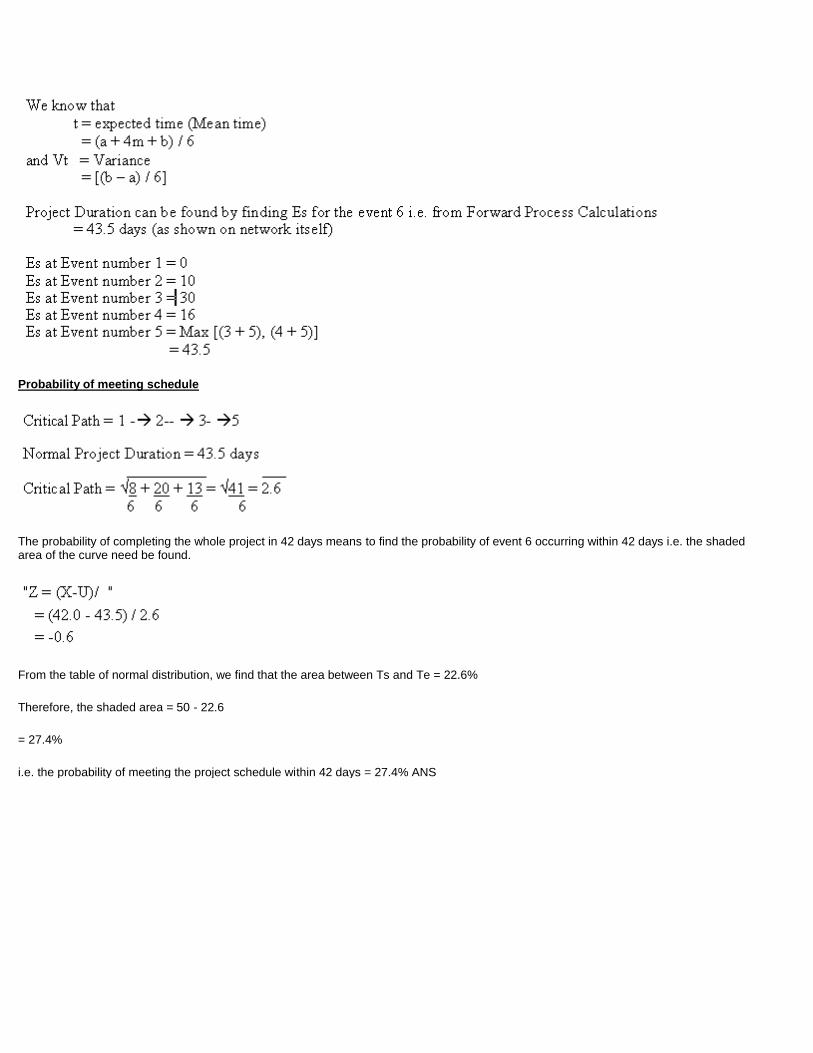
Probability of meeting schedule
The probability of completing the whole project in 42 days means to find the probability of event 6 occurring within 42 days i.e. the shaded area of the curve need be found.
From the table of normal distribution, we find that the area between Ts and Te = 22.6%
Therefore, the shaded area = 50 - 22.6
= 27.4%
i.e. the probability of meeting the project schedule within 42 days = 27.4% ANS


![Production Operation[1]](https://img.dokumen.tips/doc/110x75/577d21841a28ab4e1e9565bb/production-operation1.jpg)