Embed Size (px)
Citation preview

Digital Evidence Analytics: What does the evidence
really mean?
The 2010 ADFSL Conference onDigital Forensics, Security and Law
May 19-21, 2010St. Paul, Minnesota, USA
1Tuesday, May 25, 2010

Dr. Marcus K. Rogers
University Faculty Scholar
Fellow of CERIAS
Director - Cyber Forensics Program
College of Technology
Purdue University
CERIAS
2
2Tuesday, May 25, 2010
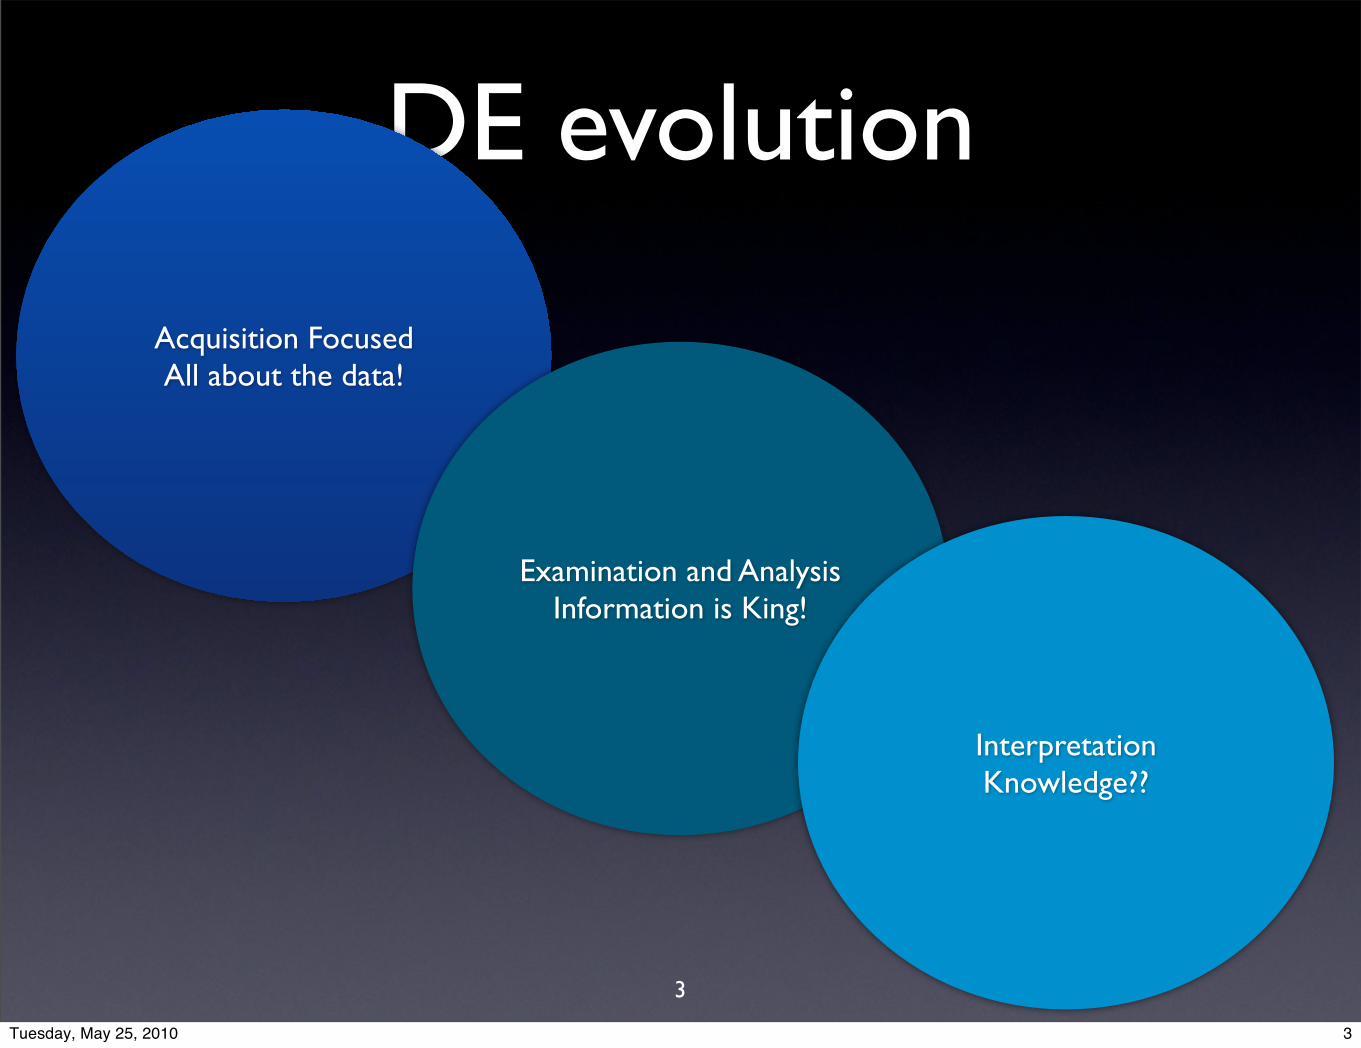
DE evolution
3
Acquisition FocusedAll about the data!
Examination and AnalysisInformation is King!
InterpretationKnowledge??
3Tuesday, May 25, 2010

context
• How do we get there from here?
• Content is not the be all, live all, end all!
• What meaning can we ascribe to what we are seeing?
4
4Tuesday, May 25, 2010

context v. content
• allows for attributions to be attached to the data.
• relational and/or structure and meaning to the data.
• determines the value or weight of the raw data.
5
5Tuesday, May 25, 2010
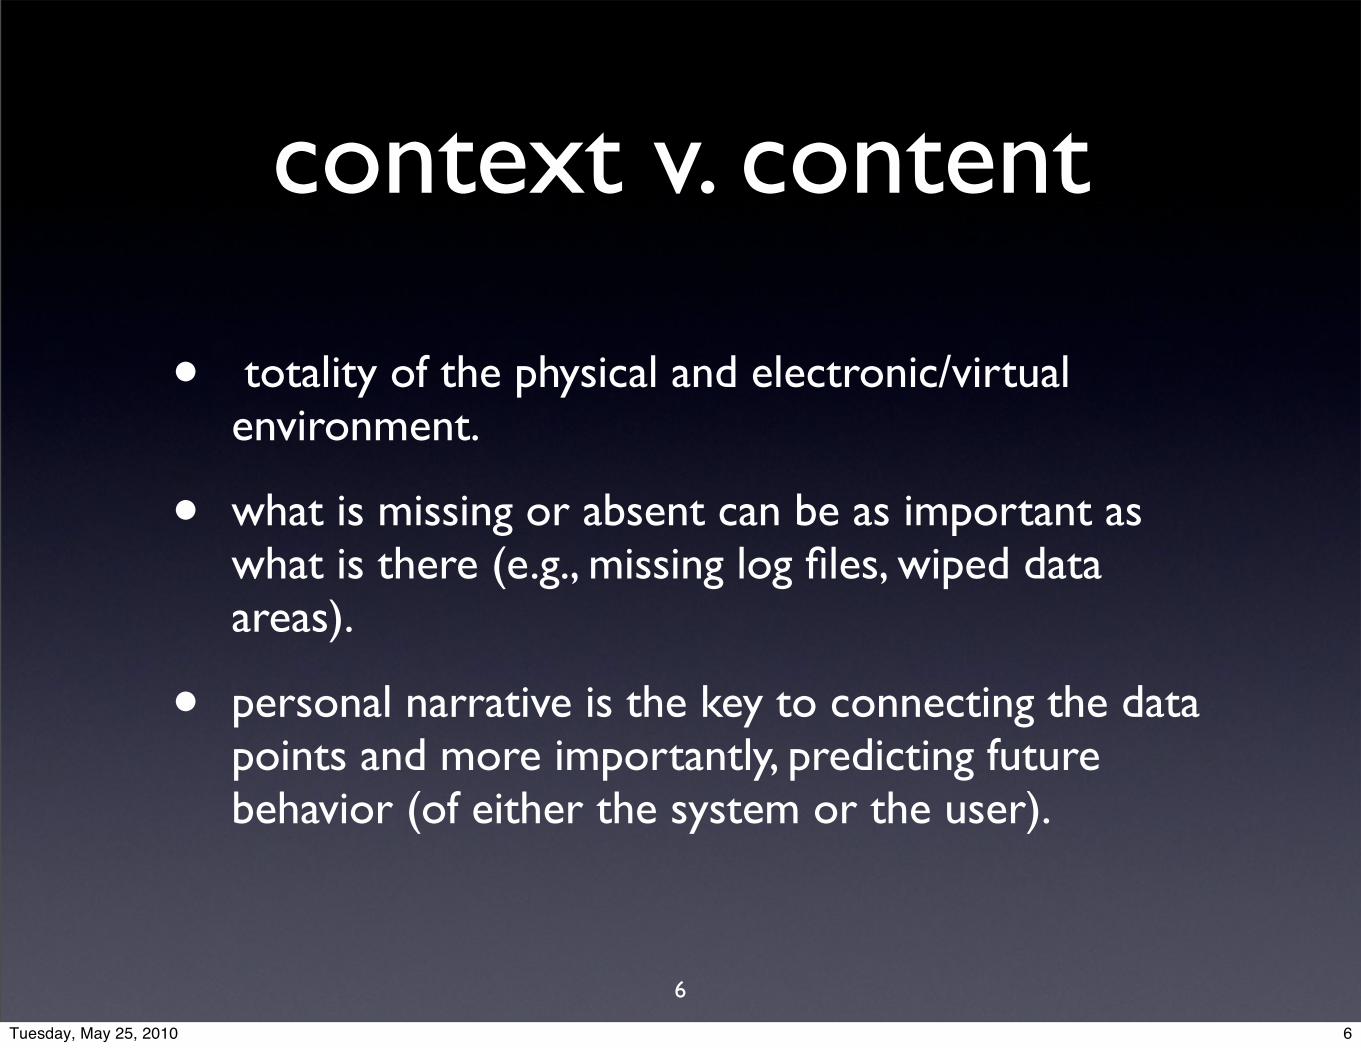
context v. content
• totality of the physical and electronic/virtual environment.
• what is missing or absent can be as important as what is there (e.g., missing log files, wiped data areas).
• personal narrative is the key to connecting the data points and more importantly, predicting future behavior (of either the system or the user).
6
6Tuesday, May 25, 2010

what can the data tell us?
• Context
• Meaning
• Personal Narrative
• Linkages
7
7Tuesday, May 25, 2010

• Intentions of individual or group (past & future)
• Social networks
• Technical capacity
• Resources
• Organizational structure
• Organizational activities
• Environment
• Pattern of life
what can the data tell us?
8
8Tuesday, May 25, 2010

connecting the dots
• Pattern analysis
• Chronologies (e.g., timelines)
• Frequency analyses
• Hierarchical connections or nodes
• small world networks - (degrees of separation in social networks), dense connection nodes
9
9Tuesday, May 25, 2010
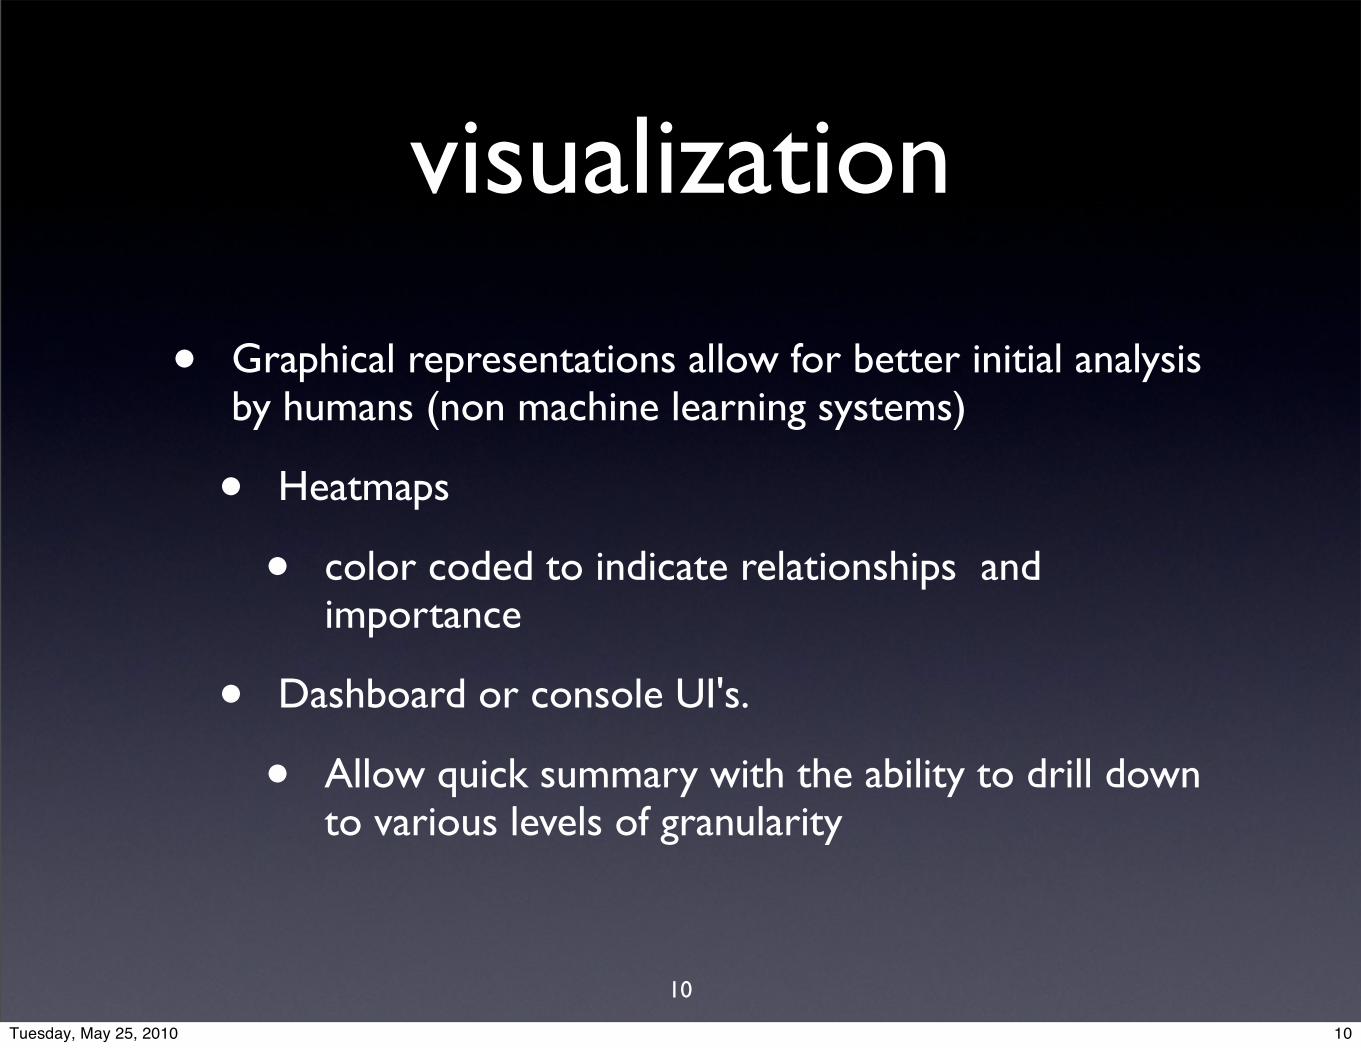
visualization
• Graphical representations allow for better initial analysis by humans (non machine learning systems)
• Heatmaps
• color coded to indicate relationships and importance
• Dashboard or console UI's.
• Allow quick summary with the ability to drill down to various levels of granularity
10
10Tuesday, May 25, 2010

visualization
• Timelines
• using drill down charts that can be superimposed over other interfaces
• Mind maps
• dynamic fluid relationships and interconnections at different levels of granularity
11
11Tuesday, May 25, 2010

points of view
• investigators v. analysts
• technical v. analytical
• our frame of reference is vital
• communication is vital
• asking better questions of the data!
12
12Tuesday, May 25, 2010

analysis
Theory development
Hypothesis testing
Probabilities
Error rates
Accuracy
Data driven (data mining)
Decision makingStatistical analysisPattern
identification
whowhatwhenwherewhyhow
AnalyticsScientific Method
Investigative
13
13Tuesday, May 25, 2010
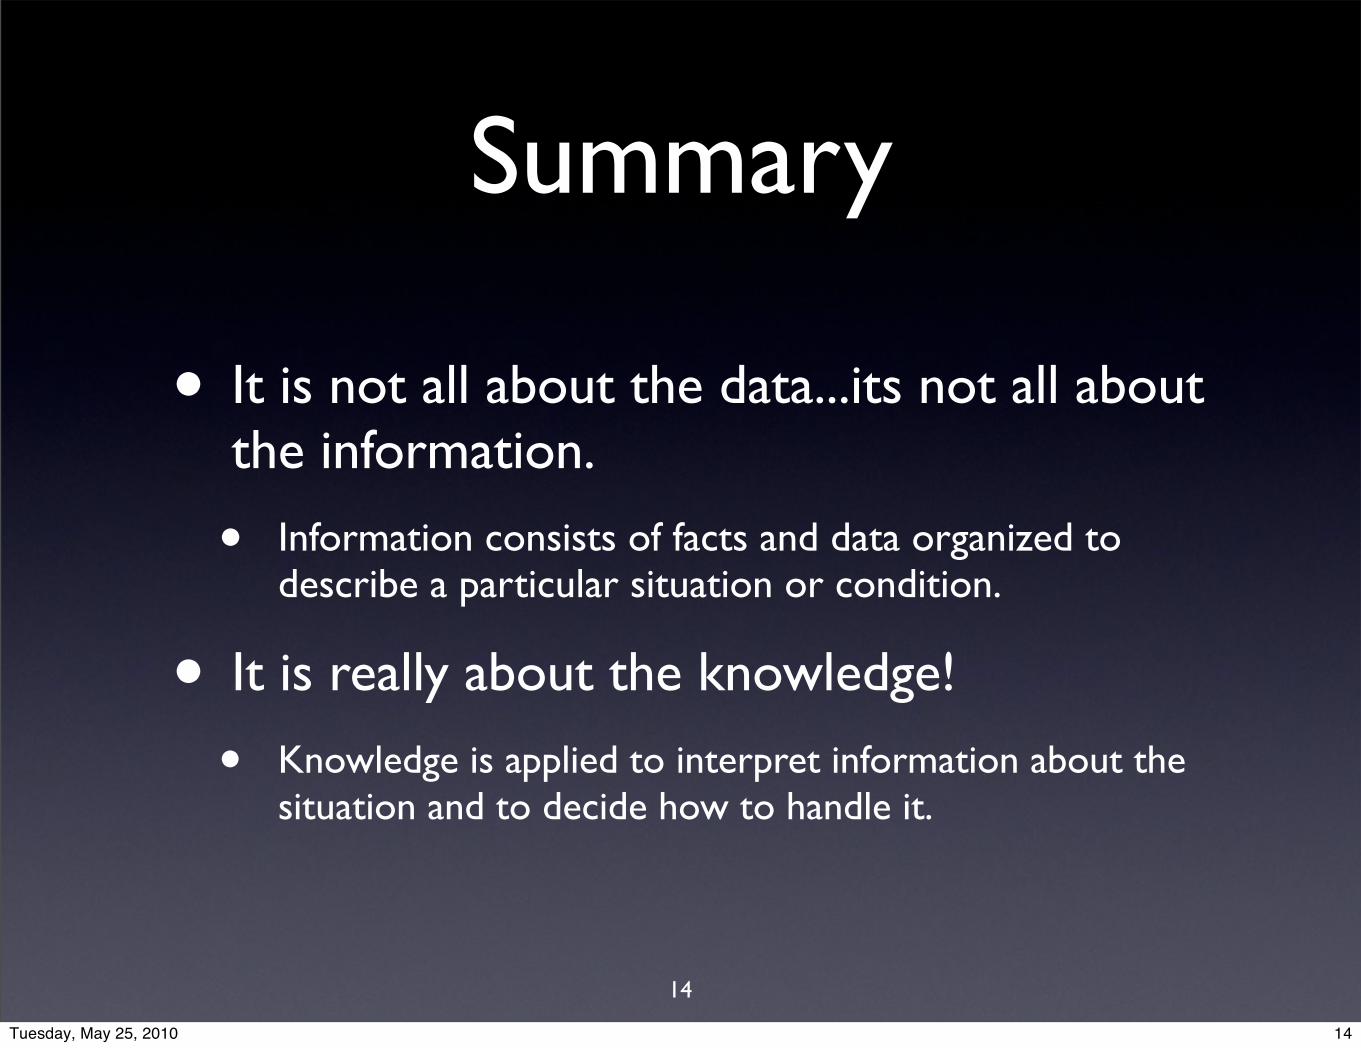
Summary
• It is not all about the data...its not all about the information.
• Information consists of facts and data organized to describe a particular situation or condition.
• It is really about the knowledge!
• Knowledge is applied to interpret information about the situation and to decide how to handle it.
14
14Tuesday, May 25, 2010

“There is nothing more deceptive than an obvious
fact” Sir Arthur Conan Doyle
Sherlock HolmesThe Boscombe Valley Mystery
15
15Tuesday, May 25, 2010

contact information
Dr. Marcus Rogers
765-494-2561
http://cyberforensics.purdue.edu
16
16Tuesday, May 25, 2010