Embed Size (px)
Citation preview

1
Adaptive evolution in the English yew (Taxus baccata) gene network
Estudiante: Delphine GRIVET
MÁSTER EN BIOINFORMÁTICA Y BIOLOGÍA COMPUTACIONAL ESCUELA NACIONAL DE SALUD- INSTITUTO DE SALUD CARLOS III
2012-2013
CENTRO/EMPRESA DONDE SE DESALLORARON LAS PRACTICAS: I.N.I.A. DIRECTOR DE LA TESIS (TUTOR DE LA EMPRESA): Santiago C. González-Martínez CODIRECTOR DE LA TESIS (TUTOR POR EL MASTER): Federico Abascal FECHA: 14 de enero de 2015

2
INDEX
OBJECTIVES …………………………………………………….... 3
INTRODUCTION ……………………………………………………… 4
MATERIALS & METHODS ……………………………………… 8
RESULTS ……………………………………………………………… 12
DISCUSSION ……………………………………………………… 29
CONCLUSION ……………………………………………………… 31
REFERENCES ……………………………………………………… 32
ACKOWLEDGMENTS ……………………………………………… 33
ANNEXES ……………………………………………………………… 34
3
OBJECTIVES
English yew, Taxus baccata, is a long-lived, dioecious conifer, with a distribution range
encompassing a wide diversity of climates and landscapes. Because of the fragmentation of
its range, related to climate warming since last glaciations and to human activities,
declining T. baccata populations are now protected in Europe. Despite high dispersal
capacities, gene flow is limited for this conifer, associated with genetic drift, inbreeding and
reduced effective population size. We are interested in assessing the adaptive evolution of
this conifer, specifically through gene pathways relevant for its adaptation.
Because very few genetic resources are available for this species, the transcriptome
of one individual of Taxus baccata was produced in collaboration with the Institute of
Applied Genomics (Udine, Italy). RNAseq data assembly led to a total of 16,800 expressed
genes. From these expressed genes we aim at reconstructing the network of genetic control
of this conifer.
The objectives of the Master Thesis are to assess the evolution of important metabolic
pathways in Taxus baccata, following different steps:
1. Annotating T. baccata transcripts, using other plant datasets as reference.
2. Characterizing some molecular pathways relevant to T. baccata adaptation, based on
available plant gene pathways.
3. Comparing the evolutionary histories of genes occupying different positions within
specific molecular pathways. This step involves performing neutrality tests within a
network approach. Assessing selective constraints on functional categories can be done by
investigating the ratio of the number of nonsynonymous substitutions per non-synonymous
site (dN) to the number of synonymous substitutions per synonymous site (dS), which can be
used as an indicator of selective pressure acting on a protein-coding gene.
4. Getting insights on the rate of evolution of some gene pathways, and identifying key
genes that are the target of natural selection and that have potentially the most control over
phenotype.
4
INTRODUCTION
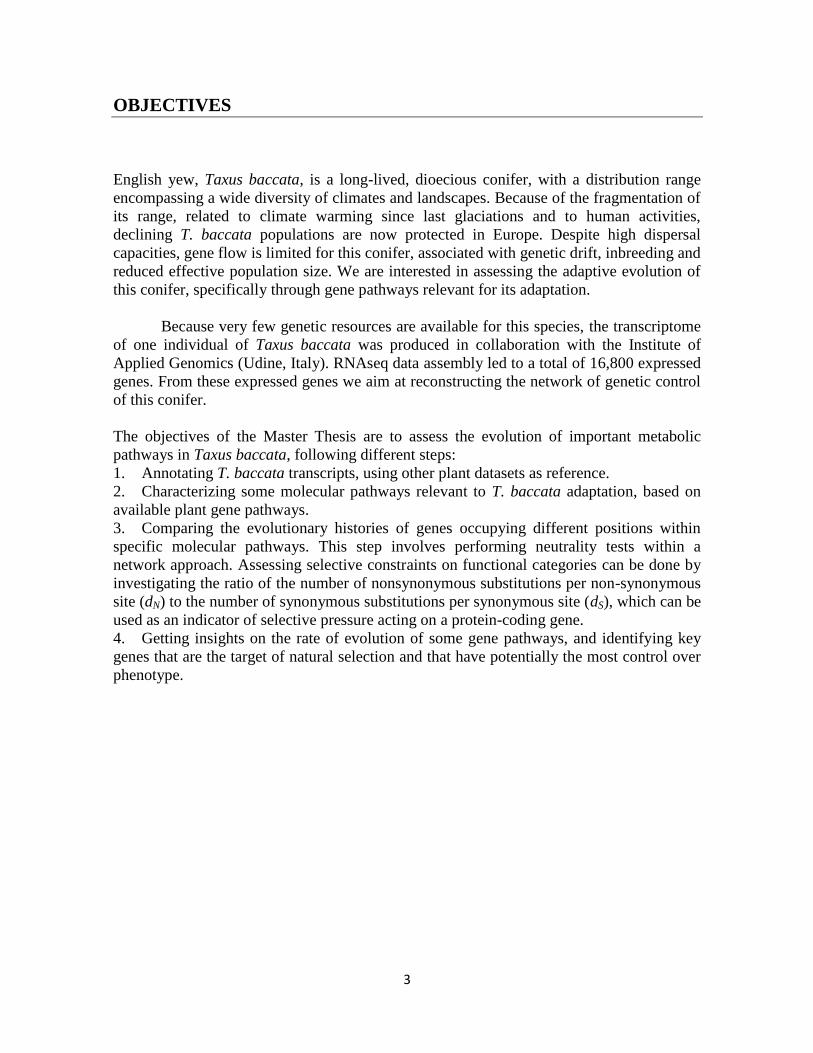
With a little less than 1000 species, conifers are ecologically and economically important
worldwide, in particular in the Northern Hemisphere. However, genomics studies in these
taxa have been hindered by the size and complexity of their genomes (see Figure 1). The
hypotheses explaining the complexity of conifers genomes include: polyploidy, highly
repetitive tandem elements, transposable elements, size of gene families and abundance of
pseudogenes, as well as intron sizes (Ahuja and Neale 2005). The only three drafts of full-
genomes available up-to-date for conifers, namely Norway spruce (Picea abies, Nystedt et
al. 2013), white spruce (Picea glauca, Birol et al. 2013), and Loblolly pine (Pinus taeda,
Neale et al. 2014) have confirmed these hypotheses.
Figure 1. Genome size from different plant species, including some conifers
(http://data.kew.org/cvalues/).
Taxus (Order: Pinales, Family: Taxaceae) is a genus of around ten closely related
species scattered through the northern temperate region (Figure 2). Species of this genus
are relatively slow-growing and can be very long-lived (up to 2,000 years old). In 2008, the
Botanic Gardens Conservation International included yew trees in the list of the 400
medicinal plants that are at risk of extinction from over-collection and deforestation,
threatening the discovery of future cures for disease. The genus Taxus is of particular
interest because most species contain the alkaloid taxol or paclitaxel, a mitotic inhibitor
used in cancer chemotherapy. However, it takes the bark of six trees to create a single dose
of cancer drug paclitaxel so growers are struggling to keep up.
5
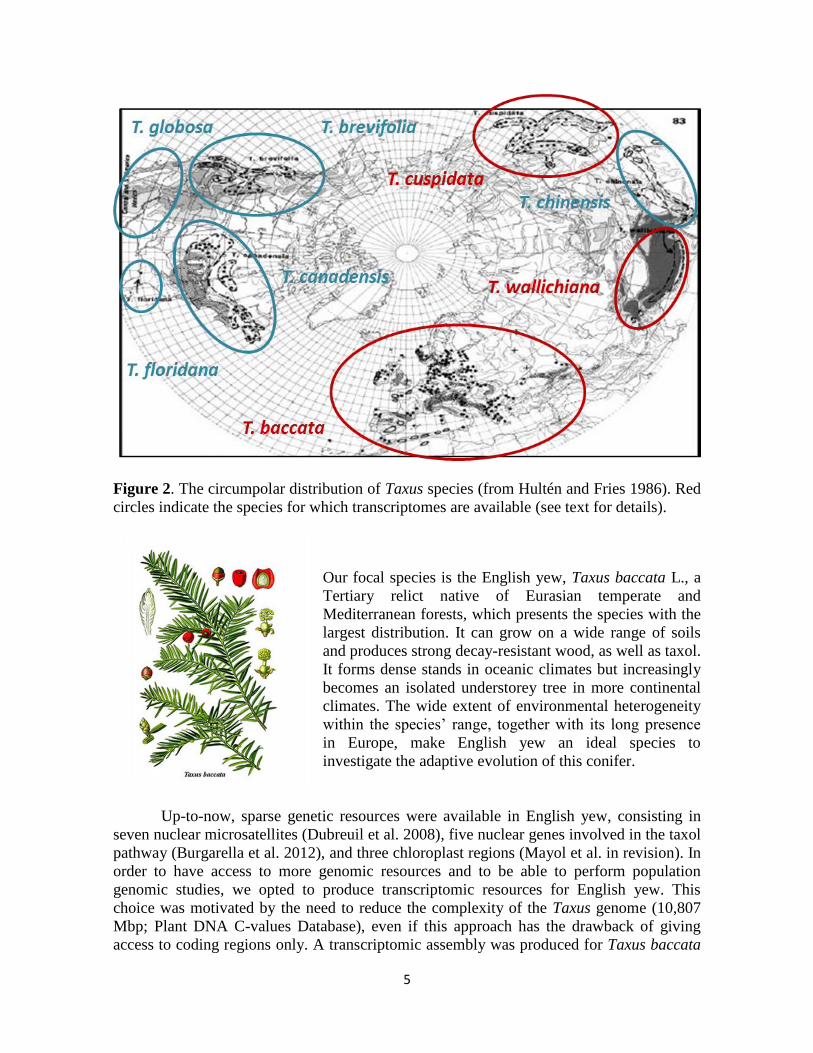
Figure 2. The circumpolar distribution of Taxus species (from Hultén and Fries 1986). Red
circles indicate the species for which transcriptomes are available (see text for details).
Our focal species is the English yew, Taxus baccata L., a
Tertiary relict native of Eurasian temperate and
Mediterranean forests, which presents the species with the
largest distribution. It can grow on a wide range of soils
and produces strong decay-resistant wood, as well as taxol.
It forms dense stands in oceanic climates but increasingly
becomes an isolated understorey tree in more continental
climates. The wide extent of environmental heterogeneity
within the species’ range, together with its long presence
in Europe, make English yew an ideal species to
investigate the adaptive evolution of this conifer.
Up-to-now, sparse genetic resources were available in English yew, consisting in
seven nuclear microsatellites (Dubreuil et al. 2008), five nuclear genes involved in the taxol
pathway (Burgarella et al. 2012), and three chloroplast regions (Mayol et al. in revision). In
order to have access to more genomic resources and to be able to perform population
genomic studies, we opted to produce transcriptomic resources for English yew. This
choice was motivated by the need to reduce the complexity of the Taxus genome (10,807
Mbp; Plant DNA C-values Database), even if this approach has the drawback of giving
access to coding regions only. A transcriptomic assembly was produced for Taxus baccata

6
in 2013 in collaboration with the Institute of Applied Genomics (Udine, Italy; see details in
the Material and Methods Section).
The original objective of the Master Thesis was to look at gene network evolution in
Taxus baccata. To reach this objective, we took the following steps:
1.1. Annotating T. baccata transcripts performing blastx against the available protein
databases for plants, for species for which a gene network was established in the Kyoto
Encyclopedia of Genes and Genomes (KEGG). The best candidate species were:
Arabidopsis (Arabidopsis thaliana), tomato (Solanum lycopersicum), and the black
cottonwood (Populus trichocarpa).
1.2. Identifying gene pathways associated to T. baccata transcripts based on the gene
network established in KEGG.
1.3. Of special interest is the gene pathway leading to taxol. To identify more specifically
this pathway we targeted five full-genes key to the taxol pathway produced in a previous
study (Burgarella et al. 2012) and tried to identify them in the T. baccata transcriptomic
data.
1.4. Estimating the ratio of the number of nonsynonymous substitutions per non-
synonymous site (dN) to the number of synonymous substitutions per synonymous site (dS)
across gene pathways, using the outgoup Sitka spruce (Picea sitchensis), for which
annotated transcripts are available (see details in the Material and Methods section); this
ratio can be used as an indicator of selective pressure acting on a protein-coding gene.
This part of the Master Thesis is presented thereafter in PART 1.
While this work was under progress, our colleagues from the Institute of Applied
Genomics (Udine, Italy) found out that transcriptomic data for two other Taxus species
were available (see details in the Material and Methods Section): the Japanese yew (Taxus
cuspidata; native of Japan, Korea northeast China and the extreme southeast of Russia),
and the Himalayan yew (Taxus wallichiana; native from of the Himalaya from Afghanistan
east to western Yunnan in southwestern China).
Because the transcriptome of only one individual was available for T. baccata,
diversity studies, which involved the analysis of several individuals, could not be
contemplated. However, the existence of the transcriptomic data of two other Taxus
species, allows performing interspecific comparisons. Therefore, the objectives of the
Master Thesis were re-oriented as follows:
7
2.1. Annotating the transcripts of the three yew species performing tblastx against the
available annotated transcripts (coding DNA sequences, or CDS) of the outgroup Sitka
spruce (Picea sitchensis).
2.2. Identifying common gene pathways associated to Taxus transcripts based on the gene
network established in KEGG.
2.3. Studying the evolution (dN/dS) of specific gene pathways common to the four species
within a phylogenetic context.
This part of the Master Thesis is presented thereafter in PART 2.
The detection of selection events at the individual gene level in a network approach
across species will provide some preliminary insights on the genetic architecture that
underlies the evolutionary change of the different Taxus species, i.e. the conservation of the
genes involved in a specific network and the forces that have shaped their evolution during
the divergence of the species (e.g. Davila-Velderrain et al. 2014). Of particular interest are
networks related to phenology (involving genes such as e.g. phytochromes, constans),
growth (e.g. glutamate synthetases), tolerance to abiotic stresses (e.g. dehydrins), defense
against herbivores and pathogens (e.g. terpenes, and especially taxanes).
In addition, selection events detected within a network context could allow testing
the predictions (Olson-Manning et al. 2012), under which: (i) central genes are under
purifying selection and peripheral genes show positive selection, and (ii) upstream genes
show evidence of stronger selection – purifying (i.e. they are more constrained) or positive
than downstream genes. More generally, is natural selection acting preferentially on genes
with high flux control?
8
MATERIAL & METHODS
In this section is described the origin of the transcriptomic datasets analyzed in this study.
The objective of this section is to give an overview of the quality of the data, as datasets
from different origins are compared. Transcriptomic data for the three Taxus species all
came from de novo assemblies: those of T. baccata were produced in collaboration with the
Institute of Applied Genomics (Udine, Italy) and constitute original datasets, while those of
T. cuspidata (Lee et al. 2010) and T. wallichiania (Hao et al. 2011) came from published
works and the steps leading to their production are briefly described to gauge their quality.
Finally, coding DNA sequences for the outgroup P. sitchensis came from the European
Nucleotide Archive.
Focal species
English yew (T. baccata)
16,810 putative transcripts were produced from a de novo assembly of T. baccata, in
collaboration with the Institute of Applied Genomics (Udine, Italy).
RNA was extracted from a mix of needle and root tissue from one individual in
order to capture as many expressed transcripts as possible. Two different RNA-Seq paired-
end libraries (both obtained by mixing RNA from needle and root) were generated using
the TruSeq RNA-Seq Sample Prep kit according to the manufacturer’s protocol (Illumina
Inc., San Diego, CA, USA). Libraries were sequenced with the Illumina HiSeq2000
(Illumina Inc.) as paired-end reads of 100 bp producing a total of 160,119,945 reads.
Short reads were used for de novo assembly of the transcriptome. First, quality
trimming of the raw reads was performed using CLC Genomics Workbench 4.8 (CLC bio,
Cambridge, MA) with default parameters (quality limit = 0.03). 12,139,436 reads were
completely removed during trimming (401,064,432 nucleotides were trimmed, altogether).
Then, after trimming, only high quality reads with a minimum length of 50 bp were
retained. The filtered reads were de novo assembled using CLC Genomics Workbench 4.8
using automatically generated parameters (word size = 24 and bubble size = 50). Details on
the coverage statistics obtained for each contigs generated by de novo assembly are
provided in the digital material Taxus_baccata_de_novo_assembly.xls. A total of 138,495
contigs (range consensus length: 68 to 21,302 bp, with mean consensus length: 470 bp; see
Figure 3) based on 40,447,774 reads (range total read count: 1 to 889,556 with mean total
read count: 292 and average coverage: 44) were obtained.

9
Figure 3. T. baccata transcriptomic data showing the total read count given the consensus
length.
Japanese yew (T. cuspidata)
20,460 transcripts of T. cuspidata were obtained from Lee et al. (2010).
The authors isolated and cultured cambial meristematic cells (where paclitaxel
biosynthesis in T. cuspidata is most conspicuous), and used an approach based on
massively parallel pyrosequencing (Roche 454 GS FLX Titanium) to profile the T.
cuspidata transcriptome. A total of 860,800 reads of average length 351 bp generated 301
MB of sequence (Figure 4a). These data were assembled de novo into isotigs by employing
Newbler 2.3, leading to 36,906 contigs (average length, 700 bp; maximum length 10,355
bp), with 8,865 contigs > 1 kb (Figure 4b). 62% of the contigs were assigned a putative
function in BLAST search within available sequence databases.
Figure 4. T. cuspidata transcriptomic data showing read and contig length. a. Histogram
showing number of reads of given length. b. Number of contigs of given length (from Lee
et al. 2010).
10
Himalaya yew (T. wallichiana or T. mairei or T. chinensis)
The taxonomy of this species has been debated and it has been named under several names
(http://www.iucnredlist.org/details/191659/0): Taxus wallichiana, Taxus mairei, Taxus
chinensis, which are now treated as different species following Farjon (2010), although the
distinctions are minor and confined to leaf morphology only.
15,735 transcripts of T. wallichiana were obtained from Hao et al. (2011).
Leaf, stem, and root were collected from a cultivated of two-year old Taxus mairei.
Total RNA was isolated with TRIzol (Invitrogen) from each sample. Paired-end library was
synthesized using the Genomic sample Prep kit (Illumina), and the library was sequenced
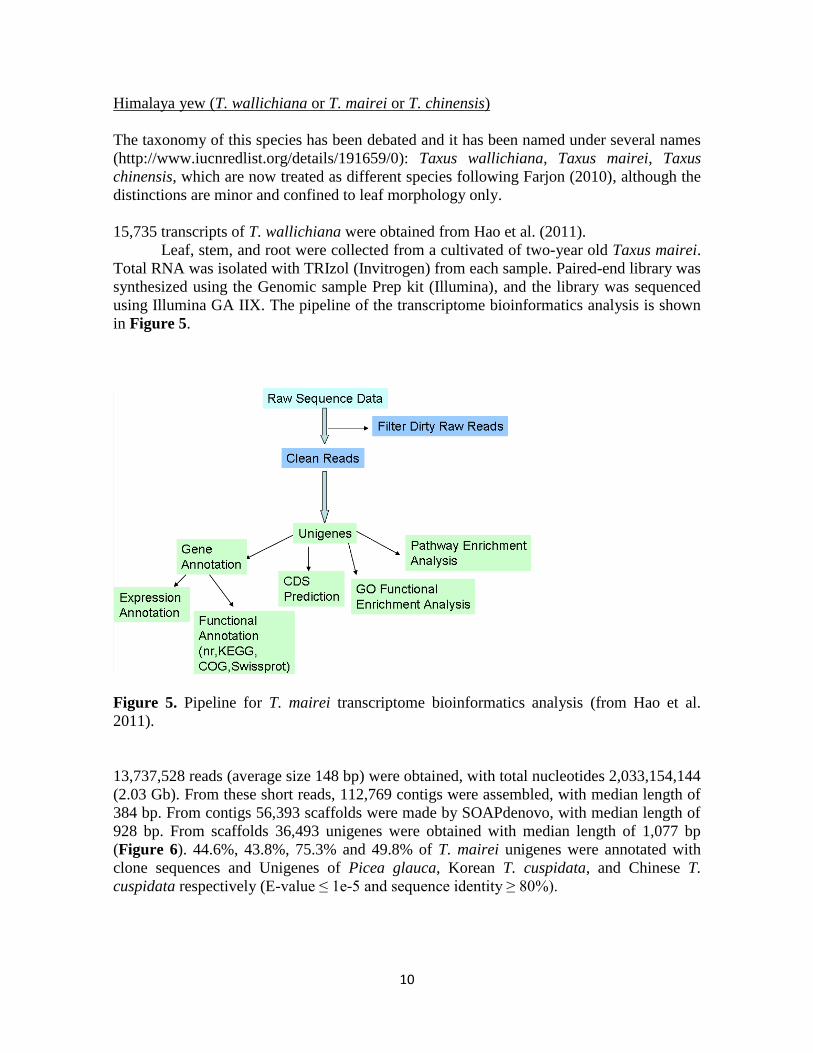
using Illumina GA IIX. The pipeline of the transcriptome bioinformatics analysis is shown
in Figure 5.
Figure 5. Pipeline for T. mairei transcriptome bioinformatics analysis (from Hao et al.
2011).
13,737,528 reads (average size 148 bp) were obtained, with total nucleotides 2,033,154,144
(2.03 Gb). From these short reads, 112,769 contigs were assembled, with median length of
384 bp. From contigs 56,393 scaffolds were made by SOAPdenovo, with median length of
928 bp. From scaffolds 36,493 unigenes were obtained with median length of 1,077 bp
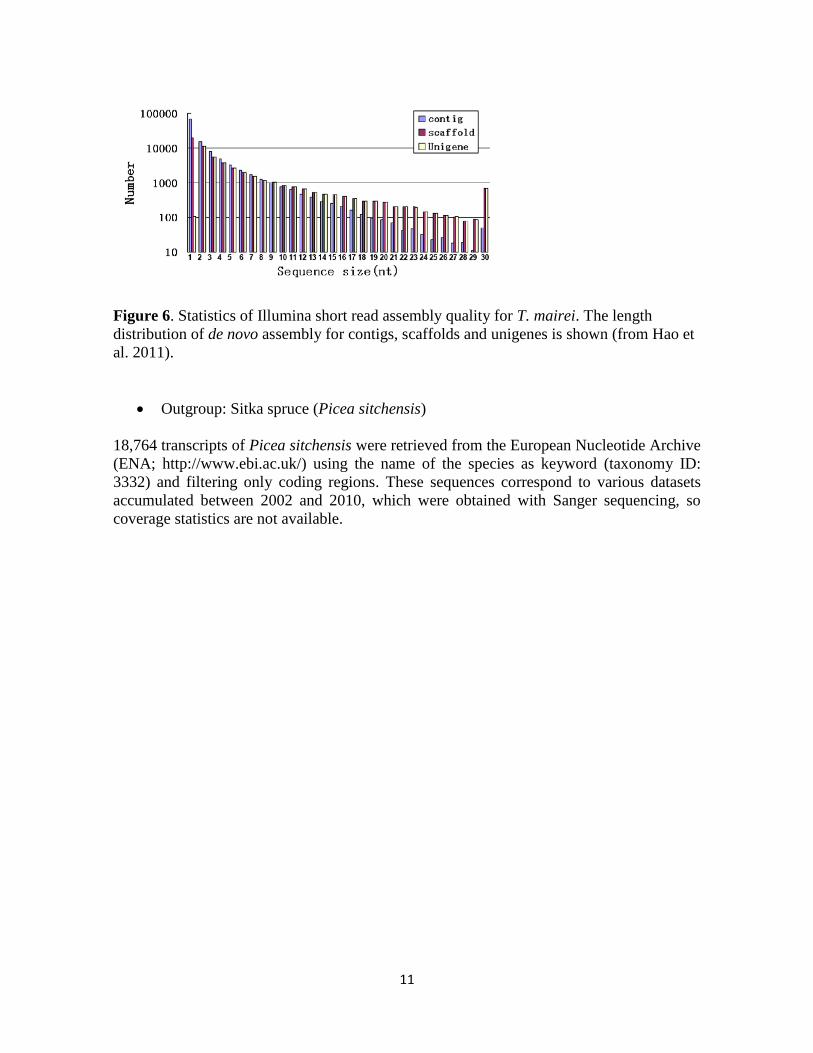
(Figure 6). 44.6%, 43.8%, 75.3% and 49.8% of T. mairei unigenes were annotated with
clone sequences and Unigenes of Picea glauca, Korean T. cuspidata, and Chinese T.
cuspidata respectively (E-value ≤ 1e-5 and sequence identity ≥ 80%).
11
Figure 6. Statistics of Illumina short read assembly quality for T. mairei. The length
distribution of de novo assembly for contigs, scaffolds and unigenes is shown (from Hao et
al. 2011).
Outgroup: Sitka spruce (Picea sitchensis)
18,764 transcripts of Picea sitchensis were retrieved from the European Nucleotide Archive
(ENA; http://www.ebi.ac.uk/) using the name of the species as keyword (taxonomy ID:
3332) and filtering only coding regions. These sequences correspond to various datasets
accumulated between 2002 and 2010, which were obtained with Sanger sequencing, so
coverage statistics are not available.

12
RESULTS
PART 1 – FOCAL SPECIES: Taxus baccata
1.1. Identifying orthologs between Taxus baccata and the available protein database
for plants using blastx
In order to identify the English yew’s genes within a network, the first step was to annotate
the Taxus transcripts against available plant protein databases. To reach that objective I
used blastx, which finds similar proteins to translated query in a protein database. I
performed the search against three reference protein databases: Arabidopsis (Arabidopsis
thaliana), tomato (Solanum lycopersicum), and the black cottonwood (Populus
trichocarpa). The choice of these species was motivated because they represent model
species and a lot of information has accumulated in terms of proteins and pathways.
In a first step, I downloaded the blastx stand-alone program from the NCBI webpage
(http://blast.ncbi.nlm.nih.gov/Blast.cgi?CMD=Web&PAGE_TYPE=BlastDocs&DOC_TY
PE=Download).
In a second step, I downloaded from the NCBI database webpage
(ftp://ftp.ncbi.nlm.nih.gov/genomes/refseq/plant/) the latest assembly refseq-protein for the
three selected reference species:
- Arabidopsis (GCF_000001735.3_TAIR10_protein.faa),
- tomato (GCF_000188115.2_SL2.40_protein.faa),
- black cottonwood (GCF_000002775.3_Poptr2_0_protein.faa).
In a third step, I created with makeblastdb (a module from the blastx standalone program)
some BLAST databases using as input each of the three assembly refseq-protein, and with
the following arguments: in (input file), dbtype (molecular type input: protein), out (name
of BLAST database to be created).
The command lines to create the database are as follows:
> makeblastdb -in GCF_000001735.3_TAIR10_protein.faa -dbtype "prot" -out
TAIR10_protein
> makeblastdb -in GCF_000188115.2_SL2.40_protein.faa -dbtype "prot" -out
SL2.40_protein
> makeblastdb -in GCF_000002775.3_Poptr2_0_protein.faa -dbtype "prot" -out
Poptr2_0_protein
In a fourth step, I ran blastx with the following arguments: query (Taxus baccata
transcripts fasta file), db (TAIR10_protein, SL2.40_protein, or Poptr2_0_protein), evalue
(1e-10), and saving the output in out. The E-value describes the number of hits with a
particular score or higher that one can "expect" to see by chance when searching a database
13
of a particular size. The lower the E-value, or the closer it is to zero, the more "significant"
the match is. In order to extract the information needed to annotate the Taxus transcripts, I
specified in the output format the information I needed: the output is in tabulation format
(7), and with the query accession (qacc), the subject accession (sacc), the valor of the E-
value (evalue), as well as the percent of identity (pident).
The command lines to run blastx are the following:
> blastx -query Tbaccata_16810cds.fas -db TAIR10_protein -evalue 1e-10 -outfmt "7 qacc
sacc evalue pident" -out outputTbacTAIR10.txt
> blastx -query Tbaccata_16810cds.fas -db SL2.40_protein -evalue 1e-10 -outfmt "7 qacc
sacc evalue pident" -out outputTbacSL2.40.txt
> blastx -query Tbaccata_16810cds.fas -db Poptr2_0_protein -evalue 1e-10 -outfmt "7 qacc
sacc evalue pident" -out outputTbacPoptr2_0.txt
Finally, I used a script in Perl to extract the best hits of T. baccata with each of the three
protein databases, and that give the highest E-value, taking into account the percent of
identity between the query and subject sequences.
The command lines to get the best hits against each reference species are the following,
saving the resulting list in the output BestHit.txt:
> perl blastx_parsingTbacAth.pl > BestHitTbacAth.txt
> perl blastx_parsingTbacSly.pl > BestHitTbacSly.txt
> perl blastx_parsingTbacPtr.pl > BestHitTbacPtr.txt
From these outputs, I then extracted the RefSeq IDs for Arabidopsis, tomato and black
cottonwood using a Perl script.
The command lines to extract the RefSeq IDs for each reference species are the following,
keeping the resulting list in the output RefSeq.txt:
> perl extractSubjectIDTbacAth.pl > RefSeqTbacAth.txt
> perl extractSubjectIDTbacSly.pl > RefSeqTbacSly.txt
> perl extractSubjectIDTbacPop.pl > RefSeqTbacPop.txt
Comparative results in terms of number of hits are shown in Table 1. The largest number
of hits was obtained using as reference protein the database of black cottonwood (P.
trichocarpa), then tomato (S. lycopersicum), and finally Arabidopsis (A. thaliana). This
result is in agreement with the phylogenetic relationship among the species considered: the
yew is closer to the poplar, than to the two other dicotyledonous Arabidopsis and tomato
(see Figure 7).

14
Figure 7: Phylogenetic relationship among the
studied species (based on the Angiosperm
Phylogeny Website at
http://www.mobot.org/MOBOT/research/APweb/).
1.2. Identifying gene pathways in T. baccata
KEGG (Kyoto Encyclopedia of Genes and Genomes) is a database for pathway
information, which turns sequence information from a number of organisms into metabolic
or regulatory pathways. This site makes it easy to place genes into a functional context, and
to look for as yet unknown genes that might exist in an organism.
The pathways-database of KEGG is a graphical catalogue of metabolic (like
glycolysis or ATP synthesis) and regulatory (like apptosis or cell cycle) pathways. The
pathway mapping tool implemented in KEGG uses as input identifiers (IDs) from the
KEGG identifiers (KO), NCBI-GeneID, NCBI-gi and UniProt. I therefore converted the
RefSeq IDs into UniProtKB using the Retrieve/ID Mapping tool available in the UniProt
website (http://www.uniprot.org/) (UniProtTbacAth.txt, UniProtTbacPtr.txt,
UniProtTbacSly.txt). Comparative results in terms of number of hits and number of
pathways are shown in Table 1. The conversion of RefSeq IDs to UniProt IDs resulted in a
loss of accession numbers because some of the RefSeq IDs were not present in the UniProt
database, and because redundant accession numbers were removed. Results showed that the
maximum number of UniProt hits was found in black cottonwood (P. trichocarpa),
followed by Arabidopsis (A. thaliana), and finally by tomato (S. lycopersicum).
Then, the list of UniProtKB for each of the three protein databases was used as
input file in the KEGG website (http://www.genome.jp/kegg/), selecting Analysis Tools,
KEGG Mapper, Search&Color Pathway. Comparative results in terms of number of hits
and number of pathways are shown in Table 1. Results showed that the maximum number
of KEGG hits followed the same species order as for UniProt hits. The number of KEGG
pathway did not differ much across the three reference KEGG pathways, ranging between
123 to 128 gene pathways.

15
Table 1. Results from blastx, and KEGG
query
T. baccata (16810 genes)
subject
P. trichocarpa
subject
A. thaliana
subject
S. lycopersicum
# Best Hit RefSeq 12963 12724 12875
# UniProt hits 9685 9109 5222
# KEGG hits (redundant across pathways) 5019 4803 3305
# KEGG pathways 126 128 123
Because the P. trichocarpa RefSeq database gave the highest number of hits, I used this
database as reference for identifying the gene pathways associated to T. baccata transcripts.
Results are presented in Figure 8. The full pathway list is provided in the digital material
gene_pathway_1.txt.
Figure 8. Classification of the T. baccata transcripts based on P. trichocarpa reference
gene pathway network.
The majority of the transcripts in T. baccata, based on P. trichocarpa gene
pathways, are involved in metabolic pathways (19%), followed by the biosynthesis of
amino acids (9%). The remaining pathways include each less than 5% of the transcripts. Of
the 5019 transcripts, 2152 are unique but appeared in more than one gene pathway.

16
The approach used in PART 1 to annotate the Taxus transcripts is not optimal
because the reference species (Arabidopsis, tomato, and black cottonwood) are
phylogenetically far away from T. baccata, and the blastx used to find orthologues may not
have found the true hit between the query and the database. To get around this major
drawback, in PART 2 the strategy was reconsidered, using a phylogenetically closer
species to Taxus for annotating the transcripts (the conifer Sitka spruce, Picea sitchensis),
and using tblastx combined with bi-directional best hit (BBH) to identify more stringent
hits (i.e. orthologues).
1.3. The specific case of the taxol pathway
The natural synthesis of paclitaxel involves around 19 enzymatic steps, for which 12 genes
have been identified (Jennewein et al. 2004). Among them, five genes play a key role
(Croteau et al. 2006) and were sequenced in Taxus baccata in a previous study (Burgarella
et al. 2012): TXS (accession number in EMBL⁄ GenBank Data Libraries: TXS (JQ618958–
JQ618996), T5aH (JQ618850–JQ618882), TAT (JQ618883–JQ618920), TBT (JQ618921–
JQ618957) and DBAT (JQ611228–JQ611267) (Table 2).
Table 2. Candidate genes from the taxol pathway sequenced in Taxus baccata.
Gene Gene
code
Function within the taxol biosynthetic pathway
Taxadiene synthetase TXS Cyclization of the prenyl diphosphate precursor
geranylgeranyl diphosphate to taxadiene
Taxadiene-5-a-hydroxilase T5aH Hydroxilation of taxadiene C5 to taxadienol (first
oxygenation step)
Taxadienol acetyl transferase TAT Converts the second specific pathway intermediate,
taxa-4(20),11(12)-dien-5a-ol in acetate ester (first of
the five acyltransferase steps)
2-a-hidroxitaxane
2-O-benzoiltransferase
TBT Benzoylation of the C2a-hydroxyl group of the
advanced taxane intermediate (second acylation
reaction)
10-deacetylbaccatin
III-10-o-acetyl-transferase
DBAT
Converts 10-deacetylbaccatin III to the last
intermediate terpenoid before taxol, baccatin III
(third of the five acyltransferase steps)
When running the blastx of T. baccata against the different plant RefSeq databases
(Arabidopsis, tomato, black cottonwood), and mapping the UniProt hits on KEGG
pathways specific to black cottonwood, no hit was found with genes involved in the
paclitaxel pathway. This result was somehow expected as none of the reference species is
expected to produce taxol. Therefore, to identify potential genes involved in the taxol
production in T. baccata transcriptomic dataset, I ran a blastx of T. baccata transcripts
against the five selected genes involved in the taxol pathway.
The first step was to build a protein database of the five target genes:
> makeblastdb –in 5protTaxol.fas –dbtype prot –out 5Tax

17
Then, the second step was to run the blastx of T. baccata transcriptome against the protein
database constituted by the five proteins involved in the taxol pathway:
> blastx -query Tbaccata_16810cds.fas -db 5Tax -evalue 1e-10 -outfmt "7 qacc sacc evalue
pident score qstart qend length qframe" -out Tbac_5Tax.txt
The blastx identified multiple hits of T. baccata transcripts with the five genes involved
in the taxol production (see edited output in Tbac_5Tax.xls), of which four hits gave the
best matches (see details in Table 3). The transcript Tbac_contig_34208 gives a best hit
with both TAT and DBAT, but the blastx statistics indicate that TAT would be a better
match than DBAT. The pairwise alignment performed with ClustalW (Thompson et al.
1994) of Tbac_contig_34208 with TAT and with DBAT (align34208_TAT_clean.fas)
confirmed the better alignment of Tbac_contig_34208 with TAT than with DBAT. TBT in
T. baccata presents 45% of missing nucleotides, and does not constitute a good subject;
therefore, the resulting multiple hits were not informative (results not shown).
Table 3. Results of the blastx for T. baccata transcripts against the 5 proteins involved in
the taxol pathway.
nucleotide query protein
subject evalue % identity score
alignment
length
Tbac_contig_24006 TXS 0 99.55 2270 440
Tbac_contig_71401 T5H 0 94.76 1913 382
Tbac_contig_34208 TAT 0 98.48 1988 395
Tbac_contig_34208 DBAT 6.00E-175 64.36 1261 390
The pairwise alignment between the transcripts from T. baccata de novo assembly and four
of the genes involved in the taxol pathway (align24006_TXS_clean.fas,
align71401_T5H_clean.fas, align34208_TAT_clean.fas) revealed that all transcripts
present missing regions that correspond to non-coding regions.
1.4. Studying the evolution of T. baccata gene networks
Based on specific gene networks, one could analyze the ratio between nonsynonymous and
synonymous substitution rates (dN/dS) between T. baccata and the different reference
species (in particular, P. sitchensis), and see whether the network topology influence the
evolutionary rate.
A first step would be to identify some molecular pathways relevant to T. baccata
adaptation. These would be related to: phenology (involving genes such as e.g.
phytochromes, constans), growth (e.g. glutamate synthetases), tolerance to abiotic stresses
(e.g. dehydrins), defense against herbivores and pathogens (e.g. terpenes, and especially
taxanes). Then, in a second step, the program codeml implemented in the package PAML
4.4 (Phylogenetic Analysis by Maximum Likelihood; Yang, 2007) could be used to
compare different codon-based models that are based on the ω ratio (the ratio of non-

18
synonymous dN to synonymous dS substitution rates). Two models could be tested; a branch
model that tests whether the ω ratios are different among linages, and a site specific model
that tests whether the ω ratio varies among codons within a gene.
Because of time constraints, this section could not be completed within the four-
month period of the Master Thesis.
PART2 – FOCAL SPECIES: T. baccata, T. cuspidata, T. wallichiana
2.1. Identifying orthologs between the outgroup (Picea sitchensis) and the target
species (Taxus baccata, Taxus cuspidata, and Taxus wallichiana)
2.1.1. Finding orthologs
In order to identify orthologues across the four species (i.e. the outgroup Sitka spruce and
the three target yew species), I performed a tblastx, which converts a nucleotide query
sequence into protein sequences in all 6 reading frames and then compares this to an NCBI
nucleotide database which has been translated in all six reading frames.
In a first step, three tblastx were performed using the tblastx stand-alone program
from the BLAST package, in which the query corresponds to the nucleotide loci of each of
the Taxus species, and the database to the P. sitchensis nucleotide loci, with the following
argument: query (Taxus fasta file), db (P. sitchensis CDS fasta file), evalue (1e-10), and
saving the output in out.
In order to extract the information I needed, I specified in the output format (outfmt)
the following options: the output is in tabulation format (7), and with the query accession
(qacc), the subject accession (sacc), the valor of the E-value (evalue), the percent of
identity (pident), the raw score (score; BLAST finds alignments with high raw scores,
which are calculated by adding together the substitution scores of the alignment - the
substitution score being based on amino acid substitutions in real amino acid sequences that
are more than 62% identical in the BLOSUM62 matrix), the start of the alignment in query
(qstart), the end of the alignment in query (qend), the alignment length (length), as well as
the query frame (qframe), maximum number of different subject to which the query is
aligned to (max_taregt_seqs), as well as the number of threads (CPUs) to use in the BLAST
search (num_threads).
The P. sitchensis database was built with the stand-alone makeblastdb:
> makeblastdb -in Picea_sitchensisCDS.fasta -dbtype nucl -out PsitCDS
Then, the tblastx was performed as follows for each of the three Taxus species:
> tblastx -query Tbaccata_16810cds.fas -db psitCDS -evalue 1e-10 -outfmt "7 qacc sacc
evalue pident score qstart qend length qframe " -out homologous.aa_TbacPsit.txt -
max_target_seqs 3 - num_threads 6
19
> tblastx -query Tcuspidata_20460contigs.fas -db psitCDS -evalue 1e-10 -outfmt "7 qacc
sacc evalue pident score qstart qend length qframe " -out homologous.aa_TcusPsit.txt -
max_target_seqs 3 - num_threads 6
> tblastx -query Twallichiana_15735contigs.fas -db psitCDS -evalue 1e-10 -outfmt "7 qacc
sacc evalue pident score qstart qend length qframe " -out homologous.aa_TwalPsit.txt -
max_target_seqs 3 - num_threads 6
Because more than one Picea ID corresponded to each Taxus ID, the bi-directional
best hit assignment method (BBH) was used to select the best orthologues. The match is
bidirectional if the two genes are best hits of each other. A bidirectional best hit represents
a very strong similarity between two genes, and is considered evidence that the genes may
arise from a common ancestor.
BBH was performed for P. sitchensis against the three Taxus species T. baccata, T.
cuspidata and T. wallichiana. The three Taxus databases were built with the stand-alone
makeblastdb:
> makeblastdb -in Tbaccata_16810cds.fasta -dbtype nucl -out TbacCDS
> makeblastdb -in Tcuspidata_20460contigs.fas -dbtype nucl -out TcusCDS
> makeblastdb -in Twallichiana_15735contigs.fas -dbtype nucl -out TwalCDS
Then, the tblastx was performed as follows for each of the three Taxus species:
> tblastx -query Picea_sitchensisCDS.fasta –db TbacCDS -evalue 1e-10 -outfmt "7 qacc
sacc evalue pident score qstart qend length qframe " -out homologous.aa_PsitTbac.txt -
max_target_seqs 3 - num_threads 6
> tblastx -query Picea_sitchensisCDS.fasta –db TcusCDS -evalue 1e-10 -outfmt "7 qacc
sacc evalue pident score qstart qend length qframe " -out homologous.aa_PsitTcus.txt -
max_target_seqs 3 - num_threads 6
> tblastx -query Picea_sitchensisCDS.fasta –db TwalCDS -evalue 1e-10 -outfmt "7 qacc
sacc evalue pident score qstart qend length qframe " -out homologous.aa_PsitTwal.txt -
max_target_seqs 3 - num_threads 6
In a second step, I used a script in Perl to extract the best hits from the six tblastx outputs,
based on the best score. Best score was preferred over the combination of E-value and
percent of identity (cf. PART 1) as the latter favors short transcripts.
> perl tblastx_parsingBBHscore_TbacPsit3.pl
This script gives the best scores between T. baccata vs. P. sitchensis
(BestHitTbacPistscore3.txt).
> perl tblastx_parsingBBHscore_TcusPsit3.pl
This script gives the best scores between T. cuspidata vs. P. sitchensis
(BestHitTcusPistscore3.txt).
> perl tblastx_parsingBBHscore_TwalPsit3.pl
This script gives the best scores between T. wallichiana vs. P. sitchensis
(BestHitTwalPistscore3.txt).
> perl tblastx_parsingBBHscore_PsitTbac3.pl
This script gives the best scores between P. sitchensis vs. T. baccata
(BestHitPistTbacscore3.txt).
> perl tblastx_parsingBBHscore_PsitTcus3.pl
20
This script gives the best scores between P. sitchensis vs. T. cuspidata
(BestHitPistTcusscore3.txt).
> perl tblastx_parsingBBHscore_PsitTwal3.pl
This script gives the best scores between P. sitchensis vs. T. wallichiana
(BestHitPistTwalscore3.txt).
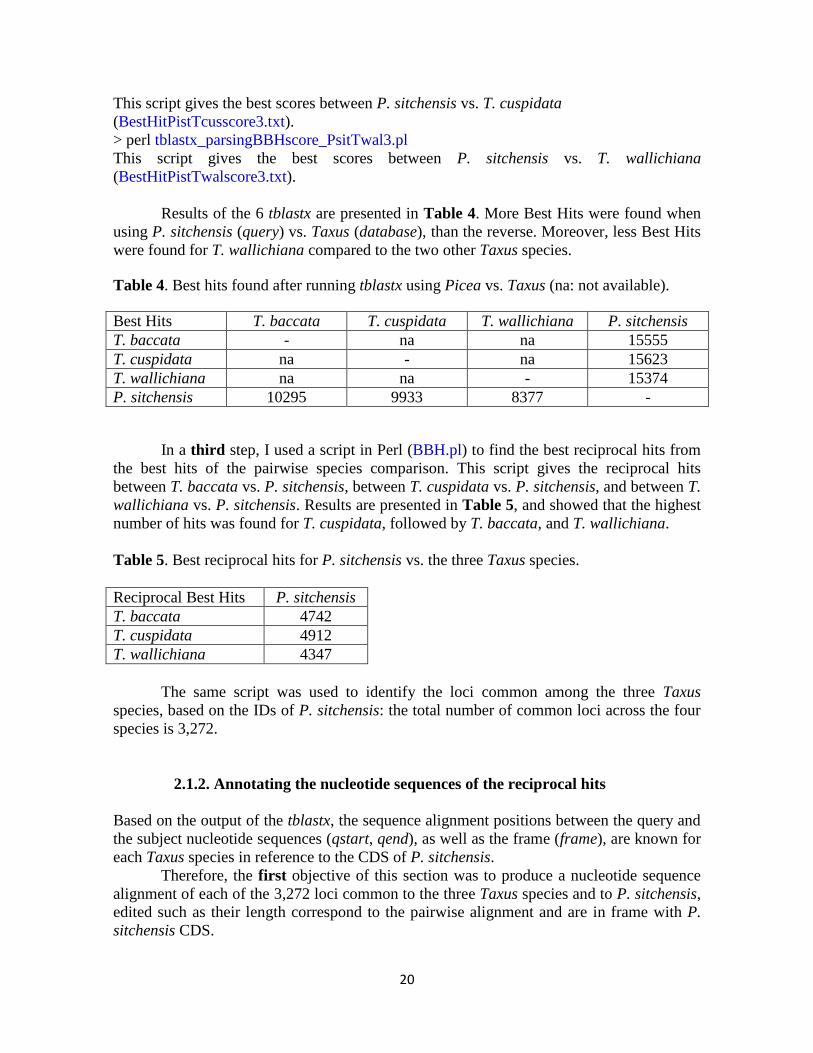
Results of the 6 tblastx are presented in Table 4. More Best Hits were found when
using P. sitchensis (query) vs. Taxus (database), than the reverse. Moreover, less Best Hits
were found for T. wallichiana compared to the two other Taxus species.
Table 4. Best hits found after running tblastx using Picea vs. Taxus (na: not available).
Best Hits T. baccata T. cuspidata T. wallichiana P. sitchensis
T. baccata - na na 15555
T. cuspidata na - na 15623
T. wallichiana na na - 15374
P. sitchensis 10295 9933 8377 -
In a third step, I used a script in Perl (BBH.pl) to find the best reciprocal hits from
the best hits of the pairwise species comparison. This script gives the reciprocal hits
between T. baccata vs. P. sitchensis, between T. cuspidata vs. P. sitchensis, and between T.
wallichiana vs. P. sitchensis. Results are presented in Table 5, and showed that the highest
number of hits was found for T. cuspidata, followed by T. baccata, and T. wallichiana.
Table 5. Best reciprocal hits for P. sitchensis vs. the three Taxus species.
Reciprocal Best Hits P. sitchensis
T. baccata 4742
T. cuspidata 4912
T. wallichiana 4347
The same script was used to identify the loci common among the three Taxus
species, based on the IDs of P. sitchensis: the total number of common loci across the four
species is 3,272.
2.1.2. Annotating the nucleotide sequences of the reciprocal hits
Based on the output of the tblastx, the sequence alignment positions between the query and
the subject nucleotide sequences (qstart, qend), as well as the frame (frame), are known for
each Taxus species in reference to the CDS of P. sitchensis.
Therefore, the first objective of this section was to produce a nucleotide sequence
alignment of each of the 3,272 loci common to the three Taxus species and to P. sitchensis,
edited such as their length correspond to the pairwise alignment and are in frame with P.
sitchensis CDS.
21
The second objective of this section was then to align the four species based on the
proteins in order to have the sequences aligned to the codons. The program TranslatorX
server (http://translatorx.co.uk/) will be used to achieve this objective: in a first step the
nucleotide sequences will be aligned, then translated to amino acids that will be aligned,
and finally reverse-translated back to nucleotides. This final output (i.e. aligned triplets of
nucleotide for the four species) will be used as input to study the evolution of these genes
within a phylogenetic context.
Because of time constraints, this section could not be completed within the four-
month period of the Master Thesis.
2.2. Identifying common gene pathways associated to Taxus transcripts
In order to define gene network for our four species, I explored two different options:
Defining gene networks based on single-species gene pathways
In the first option, as in PART 1, I used blastx using as query each of the four species and
as database the refseq-protein of the black cottonwood (Populus trichocarpa), based on
results found in PART 1.
In a first step, I ran the following command lines:
> blastx -query Tbaccata_16810cds.fas -db PopTr2_0_protein -evalue 1e-10 -outfmt "7
qacc sacc evalue pident" -out outputTbacPoptr2_0.txt
> blastx -query Tcuspidata_20460contigs.fas -db PopTr2_0_protein -evalue 1e-10 -outfmt
"7 qacc sacc evalue pident" -out outputTcusPoptr2_0.txt
> blastx -query Twallichiana_15735contigs.fas -db PopTr2_0_protein -evalue 1e-10 -
outfmt "7 qacc sacc evalue pident" -out outputTwalPoptr2_0.txt
> blastx -query Psitchensis_15862contigs.fas -db PopTr2_0_protein -evalue 1e-10 -outfmt
"7 qacc sacc evalue pident" -out output outputPsitPoptr2_0.txt
In a second step, I used a script in Perl to extract the best hits with the database for each
species. The command lines to get the best hits against each reference species are the
following, keeping the resulting list in the output BestHit.txt:
> perl blastx_parsingTbacPtr.pl > BestHitTbacPtr.txt
> perl blastx_parsingTcusPtr.pl > BestHitTcusPtr.txt
> perl blastx_parsingTwalPtr.pl > BestHitTwalPtr.txt
> perl blastx_parsingPsitPtr.pl > BestHitPsitPtr.txt
The command lines to extract the RefSeq IDs for target species are the following, keeping
the resulting list in the output RefSeq.txt:
> perl extractSubjectIDTbacPtr.pl > RefSeqTbacPtr.txt
> perl extractSubjectIDTcusPtr.pl > RefSeqTbacPtr.txt
> perl extractSubjectIDTwalPtr.pl > RefSeqTbacPtr.txt
> perl extractSubjectIDPsitPtr.pl > RefSeqPsitPtr.txt

22
Comparative results in terms of number of hits and number of pathways are shown
in Table 6. Then, after converting the RefSeq IDs into UniProtKB (UniProtTbacPtr.txt,
UniProtTcusPtr.txt, UniProtTwalPtr.txt, UniProtPsitPtr.txt), the pathway mapping tool
implemented in KEGG was used to identify the KEGG pathways for each of the four
species (uniprotKEGG_Tbac.txt, uniprotKEGG_Tcus.txt, uniprotKEGG_Twal.txt,
uniprotKEGG_Psit.txt). Comparative results in terms of number of hits and number of
pathways are shown in Table 6. Results showed that the maximum number of UniProt hits
was found first in T. baccata, second in T. cuspidata, third in T. wallichiana, and finally in
P. sitchensis. The number of KEGG pathways did not differ much across the three
reference KEGG pathways, ranging between 122 to 126 gene pathways.
Table 6. Single-directional best hit based on blastx for the four Taxus species against the
Populus RefSeq database.
query
PopTr2_0
subject
T. baccata
subject
T. cuspidata
subject
T. wallichiana
subject
P. sitchensis
SBH RefSeq 12963 12419 10925 14242
UniProt hits 9685 9562 8554 5580
KEGG hits
(redundant across
pathways)
5025 4770 4332 3094
KEGG pathways 126 124 125 122
Common unique UniProt hits across the four species were compiled using a Perl script
(common4.pl), and led to a total of 495 common UniProt IDs. This UniProt list was used as
input in the KEGG website (http://www.genome.jp/kegg/), selecting Analysis Tools,
KEGG Mapper, Search&Color Pathway. The number of KEGG pathways in which the 495
common UniProt IDs are involved is of 105. Figure 9 shows the 54 pathways containing at
least 0.5% of the total number of UniProt IDs that are redundant among pathways (1,165).
The full pathway list is provided in in the digital material gene_pathway_2.txt.
.

23
Figure 9. Number of common UniProt IDs across the four species for each of the 54 most
frequent pathways based on P. trichocarpa reference gene pathway network.
The pathways with the majority of UniProt IDs are similar across the species (data not
shown) and are related to Metabolic pathway, Biosynthesis of secondary metabolites,
Ribosome, Biosynthesis of amino acids, Carbon metabolism, Oxidative phosphorylation,
Spliceosome, RNA transport, Purine metabolism, Pyrimidine metabolism and Protein
processing in endoplasmic reticulum.
Defining gene networks based on multi-species gene pathways
In the second option, I used the KEGG Automatic Annotation Server website (KAAS:
http://www.genome.jp/tools/kaas/) to define gene networks. This online application takes
nucleotide fasta files as input and assigns to each of them a Reference pathway (KO), using
the assignment method single-directional best hit (SBH) as well as bi-directional best hit
(BBH).
Genes datasets can be selected among various species, and I selected the nine plant
species available: Arabidopsis thaliana (thale cress; ath), Arabidopsis lyrata (lyrate
rockcress; aly), Theobroma cacao (cacao; tcc), Glycine max (soybean; gmx), Fragaria
vesca (woodland strawberry; fve), Vitis vinifera (wine grape; csv), Vitis vinifera (wine

24
grape; vvi), Solanum lycopersicum (tomato; sly), and Oryza sativa japonica (Japanese rice;
osa).
The KAAS website was used to determine the KO for the four species, using first the
SBH assignment method (Psit1895KO_SBH.txt, Tbac2779KO_SBH.txt,
Tcus3037KO_SBH.txt, Twal2584KO_SBH.txt). Results are presented in Table 7.
Table 7. Assignments of transcripts for the four species to Reference pathways (KO) using
the assignment method SBH.
KAAS-SBH T. baccata T. cuspidata T. wallichiana P. sitchensis
KO (redundant
across pathways)
6396 6483 5390 8539
KO unique 2779 3037 2584 1895
KEGG pathways 331 332 330 323
Unique KOs common across the four species were compiled using a Perl script
(commonKOspSBH.pl), and led to a total of 1487 common KO. This KO list was used as
input in the KEGG website (http://www.genome.jp/kegg/), selecting Analysis Tools,
KEGG Mapper, Search&Color Pathway. The number of KEGG pathways in which the
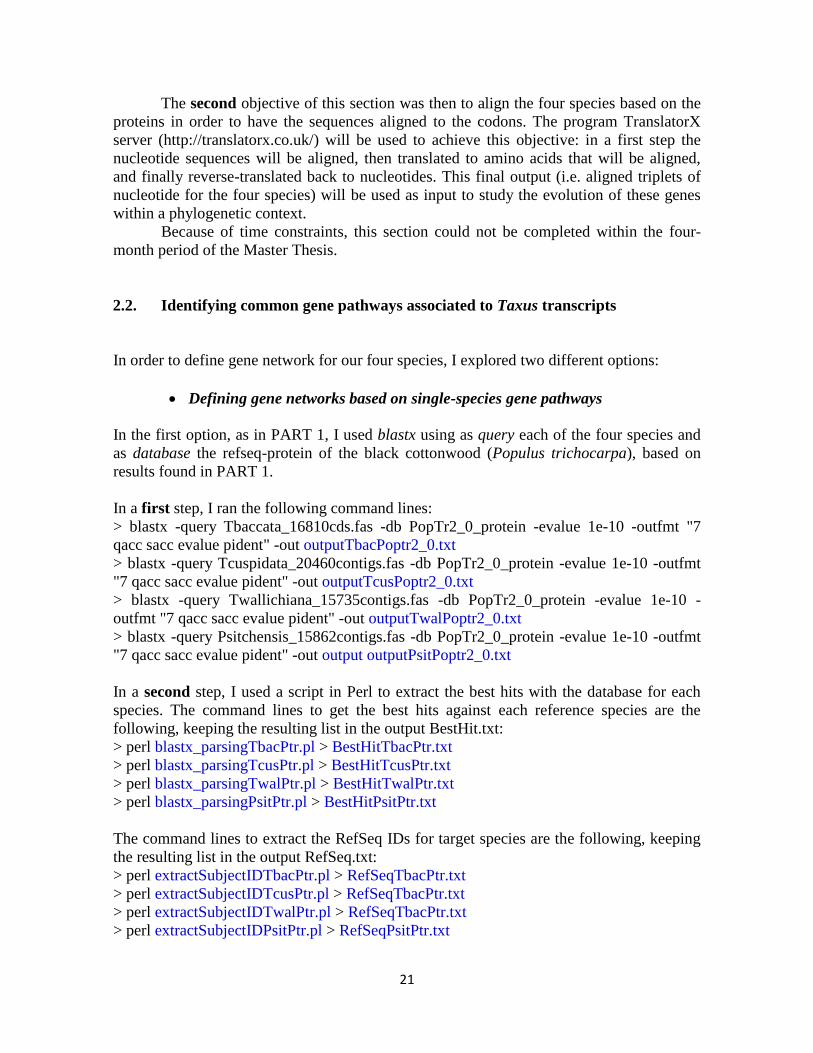
1,487 KOs are involved is of 318. Figure 10 shows the 39 pathways containing at least
0.5% of the total number of KOs that are redundant among pathways (3,423). The full
pathway list is provided in in the digital material gene_pathway_3.txt.
25
Figure 10. Number of common KO IDs across the four species for each of the 39 most
frequent pathways based on multi-species reference gene pathway network, using the
assignment method SBH.
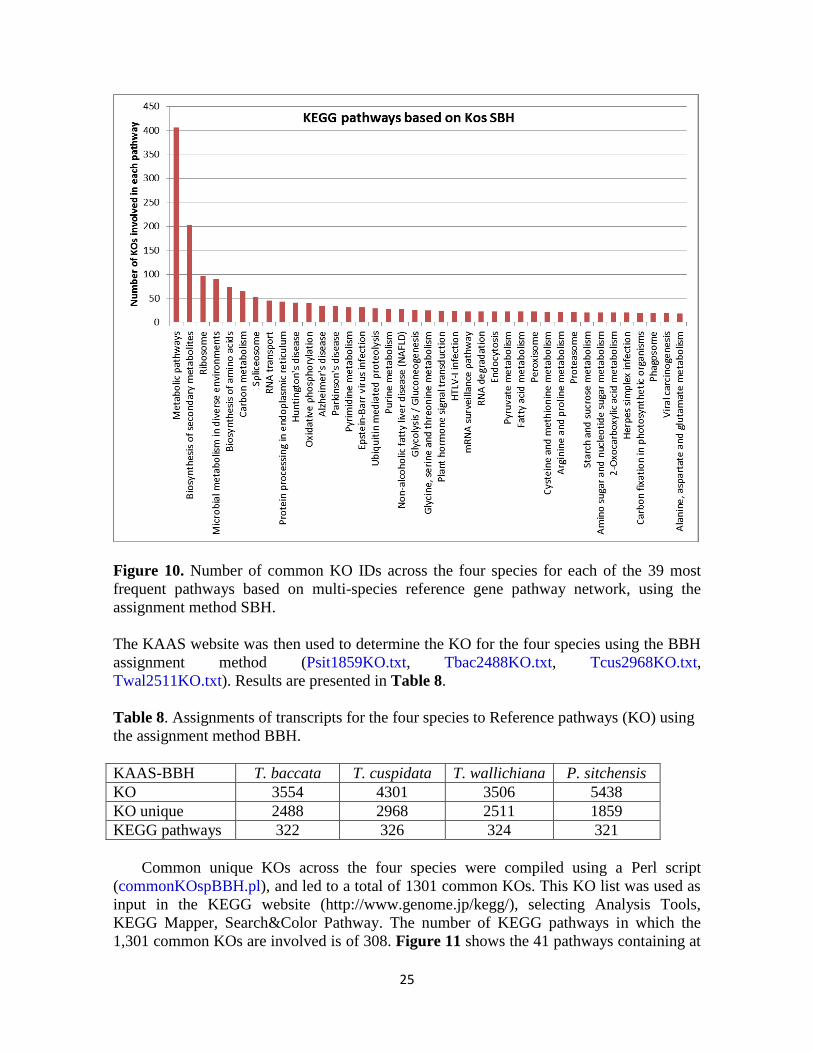
The KAAS website was then used to determine the KO for the four species using the BBH
assignment method (Psit1859KO.txt, Tbac2488KO.txt, Tcus2968KO.txt,
Twal2511KO.txt). Results are presented in Table 8.
Table 8. Assignments of transcripts for the four species to Reference pathways (KO) using
the assignment method BBH.
KAAS-BBH T. baccata T. cuspidata T. wallichiana P. sitchensis
KO 3554 4301 3506 5438 KO unique 2488 2968 2511 1859 KEGG pathways 322 326 324 321
Common unique KOs across the four species were compiled using a Perl script
(commonKOspBBH.pl), and led to a total of 1301 common KOs. This KO list was used as
input in the KEGG website (http://www.genome.jp/kegg/), selecting Analysis Tools,
KEGG Mapper, Search&Color Pathway. The number of KEGG pathways in which the
1,301 common KOs are involved is of 308. Figure 11 shows the 41 pathways containing at
26
least 0.5% of the total number of KOs that are redundant among pathways (2,970). The full
pathway list is provided in in the digital material gene_pathway_4.txt.
Figure 11. Number of common KO IDs across the four species for each of the 39 most
frequent pathways based on multi-species reference gene pathway network, using the
assignment method BBH.
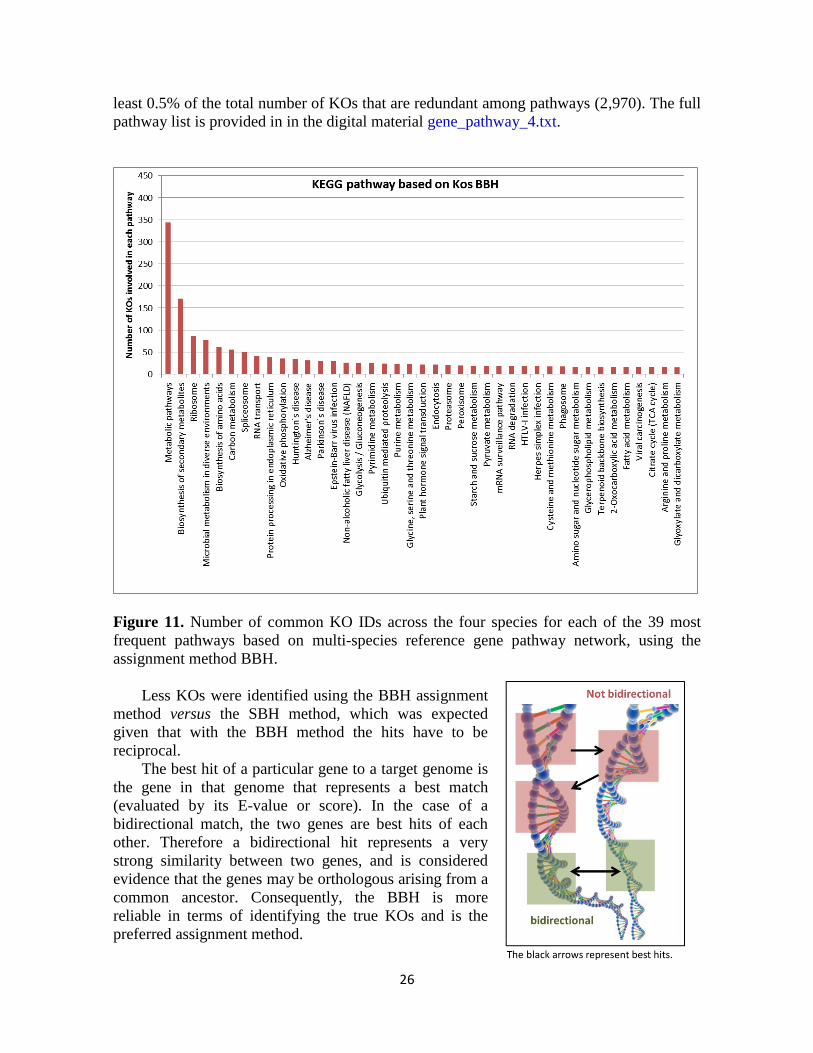
Less KOs were identified using the BBH assignment
method versus the SBH method, which was expected
given that with the BBH method the hits have to be
reciprocal.
The best hit of a particular gene to a target genome is
the gene in that genome that represents a best match
(evaluated by its E-value or score). In the case of a
bidirectional match, the two genes are best hits of each
other. Therefore a bidirectional hit represents a very
strong similarity between two genes, and is considered
evidence that the genes may be orthologous arising from a
common ancestor. Consequently, the BBH is more
reliable in terms of identifying the true KOs and is the
preferred assignment method.
27
The pathways with the majority of KOs are the same whatever the assignment methods
(SBH and BBH), and the species (data not shown): Metabolic pathway, Biosynthesis of
secondary metabolites, Ribosome, Microbial metabolism in diverse environments,
Biosynthesis of amino acids, Carbon metabolism and Spliceosome.
More KOs and pathways were identified based on multi-species reference information
than only on black cottonwood. However, many of the pathways inferred from multi-
species information are not related to plant pathways, while pathways inferred from black
cottonwood make more sense biologically.
2.3. Studying the evolution (dN/dS) of the common transcripts within a
phylogenetic context
The program codeml implemented in the package PAML 4.4 (Phylogenetic Analysis by
Maximum Likelihood; Yang, 2007) will be used to compare different codon-based models
that are based on the ω ratio (the ratio of non-synonymous dN to synonymous dS
substitution rates). The ω ratio, if heterogeneous among lineages, indicates a violation of
the neutral model of sequence evolution. Likelihood ratio tests will be used to compare the
models.
The two input files required to run codeml are the nucleotide sequence alignment of
the four species, and a tree indicating the phylogenetic relationships among the four
species. The phylogenetic relationships among the three Taxus species are given in Leslie
et al. (2012) based on three genes that have been generally used to construct phylogenetic
relationships within and among the major conifer clades: two chloroplast genes (matK and
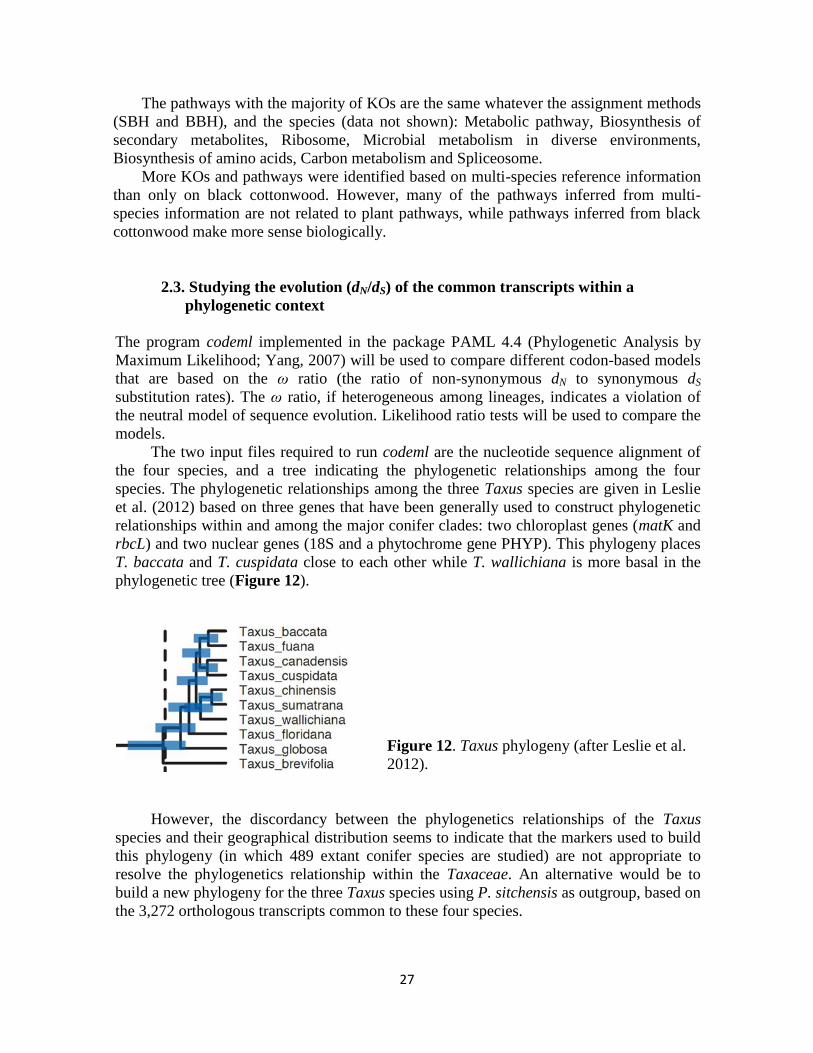
rbcL) and two nuclear genes (18S and a phytochrome gene PHYP). This phylogeny places
T. baccata and T. cuspidata close to each other while T. wallichiana is more basal in the
phylogenetic tree (Figure 12).
Figure 12. Taxus phylogeny (after Leslie et al.
2012).
However, the discordancy between the phylogenetics relationships of the Taxus
species and their geographical distribution seems to indicate that the markers used to build
this phylogeny (in which 489 extant conifer species are studied) are not appropriate to
resolve the phylogenetics relationship within the Taxaceae. An alternative would be to
build a new phylogeny for the three Taxus species using P. sitchensis as outgroup, based on
the 3,272 orthologous transcripts common to these four species.
28
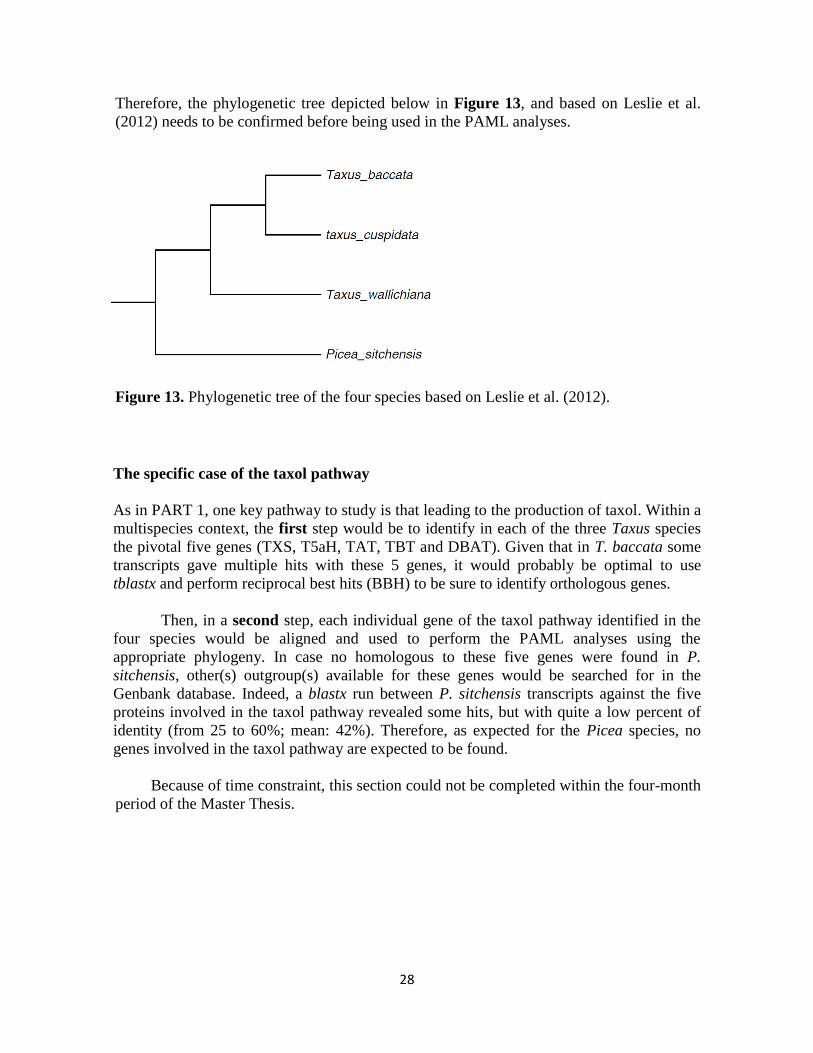
Therefore, the phylogenetic tree depicted below in Figure 13, and based on Leslie et al.
(2012) needs to be confirmed before being used in the PAML analyses.
Figure 13. Phylogenetic tree of the four species based on Leslie et al. (2012).
The specific case of the taxol pathway
As in PART 1, one key pathway to study is that leading to the production of taxol. Within a
multispecies context, the first step would be to identify in each of the three Taxus species
the pivotal five genes (TXS, T5aH, TAT, TBT and DBAT). Given that in T. baccata some
transcripts gave multiple hits with these 5 genes, it would probably be optimal to use
tblastx and perform reciprocal best hits (BBH) to be sure to identify orthologous genes.
Then, in a second step, each individual gene of the taxol pathway identified in the
four species would be aligned and used to perform the PAML analyses using the
appropriate phylogeny. In case no homologous to these five genes were found in P.
sitchensis, other(s) outgroup(s) available for these genes would be searched for in the
Genbank database. Indeed, a blastx run between P. sitchensis transcripts against the five
proteins involved in the taxol pathway revealed some hits, but with quite a low percent of
identity (from 25 to 60%; mean: 42%). Therefore, as expected for the Picea species, no
genes involved in the taxol pathway are expected to be found.
Because of time constraint, this section could not be completed within the four-month
period of the Master Thesis.
29
DISCUSSION
During the Master Thesis I have explored different datasets and approaches in order to have
a better idea of the analyses I could perform to reach the main objectives defined before
starting the project. These objectives were modified during the four-month time frame
period of the Master project, as new datasets were added to the study. Below I summarize
what I have learned and what would be the steps I would follow to complete the ongoing
analyses and reach the different objectives.
Species:
Given that transcriptomic data was available for only one individual in T. baccata, it made
sense to orientate the analyses towards interspecies analyses, and perform multi-species
comparative studies. These new objectives will allow getting some insight on the adaptive
evolution of three Taxus species, and seeing whether they present similar or divergent
evolution for some genes of interest for their genetic adaptation.
Annotation of the transcripts:
- Choice of the reference species for annotation: from the different options tested, it
appeared that Taxus is phylogenetically closer to Picea sitchensis (conifer species) than to
any other plant species tested (and for which a gene pathway is available in KEGG).
However, no gene pathway reference is available for Picea, and therefore, a two-step
process has to be used to first annotate the Taxus genes (using Picea sitchensis as
reference), and second to identify the gene network for them (using Populus trichocarpa as
reference).
- Criteria to select the best hits: two options were tested to select the best hits after running
the blastx (PART 1) and tblastx (PART 2), as well as the combination of E-value and
percent of identity versus the raw score. The first option (evalue + pident) favor the
selection of short fragments and was thus discarded, especially when performing reciprocal
best hits with tblastx as many short fragments were detected.
- Choice of the assignment method for tblastx: two assignment methods were tested, the
single-directional best hit (SBH) and the bi-directional best hit (BBH) methods. The second
method was preferred against the first as the reciprocal hits guaranties better the correct
annotation of the genes. However, when comparing the two methods to identify gene
pathways (KAAS) no big differences were found in terms of the number of KEGG
identifiers or the number of KO pathways.
Gene pathways:
Three options were explored to identify gene pathways in Taxus: (i) two non-tree plant
model species (tomato and Arabidopsis), (ii) one tree species (black cottonwood), and (iii)
a combination of nine plant species (not including any tree, except for the cocoa tropical
30
tree). More pathways were identified for Taxus when selecting options (iii), then option (ii)
and finally option (i). Although option (iii) would be the best in terms of the higher number
of hits detected, many of the identified pathways were not related to plant kingdom, but to
the human gene pathway. This result is somehow puzzling and one explanation may be that
one or more plant species may be badly annotated. On the other hand, most of the gene
pathways identified using Populus as reference, although less numerous, are more specific
to plant kingdom and should therefore be favored.
The taxol production pathway seems a promising network to study more into details
as we found matches between all three Taxus transcriptomic datasets and the five targeted
genes involved in the taxol pathways (percent of identity up to 100% for T. baccata and T.
cuspidata, and up to 99% for T. wallichiana). In addition to the five targets genes presented
in this study, additional genes could be included (around 10) to reach a more complete
network.

31
CONCLUSION
The work realized during the Master Thesis has allowed me to (i) understand better the
datasets that were made available to me, (ii) investigate different approaches to analyze
these datasets, and finally (iii) build a workflow that will allow me reaching the different
objectives proposed. The chart below summarizes the steps that have been undertaken and
that will be further continued to finalize the work.

32
REFERENCES
Ahuja M, Neale D (2005) Evolution of genome size in conifers. Silvae Genetica, 54, 126–
137.
Birol I, Raymond A, Jackman SD et al. (2013) Assembling the 20 Gb white spruce (Picea
glauca) genome from whole-genome shotgun sequencing data. Bioinformatics, 29,
1492–1497.
Burgarella C, Navascués M, Zabal-Aguirre M, Berganzo E, Riba M, Mayol M, Vendramin
GG, González-Martínez SC. 2012. Recent population decline and selection shape
diversity of taxol-related genes. Molecular Ecology 21(12): 3006-3021.
Croteau R, Ketchum REB, Long RM, Kaspera R, Wildung MR. 2006. Taxol biosynthesis
and molecular genetics. Phytochemistry Reviews 5: 75–97.
Davila-Velderrain J, Servin-Marquez A, Alvarez-Buylla R (2014) Molecular evolution
constraints in the floral organ specification gene regulatory network module across 18
Angiosperm genomes. Mol. Biol. Evol. 31(3): 560–573.
Dubreuil M, Sebastiani F, Mayol M, González-Martínez SC, Riba M, et al. (2008) Isolation
and characterization of polymorphic nuclear microsatellite loci in Taxus baccata L.
Conservation Genetics 9: 1665-1668.
Farjon, A. 2010. A Handbook of the World’s Conifers. E.J. Brill, Leiden/Boston.
Hao DC, Ge G, Xiao P, Zhang YY, Yang L. 2011. The first insight into the tissue specific
Taxus Transcriptome via Illumina second generation sequencing. PLoS ONE 6(6):
e21220.
Hultén E and Fries M. 1986. Atlas of North European Vascular Plants: North of the Tropic
of Cancer I-III. Koeltz Scientific Books, Königstein, Germany.
Jennewein S, Wildung MR, Chau M, Walker K, Croteau R. 2004. Random sequencing of
an induced Taxus cell cDNA library for identification of clones involved in Taxol
biosynthesis. Proceedings of the National Academy of Sciences of the United States of
America 101: 9149–9154.
Lee E-K, Jin Y-W, Park JH (11 co-authores) 2010. Cultured cambial meristematic cells as a
source of plant nautral products. Nature biotechnology 28: 1213–1217.
Mayol M et al. (in review) Adapting through glacial cycles: insights from a long-lived tree.
Neale D, Wegrzyn J, Stevens K et al. (2014) Decoding the massive genome of Loblolly
pine using haploid DNA and novel assembly strategies. Genome Biology, 15, R59.
Nystedt B, Street NR, Wetterbom A et al. (2013) The Norway spruce genome sequence and
conifer genome evolution. Nature, 497, 579–584.
Olson-Manning CF, Wagner MR, Mitchell-Olds T (2012) Adaptive evolution: evaluating
empirical support for theoretical predictions. Nature Reviews Genetics 13: 867.
Thomas PA and Polwart A. 2003. Biological flora of the British Isles: Taxus baccata L.
Journal of Ecology 91: 489-524.
Thompson JD, Higgins DG, Gibson TJ (1994). CLUSTAL W: improving the sensitivity of
progressive multiple sequence alignment through sequence weighting, position-specific
gap penalties and weight matrix choice. Nucleic Acids Res. 22: 4673-4680.
Yang Z. 2007. PAML 4: phylogenetic analysis by maximum likelihood. Molecular
Biology and Evolution 24: 1586-1591.

33
ACKOWLEDGMENTS
I am very grateful to Federico Abascal (CNIO) for accepting to be my tutor for this
Master project and for his advices, patience and availability, as well as to Santiago C.
González-Martínez (INIA) for his collaboration and constant motivation for this ongoing
project.
Thanks are extended to Sara Pinosio (Institute of Applied Genomics, Udine, Italy),
Giovanni Giuseppe Vendramin (Institute of Biosciences and BioResources, CNR, Firenze,
Italy), and Maria Mayol (CREAF, Barcelona, Spain) for their help in developing the Taxus
baccata transcriptome. This study was carried out with financial support from the Spanish
Ministry of Science and Innovation: AdapCon (CGL2011-30182-C02-01/02). Delphine
Grivet was supported by a “Ramón y Cajal” Fellowship from the Spanish Ministry of
Science and Innovation.
34
ANNEXES
Additional files (scripts, inputs, outputs) indicated in blue in the text are provided in the
digital material, in the following folders:
Material_Methods
Taxus_baccata_de_novo_assembly.xls
PART 1
blastx_Tbac_5genesTaxol
align24006_TXS_clean.fas
align34208_TAT_clean.fas
align71401_T5H_clean.fas
Tbac_5Tax.txt
Tbac_5Tax.xls
blastx_Tbac_Ath_Sly_Ptr
BestHitTbacAth.txt
BestHitTbacPtr.txt
BestHitTbacSly.txt
blastx_parsingTbacAth.pl
blastx_parsingTbacPtr.pl
blastx_parsingTbacSly.pl
extractSubjectIDTbacAth.pl
extractSubjectIDTbacPtr.pl
extractSubjectIDTbacSly.pl
outputTbacPoptr2_0.txt
outputTbacSL2.40.txt
outputTbacTAIR10.txt
RefSeqTbacAth.txt
RefSeqTbacPtr.txt
RefSeqTbacSly.txt
UniProtTbacAth.txt
UniProtTbacPtr.txt
UniProtTbacSly.txt
gene pathway
gene_pathway_1.txt

35
PART 2
blastx_Tbac_Tcus_Twal_Ptr
BestHitPsitPtr.txt
BestHitTbacPtr.txt
BestHitTcusPtr.txt
BestHitTwalPtr.txt
blastx_parsingPsitPtr.pl
blastx_parsingTbacPtr.pl
blastx_parsingTcusPtr.pl
blastx_parsingTwalPtr.pl
common4.pl
extractSubjectIDPsitPtr.pl
extractSubjectIDTbacPtr.pl
extractSubjectIDTcusPtr.pl
extractSubjectIDTwalPtr.pl
outputPsitPoptr2_0.txt
outputTbacPoptr2_0.txt
outputTcusPoptr2_0.txt
outputTwalPoptr2_0.txt
RefSeqPsitPtr.txt
RefSeqTbacPtr.txt
RefSeqTcusPtr.txt
RefSeqTwalPtr.txt
uniprotKEGG_Psit.txt
uniprotKEGG_Tbac.txt
uniprotKEGG_Tcus.txt
uniprotKEGG_Twal.txt
UniProtPsitPtr.txt
UniProtTbacPtr.txt
UniProtTcusPtr.txt
UniProtTwalPtr.txt
tblastx_Tbac_Tcus_Twal_Psit
BBH.pl
BestHitPsitTbacScore3.txt
BestHitPsitTcusScore3.txt
BestHitPsitTwalScore3.txt
BestHitTbacPsitScore3.txt
BestHitTcusPsitScore3.txt
BestHitTwalPsitScore3.txt
homologous.aa_PsitTbac.txt
homologous.aa_PsitTcus.txt
homologous.aa_PsitTwal.txt
homologous.aa_TbacPsit.txt
homologous.aa_TcusPsit.txt
homologous.aa_TwalPsit.txt
36
tblastx_parsingBBHscore_PsitTbac3.pl
tblastx_parsingBBHscore_PsitTcus3.pl
tblastx_parsingBBHscore_PsitTwal3.pl
tblastx_parsingBBHscore_TbacPsit3.pl
tblastx_parsingBBHscore_TcusPsit3.pl
tblastx_parsingBBHscore_TwalPsit3.pl
tbalstx_Tbac_Tcus_Twal_Psit_9plants
commonKOspBBH.pl
commonKOspSBH.pl
commonKOspSBH.txt
Psit1895KO_SBH.txt
Tbac2488KO.txt
Tbac2779KO_SBH.txt
Tcus2968KO.txt
Tcus3037KO_SBH.txt
Twal2511KO.txt
Twal2584KO_SBH.txt
gene pathway
gene_pathway_2.txt
gene_pathway_3.txt
gene_pathway_4.txt