Embed Size (px)
Citation preview

1
©Fotos N Palmer (3) and A Benedikter (1), CIAT
Adaptation Framework
Adaptation of Food Supply Chains to the Impacts of Progressively Changing Climate
Authors: A. Benedikter, P. Läderach, A. Eitzinger, C. Bunn, S. Cook
International Center for Tropical Agriculture (CIAT), Managua, Nicaragua and Cali, Colombia
Cali, Colombia, July 2011

2
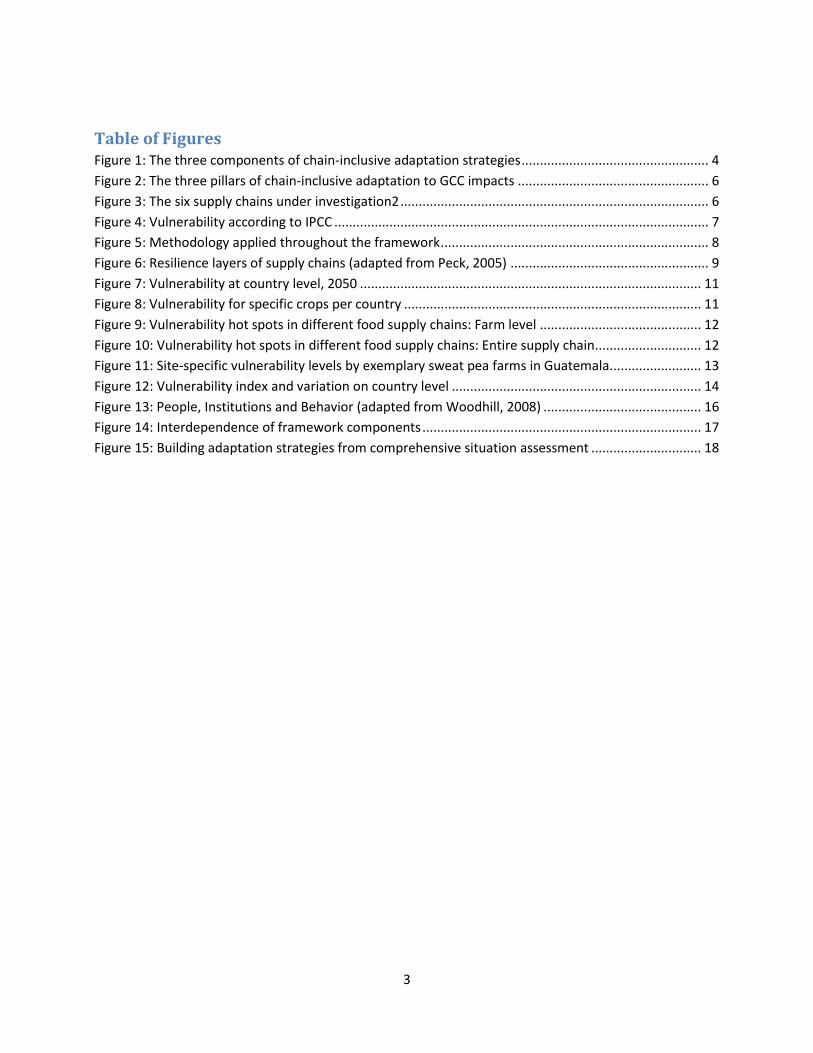
Index Table of Figures ......................................................................................................................................... 3
1. Executive Summary ............................................................................................................................... 4
2. Introduction ........................................................................................................................................... 5
Background ............................................................................................................................................ 5
Challenges ............................................................................................................................................. 5
3. Methodology ......................................................................................................................................... 6
Case description ........................................................................................................................................ 6
Supply chain analysis ................................................................................................................................. 7
Vulnerability assessment ........................................................................................................................... 7
Vulnerability at the farm level ............................................................................................................... 7
Vulnerability at the supply chain level .................................................................................................. 7
Behavioral patterns ................................................................................................................................... 8
4. RESULTS: Supply Chain Analysis ............................................................................................................ 8
Definition ................................................................................................................................................... 8
Characteristics ........................................................................................................................................... 8
Resilience ................................................................................................................................................... 9
Empirical Examples .................................................................................................................................... 9
5. RESULTS: Vulnerability to GCC ............................................................................................................ 10
Need for adaptation and adaptive capacities ......................................................................................... 10
Empirical Examples .................................................................................................................................. 10
6. RESULTS: Behavior and Institutions .................................................................................................... 14
Incentives for Change .............................................................................................................................. 14
People (Actors) ........................................................................................................................................ 15
Behaviour (Action) ................................................................................................................................... 15
Institutions (Mediation of Action) ........................................................................................................... 15
Empirical Examples .................................................................................................................................. 16
7. The Framework.................................................................................................................................... 17
Building Adaptation Strategies within the Framework ........................................................................... 18
Situational Patterns ................................................................................................................................. 18
8. This Framework as a roadmap ............................................................................................................ 19
9. Conclusions .......................................................................................................................................... 19
10. Further Reading ............................................................................................................................... 20
Case Study Reports .................................................................................................................................. 20
Methodology reports .............................................................................................................................. 20
Gender Reports ....................................................................................................................................... 20
11. References ....................................................................................................................................... 20
3
Table of Figures Figure 1: The three components of chain-inclusive adaptation strategies ................................................... 4
Figure 2: The three pillars of chain-inclusive adaptation to GCC impacts .................................................... 6
Figure 3: The six supply chains under investigation2 .................................................................................... 6
Figure 4: Vulnerability according to IPCC ...................................................................................................... 7
Figure 5: Methodology applied throughout the framework ......................................................................... 8
Figure 6: Resilience layers of supply chains (adapted from Peck, 2005) ...................................................... 9
Figure 7: Vulnerability at country level, 2050 ............................................................................................. 11
Figure 8: Vulnerability for specific crops per country ................................................................................. 11
Figure 9: Vulnerability hot spots in different food supply chains: Farm level ............................................ 12
Figure 10: Vulnerability hot spots in different food supply chains: Entire supply chain............................. 12
Figure 11: Site-specific vulnerability levels by exemplary sweat pea farms in Guatemala ......................... 13
Figure 12: Vulnerability index and variation on country level .................................................................... 14
Figure 13: People, Institutions and Behavior (adapted from Woodhill, 2008) ........................................... 16
Figure 14: Interdependence of framework components ............................................................................ 17
Figure 15: Building adaptation strategies from comprehensive situation assessment .............................. 18

4
1. Executive Summary
This report presents a framework for supply
chain-inclusive adaptation to climate change
impacts on agriculture. The overarching
objective of the concepts we introduce here is
to help build climate-proof agricultural
production systems and to reduce small
farmer’s susceptibility to the adverse affects of
global climate change (GCC) by lifting
adaptation strategies to the supply chain level.
The framework consists of three
complementary key areas of focus as necessary
pillars to underpin the achievement of these
objectives. The frameworks’ components are:
Supply chain analysis, vulnerability assessment
and evaluation of behavioral patterns (Figure 1).
Figure 1: The three components of chain-inclusive adaptation strategies
Analyses of the three key elements is based
upon the results from three case study sites: 1)
Guatemala, where small farmers are part of an
export chain of frozen vegetables to the US
market, 2) Colombia, where small-holders
contribute significantly to the food security of
metropolitan Bogotá and 3) Jamaica, where
farmers supply their vegetables to the
economically important hotel sector.
Results from these case studies reveal that,
supply chain analysis is a crucial process to
characterize the system which has to cope with
the adverse effects of GCC. To precisely tackle
these impacts we state that first a clear
definition and characterization of the food value
chain1 is necessary. This is, because these
systems have the potential to absorb the
impacts of GCC on the rural poor as well as on
value creation processes and therefore
determine the operational field which
adaptation has to address. Our research
identifies three supply chains in Colombia, two
in Guatemala and one in Jamaica, according to
farmers’ marketing channels. Secondly, a
vulnerability assessment provides information
on the stakeholders’ need for adaptation to GCC
and capacities to respond. Our investigation has
confirmed this process as being useful to
identify adaptation hot spots at various scales
and sites. Thirdly, a sociological approach helps
identify adaptive behaviors as a key attribute of
adaptive capacities. We propose that conduct of
key stakeholders holds substantial role in a
supply chain’s ability to respond to GCC
stresses.
We applied multiple methodologies to put the
findings presented in this report on firm ground.
Eleven semi-structured interviews with key
stakeholders helped both to systematically
analyze the supply chains under investigation
and to sketch out behavioral patterns along
these production systems. Fieldwork
observations contributed complementary
information to these analyses. To assess
vulnerability levels along the six supply chains,
we calculated the suitability changes of crops to
future climate conditions to reveal the
biophysical impacts of GCC in the three study
sites. Participatory focal workshops with
farmers and cooperatives and approximately
400 questionnaires designed to assess the
livelihoods of the rural poor cover the socio-
1 The terms “supply chain” and “value chain” are
used synonymously in this report.

5
economic aspects of our research. Again, expert
interviews and observations made in the field
helped identify further vulnerability factors
along the supply chains.
The results of the study demonstrate that the
objective of adaptation strategies in the context
of food supply chains must be incentives for
change. These stimuli have to match with the
inhomogeneous needs to change and adaptive
capacities to be found along these systems. This
framework provides methods for
comprehensive situation assessment to meet
this requirement.
2. Introduction
Background
Crops rely on balanced ecologic systems
allowing them to thrive. Global climate change,
however, brings along increases in temperature
and changes in precipitation patterns
challenging these environmental niches. While
crops are the first to suffer from these impacts,
changing climate conditions also batter rural
population and particularly small farmers in
developing regions as a consequence of the shift
in crop suitability. This is, because agricultural
production represents the main source of
income and daily nutrition of farmers and their
families. In large part, however, growers in
tropical areas are small-holders and therefore
doubtfully possess the means to respond
effectively to the GCC threats they face.
Rural livelihoods form the vital base of many
food supply chains. As an effect, farmers´
vulnerability to GCC stresses will likely permeate
into value creation processes beyond the
production stage, eventually affecting private
sector businesses, public institutions and also
the consumers of the products. Such food
chains can range from locally tied to globally
spread providers of staple, non-staple and
specialty items and are responsible for the
availability, quality and price of the products
supplied. Together with escalating food
consumption and shifting diet patterns
worldwide, climate change adds another
obstacle to food supply chains. Taking these
potential socio-economic impacts into account,
the resilience of food supply chains to external
stresses like GCC becomes a key issue.
Challenges
Vulnerability analysis based on assessment of
risk exposure and livelihoods assets is a
common and widely recognized tool to evaluate
a populations´ need and capacity to adapt to a
certain threat (Hinkel, 2011). The possibility to
precisely analyze the situation of rural families
when confronted with GCC impacts justifies the
importance and necessity of this approach.
However, adapting supply chains to the adverse
effects of changing climate conditions must not
be constrained to investigation exclusively at
farm level.
Food supply chains are complex constructs,
difficult to address as a whole. A wide variety of
people and entities coming from different social
strata, intend to create value through a
multitude of processes. These actors pursue
individual objectives, face particular problems,
and exploit diverse resources to finally satisfy a
customer’s needs. The interaction and
interdependence of these elements determines
to a significant degree the way the system
responds to a common threat.
Thus, it becomes apparent that GCC impacts
potentially strike upon different cultural and
socio-economic contexts and spread throughout
the various stages of food supply chains. Owing
to this complexity, problems and obstacles may

6
be hidden behind the processes of value
creation or the hardly measurable perceptions
and values of the people involved. Similarly,
undisclosed adaptive capacities might appear at
multiple levels of food supply chains. In order to
find chain-inclusive, yet situation-specific
solutions, adaptation strategies need to
effectively address this intricate situation in all
its components and at different scales.
To confront these challenges, we propose three
components to build the frame for chain-
inclusive adaptation to GCC impacts (Figure 2):
Figure 2: The three pillars of chain-inclusive adaptation to GCC impacts
To tackle the complexity of GCC impacts on food
supply systems, we state that together with a
vulnerability assessment, comprehensive
analyses of the business background (supply
chains) and sociological capacities and
constraints (people and behavior) are
indispensable.
3. Methodology
Case description This report is based upon the results from
investigation in three case study sites, namely
Guatemala, Colombia and Jamaica, each of
which is discussed in detail in a separate
document2. Based on the results from
vulnerability assessment at farm level and
fieldwork observations we decided to split the
three cases up into six supply chains according
to different marketing channels:
In Colombia we found 3 cases: Farmers selling
directly to the consumer via the NGO supported
farmer´s market mercado de campesinos (COL
1); farmers selling exclusively to intermediaries
in the free market system (COL 2); farmers
selling to both (COL 3). Regardless of these
supply chains, small farmers in this region
contribute significantly to Bogotá´s food
security. At the study site in Guatemala we
identified two types of supply chains. On the
one hand, small-holders sell their products
through intermediaries in a well-established
supply chain to the US market (GTM 2) Farmers
in GTM 1 are part of the same supply system,
however with local NGO support. As for Jamaica
(JAM), we encountered hardly observable
supply chain structures when we investigated
the case of small farmers supplying vegetables
to the local hotel industry.
Figure 3: The six supply chains under investigation2
Our research in the three case studies is built
upon the fact that rural livelihoods and food
supply chains are vulnerable to GCC impacts.
2 Details can be retrieved from detached case study
reports (See chapter 10)
7
However, the comprehensive approach
presented here required going beyond
vulnerability assessment to effectively address
the diversity of information which is the subject
of this research. For this reason, a multitude of
methodologies were necessary to gain insights
into the three components supply chain
analysis, vulnerability assessment and
evaluation of behavioral patterns.
Supply chain analysis In order to gain insights in the characteristics
and to assess chain-inclusive adaptive capacities
of the above outlined supply chains, we
conducted semi-structured interviews with
experts of each supply system. A total of eleven
conversations with exporters, sourcing
managers, representatives of NGOs and public
institutions, tradesmen, wholesalers and public
relation officers were necessary to collect the
required information. The interviews aimed at
gaining insights into the structures and
dynamics of the supply chains, power and
relationships of stakeholders and resilience
patterns along the system. An additional 24
focal workshops (8 in each study site) with
stakeholders as well as observations during
fieldwork proved to be indispensable
complements to these topics.
Vulnerability assessment We assessed vulnerability patterns at two
different levels. 1) At the farm level, 2) at the
overall supply chain level.
Vulnerability at the farm level
In the three sites Guatemala, Colombia and
Jamaica we evaluated the vulnerability of small
farmer’s livelihoods in the context of changing
climate conditions for the years 2030 and 2050.
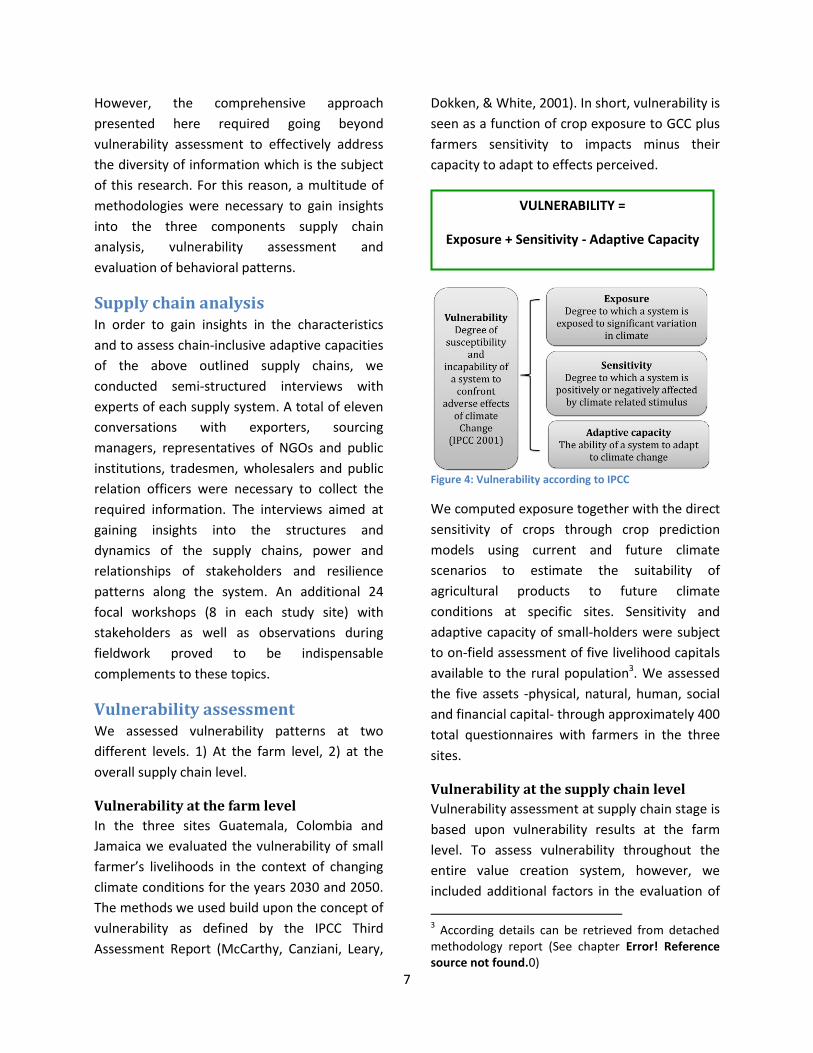
The methods we used build upon the concept of
vulnerability as defined by the IPCC Third
Assessment Report (McCarthy, Canziani, Leary,
Dokken, & White, 2001). In short, vulnerability is
seen as a function of crop exposure to GCC plus
farmers sensitivity to impacts minus their
capacity to adapt to effects perceived.
Figure 4: Vulnerability according to IPCC
We computed exposure together with the direct
sensitivity of crops through crop prediction
models using current and future climate
scenarios to estimate the suitability of
agricultural products to future climate
conditions at specific sites. Sensitivity and
adaptive capacity of small-holders were subject
to on-field assessment of five livelihood capitals
available to the rural population3. We assessed
the five assets -physical, natural, human, social
and financial capital- through approximately 400
total questionnaires with farmers in the three
sites.
Vulnerability at the supply chain level
Vulnerability assessment at supply chain stage is
based upon vulnerability results at the farm
level. To assess vulnerability throughout the
entire value creation system, however, we
included additional factors in the evaluation of
3 According details can be retrieved from detached
methodology report (See chapter Error! Reference source not found.0)
VULNERABILITY =
Exposure + Sensitivity - Adaptive Capacity

8
sensitivity and adaptive capacity. We argue that
a food supply system has a high sensitivity to
GCC impacts when producers are affected and
when other stakeholders depend on the
producers to supply inputs such as foodstuff.
However, by definition adaptive capacity
comprises a system´s ability to respond to a
hazard. Hence, any adaptation supporting
means could potentially be included. Adaptive
Considering the supply chain after farm level,
results for adaptive capacity are based on
robust estimations about adaptive assets
available throughout the system, crop
diversification and tangible institutional
capacities.
Behavioral patterns The evaluation of behavioral patterns followed
the same methodology as supply chain analysis.
In semi-structured interviews, key stakeholders
provided information about action cycles in the
value creation process, how supply chain actors
relate to each other and revealed adaptive
behaviors along the value chain. Fieldwork
observations confirmed or undermined these
insights.
Figure 5 summarizes the methods applied for
the purpose of this research:
Figure 5: Methodology applied throughout the framework
The purpose of this methodology was to obtain
important messages about the three main
components of this framework without wasting
efforts on redundant information.
4. RESULTS: Supply Chain
Analysis
Definition Supply chains can be seen as “a network of *…+
organizations *…+ working together to control,
manage and improve the flow of materials and
information from suppliers to end users”
(Christopher, 1998). Alternatively, we can
summarize supply chains as people interacting
in resource consuming and value-adding
processes to satisfy customers with goods and
services. They host distinct structures and
dynamics and are embedded in a specific
enabling environment, two characteristics
necessary to allow value creation (Downing,
2006). In the case of (agricultural) food supply
chains, the value creation process inherently
starts with a crop to finally end up as food item
to be offered in supermarkets or restaurants,
among others. This characterization
demonstrates the multitude of interwoven
subjects which justify and -at the same time-
complicate supply chain analysis. On the other
hand, a clear definition of a food supply system
also delivers the contours within which chain-
inclusive adaptation can take place.
Identification of main crops and products,
processes, markets and people involved (e.g.
customers) helps determine the playing field for
response measures.
Characteristics Food supply chains are important for rural
development. These systems hold high potential
to facilitate access to markets for production
9
and consumption and amplify income sources
for the poor (Marsden, Banks, & Bristow, 2000).
Furthermore, they help maintain the availability
of food and support economic growth.
The core of supply chains are value streams i.e.
distribution, information and communication of
values to customers. According to the type of
supply chain, certain assets and structures are
required to underpin this flow. In turn, different
people and entities own processes in
organizational networks which make use of
these assets. These layers are very interrelated
and all depend on the environment in which
they are embedded. This so-called enabling
environment comprises political, economic,
social, technological, and ecological
determinants, which open or limit the operating
space for supply chains (Peck, 2005).
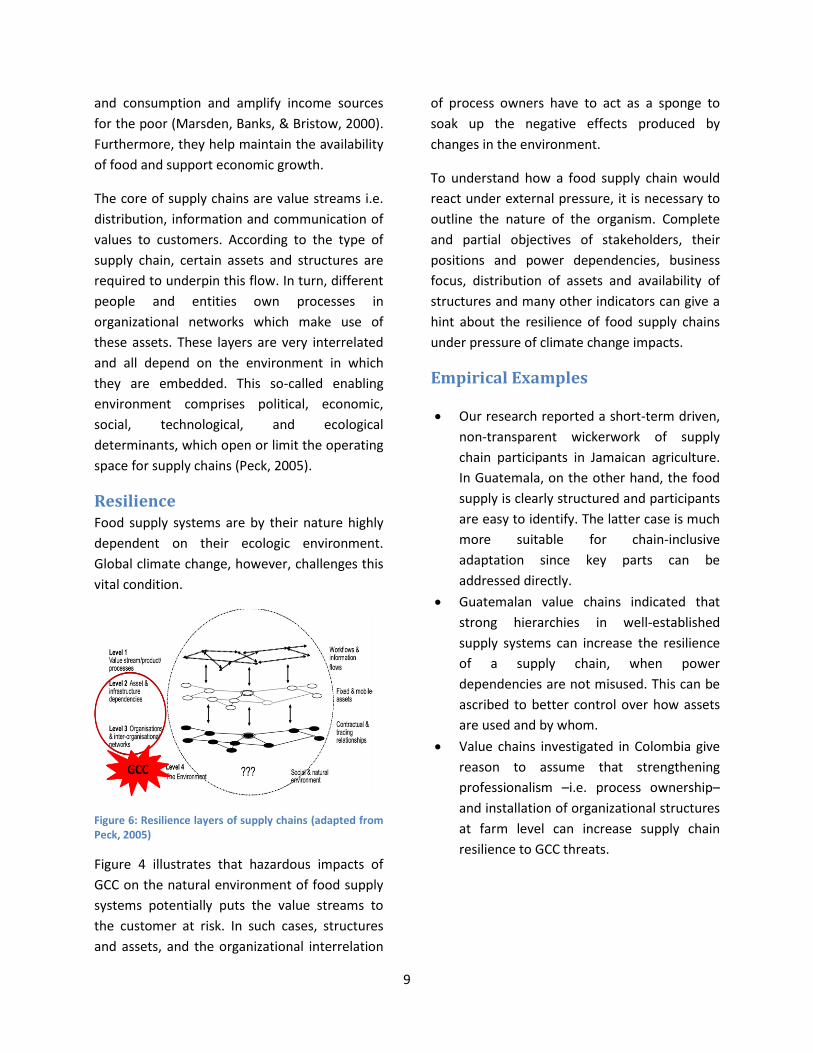
Resilience Food supply systems are by their nature highly
dependent on their ecologic environment.
Global climate change, however, challenges this
vital condition.
Figure 6: Resilience layers of supply chains (adapted from Peck, 2005)
Figure 4 illustrates that hazardous impacts of
GCC on the natural environment of food supply
systems potentially puts the value streams to
the customer at risk. In such cases, structures
and assets, and the organizational interrelation
of process owners have to act as a sponge to
soak up the negative effects produced by
changes in the environment.
To understand how a food supply chain would
react under external pressure, it is necessary to
outline the nature of the organism. Complete
and partial objectives of stakeholders, their
positions and power dependencies, business
focus, distribution of assets and availability of
structures and many other indicators can give a
hint about the resilience of food supply chains
under pressure of climate change impacts.
Empirical Examples
Our research reported a short-term driven,
non-transparent wickerwork of supply
chain participants in Jamaican agriculture.
In Guatemala, on the other hand, the food
supply is clearly structured and participants
are easy to identify. The latter case is much
more suitable for chain-inclusive
adaptation since key parts can be
addressed directly.
Guatemalan value chains indicated that
strong hierarchies in well-established
supply systems can increase the resilience
of a supply chain, when power
dependencies are not misused. This can be
ascribed to better control over how assets
are used and by whom.
Value chains investigated in Colombia give
reason to assume that strengthening
professionalism –i.e. process ownership–
and installation of organizational structures
at farm level can increase supply chain
resilience to GCC threats.

10
5. RESULTS: Vulnerability to GCC
Food supply chains’ vulnerability to changing
climate is the main consideration to explore
ways of adaptation to the uncertain conditions
that will be faced. Small farmer´s vulnerability to
GCC can put entire food supply systems at risk.
Therefore, our research focuses on vulnerability
of producers. However, its derivative effects on
the entire value chain have also been assessed.
Need for adaptation and adaptive
capacities Exposure to changing climate conditions
represents expected changes in precipitation
and temperature patterns. Together with direct
sensitivity, i.e. the consequences of changing
climate on the suitability of a crop, these values
combine to what we denominate direct impacts
(of GCC). It summarizes the primary adverse
effects of GCC on agriculture. It is calculated and
illustrated as the change in suitability of a crop
from current to predicted future climate.
The second component of vulnerability is
(indirect) sensitivity, i.e. the extent to which
livelihoods are affected by climate related
changes. Together with exposure, the results of
these two factors combined then add up to an
indicator which we denominated need for
adaptation to GCC impacts. We argue that
people need to adapt to climate change when
they are exposed to this hazard and affected by
its consequences. This value demonstrates if
and to what extent a certain system in fact faces
a problem imposed by changing climate
conditions. The third component of vulnerability
assessment is adaptive capacity which
comprises a systems’ available means to adapt
to a situation.
The three components of vulnerability are
suitable for different scales. We therefore
analyzed vulnerability patterns for distinct
populations, systems and subjects. Since we
included additional factors to calculate
sensitivity and adaptive capacity levels at supply
chain level, vulnerability patterns are likely to
differ between farm level assessment and
supply chain level assessment.
Empirical Examples Following graphical illustrations help identify
adaptation hot spots at different scales. They
highlight needs for adaptation of a system or
population and juxtapose them with its
capacities to adapt. For better comparability
among the different cases, all displayed results
for sensitivity and adaptive capacity base on the
arithmetic mean upon the modal values of the
five livelihood assets, respectively4.
Location of the bubbles indicates the average
need for adaptation as a combination of the
exposure and current sensitivity of a respective
system or population. The bubbles situated in
the red section in the upper left corner indicate
high scores for this value. Bubble color
represents their current average adaptive
capacity. Red bubbles highlight low means to
4 For further information and alternative
methodologies please consult concomitant methodology report (see chapter 10)
FACTS AND FINDINGS
Food supply chains have great potential to improve rural livelihoods.
The less traceable a supply chain is, the more
difficult the assessment and targeting of
adaptation strategies.
GCC impacts on the natural environment have
to be filtered by organizational and structural
layers to decrease their impacts on value
streams.

11
respond, fading into green bubbles for high
adaptive capacity.
Figure 7: Vulnerability at country level, 2050
Figure 7 shows vulnerability values at country
level for the three study sites under
investigation based on suitability change values
for the year 2050. Suitability change values
summarize the average exposure of 11
(Guatemala), 14 (Jamaica) and 19 (Colombia)
crops in one single value for each country. The
chart reports Jamaica together with Guatemala
as the most vulnerable among the three sites.
With an average suitability change of -10,
Jamaica scores 2.2 on a sensitivity scale from 1
(very low) to 3 (very high sensitivity). At the
same time, Jamaica only reached a low-medium
level of adaptive capacity (highlighted in
orange). Guatemala is on average most exposed
(suitability change -14) and sensitive to changing
climate (scoring 2.6), yet the country reports
intermediate availability of means to respond to
the hazard (highlighted as yellow bubble). On
the other hand, Colombia´s moderate levels of
sensitivity (only 1.2) and medium-high rated
adaptive capacities compensate for its
considerable exposure to GCC (suitability
change -14). Together these produce an overall
low-medium vulnerability level.
Figure 7 provides a proper overview of the
overall situation in the three countries. Yet, few
statements can be made about the effects of
GCC on specific sites or crops. For example, it
cannot be stated that Colombia is not
vulnerable to GCC impacts, however it is less
affected than the other two sites.
Figure 8 on the other hand highlights exemplary
key crops for each country to demonstrate the
dispersion of future crop suitability among the
different products in Jamaica and Guatemala
and juxtaposes it with the respective (indirect)
sensitivity and adaptive capacity values.
Figure 8: Vulnerability for specific crops per country
As can be seen, ginger in Jamaica will likely lose
suitability to climate conditions in 2050 at an
alarming rate whereas banana will benefit from
higher temperatures. However, while ginger and
banana farmers report the same sensitivity, the
latter score even lower on adaptive capacities
than ginger farmers. Therefore, in Jamaica
banana can be a potential adaptation option in
terms of crops. Nevertheless, the humble
adaptive capacities of today’s banana farmers
will need to be addressed first. In Guatemala,
COL
GTM
JAM
1
2
3
-50 -25 0 25 50
Sen
siti
vity
, Ø
Suitability Change, 2050, Ø
JAM_ginger JAM_banana
GTM_broc
GTM_pea
COL_maize
COL_blberry1
2
3
-50 -25 0 25 50
Sen
siti
vity
, Ø
Suitability change, 2050, Ø
Low Low-medium
Medium Medium- high
High

12
sweet pea farmers see themselves much less
affected by GCC impacts and report higher
adaptive capacities to respond than small
holders cultivating broccoli. Crop-wise however,
sweet pea will drastically lose suitability to
conditions in 2050, while broccoli almost
remains stable. Hence, broccoli farmers
potentially might learn from sweet pea farmers
how to better deal with GCC impacts. In turn,
sweet pea farmers might consider switching
gradually to broccoli or other crop alternatives
as an adaptation option. As for Colombia, our
research highlights blackberry farmers as little
affected by GCC and equipped with proper
means to respond to expected impacts. The
crop itself will encounter a moderately lower
suitability to climate conditions in 2050. Maize
on the other hand, is much more exposed to
changing climate Farmers cultivating this crop
are also quite affected and have only mediocre
assets at their disposal to respond to the
adverse effects they are likely to face.
On another scale, vulnerability assessment on
supply chain level is indispensable for the
purpose of this study. Figure 109 and 10
summarize the results for exposure, sensitivity
and adaptive capacity in the six supply chains
which our analyses have identified.
Figure 9: Vulnerability hot spots in different food supply chains: Farm level
Figure 10: Vulnerability hot spots in different food supply chains: Entire supply chain
Charts 9 and 10 reveal the differences in
sensitivity and adaptive capacity between the
findings at the overall supply chain level
including all stakeholders and at the farm level
only. Here, suitability change values reflect the
average results of the farmers’ main crops. The
differences -highlighted by red circles- emerge
from factors which we included additionally in
vulnerability analyses at supply chain stage,
however not on farm level. For example, along
supply chain COL 1 our investigation located
little, along COL 2 significant assets to respond
GTM 1
GTM 2
COL 1
COL 2
COL 3
JAM
1
2
3
-50 -25 0 25 50
Sen
siti
vity
, Ø
Suitability Change, 2050, Ø
Vulnerability, Farm Level
GTM 1
GTM 2
COL 1
COL 2
COL 3
JAM
1
2
3
-50 -25 0 25 50
Sen
siti
vity
, Ø
Suitability Change, 2050, Ø
Vulnerability, Supply Chain Level

13
to GCC impacts. For this reason, COL 1´s
adaptive capacity level decreases, while COL 2´s
level rises from the farm to supply chain point of
view, both to medium-high level. Similarly,
sensitivity level of GTM 2 declines if we look at
the entire supply chain. This is, because buyers
and intermediaries are able to easily substitute
their suppliers in this system.
Our research also identified site-specific
vulnerability hot spots. Figure 11 demonstrates
GCC impacts as experienced by exemplary
sweet pea farmers in Guatemala. The chart
indicates that farm #76 from our survey is not as
exposed to changing climate as the other two;
however, livelihood assets are highly affected
and too scarce to respond effectively to GCC
impacts. Farm # 105 is relatively more exposed,
less adaptive, but also less sensitive than farm #
76. Yet, farm # 103 faces the opposite situation
as farm # 76 with high exposure but proper
availability and moderate sensitivity of assets.
Therefore, farm # 76 and # 105 might
potentially learn from farm # 103 how to cope
with GCC stresses.
Figure 11: Site-specific vulnerability levels by exemplary sweat pea farms in Guatemala
The graphs presented here are based on
average results of the respective subject matter.
Hence, decision makers will find it useful to
compare these values with their standard
deviation, since this indicator can tell about the
distribution of values and therefore the scope of
adaptation options for a certain system.
Alternatively, standard statistical methods such
as Oneway-Anova and t-test statistics also
provide insights into the variation of
vulnerability factors. Figure 12 shows a
vulnerability index based on suitability change
values of evaluated farms regarding the year
2030, their sensitivity and adaptive capacity
scores and farmers’ perceptions of climate
change impacts. Similar to Figure 7, this method
also reports Colombia as the least vulnerable
(scoring a mean of 8.42 with 4 being high, 12
being low vulnerability) and Jamaica as the most
vulnerable (7.21) of the three countries.
Guatemala ranks 2nd, scoring a mean of 7.79.
However, the whiskers in the graphs indicate
the variation in the values. This means that even
in resilient Colombia households exist that are
very vulnerable. The vulnerability index value of
Guatemala, on the other hand, is more
homogeneous which is mainly owing to lower
crop diversification and therefore lower variety
in suitability results. In Jamaica farmers do not
perceive climate change as a severe threat to
their livelihoods. This contributes to their
vulnerability, since farmers are less motivated
to engage in adaptation (Grothmann & Patt,
2005).
FARM_#76
FARM_#103
FARM_#105
1
2
3
-50 0 50
Sen
siti
vity
, Ø
Suitability change, 2050, Ø

14
Figure 12: Vulnerability index and variation on country level
Above outlined vulnerability hot spot charts and
box-whiskers diagrams represent some
examples to illustrate GCC impacts on different
scales. Alternatively, these tools can also
provide insights in vulnerability patterns
regarding gender, farm size or production cost,
just to name a few.
In a second phase, decision makers then have
the possibility to consult precise crop suitability
and livelihood analyses to gather more detailed
information about a specific situation.
6. RESULTS: Behavior and
Institutions
People are the foundation of every supply chain.
In the food sector, the value-adding actions and
relationships between farmers, transporters,
processers, wholesalers and retailers transform
crops to products which finally satisfy specific
customer demands. This interaction together
with other social factors shapes to a large extent
the objectives of adaptation and the risks
perceived with it (Adger et al., 2008). Therefore,
it is necessary to evaluate the interactive
behavior of stakeholders in a supply chain since
it helps to determine the non-asset related
adaptive capacities of the system. Considering
the big picture of chain-inclusive adaptation,
however, decision makers will encounter a
difficult challenge in responding to the
multitude of actions, rationales, values,
dependencies, knowledge imperfections,
uncertainties and many other characteristics
that are subject to social interaction. We argue
that the key lies within the identification of
incentives for the stakeholders of a supply chain
to alter or leverage their habits in favor of
adaptation to GCC.
Incentives for Change Adaptation means to change. However, people
are unlikely to change their habitual patterns
unless they absolutely must or perceive
substantial advantages in doing so. If not,
however, people require incentives to change
their behavior (Liverani, 2009). We state that
incentives must be tailored to the specific needs
and “haves” of people along a supply chain to
potentially alter their behavioral patterns in
favor of adaptation to GCC impacts. However
complicating the situation, people along a food
supply system will inherently be different.
Stakeholders pursue distinct objectives, have
FACTS AND FINDINGS
Sensitivity of non-producer stakeholders to GCC
impacts strongly relies on the extent to which
they depend on farmers to supply inputs
(foodstuff) for downstream value-adding
processes.
Adaptive capacities can together with livelihood
assets include (crop) diversification,
institutional capacities and structures along a
supply chain.

15
particular rationale to do so and face individual
obstacles which may prevent them from
achieving their goals. Hence, shaping incentives
for adaptation requires comprehensive
knowledge about the people involved.
People (Actors) Food supply systems are built on perceptions of
human beings who, consciously or
unconsciously, make decisions and interact.
Perceptions, in turn, are built upon values which
can comprise anything individuals consider as
important (Adger et al., 2008). Corresponding to
these values, people form groups of interest and
organizations which, in a supply chain, form
complex networks of stakeholders.
For these reasons, adaptation to GCC at the
chain-inclusive level has to be responsive to its
stakeholders. However, it is not necessary, and
even less effective, to address all the people and
entities in a supply chain with adaptation
measures. To simplify the process, decision
makers should rather focus on key actors within
the system. Key actors are people, groups or
entities who fit with one or more of three
relevant attributes. They either need change,
want change and/or they can facilitate change
in terms of adaptation to GCC. Logically, the
more attributes a stakeholder fulfills, the higher
their ranking to be addressed first by adaptation
strategies.
Behaviour (Action) Participants of a supply chain perform different
actions and action cycles to generate values.
Most repetitive patterns of actions are then
likely to transform into habits and eventually
shape behavior (Pratkanis & Breckler, 1989).
Like the identification of key stakeholders,
decision makers cannot afford to spend time on
evaluation of redundant behavior in the context
of chain-inclusive adaptation. For sakes of
simplicity, three types of behaviors are
identified as adaptation-relevant:
Type 1 behavioral traits are points of leverage
since they can support change and potentially
resilience along a supply chain or parts of it.
Decision makers should simply focus on
endurance of these traits. Behavior types 2 and
3 themselves are subject to change. Although
they seem to be each other’s complement, type
3 behavior might also appear independently,
whenever required patterns cannot be realized
by simple conversion from negative to positive
behavioral structures. For both cases, however,
adaptation strategies will need to identify
incentives to drop out of negative or inhibiting
action cycles.
Institutions (Mediation of Action) Institutions can be seen as systems of
established and prevalent social rules that
structure social interactions (Hodgson, 2006).
They can be of tangible (entities, structures,
laws, etc…) and/or non-tangible nature (values,
norms, etc…) and help people anticipate
behavior within a system. Therefore, institutions
arrange and mediate social interaction and build
the groundwork for behavior. As such, they
build the frame within which people’s actions
take place and limit their options of behavior –
and change. On the other hand, institutions
provide a platform for behavior to take place
and enable action within the rules and
1. Positive, adaptation-enabling behavior
which is available or institutionalized in
a system
2. Negative, adaptation-obstructing
behavior which is available or
institutionalized in a system
3. Adaptive behavior required in a system

16
structures of the system (Hodgson, 2006;
Vermeulen, Woodhill, Proctor, & Delnoye,
2008).
Figure 13: People, Institutions and Behavior
(adapted from Woodhill, 2008)Error! Reference
source not found. summarizes the interrelation
between actors (stakeholders), action,
(behavior) mediation of action (institutions) and
incentives. People are guided by values to
engage in taking actions which eventually
become behavioral patterns. These traits are
mediated by institutions i.e. stable installations
such as rules and norms and can confirm or
undermine these institutions. Latter, in turn,
create incentives which draw back on decision
making processes of people (Vermeulen et al.,
2008; Woodhill, 2008).
The graph outlined above visualizes the role of
behavior in the context of adaptation to GCC
impacts. Clearly, adaptive behavior is a
substantial component of adaptive capacities
since it determines to a large extent the
motivation to engage in change. In the long run,
it also holds the opportunity to shape
institutions and create incentives for change.
Empirical Examples
• Although action cycles in supply chain GTM
1 are clearly determined, the system is open
for adaptation. The local NGO supports this
attitude by giving incentives to increase
engagement in adaptation. On the contrary,
farmers in GTM 2 (no NGO assistance) rely
on inputs provided by intermediaries, which
strongly constrains their adaptive behavior.
• Supply chain COL 1 also reported incentives
given by local NGOs. The legalization of the
farmer´s market and facilitation of
marketing support, among others, the
farmers´ desire to improve their situation. In
the open market system of COL 2, the
power is institutionalized at the
intermediary level. This fact, in combination
with low professionalism among the farmers
creates a negative effect on their motivation
to change. For supply chain COL 3 our
results report clever adaptive behavior
patterns. Producers actively engage in
adaptation through the farmer´s market,
while still maintaining their current
marketing channels through the
intermediary system.
• Jamaica scores relatively poor adaptive
behaviour patterns. Our investigation
indicates that key buyers such as hotels and
restaurants do not recognize farmers as
competitive suppliers. Also, a short-term
mindset is prevalent at farm level.
Opportunistic inputs supply by public
institutions fosters this adaptation-
hindering attitude.
FACTS AND FINDINGS
Adaptive behavior is a key attribute of adaptive capacities.
Adaptation strategies foremost have to address key actors. Key actors are people who need, want and/or facilitate change.
Decision makers must firstly focus on adaptation-relevant types of behavior.
Institutions create incentives and mediate behavior.

17
7. The Framework
Although we have discussed the
aforementioned pillars separately, the three
components weave in and out with one
another, forming a multidimensional framework
within which adaptation strategies are thought
to operate (Figure 14).
Global climate change adversely affects crops
and, in a second phase, the people and entities
who directly or indirectly depend on them. In a
food supply chain these stakeholders are linked
and interact through different value creation
processes. Vulnerability to GCC impacts can
spread out. Institutions carry these processes,
since they are reflected as repetitive actions in
people´s behavior. These action cycles in turn
require resources in form of assets. When GCC
threatens the natural environment of
agricultural systems, embedded resources will
also suffer. At the same time these assets will
also have to support adaptation measures and
maintain the resilience of value creation by
feeding process owners in organizational
networks with vital inputs. The green lines in
Figure 14 highlight some of these complex
interdependencies.
The outlined framework highlights adaptation
hot spots, identifies the “haves” and needs of a
system in the context of adaptation to GCC
impacts and helps understand the
interdependence among its components. Thus,
it provides a comprehensive situation
assessment which is necessary to build
adaptation strategies upon. In other words, the
interplay between its components gives the
opportunity to filter out specific incentives to
spark engagement in adaptation at different
levels.
Figure 14: Interdependence of framework components

18
Building Adaptation Strategies
within the Framework Adaptation strategies are concepts designed to
achieve a goal in the context of building
adaptive capacities and/or implementing
adaptation practices (Hinterhuber, 1996;
Nelson, Adger, & Brown, 2007). Accordingly, we
propose that the aforementioned incentives
must form the central objective to be pursued
by strategies that address adaptation to GCC
impacts.
This is because a need for adaptation does not
necessarily materialize in the required
modification of a situation. People might lack
motives or capacities, face cognitive obstacles,
have different perceptions, or associate
uncertainties with change, all factors which
inhibit engagement in adaptation (REF).
Therefore, it is the duty of decision makers to
tailor incentives for change to the people
involved and to the situation in which they find
themselves.
Adaptation strategies to GCC impacts can then
be framed using following template (Figure 15):
Figure 15: Building adaptation strategies from comprehensive situation assessment
The starting point is the formulation of an
objective in the form of incentives which are
targeted to the situation assessed in prior
analyses of supply chain characteristics,
vulnerability to GCC and behavioral traits.
Outlined incentives must then be juxtaposed to
available and required means to see whether
implementation is viable. Based on this
information, suggestions for the next steps can
be derived. At this stage, it is important to
include potential enablers and obstacles in the
strategy formulation, since they can
substantially influence the prospects of success.
Situational Patterns Our research revealed patterns of situations in
the context of adaptation based on the outlined
interdependence of framework components
(Figure 14).
Needs for adaptation to GCC impacts will
likely be higher at producer level than for
other stakeholders in a food supply chain.
This has been confirmed by the six supply
chains under investigation. Hence,
incentives must target how non-producer
participants are affected when farmers are
hit by GCC.
Mere supply of inputs (e.g. fertilizers) to
farmers inhibits necessary adaptive
behaviors which might tackle GCC impacts
on the long term. In the supply chains of
Jamaica and GTM 2 such arm´s length
principles locked farmers into action cycles
depending on input supply.
Value chain COL 1 (farmer´s market)
revealed that new supply systems can
emerge when:
o there is a high need for adaptation
throughout a substantial population of
producers and
o intermediaries in a free market system
misuse their institutionalized power,
and
o suppressed producers incorporate a
positive attitude to change.

19
In open market systems the highly sensitive
supply bases -i.e. farmers- with little means
to adapt are likely to become victims to the
policies of more powerful players. Supply
chain COL 2 reported the disproportionate
organizational capacities to fortify and
institutionalize power imbalances which can
inhibit chain-wide adaptation.
8. This Framework as a roadmap
We propose following step sequence to use this
framework:
1. Define the playing field: Identification of
crops (products), main actors and processes
as well as consumers and markets is the
necessary first step to understand where
and at what scale adaptation can potentially
take place.
2. Get briefed by key players: Detection and
approach of key actors in the supply system
efficiently allows to:
i. Understand structures, dynamics and
resilience patterns along the chain
ii. Sketch out people´s perception,
important behavioral traits and the
mediating institutions like cultural
norms and powerful entities
iii. Locate important stakeholders as points
of leverage for adaptation
3. Focus the situation: Precise assessment of
crop exposure to GCC and its impacts on the
rural livelihoods, food supply and
stakeholders depending on it permits exact
analysis of the challenges to be faced. In
combination with detailed evaluation of
adaptive behavior and profound supply
chain analysis, this method provides
indispensable information about where
adaptation to GCC is needed and where
counteracting measures are feasible.
4. Outline response measures: Assessed
information then must be translated into
incentive-focused adaptation strategies in
order to discharge a specific situation or
population from GCC impacts. This
conceptualization process should
concentrate on answering following
questions:
o What can be done by what means?
o Which incentives can ignite chain-
inclusive adaptation?
o What enablers and what obstacles are
there to influence the implementation
of these incentives?
5. Troubleshoot: Implement, measure, revise
and integrate adaptation strategies in
practice. Scale-up what works.
9. Conclusions
Comprehensive situation assessment helps put
chain-inclusive adaptation strategies on solid
ground. The framework which we introduced in
this report fulfills this purpose by incorporating
methodologies and analyses from the fields of
business, climatology, geography and sociology.
Independently from scale, crop and site outlined
chain-inclusive adaptation framework facilitates
both to respond effectively to GCC and help
locate and patch resilience gaps throughout the
system. The practical application of highlighted
FACTS AND FINDINGS
Adaptation strategies must be aimed at incentives which are based on comprehensive situation assessment.
Incentives must be tailored to situations and the people affected by it.
The outlining process of adaptation strategies must pay special attention to enablers and obstacles.

20
assessment methods will likely remain a
challenge for decision makers. Nevertheless,
they provide substantial support to decrease
the complexity that the problem of GCC impacts
on food supply chains brings about.
10. Further Reading
Case Study Reports
Colombia:
Impact of climate change on Bogotá’s food
security and smallholder’s livelihoods
Jamaica:
Impact of climate change on Jamaican hotel
industry supply chains and on farmer’s
livelihoods
Guatemala:
Vulnerability Assessment of Frozen Vegetable
Value-chain to Climate Change
Methodology reports
Adaptation by agricultural communities to
climate change through participatory &
supply chain inclusive management
Gender Reports The impact of climate change on men and
women
11. References
Adger, W. N., Dessai, S., Goulden, M., Hulme, M., Lorenzoni, I., Nelson, D. R., et al. (2008). Are there social limits to adaptation to climate change? Climatic Change, 93(3-4), 335-354. Springer. doi: 10.1007/s10584-008-9520-z.
Christopher, M. (1998). Logistics & Supply Chain Management. London: Pitmans.
Downing, J. (2006). GLOBALIZATION AND THE SMALL FIRM : A VALUE CHAIN APPROACH TO ECONOMIC GROWTH GLOBALIZATION AND THE SMALL FIRM. Development, (February).
Grothmann, T., & Patt, A. (2005). Adaptive capacity and human cognition: The process of individual adaptation to climate change. Global Environmental Change Part A, 15(3), 199-213. Elsevier. doi: 10.1016/j.gloenvcha.2005.01.002.
Hinkel, J. (2011). ,“Indicators- of vulnerability and adaptive capacity”: Towards a clarification of the science-policy interface. Global Environmental Change, 21(1), 198-208. doi: doi: DOI: 10.1016/j.gloenvcha.2010.08.002.
Hinterhuber, H. H. (1996). Strategische Unternehmensführung - Band 1. Walter de Gruyter.
Hodgson, G. M. (2006). What are institutions. Journal of Economic Issues, XL(1), 1-25. Citeseer. Retrieved from http://scholar.google.com/scholar?hl=en&btnG=Search&q=intitle:What+Are+Institutions?#0.
Liverani, A. (2009). Climate Change and Individual Behavior: Considerations for Policy. World Development, (September 2009). The World Bank. Retrieved from http://ideas.repec.org/p/wbk/wbrwps/5058.html.
Marsden, T., Banks, J., & Bristow, G. (2000). Food Supply Chain Approaches: Exploring their Role in Rural Development. Rural Sociology, 40(4), 424-438. Wiley Online Library. doi: 10.1111/1467-9523.00158.
McCarthy, J. J., Canziani, O. F., Leary, N. A., Dokken, D. J., & White, K. S. (2001). Contribution of Working Group IIto th third Assessment Report of the Intergovernmental Panel on Climate Change (IPCC). (B. Metz, O. Davidson, R. Swart, & J. Pan, Eds.) (p. 1000). Cambridge University Press, UK.
Nelson, D. R., Adger, W. N., & Brown, K. (2007). Adaptation to Environmental Change: Contributions of a Resilience Framework. Annual Review of Environment and Resources,

21
32(1), 395-419. Annual Reviews. doi: 10.1146/annurev.energy.32.051807.090348.
Peck, H. (2005). Drivers of supply chain vulnerability: an integrated framework. International Journal of Physical Distribution & Logistics Management, 35(4), 210-232. Emerald Group Publishing Limited. doi: 10.1108/09600030510599904.
Pratkanis, A. R., & Breckler, S. J. (1989). Attitude Structure and Function. Attitude structure and function. Lawrence Erlbaum Associates.
Vermeulen, S., Woodhill, J., Proctor, F., & Delnoye, R. (2008). Chain-Wide Learning for Inclusive Agrifood Market Development: A guide to multi-stakeholder processes for linking small-scale producers to modern markets (pp. 1-111). International Institute for Environment and Development (IIED) and Wageningen University and Research Centre. Retrieved from http://www.regoverningmarkets.org/en/resources/global/chain_wide_learning_guide_for_inclusive_agrifood_market_development.
Woodhill, J. (2008). Shaping behaviour. The Broker, (10), 4-8. doi: 10.1108/eb003851.