Embed Size (px)
Citation preview

Adaptation to Climate Change and its Impacts on Food Security:
Evidence from Niger
Solomon Asfaw1*, and Leslie Lipper1. 1* Food and Agricultural Organization of the United Nations, Agricultural Development Economics
Division, Viale delle Terme di Caracalla, 00153 Rome, Italy. E-mail: [email protected]
Abstract
We assess farmers' incentives and the conditioning factors for adoption of agricultural
technologies under climate risk and evaluate its impact on food security in Niger. Results show
that while the use of modern inputs and organic fertilizers improves productivity, results are
unclear for crop residues. Results also show that factors driving modern input use are different
than those of crop residues and organic fertilizer which can be characterized at low capital
requirements, higher labour requirements and longer time for results versus modern inputs which
can be characterized as higher capital requirements, less labour requirement and shorter time for
returns. Results show that greater climate variability increases use of risk-reducing inputs, but
reduce the use of modern inputs. Results presented have implications for understanding and
overcoming barriers to adoption, distinguishing structural aspects such as exposure and sensitivity
from potential interventions at the household or system levels linked to adaptive capacity.
JEL Classification: Q01, Q12, Q16, Q18
Key words: Climate change, adaptation, food security, multivariate probit, instrumental variable,
Niger, Africa

1
1. Introduction
Climate change and land degradation hinder agricultural productivity and the ability of the
agricultural sector to feed the world’s increasing population. This issue is particularly felt in Niger,
where the agriculture sector is characterised by land scarcity and unstable rainfall. A recent
mapping of vulnerability and poverty in Africa listed Niger as one of the countries that are both
most vulnerable to climate change and with the least capacity to respond (Orindi et al., 2006; Stige
et al., 2006). Given that agricultural production remains the main source of income for most rural
communities in Niger, the increased risk of crop failure associated with increased frequency of
extreme events poses a major threat to food security and poverty reduction. In view of this
impending climate change threat upon the poor, it is critical to have a deeper understanding of
the household adaptation strategies and targeted measures that could protect and improve the
livelihoods of the poor and ensure food security (Bradshaw et al., 2004).
Adaptation to current or expected climate variability and changing climate conditions
involves adjustment in natural or human systems in response to actual or expected climate stimuli
or their effects, which moderates harm or exploits beneficial opportunities (IPCC 2001). These may
include both on and off farm activities. At the farm level, there are a wide range of strategies that
may contribute to adaptation which include modifying planting times and changing to varieties
resistant to heat and drought (Phiri and Saka, 2008); development and adoption of new cultivars
(Eckhardt et al., 2009); changing the farm portfolio of crops and livestock (Howden et al., 2007);
improved soil and water management practices including conservation agriculture (Kurukulasuriya
and Rosenthal, 2003; McCarthy et al., 2011); increasing regional farm diversity (Reidsma and
Ewert, 2008) and shifting to non-farm livelihood sources (Morton, 2007). Which of these actually
contribute to adaptation depends on the locally specific effects climate change has and will have,
as well as agro-ecological conditions and socio-economic factors such as market development.
Adaptation also depends on the farmer’s capacity and incentives to undertake adjustments in
farming practices, e.g. their adaptive capacity.
Despite growing policy interest in adaptation, and increasing resources dedicated to
promoting a range of sustainable land management and productivity enhancing practices in many
regions, the level of use of these practices in Niger is generally quite low, perhaps leading to
stagnant or worsening yields and continuing land degradation. One question that arises is whether
these practices are actually effective adaptation strategies in the specific circumstances of

2
Nigerien farmers – e.g. their adaptation effectiveness. A second question is how household and
system-level adaptive capacity, or lack thereof, affects the selection of farm practices with
adaptation benefit.
Given the scarce evidence available for Niger and the Sahel area in general, this paper
generates empirical evidence on farmers' incentives and the conditioning factors that hinder or
accelerate the use of a set of potentially risk-reducing climate-smart agricultural practices (organic
fertilizers, crop residues, legume intercropping, soil and water conservation practices (SWC)) that
are high priorities in the Nigerien National Agricultural Plan. They are considered effective in terms
of increasing resilience of agricultural systems and reducing exposure to climate shocks, and in this
way contribute to adaptation. We also consider two practices that are aimed primarily at
improving average yields, though with uncertain benefits in terms of adapting to climate change
and in reducing risk to current climate stresses (improved varieties and use of inorganic
fertilizers)1. And a second objective is to understand which practices have the potential to boost
agricultural productivity and increase incomes under varying climate conditions.
The question this paper aims to address contributes to the growing literature on
agricultural technology adoption and adaptation(e.g., Pender and Gebremedhin, 2007; Kassie et
al., 2010, 2013; Tekleword et al., 2013; Di Falco et al., 2011; Di Falco and Veronesi, 2012; Deressa
and Hassen, 2010) and also contributes to the literature on quantification of vulnerability and
adaptive capacity (Adger et al., 2004; Smit and Wandel, 2006; Adger, 2006; Gallopin, 2006; Fussel,
2007 & 2009; Engle, 2009; Panda et al., 2013). Our contribution to the existing literature is
fourfold: firstly our analysis uses a comprehensive large national representative plot-level survey
with rich socio-economic information, merged with geo-referenced climatic information. This
allows us to evaluate the role of bio-physical and climatic variables in determining farmers’ input
use decisions, and consequently, the impact on crop productivity and profitability. We argue that
climate variability and other shifts in recent climate patterns are major determinants of farm
practice choices, extending the literature which examines the effects of weather shocks using the
level of rainfall or deviation from its mean on productivity. While acknowledging the important
role of weather shocks, we pay particular attention to long term climate variability as a proxy for
expectations about future uncertainty. Second, we explicitly account for the possibility of farmers’
choosing a mix of practices (Teklewold et al., 2013). In order to model simultaneous and 1 The choice of the set of agricultural practices considered in this paper is mainly driven by the availability of data - the use of organic and inorganic fertilizer, crop residue, improved seed as well as anti-erosion measures are very well documented in the survey. The survey questionnaire also provides a rich section on tree plantation, but unfortunately the response rate in this section was very low, which made this set of information not usable.

3
correlated farming practice selection decisions we used a method that takes into account the
potential interdependence between different practices. Third, we estimate the causal impact of
use of these practices on productivity using instrumental variables techniques (IV) improved using
the Lewbel (2012) method, as well as conditional recursive mixed process (CMP) estimators as
proposed by Roodman (2011), which take into account both simultaneity and endogeneity risks,
and produce consistent estimates for recursive systems in which all endogenous variables appear
on the right-hand-side as observed. Finally, given the absence of evidence on the use and impact
of climate-smart farming practices from the Sahel area at large and from Niger in particular, which
is largely attributed to the lack of reliable data from this country, our study itself adds great value
in filling this gap in the existing literature 2.
The paper is structured as follows. In section 2 we provide a detailed review of the existing
literature with a specific focus on the existing evidence for Sub-Saharan Africa, whereas in section
3 we describe the data used and provide some descriptive results. In section 4 we describe the
empirical methodology used. Section 5 presents the empirical results, and in section 6 we draw
conclusions and provide policy implications.
2. Literature review
We attempt here to link two important strands of literature that have developed separately but
that are key in discussing adaptation in smallholder agricultural systems; namely that on risk and
adoption of agricultural technologies based in the economic tradition, and that on vulnerability
and adaptive capacity as presented from different disciplinary perspectives in the climate change
literature. The results presented in the paper rely on techniques and theory of the former, and on
the context and narrative of the latter. We link the two strands to provide new insights on
practical aspects of adaptive capacity on the ground and how it links to farmers’ decisions under
climate risk.
Starting with the impact of risk on practice selection, there is a large body of literature on
the theoretical and empirical impacts of production risk, as well as on the supply and demand side
constraints on farmers’ ex ante production technology choices (e.g., Fafchamps, 1999, 1992;
Chavas and Holt 1996; Just and Candler, 1985, Sadoulet and de Janvry, 1995; Kassie et al., 2008; Di
Falco et al., 2011; Di Falco et al., 2014). This literature indicates that there are several barriers to
technology use, ranging from lack of insurance and limited credit access to price risk, and mainly
2 The only studies coming from Niger or from the Sahel area that we are aware of are Baidun-Forson (1994) and Baidun-Forson (1999).

4
focuses on the impact of production risk on overall output. Pope and Kramer (1979) considered
inputs that could be both risk-increasing and risk-decreasing. In general, the use of risk-decreasing
inputs increases where producers are more risk-averse or are in more risk-prone environments,
which is important in the context of climate change. In particular, many sustainable land
management (SLM) practices are risk-decreasing, so that the increased frequency of extreme
weather events should favour adoption of SLM.
There are few empirical studies that explicitly evaluate the impact of climate risk on the
adoption of SLM practices or other input choices (e.g. Kassie et al., 2008; Arslan et al. (2013);
Heltberg and Tarp, 2002; Deressa et al., 2011; Di Falco and Veronesi, 2012; Di Falco et al., 2014;
Deschenes and Greenstone, 2007; Seo and Mendelsohn, 2008; Kurukulasuriya and Mendelsohn,
2008; Seo and Mendelsohn, 2008; Wang et al., 2010). Arslan et al. (2013) provided evidence of a
positive correlation between rainfall variability and the selection of of SLM type practices. Kassie
et al. (2008) found that production risk deters adoption of fertilizer, but has no effect on the
conservation agriculture adoption decision. Heltberg and Tarp (2002) found that farmers located
in regions with greater exposure to extreme climate events were less likely to engage in market
transactions, implying a greater emphasis on meeting subsistence needs with own production.
Aside from risk, several supply and demand side constraints have also been identified to account
for the use of SLM practices, including high up-front costs but delayed benefits (Sylwester, 2004),
credit and insurance market imperfections (Carter and Barrett, 2006), tenure insecurity (Pender
and Gebremedhin, 2007), household endowments of physical and human capital (Pender and
Fafchamps, 2005), agricultural extension and market access (Holden and Shiferaw, 2004;
Teklewold et al., 2013b; Arslan et al., 2013) and limited off-farm opportunities (Pender and
Gebremedhin, 2007). McCarthy et al. (2011) synthesized recent empirical literature on factors
affecting the use of SLM practices, with a strong focus on sub-Saharan Africa.
Turning to the literature on adaptive capacity, the concepts of exposure and sensitivity, as
well as scale of adaptive capacity, are key. The above literature is also very relevant to the ongoing
work in the global climate change community in the area of adaptation to climate change, and
specifically to the debate on vulnerability, resilience, and adaptive capacity. In the vulnerability
literature, Fussel (2007) nicely summarizes the different approaches to vulnerability in different
fields, and presents a framework distinguishing between aspects of vulnerability that are internal
and external to the system considered, such as that between the socio-economic and the bio-
physical. Adaptive capacity expresses the ability of a system to prepare for stresses and changes in

5
advance or adjust and respond to the effects caused by the stresses, thereby modulating the
sensitivity of the system so as to decrease vulnerability (Smit et al., 2001).3
Engle (2011) makes an important distinction between characterizing adaptive capacity and
measuring it. He highlights how most studies have focused on characterizing adaptive capacity,
intended as assessments based on predetermined system attributes that are assumed to increase
adaptive capacity. The use of aggregated indices that assess adaptive capacity based on
assumptions about its determinants fall into this category (e.g. Brooks et al., 2005; Patt et al,
2010). The alternative is to directly assess the adaptive capacity in a system, so as to understand
what factors determine this capacity. An example of the latter approach is provided by Panda et al
(2013) where the propensity to adopt farming practices that maintain higher yields is analysed,
highlighting the importance of risk-reducing options such as crop insurance in determining
adaptive capacity. It is not unusual in the adaptation literature to assume that engaging in
agricultural practices or technologies that increase incomes, and more specifically yields,
represents a measure of adaptive capacity (e.g., Di Falco et al., 2011; Kassie et al., 2008; Branca et
al. 2011). In this paper we take a similar view on the yield impacts of farm practice selection,
hypothesizing that the selection of practices associated with higher productivity is indication of
adaptive capacity.
3. Data description and descriptive statistics
3.1 Data
We use two main sources of data in our analysis: socio-economic data from the Niger National
Survey of Household Living Conditions and Agriculture (ECVMA) and historical data on rainfall and
temperature from the National Oceanic and Atmospheric Administration (NOAA) and the
European Centre for Medium Range Weather Forecasts (ECVMA), respectively.
The primary source of our socio-economic data is the Niger ECVMA survey which was
conducted from July to December 2011 and implemented by the Niger Institut National de la
Statistique (INS) in collaboration with the World Bank. The data is representative at the national,
(major) regional, and urban/rural-level. The household sample is drawn from all 8 regions of the
country with the exception of certain strata in Arlit (Agadez Region) because of difficulties in
3 In this paper we focus on the link between vulnerability and adaptive capacity; however, there is also a focus on resilience to illustrate the characteristics of systems that achieve a desirable state in the face of change, being applied to socio-ecological systems (Folke, 2006; Janssen et al., 2006). Adaptive capacity in the resilience literature (or adaptability) is the capacity of actors in the system to manage and influence resilience (Walker et al. 2004). Hence, adaptive capacity is a concept shared by the resilience and vulnerability strands of literature (Engle, 2011); however, for empirical applications we find the vulnerability framework to be more informative.

6
reaching the location. The sample was chosen through a random two stages process, at the end of
which 270 enumeration areas (EA) and 4074 households were drawn. It was designed to provide
information on various aspects of household welfare in Niger such as household composition and
characteristics, health, wage employment, and income sources, as well as data on consumption,
food security, nonfarm enterprises, and durable and agricultural asset ownership, among other
topics.4 For households that were involved in agricultural activities, data was also collected on
land tenure, labour and non-labour input use, and crop cultivation and production at the plot
level. Data was also collected at community level to capture determinants of system-level adaptive
capacity in terms of enabling factors for adaptation, which include issues related to collective
action, access to information, and to infrastructure including market and roads, among others.
The ECVMA survey data also recorded geo-referenced household and EA level Latitude and
Longitude coordinates using handheld global positioning system (GPS) devices, which creates the
possibility of linking household level data with geo-referenced climate and soil data. We extracted
time series indicators such as historical rainfall and temperature at the highest resolution and
longest time period publicly available at the time of writing.
Rainfall data are extracted from the Africa Rainfall Climatology version 2 (ARC2) of the
National Oceanic and Atmospheric Administration’s Climate Prediction Center (NOAA-CPC) for
each dekad (i.e. 10 day intervals) covering the period of 1983-2012. ARC2 data are based on the
latest estimation techniques on a daily basis and have a spatial resolution of 0.1 degrees (~10km).5
Temperature data are surface temperature measurements at each dekad for the period of 1989-
2010 obtained from the European Centre for Medium-Range Weather Forecasts (ECMWF) at a
spatial resolution of 0.25 degrees.6
These data are then merged with the ECVMA data at the EA level (270 EAs in ECVMA) to
create a set of exposure to climate variables to represent the short and long term variations both
within- and across-years in rainfall and temperature that are hypothesized to affect adoption of
agricultural practices and agricultural productivity based on the agronomy, climate and economics
literature. Some of the exposure variables created include rainfall during the growing season, long-
term mean rainfall and the coefficient of variation in rainfall, as well as mean and maximum
temperature and the coefficient of variation of maximum temperature (1983-2011). Taking the
4 We restricted the sample to rural households involved in farming activities during the rainy season. At the end of the cleaning process our sample was
composed 5340 plots with 1938 households (see table 1) 5 Average of a 10 km radius buffer of decadal sum of daily values per each enumeration area centroid. For more details on ARC2 algorithms see:
http://www.cpc.ncep.noaa.gov/products/fews/AFR_CLIM/AMS_ARC2a.pdf 6 Point extraction per each enumeration area centre point of values of average of a 50 km radius buffer of decadal values.

7
annual measure of main cropping season rainfall at each EA level, we calculate the coefficient of
variation for rainfall (CV), measured as the standard deviation divided by the mean for the
respective periods: 1983-2011, which is scale invariant, thereby providing a comparable measure
of variation for households that may have very different rainfall levels.
We also extracted EA level information on soil nutrient availability from the Harmonized
World Soil database (HWSD) to control for the effects of bio-physical characteristics. The HWSD
has a resolution of 30 arc-seconds and combines existing regional and national updates of soil
information worldwide.7
By merging the ECVMA data with historical data on rainfall and temperature at the
community level, we create a unique data set allowing for microeconomic analysis of climate
impacts in Niger. To the best of our knowledge, there are no other studies that bring together
such data from various sources to understand the linkages between climate variability and
adoption of farming practices that have adaptation potential.
<TABLE 1 ABOUT HERE>
Description of climate variability in Niger
We provide a detailed description of the climate variables available (both objective and subjective)
and a preliminary view of how they may influence their adaptation strategies. Data from NOAA
presented in Figure 1 show the time pattern of average rainfalls and temperature during the rainy
season in Niger by land use type.
<FIGURE 1 ABOUT HERE>
Figure 1 clearly shows that the amount of rainfall is increasing over time with minor
differences among land use types. This trend is confirmed by forecasts from NECSD (2006) which
predicted rainfalls to increase in the Sahel region due to climate change. We can observe in Figure
1 very high oscillations in the rainfall pattern. This is also evident from Figure 2 which shows the
distribution of the coefficient of variation of rainfall across time. We can observe that the pastoral
areas experience relatively low levels of rainfall and high variability compared to the agricultural
and agro-pastoral areas. Figure 3 also shows the distribution of current and long run average
rainfall and we can observe significant differences across the different land use types. Such high
temporal and spatial rainfall variability makes Nigerien farmers vulnerable, hindering the ability of
national agricultural production to satisfy the increasing population’s demand for food.
7 The HWSD is based on a spatial layer with Soil Mapping Units (SMU) linked to a Microsoft Access .mdb file storing the various parameters for the SMUs. Each SMU is a combination of different subunits, without spatial attributes but showing a different area share. For more information see: http://webarchive.iiasa.ac.at/Research/LUC/External-World-soil-database/HTML/

8
<FIGURE 2 AND 3 ABOUT HERE>
Average and maximum temperature trends over time also provide a good picture of the
problems from climate change in Niger. As shown in Figure 1 average temperatures in the rainy
season are clearly increasing over time. Figure 4 also shows the spatial distribution of the current
and long run average temperature which indicate temporal and spatial differences and variability.
Although Nigerien farmers are specialized in the cultivation of crops that are particularly resistant
to high temperatures (for example, millet and sorghum), the increase in the temperature level will
eventually change farming environments in the three land use types. In particular, one of the most
plausible scenarios is the expansion of the desert areas (Kandji et al., 2006); as only less than 15%
of the land is arable (IFAD, 2009), a further expansion of the Sahara would further constrain the
production of the country’s agricultural sector.
<FIGURE 4 ABOUT HERE>
To complement the objective climate data presented above, we also present more
subjective data from the agriculture section module of the ECVM/A. They provide information on
how households involved in agriculture activities perceive climate change, as well as the strategies
used to adapt to and mitigate the effect of climate changes.
Most of the households interviewed reported changes in rainfall and temperature patterns
in the 5 years preceding the interview (see Table 2). Despite what we observed in Figure 1, in all
land use types the most relevant phenomena are the reduction in the amount of rainfall (this is
probably a consequence of the 2009 drought) and the change in the distribution of rain. The
general tendency for the sample households is to report less rainfall (81%), worse rain distribution
(77%) and more frequent droughts (84%); this is particularly true for pastoral areas. Although
agricultural areas share the same overall patterns, 38% of households report more frequent floods
compared to 19% for both agro-pastoral and pastoral areas. About 72% and 82% of the sample
households reported respectively more of a delayed start and an early finish of the rainy season in
the 5 years before the interview. Changes in temperatures also affected 65% of Nigerien
households, who reported longer heat periods.
<TABLE 2 ABOUT HERE>
Since the 3 or 4 months-long Nigerien rainy season feeds the population for 12 months,
changes in its timing, duration or intensity have strong implications in terms of agricultural
production and food security for the country. Table 3 provides a picture of the most common
strategies households used to adapt to the effects of climate change. The most commonly used

9
strategies across all land use types is to diversify income sources (48%) especially in pastoral areas
and where climate change manifests through a change in rainfall patterns. Migration is also a
common strategy used mostly in the agricultural zones of the country. Change in seeds varieties,
use of anti-erosion methods and switches from livestock raising to crop production are also quite
common strategies used, particularly in agricultural and agro-pastoral areas. Households in
pastoral zones tend to engage more in dry-season agriculture and to raise fewer sheep and switch
to goats when facing changes in temperatures and in rainfall patterns.
<TABLE 3 ABOUT HERE>
3.2 Description of agricultural technologies and socio-economic variables
Given our dataset, we focus on four different potentially climate-smart agricultural practices (use
of crop residue, legume intercropping, soil and water conservation (SWC), and use of organic
fertilizer) and consider two practices that are aimed primarily at improving average yields
(improved varieties and use of inorganic fertilizers). Table 4 shows the proportion of households
that implement the aforementioned agricultural practices on their plots, disaggregated by land
use type.
Unlike legume intercropping, the use of crop residue8 is more widespread in the rural areas
of the country and particularly in Maradi’s, Zinder’s and Diffa’s agro-pastoral zones. Crop residue is
practiced on about 40% of the plots during the cropping season analysed, whereas legume
intercropping is practiced in only 6% of the plots.
SWC structures provide multiple on-farm private benefits in the form of increased and
more stable yields by reducing water erosion, improving water quality, and promoting the
formation of natural terraces over time, in addition to providing off-farm private and public
benefits (Blanco and Lal, 2008; McCarthy et al., 2011). SWC structures considered here include
sand bags, half moons, zai, tree belts, and wall and stone perimeters. Erosion problems9 are
reported on more than 15% of the plots in the sample. The problem is particularly acute in the
pastoral areas, reporting 27% of the plots affected by erosion. Despite the high rate of erosion, we
can observe from Table 4 that the use of an anti-erosion measure is very low in all the land use
8 It is however important to point out that for farmers in Niger crop residues are highly valuable as they are used as feed for livestock, as fuel for cooking, and as thatching/craft material.
9 The ECVM/A dedicates a section of the agriculture questionnaire to erosion problems affecting land owned by the household. Even if not based on a scientific measurement of the level of degradation of the soil, the section provides a good picture of farmers’ perception of the problem. According to the literature discussed above (Knowler & Bradshaw, 2007) the perceived severity, more than the actual magnitude, of the erosion issue is a key determinant for farmers’ use of sustainable land management practices; thus this information is of paramount importance for our analysis.

10
types. Only 3% (4% in pastoral areas) of the plots have been treated using techniques aiming to
off-set the effects of soil degradation.
Use of organic fertilizer is another major component of a sustainable agricultural system
and a commonly suggested method of improving soil fertility, while capturing economies of scope
in crop-livestock systems. Our data show that organic fertilizer (which is composed of animal
manure, compost and green manure) is used on about 33% of the sample plots. The uptake seems
to also be heterogeneous across the different land use types.
The use of high yielding varieties could contribute to improving food security and income
for the rural population by providing higher yields (e.g., Kijima et al., 2008; Mendola, 2007; Asfaw
et al., 2012a, 2012b; Amare et al., 2011 etc). Nevertheless, whether improved high yielding
varieties perform better than local varieties under harsh climatic conditions is very much an
empirical question. Despite the potential productivity benefit, the proportion of plots planted with
improved varieties in Niger is only about 2%. We also consider the utilization of inorganic
fertilizers and our data show that about 11% of sample plots are treated with inorganic fertilizer,
which is relatively high compared to the use of improved seeds. Looking across the different land
use types, there seems to be significant differences in the use of inorganic fertilizers. Although the
impact on productivity of using inorganic fertilizer and improved seed is widely documented, the
benefits in terms of adapting to climate change and/or reducing risk to current climate stresses is
uncertain.
Given the very low uptake of some of the practices (e.g. legume intercropping, improved
varieties and SWC measures), in the subsequent section we mainly focus and organize our
descriptive and empirical analysis on three major inputs/techniques widely used by Nigerien
farmers: organic fertilizers (O), modern inputs (use of inorganic fertilizer or improved seed)10 (F),
and crop residues (R).
<TABLE 4 ABOUT HERE>
Table 5 reports the adoption of combined practices on the same plot to understand
whether farmers in Niger use a mix of measures to deal with a multitude of production constraints
rather than use a single practice. Of the 5350 plots considered in the analysis, about 61% of the
plots benefited from one or more farm management practices, although all three of the practices
were applied on only 3% of the plots. Table 5 reveals that although the use of crop residues and
organic fertilizers are used in most of the cases as a standalone practice, it is not uncommon to
10 We have grouped both the use of inorganic fertilizer and improved seed into one category since the level of use for improved seeds is very low.

11
find them combined together, especially in agricultural and agro-pastoral areas. On the other
hand, the use of modern inputs in combination with other inputs is quite low. The bottom line is
that the proportions of use of a given practice in combination with other practices are relatively
small, indicating that there are few dominant packages. Instead, this evidence suggests that
individual households are choosing packages specific to the agro-ecological and socio-economic
characteristics.
<TABLE 5 ABOUT HERE>
In Table 6 we analyze if adopters and non-adopters of these three inputs/techniques are
distinguishable in terms of crop productivity.11 Results show that users of modern inputs are
statistically distinguishable in terms of crop productivity. Plots with modern inputs perform better
than plots without modern inputs in terms of value of harvest in all land use types. On the other
hand, users of crop residues tend to have lower crop productivity compared to non-users. It is
important however to point that the results presented above are all indicative of the potential
impact of use of these practices on crop productivity. Thus, in the subsequent sections we will
carry out a rigorous empirical analysis to verify whether these differences in productivity remain
unchanged after controlling for all confounding factors.
<TABLE 6 ABOUT HERE>
4. Empirical strategies
4.1. Modeling the adoption decision
Based on the extensive literature on the choice of farming practice (including input use), we model
the farming practice selection decision as the outcome of a constrained optimization problem by
rational agents (Feder et al. 1985; Foster and Rosenzweig, 2000; Suri, 2011 and de Janvry et al.
2010). The most common constraints include those on the budget, access to information, credit
and the availability of both technology and other inputs. Households are assumed to maximize
their utility, subject to these constraints, and adopt a given technology if and only if the
technology is available and affordable, and at the same time the selection decision is expected to
be beneficial (in terms of profits or otherwise) (de Janvry et al., 2010).
11 We have considered all major crops cultivated during the rainy season for the analysis, which include millet, rice, sorghum, peanuts, sorrel, rice,
maize, sesame, cassava, okra, onion, potatoes and other crops. Productivity is measured in terms of value (CFAC per acre) instead of quantities (kg per acre) because of the difficulty of aggregation of different kinds of crops, grown on the same plot, having different productivity levels and economic values, which might lead to misleading results. To compute the value of the harvest, each crop has been evaluated using average market price for the community computed from the consumption section of the questionnaire.

12
We model utility as a function of the income gained from each plot, so that the adoption
decision of farmer i for the cropping season t can be expressed as follows:
Aik(t−1)j = � 1 if Et−1 ��Yikt�Aik(t−1)
j = 1� − �Yikt�Aik(t−1)j = 0�� > 0
0 otherwise (1)
Where Aik(t−1)j is farmer i’s binary adoption decision for practice j on plot k at time t-1, which
denotes the time when adoption decisions are taken, and Yikt is the vector of outputs considered
in our model (productivity) from plot k at time t. In other words, equation 1 states that farmer i
adopts practice j if at time (t-1) he/she expects that productivity/profit at time t will be higher
under adoption. More specifically the output of plot k at time t can be expressed as:
Yikt = α′Vikt + β′Wct + γjAik(t−1)j + εikt (2)
Where Vikt is a vector of household, plot and community characteristics, Wct is a bundle of
climatic variables characterising the cropping season at time t in community c, and εikt is the error
term. Therefore we can rewrite the adoption condition equation as follows:
Et−1 �Yikt|Aik(t−1)j = 1� − Et−1 �Yikt|Aik(t−1)
j = 0� = α′Vik(t−1) + β′Wc(t−1) + Et−1(γj) −
�α′Vik(t−1) + β′Wc(t−1)� = Et−1(γj) > 0 (3)
Despite being quite obvious, this means that farmers select a given practice if and only if
the expectations for its impact built at time (t-1), Et−1(γj), is positive. Given the fact that the
impact of adoption is case specific, it is then reasonable to model the expected impact of adoption
as a function of the observed variables that also affect production and unobservable
characteristics (Uikt).
Et−1(γj) = f�Vik(t−1); Wct−1; Uik(t−1)� > 0 (4)
Farmers are also more likely to adopt a mix of measures to deal with a multitude of
production constraints than to adopt a single practice. In this context, recent empirical studies of
technology adoption decisions assume that farmers consider a set of possible technologies and
choose the particular technology bundle that maximizes expected utility, accounting for
interdependent and simultaneous adoption decisions (Dorfman, 1996; Teklewold et al., 2013). In
order to be able to account for this interdependency, we use a multivariate probit (MVP)
technique applied to multiple plot observations to jointly analyze the factors that increase or
decrease the probability of adopting each agricultural practice analyzed in this paper. This
approach simultaneously models the influence of the set of explanatory variables on each of the
practices, while allowing the unobserved and unmeasured factors (error terms) to be freely

13
correlated. One source of correlation may be due to complementarity (positive correlation) or
substitutability (negative correlation) between different practices.
The MVP model is characterised by a set of binary dependent variables (Aik(t−1)j ) that equal
1 if farmer i adopts the practice j on plot k, and zero otherwise, such that:
Aik(t−1)j = �1 if Aijk
∗ = δVik(t−1) + θWc(t−1) + ejk(t−1) > 00 otherwise
, for each j=1,...,j (5)
In equation (5) the assumption is that the rational thi farmer has a latent variable, *ijkG , which
captures the observed and unobserved preferences or demand associated with the thj practice.
This latent variable is assumed to be a linear combination of farmer, household, plot, climatic and
community characteristics (Vkt-1 and Wct1,) that affect the use of the jth practice, as well as
unobserved characteristics (Ukt-1) captured by the error term ukt-1.
Based on empirical work and economic theory, we have summarized variables
hypothesized to explain the adoption decision and resulting yield increase under four major
categories: (i) exposure to climatic stress, (ii) bio-physical sensitivity to such stress, (iii) household-
level determinants of adaptive capacity in terms of farmers’ ability to prepare and adjust to the
resulting stress, and, finally, (iv) system-level determinants of adaptive capacity in terms of
enabling factors for adaptation. The rationale of these sets of variables and their characteristics
are described in more detail below (see table 7).
The first variables used in the analyses are climate variables that characterise exposure to
climate-related stress. For input decisions, we use long-term historical data on rainfall patterns
and temperatures to capture expected climate at the beginning of the season. For productivity, we
include actual climate realizations. For input decisions, we use the coefficient of variation in
rainfall (1983-2011), average rainfall shortfall (1983-2011) 12 , the coefficient of variation
temperature and number of dekads in which the maximum temperature was greater than 35
degrees. Greater riskiness, reflected in the coefficients of variation and average shortfall, is
expected to increase use of risk-reducing inputs, but decrease use of modern inputs. Higher
maximum temperatures are also expected to increase risk-reducing inputs such as crop residue
and organic fertilizer, whereas lower maximum temperatures should favour improved seeds and
chemical fertilizer use. For productivity, we use growing season rainfall and self-reported delay in
onset of rainfall observed in the growing season.
12 The shortfall variable has been computed as the average distance between the yearly precipitations during rainy season and their long-term mean.
Those years reporting a level of rainfall higher than the long-run average have not been considered for the computation of the variable.

14
We include several plot-specific characteristics, such as soil nutrient availability constraints,
plot size, types of soil on the plot and topography of the plot. Land size can be expected to affect
input use positively as farmers with larger land size may find it easier to experiment with a new
technology on a part of their land.
When considering system-level determinants of adaptive capacity, access to institutions
and transaction costs are among the main determinants governing input choice decisions. This
study proxies transaction costs and access to institutions via observable factors that explain
transaction costs or mitigate transactions costs, such as geographical areas, distance-related
variables and road density. By increasing travel time and transport costs, distance-related
variables are expected to have a negative influence on input use decisions. By facilitating
information flow or mitigating transactions costs, access to institutions variables are expected to
have a positive effect on the input use decision.
A diverse set of potential household level determinants of adaptive capacity are
considered. Household wealth indicators include a wealth index13 based on durable goods
ownership and housing condition, an agricultural machinery index based on agricultural
implements and machinery access, and livestock size (measured in tropical livestock units (TLU)).
Household size, age, gender, sex ratio and education level of the household head are also
included. Family size in terms of adult equivalent units is a potential indicator of labour supply for
production, and labour bottlenecks can also be a significant constraint to the use of some farm
management practices. Furthermore, land tenure status is taken into consideration since tenure
security increases the likelihood that farmers adopt strategies that will capture the returns from
their investments in the long run (e.g. Kassie et al., 2010; Denning et al., 2009; Teklewold et al.,
2013).
<TABLE 7 ABOUT HERE>
13 The household wealth index is constructed using principal component analysis, which uses assets and other ownerships. In this specific case the following variables have been included: number of (per-capita) rooms in the dwelling, a set of dummy variables accounting for the ownership of dwelling, mortar, bed, table, chair, fan, radio, tape/CD player, TV/VCR, sewing machine, paraffin/kerosene/electric/gas stove, refrigerator, bicycle, car/motorcycle/minibus/lorry, beer brewing drum, sofa, coffee table, cupboard, lantern, clock, iron, computer, fixed phone line, cell phone, satellite dish, air-conditioner, washing machine, generator, solar panel, desk, and a vector of dummy variables capturing access to improved outer walls, roof, floor, toilet, and water source. The household agricultural implement access index is also computed using principal components analysis and covers a range of dummy variables on the ownership of hand hoe, slasher, axe, sprayer, panga knife, sickle, treadle pump, watering can, ox cart, ox plough, tractor, tractor plough, ridger, cultivator, generator, motorized pump, grain mail, chicken house, livestock kraal, poultry kraal, storage house, granary, barn, and pig sty.

15
4.2 Modeling the effect of adoption on crop outcomes
Taking productivity impacts as a key indicator of adaptive capacity, we move to an analysis of the
relationship between farm practice selection and crop outcomes. In this respect, the relevant
estimating equation for the yield model is given by equation 2. The impact of adoption of the jth
practice on the outcome variables is measured by the estimate of the parameter γj. Estimating
crop outcome as in this equation, however, might generate biased estimates because it assumes
that agricultural practice selection (or input use) (A) is exogenously determined, while it is likely
endogenous, as discussed above. To make this more explicit we can insert equation 4 into
equation 2 as follows:
Yikt = α′Vikt + β′Wct + γjAik(t−1)j �Vik(t−1); Wct−1; Uik(t−1)� + εikt (6)
Given that time t immediately follows t-1 from a chronological perspective, it is quite intuitive that
variables involving household, community and soil characteristics are expected to change only
marginally between the two time periods, which implies that equation 6 can be rewritten as
follows:
Yikt = α′Vikt + β′Wct + γjAik(t−1)j �Vikt; Wct−1; Uik(t−1)� + εikt (7)
It is clear from equation 7 that Aikt−1j is endogenous; farmers who select a certain practice
may have systematically different characteristics from the farmers who do not. Therefore, to
explicitly account for multiple endogeneity problems in our structural model, we employ the
conditional recursive mixed-process estimator (CMP) as proposed by Roodman (2011). This
approach is suitable for a large family of multi-equation systems where the dependent variable of
each equation may have a different format. It also takes into account both simultaneity and
endogeneity, and produces consistent estimates for recursive systems in which all endogenous
variables appear on the right-hand-side as observed. The major limitations of implementing this
approach is computational burden and on achieving convergence especially for a large family of
multi-equations. Therefore we restricted ourselves to a maximum of four equations which are
seen below:
Yikt = α′Vikt + β′Wct + γ1Aik(t−1)1 + γ2Aik(t−1)
2 + εikt (8)
Aikt−1j = δVikt + θWc(t−1) + ejk(t−1) , for j=1, 2, 3 (9)
The consistency of this method depends on the validity of instruments to identify the
adoption equations, which in turn, rely on two conditions. First, the instruments must be
correlated with the endogenous variables (use of agricultural practices). Second, they must not be
16
correlated with the unobserved factors that may affect the plot’s productivity (i.e. εkt). We
consider using the coefficient of variation of rainfall (1983-2010), average shortfall of rainfall
(2006-2010) and number of dekades the average temperatures is greater than 35ºC (1983-2010)
as potential instruments for the household decision to use agricultural practices during the current
year. If farmers form expectations about the climatic conditions of their area, we might expect
that they plant crops and use farm practices that are suited to their expectations. The formation of
these expectations is key for production. Thus for households in rural areas, climate variation
across space and time should generate corresponding variation in household response or
behaviour in term of change in farm practices that will in turn create variation in agricultural
output and thus household income. Its impact on expected utility maximization is realized mainly
through production technology choices. For this reason, we focus on climate variability which, we
argue, generates uncertainty about expected climatic conditions.
5. Results and discussion
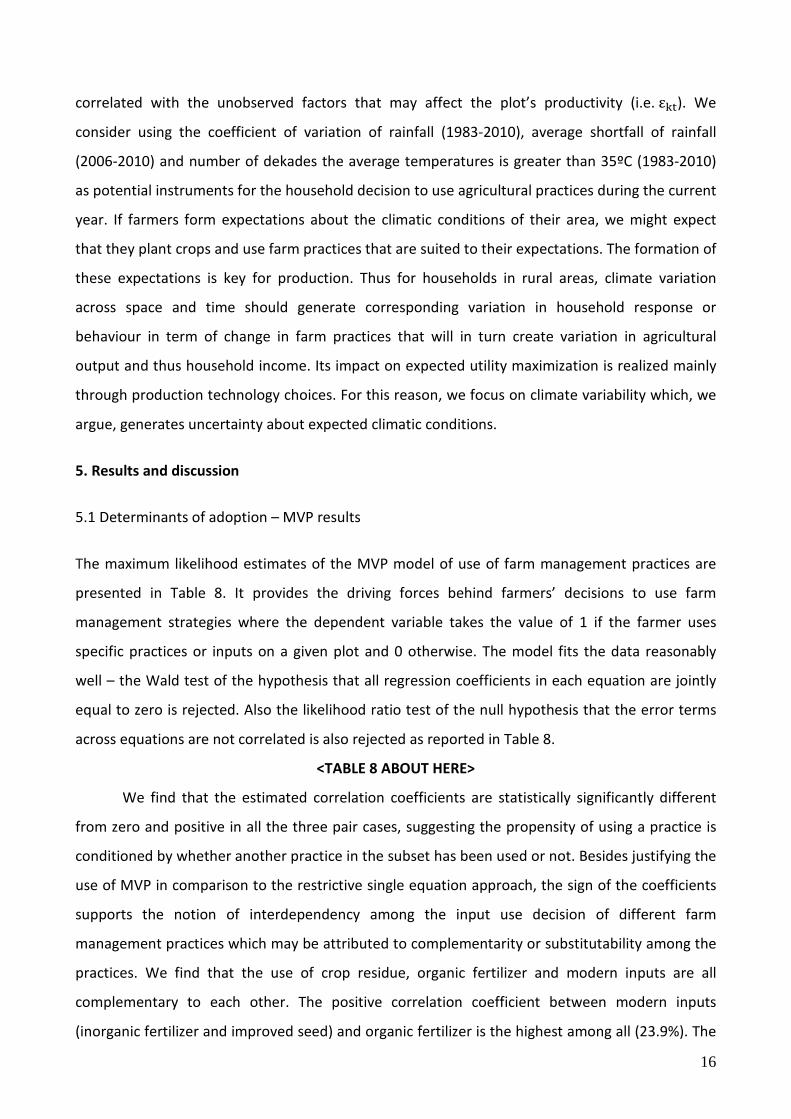
5.1 Determinants of adoption – MVP results
The maximum likelihood estimates of the MVP model of use of farm management practices are
presented in Table 8. It provides the driving forces behind farmers’ decisions to use farm
management strategies where the dependent variable takes the value of 1 if the farmer uses
specific practices or inputs on a given plot and 0 otherwise. The model fits the data reasonably
well – the Wald test of the hypothesis that all regression coefficients in each equation are jointly
equal to zero is rejected. Also the likelihood ratio test of the null hypothesis that the error terms
across equations are not correlated is also rejected as reported in Table 8.
<TABLE 8 ABOUT HERE>
We find that the estimated correlation coefficients are statistically significantly different
from zero and positive in all the three pair cases, suggesting the propensity of using a practice is
conditioned by whether another practice in the subset has been used or not. Besides justifying the
use of MVP in comparison to the restrictive single equation approach, the sign of the coefficients
supports the notion of interdependency among the input use decision of different farm
management practices which may be attributed to complementarity or substitutability among the
practices. We find that the use of crop residue, organic fertilizer and modern inputs are all
complementary to each other. The positive correlation coefficient between modern inputs
(inorganic fertilizer and improved seed) and organic fertilizer is the highest among all (23.9%). The

17
positive correlation between modern inputs and use of organic fertilizer indicates that, given the
very low soil fertility of most farmland in Niger currently, low cost fertility-improving inputs are
still complements and not yet substitutes. The use of multiple fertility-enhancing inputs also
indicates that for many households, different constraints are binding on the different fertility-
enhancing inputs.
The MVP results reported in Table 8 also show that decisions to use different farm
management practices are quite distinct and, to a larger extent, the factors governing the decision
of each of them are also different, suggesting the heterogeneity in use of farm management
practices.
Results show the importance of climatic variables, i.e., exposure, in explaining the
probability of farm households’ decision to use different agricultural practices. We find that
greater variability in rainfall and maximum temperature during the growing season increase the
use of risk-reducing practices. For instance, in regions with greater variability in rainfall and
temperature, more crop residue measures are used. On the other hand, the probability of using
modern inputs and organic fertilizer is negatively correlated with variability in rainfall and
temperature. Climatic shocks as represented by average shortfall of rainfall negatively affect the
propensity to use crop residue and organic fertilizer though for crop residues this result is not
statistically significant. We also find that in communities where temperature is higher (i.e. the
number of dekades the average maximum temperature was over 35 degrees Celsius), farm
households are more likely to use crop residues but less of organic fertilizers14. Our results are
consistent with the findings of Kassie et al. (2010) and Teklewold et al. (2013a), who found that
yield enhancing technologies like improved seeds and inorganic fertilizer provide a higher crop
return in wetter areas than in drier areas. Our findings are also consistent with Arslan et al. (2013),
who found a positive relationship between the use of conservation agriculture and climate
variability. Overall our findings suggest that farmers are responding to climate patterns in terms of
their adaptation strategies but the responses are heterogeneous depending on the practices and
the type of climatic variable considered and that climatic variability should be an integral part of
promotion activities.
Bio-physical plot characteristics are also found to be important determinants of most of the
practices. Total land holdings and number of plots owned are negatively correlated with the use of
organic fertilizer and modern inputs. As expected, the topography of the plots and the types of
14 We have not included long run mean rainfall and temperature due to collinearity problems.

18
soils in the plots also play a crucial role in explaining the input use decision. Soil characteristics
mainly influence the use of crop residues and organic fertilizers, but most of the coefficients are
not significant for modern inputs use. The use of crop residues is more pronounced on silty soil
and less on clay soil whereas organic fertilizers are less often used in clay and rocky soil compared
to sand soil. The propensity of using crop residue is also higher in plots located in valley (in an area
of cultivable land between the slopes of a hill) and less on plots located on a hill compared to plots
located on flat land. Use of modern inputs is also lower on gentle and steep slopes but higher in
valleys in reference to flat slope land types. We also find that farm households with less fertile
soils or high nutrient availability constraints are more likely to implement crop residue and organic
fertilizer. Overall, our results about the role of soil quality are in line with findings of Teklewold et
al. (2013a).
At the system level, results show the key roles played by rural institutions and transaction
costs, largely confirming the existing literature (for example Asfaw et al., 2014; Arslan et al., 2013
and Knowler and Bradshaw, 2007). The greater the distance to the nearest agricultural extension
officer (AEO), the higher the incentive to use practices requiring less initial capital and less skills
(i.e. crop residues and organic fertilizers); the opposite holds true for the use of modern inputs. In
this case the assistance provided by the AEO in terms of training and information dissemination is
crucial for the use of improved seeds and/or inorganic fertilizers. The distance between the
dwelling and the plot is also a common element negatively influencing the input choice i.e. the
longer the distance, the higher the transportation costs, the lower the incentive to adopt a
technology, which is consitent with other findings (e.g Teklewold et al. 2013a). Availability of road
infrastructure as proxied by length of road density in a 10 km radius is positively correlated with
use of organic fertlizer and modern inputs but negatively correlated with the use of crop residues.
Farm housholds residing at far distances from the nearest periodic or permanent market tend to
use more organic fertlizer but those who reside nearby markets tend to use more of modern
inputs.
Results for wealth indicies such as the wealth index, the agricultural implement index and
livestock ownership, are also in line with expectations and with the existing literature. Wealthier
households use practices that require more initial capital both in terms of general and specific
agricultural assets. As expected, livestock ownership is positively correlated with the use of
organic fertilizers. The level of household wealth measured by the wealth index and index of
agricultural inputs is negatively associated with the use of crop residues, confirming the idea that

19
this practice, requiring a minimal initial investment, is carried out mostly by less wealthy
households. On the other hand, the level of household wealth measured by the wealth index and
index of agricultural inputs is positively correlated with the use of organic fertlizer and modern
inputs. We find that farm households who own the land are more likely to use crop residue and
organic fertilizer while the effect is not significant for modern inputs. Our results are consistent
with a number of studies that have demonstrated that the security of land ownership has
substantial effect on the agricultural performance of farmers (e.g. Denning et al., 2009; Teklewold
et al., 2013a; Asfaw et al., 2014). To the extent that ownership is associated with greater tenure
security than with rental agreements, particularly in the longer term, better tenure security
increases the likelihood that farmers use strategies that will capture the returns from their
investments in the long run.
Household demographics to some extent also play a significant role in explaining the
household input use decision. The positive coefficient associated with education for the use of
organic and modern inputs confirm its key role already pointed out in much of the literature (e.g.
Teklewold et al., 2013a). Moreover, smaller-sized households (or with limited access to labour)
and a higher dependency ratio find the use of modern inputs as labour-saving techniques
particularly attractive. Crop residue is also more often used by females compared to male plot
users (see Table 8 for details).
5.2 Impact of technology adoption on crop productivity
Table 9 reports results for OLS, conditional recursive mixed process (CMP) estimators and
instrumental variables estimation using heteroskedasticity-based instruments (with additional
instruments constructed using Lewbel, 2012 method) for the impact of input use on crop
productivity (all estimates are reported accounting for cluster heteroskedasticity standard error at
the household level). The simplest approach to investigate the effect of input use consists of
estimating an OLS model of productivity estimate without controlling for any potential
endogeneity problems and with a dummy variable equal to 1 if the farmer decided to use the
practices on a given plot, 0 if otherwise (as in column (1 and 2) of Table 9). The OLS results would
lead us to conclude that there are significant observable differences in terms of agricultural
outputs between users and non-users. The value of crop harvest is significantly greater for users of
modern inputs and organic fertilizers compared to the non-users (coefficient for crop residues is
also positive but not significant). This approach, however, assumes that the uses of these

20
agricultural practices are exogenously determined in the production function while the
endogeneity test15 determines the three dummies to be endogenous. Therefore the estimation via
OLS would yield biased and inconsistent estimates. The impact estimates presented further on use
conditional recursive mixed process (CMP) techniques to account for this problem and
instrumental variables techniques boosted by the Lewbel (2012) method (ivreg2h) to correct for
weak instruments and heteroskedasticity problems.
Before turning to the causal effects of adoption on crop productivity, we briefly discuss the
quality of the selection instruments used. To probe the validity of our selection instruments, we
looked at two major tests: the weak identification test and over identification tests. The test
results support the choice of the instruments, as do the F-test values for all of the specifications
(bottom of Table 9). The F-statistic of joint significance of the excluded instruments is greater than
10, thus passing the test for weak instruments. The null hypothesis in the case of the over
identification test is that the selection instruments are not correlated with the yield error term
and we fail to reject the null in all the cases.
As we can see from Table 9, results for the impact on plot productivity are quite consistent
across different estimation strategies. As expected, results show that, on average, use of modern
inputs has a positive and statistically significant impact on crop productivity. The use of organic
fertilizers also significantly increases the value of the harvest per acre and this result is consistent
for both estimation strategies. However the use of crop residues does not seem to increase crop
productivity – the coefficient is not statistically significant in the case of OLS estimator, but Ivreg2h
and CMP estimators report negative and significant effect of crop residue use on crop
productivity. One possible explanation for the negative effect of crop residue is that the yield
benefit of use of sustainable land management practices such as crop residues often accrues
slowly over time compared to other agricultural practices, such as modern inputs, which tend to
have short term returns. The evidence is just one piece of the puzzle, and the finding would have
to be confirmed through other types of studies. We have also not estimated the impact on
reducing yield variability in the face of variable climate conditions, so the results should be
interpreted with the caveats in mind. Our data also didn’t fully capture when crop residue
incorporation was started and the frequency that it was used so perhaps this can also provide an
important lesson for design of future survey.
15 “The endogeneity test implemented […] is defined as the difference of two Sargan-Hansen statistics: one for the equation with the smaller set of instruments, where the suspect regressor(s) are treated as endogenous, and one for the equation with the larger set of instruments, where the suspect regressors are treated as exogenous” (Baum, et al., 2007)
21
<TABLE 9 ABOUT HERE>
As described in the earlier section, agriculture in Niger is largely rain-fed. Thus, crop
productivity in Nigerien households is strongly correlated with climate variables. This is perfectly
reflected in our results: the amount of rainfall during the growing season, as expected, positively
influences productivity of the plot. Furthermore, a late onset of the rainy season negatively and
significantly affects value of production, consistent with findings of Verdin et al. (1999).
Soil characteristics, as expected, also explain plot productivity. Results for the availability of
soil nutrients are also as expected, having a positive impact on productivity. Being an essential
factor of production, access to land (both in terms of tenure’s stability and in terms of number of
plots owned) is a key factor in explaining the differentials in productivity. Land tenure status also
explains variation in plot productivity. Secure land tenure implies better plot management in
Niger, which in turn positively influences agricultural productivity, confirming the results from Clay
et al. (1998). Results also show an inverse relation between land size and crop productivity which
is consistent with many other findings in the literature. The coefficient of land size is negative and
highly significant in all the specifications. One explanation of inverse farm size productivity is
related to errors in land measurements. However, contrary to earlier conjectures, Carletto et al.
(2013) find that the empirical validity of the inverse relationship hypothesis is strengthened, not
weakened, by the availability of better measures of land size collected using GPS devices in
Uganda. Given that we also used plot measurements collected using GPS devices, our findings are
consistent with Carletto et al. (2013).
Gender is a significant variable explaining productivity differences. Crop productivity from
plots managed by women tends to be significantly lower than their male-managed counterparts.
Our findings are consistent with many studies that show that productivity on plots managed by
women are lower than those managed by men, which is often attributed to differences in access
to productive resources (e.g., Quisumbing et al., 2001; Peterman et al., 2011). Moreover, crop
productivity tends to decrease with the age of the farmer, which is in line with the findings from
Tauer (1995) who provides evidence of the lower productivity of older farmers. Households with a
larger stock of farming-related assets (both tools and livestock, the latter measured in Tropical
Livestock Units) are significantly more productive (see Table 9 for detailed results).

22
6. Conclusions and policy recommendations
With this study we aimed not only to understand farmers' incentives and conditioning factors that
hinder or accelerate use of farming practices with adaptation benefits, but also to provide rigorous
evidence of its impact on crop productivity and crop net income. This study utilizes farm
household level data collected in 2011 from a nationally representative sample of 4074
households in Niger. We employ a multivariate probit (MVP) technique to model simultaneous
and interdependent farm practice selection decisions and utilize conditional recursive mixed
process (CMP) and instrumental variables estimators for the casual impact estimation.
Results clearly indicate that while the use of modern inputs and organic fertilizers
significantly improves crop outcomes, the yield impact of using crop residues is not statistically
significant, which might be a consequence of the fact that the yield benefits of some SLM practices
such as crop residues often accrue slowly over time compared to other agricultural practices, like
modern inputs, which in turn tend to have short term returns. It is however important to note that
we have not addressed in this paper the impact of the use of these practices on reducing yield (or
income) variability in the face of variable climate conditions. Increasing productivity is just one of
the reasons to use these technologies, but reducing downside loss can be another reason.
Therefore the results should be interpreted with this caveat in mind.
In order to understand why adoption rates of practices that are effective adaptation
strategies are low, we performed a multivariate probit analysis. What emerges clearly from the
analysis is that farmers’ decision to adopt practices that could provide them with adaptation
benefits varies with climatic stress and agro-ecological conditions, bio-physical sensitivity to such
disruptions, and the nature of the adaptive capacity required. Determinants of adaptive capacity
that limit farmers’ options occur at both the household and the community level. For instance we
find that use of crop residue is higher in areas of greater climate variability, as represented by the
coefficient of variation of rainfall and temperature as well as rainfall shocks measured by average
rainfall shortfall increases. These practices have low investments but higher labour requirements,
and involve longer periods to realize benefits. In contrast, modern input use is higher in areas of
lower climatic variability, and its adoption is affected by proximity to extension services and
markets. It’s however important to point out that many of the determinants of adoption of crop
residues and organic fertilizer have different signs e.g. climate variability. This defies the notion
that organic fertilizer and crop residue as similar technologies (risk reducing inputs) that contrary
with use of modern inputs.

23
Overall these analyses generate three important findings relevant for the emerging body of
literature: 1) climate change related effects are important determinants of the practices farmers
select, but these effects are quite heterogeneous across agro-ecologies and thus the distribution
of practices selected; 2) farm practice selection is an important means of adaptation that farmers
are already practicing as demonstrated by the effects across a range of practices, exposure and
sensitivity to climate change; and 3) both household and community level factors are important
determinants of adaptive capacity.
Some key lessons emerge from this study for policy makers and institutions. First of all,
measures to guarantee access to land and stable land tenure are particularly needed for the use of
long-term strategies to restore soil fertility. Given the strong role of extension in adaptive capacity
found in this study, the support provided by AEO should be strengthened and improved where
already in place and expanded to include a larger share of farmers. As some of the practices
analyzed require high up-front costs which often constitute a severe constraint, access to credit
should be guaranteed in order to make climate-smart farming practices affordable for even the
poorest of farmers. Most importantly, the results in this paper provide very strong arguments for
better targeting agricultural practices to respond to climate risk exposure and sensitivity, and then
building adaptive capacity to support different interventions. Overall this paper argues for much
greater awareness of heterogeneity in the exposure to climate risk and sensitivity and the
implications for which agricultural practices will lead to improved productivity, as well as the types
of interventions and who they should be targeted to in order to improve adaptive capacity.
References
Adger, W.N. (2006). Vulnerability. Global Environmental Change, 16 (3), 268–281.
Amare, M., Asfaw S. and Shiferaw, B. (2012). Welfare impacts of maize-pigeonpea intensification
in Tanzania. Agricultural Economics, 43 (1), 1–17.
Arslan, A., McCarthy, N., Lipper, L., Asfaw, S. and Cattaneo, A. (2013). Adoption and intensity of
adoption of conservation farming practices in Zambia. Agriculture, Ecosystems and
Environment, In Press, Available online 1 October 2013.
Asfaw, S., Kassie, M., Simtowe, F., and Lipper, L. (2012b). Poverty reduction effects of agricultural
technology adoption: A Micro-evidence from Rural Tanzania. Journal of Development Studies,
47(8), 1-18.

24
Asfaw, S., Lipper, L., Dalton, T., and Audi, P. (2012a). Market participation, on-farm crop diversity
and household welfare: micro-evidence from Kenya. Journal of Environment and
Development, 17(04), 1-23
Asfaw, S., McCarty, N., Lipper, L., Arslan, A., and Cattaneo , A. (2014). Climate Variability,
Adaptation Strategies and Food Security in Malawi. FAO working paper, forthcoming.
Baidun-Forson, J. (1994). Adoption of soil and water conservation practices in the SUdano-Sahelian zone:
constraint and incentives. In T. Napier , S. Camboni, & S. El Swaify, Adopting Conservation on the Farm:
An International Perspective on the Socioeconomics of Soil and Water Conservation (pp. 157-169).
Ankeny, IA.
Baidun-Forson, J. (1999). Factors influencing adoption of land-enhancing technology in the Sahel: lessons
from a case study in Niger. Agricultural Economics, 20, 231-239.
Baum, C., and Schaffer, M. (2012). Stata module to perform instrumental variables estimation using
heteroskedasticity-based instrumens.
Bayala, J., Kalinganire, A., Tchoundjeu, Z., Sinclaire, F., and Garrity, D. (2011). Conservation agriculture with
trees in the West African Sahel - a review. Nairobi.
Blanco, H. and Lal, R. (2008). Principles of soil conservation and management. New York: Springer.
Bradshaw, J., Kemp, P., Baldwin, S., and Rowe, A. (2004). The Drivers of Social Exclusion. London.
Branca, G., McCarthy, N., Lipper, L. and Jolejole, M. (2011). Climate-smart agriculture: A synthesis
of empirical evidence of food security and mitigation benefits of from improved cropland
management. Food and Agriculture Organization of the United Nations (FAO), Rome.
Brooks, N., Adger, W. N. and Kelly, M. (2005). The determinants of vulnerability and adaptive
capacity at the national level and the implications for adaptation. In Adger, W. N., Arnell, N.
and Tompkins, E. L. (Eds.) Global Environmental Change Part A 15(2), 151-162.
Carletto, C., Savastano, S. and Zezza, A. (2013). Fact or artefact: the impact of measurement errors
on the farm size - productivity relationship. Journal of Development Economics, 103, 254-261
Carter, M.R. and Barrett, C.B. (2006). The economics of poverty traps and persistent poverty: An
asset-based approach. Journal of Development Studies, 42, 178-199.
Chavas, J.P. and Holt, C. (1996). Economic behavior under uncertainty: A joint analysis of risk
preferences and technology. Review of Economics and Statistics, 78, 329-335.
Christensen, J. B.-T. (2007). Regional Climate Projections. In S. D. [Solomon, Climate Change 2007: The
Physical Science Basis. Cambridge: Cambridge University Press.
Clay, D., Reardon, T., and Kangasniemi, J. (1998). Sustainable intensification in the highland tropics:
Rwandan farmers'investments in land conservation and soil fertility. Economic Development and
Cultural Change, 45(2), 351-378.

25
Conte, C. (1999). Colonial science and ecological change: Tanzania's Mlalo Basin, 1888-1946. Environmental
History, 4, 220-245.
DANIDA. (2008). Appréciation des impacts des changements climatiques sur les programmes de
développement de la coopération avec le Niger. Bruxelles: Baastel.
de Janvery, A., Dustan, A., and Sadoulet, E. (2010). Recent advances in impact analysis methods for ex-post
impact assessments of agricultural technology: options for the CGIAR. Increasing the rigor of ex-post
impact assessment of agricultural research: a discussion on estimatin treatment effects. Berkeley:
SPIA.
Delgado, J. A., Groffman, P. M., Nearing, M. A., Goddard, T., Reicosky, D., Lal, R., Kitchen, N. R.,
Rice, C. W., Towery, D. and Salon, P. (2011). Conservation practices to mitigate and adapt to
climate change. Journal of Soil and Water Conservation, 66, 118–129.
Denning G, Kabambe P, Sanchez P, Malik A, Flor R, Harawa, R, Nkhoma, P, Zamba, C, Banda, C,
Magombo, C, Keating, M, Wangila, J and Sachs, J (2009). Input subsidies to improve
smallholder maize productivity in Malawi: Toward an African green revolution. PLoS Biology,
7(1), 2-10.
Deressa, T.T. and Hassan, R.H. (2010). Economic Impact of Climate Change on Crop Production in
Ethiopia: Evidence from Cross-Section Measures. Journal of African Economies, 18(4), 529-
554.
Deschenes, O., and Greenstone, M. (2007). The Economic Impacts of Climate Change: Evidence
from Agricultural Output and Random Fluctuations in Weather. American Economic Review,
97(1): 354-384.
Di Falco, Kohlin, G. and Yesuf, M. (2012). What Adaptation to Climate Change? Evidence
from the Nile Basin, Ethiopia. Climate Change Economics, 03 (02)
Di Falco, S. and Veronesi, M. (2014). Managing Environmental Risk in Presence of Climate Change:
The Role of Adaptation in the Nile Basin of Ethiopia, Environmental and Resource
Economics, 57:553-577.
Di Falco, S., Veronesi, M. and Yesuf, M. (2011). Does adaptation to climate change provide food
security? A micro perspective from Ethiopia. American Journal of Agricultural Economics,
93(3), 829–846.
Dorfman, J. (1996). Modelling multiple adoption decisions in a joimt framework. American Journal of
Agricultural Economics, 78, 547-557.
Eckhardt, N., Cominelli, E., Galbiati, M., and Tonelli, C. (2009). The future of science: food and water for life.
The Plant Cell, 21, 368-372.

26
Engle, L.N. (2011). Adaptive capacity and its assessment. Global Environmental Change, 21, 647–
65.
Ernestein, O. (2003). Smallholder conservation farming in the tropics and sub-tropics: a guide to the
development and issemination of mulching with crop residues and cover crops. Agriculure, Ecosystem
abd Environment, 100, 17-37.
Fafchamps, M. (1992). Solidarity Networks in Pre-Industrial Societies: Rational Peasants with a
Moral Economy. Economic Development and Cultural Change, 41(1), 147-174.
Fafchamps, M. (1999). Rural Poverty, Risk and Development. Economic and Social Development
Paper, no. 144. Rome: Food and Agriculture Organization.
Fatondji, D., Pasternak, D., Nikiema, A., Senbeto, D., Woltering, L., Ndjeunga, J., et al. (2011). Integrated
agricultural production system - The Dryland Eco-Farm, a potential solution to the main constraints of
Africa’s rain-fed agriculture. In A. Bationo, B. Waswa, J. Okeyo, F. Maina, & J. Kihara, Innovations as key
to the Green Revolution in Africa: Exploring the scientific facts. Springer.
Folke, C. (2006). Resilience: The emergence of a perspective for social–ecological systems analyses.
Global Environmental Change, 16, 253-267.
Food and Agricultural Organization (FAO) (2011). Save and grow: A policymaker’s guide to the
sustainable intensification of smallholder crop production. Food and Agriculture
Organization of the United Nations, Rome.
Food and Agricultural Organization (FAO) (2013). Climate smart agriculture sourcebook. Food and
Agriculture Organization of the United Nations, Rome.
Foster, A.D. and Rosenzweig, M.R. (2003). Agricultural productivity growth, rural economic
diversity, and economic reforms: India, 1970–2000. Photocopy.
Füssel, H.M (2010). Review and Quantitative Analysis of Indices of Climate Change Exposure,
Adaptive Capacity, Sensitivity, and Impacts. Washington, DC: World Bank
Füssel, H.M. (2007). Vulnerability: a generally applicable conceptual framework for climate change
research. Global Environmental Change, 17, 155–167.
Gallopín, G.C. (2006). Linkages between vulnerability, resilience, and adaptive capacity. Global
Environmental Change, 16 (3), 293–303.
Heltberg, R. and Tarp, F. (2002). Agricultural Supply Response and Poverty in Mozambique. Food
Policy, 27, 103-124.
Howden, S., Soussana, J., Tubiello, F., Chhetri, N., Dunlop, M., and Meinke, H. (2007). Adapting agriculture
to climate change. Proceedings of the National Academy of Sciences, 104, 19691-19696.
IFAD. (2009). Agricultural and Rural Rehabilitation and Development Initiative - GEF. Rome.

27
Institute National de la Statistique . (2013). 2011 National Survey on Household Living Conditions and
Agriculture (ECVM/A-2011): Basic Information Documet. Niamey: Institute National de la Statistique .
IPCC (2011). Managing the risks of extreme events and disasters to advance climate change
adaptation: Special report of Intergovernmental Panel on Climate change (IPCC).
IRIN. (2010, March 10). Niger: Southern villages emptying as drought bites. Retrieved October 8, 2013, from
IRIN news: http://www.irinnews.org/report/88385/niger-southern-villages-emptying-as-drought-bites
IRIN. (2013). Niger seeks to end cycle of hunger. Retrieved October 8, 2013, from IRIN news:
http://www.irinnews.org/report/97790/niger-seeks-to-end-cycle-of-hunger
Janssen, M. A., Schoon, M. L., Ke, W. and Börner, K. (2006). Scholarly networks on resilience,
vulnerability and adaptation within the human dimensions of global environmental change.
Global Environmental Change, 16(3), 240–252.
Johansson, L. (2001). Ten Million Trees Later, Land Use Change in the West Usambara Mountains. The Soil
Erosion and Agrogorestry Project in Leshoto District 1981-2000. Eschborn: Deutsche Gesellschaft fu¨r
Technische Zusammenarbeit (GTZ).
Just, R. and Candler, W. (1985). Production Functions and Rationality of Mixed Cropping.
European Review of Agricultural Economics, 12, 207-231.
Kandji, S. T., Verchot, L., & Meckensen, J. (2006). Climate Change and Variability in the Sahel Region:
Impacts and Adaptation Strategies in the Agricultural Sector.
Kassie, M. and Holden, S.T. (2008). Sharecropping Efficiency in Ethiopia: Threats of Eviction
and Kinship, Agricultural Economics, 37, 179–88.
Kassie, M., Jaleta, M., Shiferaw, B., Mmbando, F. and Mekuria, M. (2013). Adoption of
interrelated sustainable agricultural practices in smallholder systems: Evidence from rural
Tanzania. Technological Forecasting & Social Change, 80, 525–540
Kassie, M., Zikhali, P., Pender, J. and Kohlin, G. (2010). The economics of sustainable land
management practices in the Ethiopian highlands. Journal of Agricultural Economics, 61, 605–
627.
Kijima, Y., Otsuka, K. and Sserunkuuma, D. (2008). Assessing the impact of NERICA on income and
poverty in central and western Uganda. Agricultural Economics, 38(3), 327–337.
Kleibergen, F., and Paap, R. (2006). Generalized reduced rank tests using the singular value decomposition.
Journal of econometrics, 133, 97-126.
Knowler, D., and Bradshaw, B. (2007). Farmers' adoption of conservative agriculture: A review and
synthesis of recent research. Science Direct, 25-48.

28
Kurukulasuriya, P. and Mendelsohn, R. (2008). Crop Switching as an Adaptation Strategy to
Climate Change. African Journal Agriculture and Resource Economics, 2: 105-126.
Kurukulasuriya, P., and Rosenthal, S. (2003). Climate Change and Agriculture: A Review of Impacts and
Adaptation. Washington, D.C.: The World Bank Environment Department.
Lewbel, A. (2012). Uing Heteroskedasticity to Identify and Estimate Mismeasured and Endogenous
Regressor Models. Journam of Business and Economic Statistics, 30(1), 67-80.
McCarthy, N., Lipper, L. and Branca, G. (2011). Climate-smart agriculture: smallholder adoption
and implications for climate change adaptation and mitigation. FAO Working Paper,
Mitigation of Climate Change in Agriculture (MICCA) Series 4, Rome
Mendola, M. (2007). Agricultural technology adoption and poverty reduction: a propensity-score
matching analysis for rural Bangladesh. Food Policy, 32(3), 372–393.
Morton, J. (2007). The impact of climate change on smallholders and subsistence agriculture. Proceeding of
the National Academy of Science of the United States of America 104 (pp. 19680-19685). PNAS.
NECSD. (2006). National Adaptation Program of Action.
Orindi, V., Ochieng, A., Otiende, B., Bhadwal, S., Anantram, K., Nair, S., et al. (2006). Mapping climate
vulnerability in poverty in Africa. In P. Thornton, P. Jones, T. Owiyo, R. Kruska, M. Herrero, P.
Kristjanson, et al., Climate change and poverty in Africa. Report to the Department for Internation
Development. Nairobi: ILRI.
Panda, A., Sharma, U., Ninan, K.N. and Patt, A. (2013). Adaptive capacity contributing to improved
agricultural productivity at the household level: empirical findings highlighting the importance
of crop insurance. Global Environmental Change, 23, 782 – 790.
Pender, J. and Gebremedhin, B. (2007). Determinants of agricultural and land management
practices and impacts on crop production and household income in the highlands of Tigray,
Ethiopia. Journal of African Economies, 17, 395–450.
Peterman, A., Quisumbing, A., Behrman, J., and Nkonya, E. (2011). Understanding the complexities
surroundingsgender differences in agricultural productivity in Nigeria and Uganda. Journal of
Development Studies, 47(10), 1482-7509.
Phiri, I., and Saka, A. (2008). The impact of changing environemntal conditions on vulnerable communities
in the Shire Valley, Southern Malawi. In C. Lee, & T. Schaaf, The Future of Drylands (pp. 545-559). Paris:
Springer and UNESCO.
Pope, R.D. and Kramer, R.A. (1979). Production Uncertainty and Factor Demands for the
Competitive Firm. Southern Economic Journal, 46(2), 489-501.

29
Quisumbing, A., Payongayong, E., Aidoo, J. B., and Otsuka, K. (2001). Women's land rights in the transition
to individualized ownership: Implications for the managmnt of tree resources in western Ghana.
Economic Development and Cultural Change, 50 (1), 157-182.
Reidsma, P., and Ewert, F. (2008). Regional farm diversity can reduce vulnerability of food production to
climate change. Ecology and Society, 13(1), 38.
Republique Du Niger. (2012, October 13). Initiative 3N 2012-2013. Niamey. Retrieved from
http://initiative3n.org/files/initiative_3n_programme_2012_-2013_vf.pdf
Roodman, D. (2011). Fitting fully observed recursive mixed-process models with cmp. Stata
Journal, 11, 159-206.
Rosenzweig, M., and Wolpin, K. (2000). Natural "natural experiments" in economics. Journal of Economic
Literature, 38 (4), 827-874.
Seo, S. N., and Mendelsohn, R. (2008). Measuring Impacts and Adaptations to Climate Change:A
Structural Ricardian Model of African Livestock Management. Agricultural Economics, 38(2): 151-
165.
Smit, B. and Wandel, J. (2006). Adaptation, adaptive capacity and vulnerability. Global
Environmental Change, 16 (3), 282–292.
Smith, B. (2011). Niger Climate Change Overview. Retrieved October 08, 2013, from weADAPT:
http://weadapt.org/knowledge-base/national-adaptation-planning/Niger
Stige, L., Stave, J., and Chan, K. (2006). The effect of climate variatio on agro-pastoral production in Africa.
Proceedings of the National Academy of Sciences, 103, 3049-3053.
Stock, J. H., and Yogo, M. (2002). Testing for weak instrumens in linear IV regression. Cambridge, MA.
Sylwester, K. (2004). Simple model of resource degradation and agricultural productivity in a
subsistence economy. Review of Development Economics, 8, 128-40.
Tauer, L. (1995). Age and Farmer Productivity. Review of Agricultural Economics, 17(1), 63-69.
Teklewold, H., Kassie, M. and Shiferaw, B. (2013a). Adoption of multiple sustainable agricultural
practices in rural Ethiopia. Journal of Agricultural Economics, 64(3), 597-623.
Teklewold, H., Kassie, M., Shiferaw, B., and Kohlin, G. (2013b). Cropping system diversification,
conservation tillage nad modern seed adoption in Ethiopia: Impacts on household income,
agrochemical use and demand for labor. Ecological Economics, 93, 85-93.
UNDP. (2013). Human Development Report 2013 - The Rise of the South: Human Progress in a Divers
World. New York: UNDP.
Verdin, J., Rowland, J., Klaver, R., Reed, B., French, V., and Lee, F. (1999). A comparison of methods for
estimating start-of-season from operational remote sensing products: first results. Proceedings of the
Pecora Symposium. Denver CO.: American Society for Photogrammetry and Remote Sensing.
Wilby, R. (2008). A review of recent trends and projected climate change for Niger, West Africa.

30
Wollni, M., Lee, D. R. and Janice, L. T. (2010). Conservation agriculture, organic marketing, and
collective action in the Honduran hillsides. Agricultural Economics, 41, 373–384.
World Bank. (2013). Data-Niger. Retrieved September 11, 2013, from
http://data.worldbank.org/country/niger

31
Table 1: Description of the sample households by land use type
Table 2: Perception of climate changes reported for the last 5 years by land use types – in proportion
Land use types Agricultural
(N=906) Agro-pastoral
(N=892) Pastoral (N=632)
Total (N=2430)
Less rainfalls 0.78 0.77 0.89 0.81
[0.01] [0.01] [0.01] [0.01]
More rainfalls 0.15 0.15 0.07 0.13
[0.01] [0.01] [0.01] [0.01]
Worst distribution rainfalls 0.79 0.74 0.78 0.77
[0.01] [0.01] [0.02] [0.01]
Shorter heat period 0.16 0.14 0.1 0.14
[0.01] [0.01] [0.01] [0.01]
Longer heat period 0.63 0.65 0.68 0.65
[0.02] [0.02] [0.02] [0.01]
More frequent drought 0.77 0.83 0.95 0.84
[0.01] [0.01] [0.01] [0.01]
More frequent floods 0.38 0.19 0.19 0.26
[0.02] [0.01] [0.02] [0.01]
Delay in the start of the rainy season 0.71 0.66 0.82 0.72
[0.02] [0.02] [0.02] [0.01]
Rainy season comes earlier 0.74 0.84 0.92 0.82
[0.01] [0.01] [0.01] [0.01]
Note: The numbers in brackets are standard errors. The household sample here is larger, given that we use the entire sample available for this section and not the sample composed by households involved in farming activities only and interviewed in both waves.
Land use types
Agricultural Agro-pastoral Pastoral Total
Number of plots 2487 2393 460 5340
Number of households 845 836 257 1938

32
Table 3: Strategies to adapt to and mitigate climate change effects by land use types – in proportion
Change in temperature Change in rainfall patterns
Agricultural (N=906)
Agro-pastoral (N=892)
Pastoral (N=632)
Total (N=2430)
Agricultural (N=906)
Agro-pastoral (N=892)
Pastoral (N=632)
Total (N=2430)
Change seed varieties 0.24 0.26 0.24 0.25 0.32 0.36 0.19 0.3
[0.02] [0.02] [0.03] [0.01] [0.02] [0.02] [0.02] [0.01]
Use methods to protect against erosion
0.24 0.28 0.18 0.24 0.27 0.31 0.17 0.26
[0.02] [0.02] [0.02] [0.01] [0.02] [0.02] [0.02] [0.01]
Engage in dry season agriculture 0.21 0.16 0.39 0.24 0.21 0.16 0.31 0.22
[0.02] [0.02] [0.03] [0.01] [0.02] [0.02] [0.03] [0.01]
Plant trees 0.16 0.14 0.18 0.16 0.15 0.12 0.15 0.14
[0.02] [0.02] [0.02] [0.01] [0.02] [0.01] [0.02] [0.01]
Irrigate more intensively 0.08 0.12 0.17 0.11 0.09 0.09 0.14 0.1
[0.01] [0.02] [0.02] [0.01] [0.01] [0.01] [0.02] [0.01]
Raise less livestock and increase crop production
0.21 0.26 0.26 0.24 0.25 0.26 0.21 0.24
[0.02] [0.02] [0.03] [0.01] [0.02] [0.02] [0.02] [0.01]
Raise fewer small ruminants and switch to cattle
0.17 0.17 0.11 0.15 0.17 0.14 0.08 0.14
[0.02] [0.02] [0.02] [0.01] [0.02] [0.02] [0.01] [0.01]
Raise fewer cattle and switch to camels
0.07 0.09 0.1 0.08 0.07 0.06 0.12 0.08
[0.01] [0.01] [0.02] [0.01] [0.01] [0.01] [0.02] [0.01]
Adopt techniques to regenerate grass cover favoured by livestock
0.13 0.14 0.14 0.14 0.15 0.13 0.12 0.13
[0.02] [0.02] [0.02] [0.01] [0.02] [0.02] [0.02] [0.01]
Raise fewer sheep and switch to goats
0.16 0.18 0.32 0.21 0.19 0.18 0.34 0.22
[0.02] [0.02] [0.03] [0.01] [0.02] [0.02] [0.03] [0.01]
Migration 0.39 0.27 0.25 0.31 0.37 0.24 0.22 0.28
[0.02] [0.02] [0.03] [0.01] [0.02] [0.02] [0.02] [0.01]
Diversify sources of revenue 0.47 0.48 0.49 0.48 0.44 0.47 0.54 0.48
[0.02] [0.02] [0.03] [0.01] [0.02] [0.02] [0.03] [0.01]
Note: The numbers in brackets are standard errors.

33
Table 4: Descriptive summary of agricultural technology adoption – in proportion
Land use types Agricultural
(N=2487) Agro-pastoral
(N=2393) Pastoral (N=460)
Total (N=5340)
Organic fertilizers 0.37 0.25 0.12 0.33
[0.48] [0.44] [0.33] [0.47]
Modern inputs: 0.13 0.11 0.06 0.12 [0.34] [0.31] [0.24] [0.33]
Inorganic fertilizers 0.12 0.09 0.03 0.11
[0.32] [0.29] [0.16] [0.31]
Improved seeds 0.02 0.02 0.03 0.02
[0.13] [0.13] [0.18] [0.14]
Conservation practices: 0.46 0.50 0.31 0.47
[0.50] [0.50] [0.46] [0.50]
Crop residues 0.39 0.45 0.27 0.40
[0.49] [0.50] [0.44] [0.49]
Legume intercropping 0.06 0.05 0.03 0.06
[0.24] [0.21] [0.17] [0.23]
Anti-erosion measures: 0.03 0.03 0.04 0.03 [0.18] [0.16] [0.19] [0.17]
Sand bag 0.01 0.00 0.02 0.00 [0.07] [0.03] [0.13] [0.07] Half moon 0.00 0.00 0.00 0.00 [0.06] [0.05] [0.07] [0.05] Zai 0.00 0.00 0.00 0.00 [0.03] [0.06] [0.00] [0.04] Tree belts 0.02 0.02 0.02 0.02 [0.13] [0.12] [0.15] [0.13] Wall 0.00 0.00 0.00 0.00 [0.02] [0.03] [0.00] [0.02] Stone perimeter 0.01 0.01 0.00 0.01
[0.09] [0.08] [0.05] [0.08] Note: The numbers in brackets are standard errors.

34
Table 5: Percentage of adoption of technology in combinations by land use types Land use types
Agricultural (N=2487)
Agro-pastoral (N=2393)
Pastoral (N=460)
Total (N=5340)
Residue, Organic & modern inputs (ROF) 0.04 0.03 0.02 0.03
[0.19] [0.16] [0.12] [0.18]
Residue and organic(RO) 0.13 0.10 0.04 0.12
[0.33] [0.30] [0.19] [0.32]
Residue and modern inputs(RF) 0.03 0.03 0.01 0.03
[0.16] [0.17] [0.11] [0.16]
Organic and modern inputs (OF) 0.03 0.02 0.01 0.03
[0.18] [0.14] [0.12] [0.17]
Residues (R) 0.36 0.41 0.27 0.38
[0.48] [0.49] [0.44] [0.48]
Modern inputs(F) 0.13 0.13 0.10 0.13
[0.34] [0.34] [0.43] [0.34]
Organic (O) 0.37 0.24 0.16 0.31
[0.44] [0.31] [0.37] [0.48]
NONE 0.14 0.22 0.47 0.18
[0.48] [0.49] [0.48] [0.49] Note: The numbers in brackets are standard errors. Table 6: Productivity differentials under varying agricultural technology and land use types
Land use types
Total Agricultural Agro-pastoral Pastoral
Non-users Users Non-users Users Non-users Users Non-users Users
Use of organic fertilizers
Plot area (acres) 4.30 4.68** 3.34 3.89*** 4.66 5.75*** 6.56 6.19 [0.08] [0.13] [0.09] [0.13] [0.13] [0.26] [0.36] [0.87]
Value of harvest- (‘000 CFAF/acre)
24.46 27.91 24.19 28.19 17.16 21.68 59.9 70.7 [1.71] [2.87] [2.38] [2.59] [1.69] [6.28] [10.9] [16.01]
N 3786 1554 1578 909 1821 572 387 73
Use of modern inputs Plot area (acres) 4.4 4.52 3.49* 3.89* 4.87 5.26 6.80 3.97***
[0.07] [0.19] [0.08] [0.23] [0.12] [0.30] [0.35] [0.97] Value of harvest- (‘000 CFAF/acre)
22.70 43.60*** 22.92 43.50*** 16.11 32.02*** 54.64 12.15** [1.28] [7.35] [1.38] [9.91] [1.45] [1.14] [10.01] [2.99]
N 4642 698 2157 330 2073 320 412 48
Use of crop residues Plot area (acres) 4.5 4.32 3.54 3.54 5.11 4.72* 6.27 6.99
[0.09] [0.11] [0.09] [0.13] [0.16] [0.16] [0.39] [0.60] Value of harvest- (‘000 CFAF/acre)
29.21 19.18*** 29.05 19.72** 20.49 15.03 66.54 48.29 [2.19] [1.47] [2.52] [2.15] [3.16] [1.64] [12.24] [12.22]
N 3326 2014 1363 1124 1221 1172 313 147
Note: *** p<0.01, ** p<0.05, * p<0.1. The numbers in brackets are standard errors. 1 US$ = 470 CFAF

35
Table 7: Descriptive summary of selected variables by land use types
Variables Agricultural Agro-pastoral Pastoral Overall
Mean Std. Err. Mean Std.
Err. Mean Std. Err. Mean Std.
Err. Exposure to climatic stress
Coefficient of variation of rainfall (1983-2011) 0.25 0.06 0.29 0.05 0.39 0.13 0.28 0.07 Average rainfall shortfall (1983 - 2011) 2.46 3.74 1.73 4.43 4.27 3.23 2.65 4.42 Long-term mean rainfall (1983-2011) 407.84 67.36 350.66 34.08 269.63 89.48 373.42 70.54 # dekades growing season max temp was over 35 oC (1989-2011) 38.83 23.26 64.09 19.40 143.94 50.09 57.96 37.29
Coefficient of variation of maximum temperature (1989-2011)
0.02 0.00 0.02 0.00 0.02 0.00 0.02 0.00
Long-term mean max temp (1983-2011) 33.62 0.80 34.38 0.52 36.27 1.18 34.16 1.03
Bio-physical sensitivity Types of soil in the plot Silty soil 0.05 0.23 0.04 0.20 0.04 0.19 0.05 0.21 Clay soil 0.10 0.30 0.09 0.28 0.33 0.47 0.12 0.33 Rocky soil 0.07 0.26 0.13 0.34 0.05 0.23 0.09 0.29 Topography of plots Plot is located on hill 0.06 0.25 0.05 0.22 0.03 0.18 0.06 0.23 Plot is located on gentle slope 0.08 0.28 0.16 0.37 0.19 0.39 0.12 0.33 Plot is located on steep slope 0.04 0.20 0.06 0.23 0.09 0.29 0.05 0.22 Plot is located in a valley 0.08 0.27 0.13 0.33 0.28 0.45 0.12 0.32 Nutrient availability constraint- (1-4 scale, 5 = mainly non-soil) 2.25 0.68 2.41 0.65 1.86 0.65 2.31 0.68
Log (total land area per hh) (ha) 2.40 0.73 2.63 0.76 2.39 0.99 2.44 0.82 Number of plot owned by the hh 3.96 2.15 3.93 2.04 2.53 1.65 3.72 2.11 Plot cultivated during dry season (1=yes) 0.14 0.35 0.07 0.25 0.14 0.35 0.12 0.32 Household level variables Female farm (1=yes) 0.12 0.33 0.18 0.38 0.07 0.26 0.14 0.35 Log (age of the user) 3.77 0.32 3.77 0.33 3.81 0.31 3.78 0.32 Log (household size) 2.01 0.43 2.01 0.47 2.03 0.41 2.01 0.45 Sex ratio 1.26 0.96 1.18 0.90 1.51 1.18 1.24 0.95 Dependency ratio 1.46 0.94 1.47 0.96 1.50 1.07 1.45 0.96 Log (highest education in the hh) 0.89 1.16 0.91 1.17 0.77 1.10 0.96 1.18 The hh owns the plot 0.81 0.39 0.85 0.35 0.83 0.37 0.81 0.39 Wealth Index -0.11 0.12 -0.12 0.11 -0.09 0.16 -0.10 0.16 Index on Agricultural implements 0.82 1.20 0.99 1.31 0.12 0.82 0.80 1.25 Livestock size - in TLU 0.71 0.59 0.79 0.65 0.77 0.73 0.73 0.63 System-level variables At least one cooperative exist in the community (1=yes) 0.17 0.37 0.13 0.34 0.12 0.33 0.16 0.37
Distance from the nearest market 2.31 1.80 2.82 1.89 2.45 1.53 2.38 1.85 Distance from the Agric. Extension Office (km) 2.05 1.58 1.83 1.67 2.90 1.78 1.93 1.66
Distance to dowelling (km) 1.27 0.67 1.15 0.70 1.31 0.80 1.28 0.75 Log (road density: length in m in a 10 km radius) 9.92 2.01 9.78 2.54 8.27 4.32 9.83 2.47

36
Table 8: Multivariate probit estimates – determinants of agricultural technology adoption: climate risk exposure, sensitivity and adaptive capacity
Crop residues Organic fertilizer Modern inputs coef Se coef se coef se
Exposure to climatic stress
Average rainfall shortfall (1983 - 2011) -0.003 0.002 -0.004** 0.002 -0.004* 0.002
Log (coefficient of variation of rainfall for rainy season (1983-2011))
0.478*** 0.136 -0.164 0.137 -0.307** 0.155
Log (coefficient of variation of temperature (1989-2010)) 1.809*** 0.255 -2.913*** 0.257 -3.337*** 0.335
# years growing season average maximum temperature was over long term max temp
0.165*** 0.026 -0.046* 0.025 0.009 0.032
Bio-physical sensitivity
Silty soil (reference: sand) 0.227*** 0.087 -0.081 0.087 0.058 0.098
Clay soil -0.108* 0.064 -0.418*** 0.066 -0.041 0.074
Rocky soil 0.036 0.064 -0.115* 0.064 0.040 0.075
Topography – hill (reference: flat) -0.236*** 0.083 0.061 0.080 -0.071 0.100
Topography – gentle slope 0.001 0.058 -0.068 0.060 -0.145* 0.077
Topography – steep slope 0.098 0.086 -0.187** 0.092 -0.254** 0.122
Topography – valley 0.172*** 0.062 0.083 0.062 0.150** 0.072
Nutrient availability constraint- (1-4 scale, 5 = mainly non-soil)
0.140*** 0.036 0.105*** 0.036 0.051 0.043
Log (total land area) -0.008 0.029 -0.067** 0.029 -0.015 0.034
Number of plot owned 0.000 0.012 -0.082*** 0.012 -0.027* 0.014
Plot cultivated during dry season -0.092 0.064 0.143** 0.060 0.377*** 0.067
System-level variables
At least one cooperative exist in the community -0.236*** 0.055 0.156*** 0.053 -0.044 0.065
Distance from the nearest market 0.005 0.012 0.053*** 0.012 -0.032** 0.015
Distance from the Agric. Extension Office 0.015 0.013 0.027** 0.013 -0.062*** 0.015
Distance to dowelling -0.053** 0.026 -0.314*** 0.026 -0.068** 0.030
Log (road density: length in m in a 10 km radius) -0.027*** 0.010 0.055*** 0.011 0.019* 0.011
Household level variables
Wealth Index -0.188 0.144 0.556*** 0.136 1.112*** 0.149
Index on Agricultural implements -0.038* 0.020 0.097*** 0.019 0.057** 0.022
Livestock size - in TLU -0.052 0.035 0.068* 0.035 -0.047 0.043
Female farm 0.093* 0.053 -0.088 0.055 -0.056 0.067
Log (age of the user) 0.096 0.061 0.070 0.061 0.018 0.074
Log (household size) 0.021 0.057 0.036 0.057 -0.125* 0.068
Sex ratio 0.048** 0.019 -0.012 0.020 -0.038 0.024
Dependency ratio -0.003 0.023 0.001 0.023 0.085*** 0.027
Log (highest education in the hh) -0.007 0.017 0.050*** 0.017 0.051*** 0.020
Household owns the plot 0.299*** 0.049 0.279*** 0.050 -0.019 0.055
Region fixed effect (reference: Niamey)
Agadez -0.135 0.313 2.116*** 0.317 2.038*** 0.372
Diffa 1.807*** 0.233 1.405*** 0.226 1.173*** 0.280
Dosso -0.200 0.175 -0.162 0.161 -0.161 0.172
Maradi 1.211*** 0.182 1.083*** 0.170 0.673*** 0.189
37
Tahoua -0.224 0.178 0.775*** 0.161 -0.069 0.177
Tilliberi -0.049 0.172 -0.522*** 0.160 -0.725*** 0.171
Zinder 1.483*** 0.199 1.522*** 0.188 1.286*** 0.218
Constant -9.994*** 1.153 -12.975*** 1.168 -14.214*** 1.498
/atrho21 0.094*** 0.024
/atrho31 0.099*** 0.029
/atrho32 0.239*** 0.029
Likelihood ratio test of rho21 = rho31 = rho32 = 0: chi2(3) = 95.4929 Prob > chi2 = 0.0000
Number of observation 5340
Log-Likelihood -8613.0604
Wald chi2(114) 2025.66
Note: *** p<0.01, ** p<0.05, * p<0.1 Table 9: Effect on productivity - Log value of harvest- (‘000 CFAF/acre)
OLS CMP IVREG2H
Coef. se Coef. Se Coef. se
Modern inputs 0.381*** 0.133 0.143*** 0.066 0.103*** 0.027
Organic fertilizer 0.718*** 0.101 0.458*** 0.160 0.446*** 0.108
Crop residues 0.119 0.108 -0.456** 0.242 -0.314* 0.185 Rainfall during the growing season (mm) 0.635*** 0.393 0.837** 0.387 1.579*** 0.397
Household reports delayed onset of the rainy season in 2011 -0.474*** 0.109 -0.421*** 0.102 -0.506*** 0.111
Female farm -0.730*** 0.160 -0.462** 0.226 -0.672*** 0.163
Log (age) -0.388** 0.180 -0.296 0.239 -0.421** 0.182
Log (household size) -0.239 0.179 -0.211 0.230 -0.212 0.180
Sex ratio -0.012 0.052 0.083 0.075 0.002 0.053
Dependency ratio -0.017 0.064 -0.044 0.089 -0.033 0.065
Log (highest education in the hh) 0.027 0.048 -0.039 0.065 0.003 0.049
Silty soil (reference: sand soil) 0.060 0.224 0.499* 0.301 0.079 0.228
Clay soil -0.288 0.187 -0.195 0.219 -0.205 0.188
Rocky soil -0.646*** 0.176 -0.530** 0.225 -0.604*** 0.180
Topography – hill (reference: flat) 0.526** 0.223 0.067 0.291 0.504** 0.227
Topography – gentle slope -0.213 0.150 -0.045 0.202 -0.151 0.155
Topography – steep slope -0.424* 0.244 -0.025 0.310 -0.349 0.245
Topography – valley -0.019 0.159 0.257 0.215 -0.035 0.159 Nutrient availability constraint- (1-4 scale, 5 = mainly non-soil) -0.238** 0.103 -0.454*** 0.139 -0.232** 0.105
The hh owns the plot 0.687*** 0.157 1.043*** 0.191 0.654*** 0.162
Log (total land area per hh) -0.810*** 0.088 -0.733*** 0.115 -0.773*** 0.090
Number of plot owned by the hh -0.060 0.048 -0.019 0.056 -0.044 0.047
Plot cultivated during the dry season 0.143 0.179 -0.107 0.234 0.042 0.185 At least one cooperative exist in the community 0.318** 0.147 -0.152 0.194 0.294* 0.150
Distance from the nearest permanent 0.096*** 0.034 0.056 0.049 0.086** 0.034

38
or periodic market
Distance from the nearest Agric Extension Office -0.007 0.037 0.017 0.048 -0.004 0.037
Distance to dwelling -0.203*** 0.075 -0.131 0.098 -0.128 0.082 Log (road density- length in m in a 10 km radius) 0.052* 0.028 0.098*** 0.037 0.064** 0.029
Wealth Index 0.320 0.435 -0.563 0.587 -0.088 0.455
Index on Agricultural implements 0.173** 0.078 0.048 0.092 0.140* 0.078
Livestock size - in TLU 0.298*** 0.101 0.228* 0.136 0.288*** 0.102
Regional fixed effect YES YES YES Constant 0.642 2.536 4.327* 2.590 0.657 2.555
N 5340 5340 5340
R2 0.153 0.137
Log-Likelihood -15,041.40 -23,537.85 -15,094.78
Hansen J statistic ᵻ 1.091 1.195
Underidentification test ᵻ 22.440** 294.574***
Weak identification test ᵻ 10.495** 13.770***
Note: *** p<0.01, ** p<0.05, * p<0.1 ᵻ Test for instruments validity for the CMP have been obtained by ivreg2
Fig. 1: Average rainfalls and temperature in rainy season by land use type.
Figure 2. Coefficient of variation of rainfall and max temperature (1983-2011)
05
1015
kden
sity
.2 .4 .6 .8 1COV of rainfall
Overall AgriculturalAgro-pastoral Pastoral
Coefficient of variation of rainfall (1983-2011)
050
100
150
kden
sity
.005 .01 .015 .02 .025 .03COV of temperature
Overall AgriculturalAgro-pastoral Pastoral
Coefficient of variation of temperature (1983-2011)

39

40
Figure 3. Total amount of rainfall during the rainy season (current and long run)
Figure 4. Average temperature during rainy season (current and long run)
0.0
05.0
1.0
15kd
ensi
ty
100 200 300 400 500 600Total Rainfall
Overall AgriculturalAgro-pastoral Pastoral
Total rainfall (2011)
0.0
05.0
1.0
15.0
2kd
ensi
ty
0 100 200 300 400 500Total rainfall
Overall AgriculturalAgro-pastoral Pastoral
Total rainfall (1983-2011)
0.5
11.
5kd
ensi
ty
26 28 30 32 34Temprature
Overall AgriculturalAgro-pastoral Pastoral
Average temprature (2011)
0.2
.4.6
.8kd
ensi
ty
26 28 30 32 34Temprature
Overall AgriculturalAgro-pastoral Pastoral
Average temprature (1983-2011)