Embed Size (px)
Citation preview

Acute effects of non-homogenised and homogenised vegetables addedto rice-based meals on postprandial glycaemic responses and in vitrocarbohydrate digestion
Ruixin Zhu1, Manman Liu2, Yue Han3, Linlin Wang1, Ting Ye1, Jiacan Lu3 and Zhihong Fan1*1Beijing Advanced Innovation Centre for Food Nutrition and Human Health, College of Food Science and NutritionalEngineering, China Agricultural University, Beijing 100083, People’s Republic of China2Department of Food Science and Engineering, College of Biological Science and Technology, Beijing Forestry University,Beijing 100083, People’s Republic of China3College of Biological Sciences, China Agricultural University, Beijing 100094, People’s Republic of China
(Submitted 18 February 2018 – Final revision received 2 August 2018 – Accepted 6 August 2018)
AbstractThe addition of vegetable to carbohydrate-based meals was shown to contribute to glycaemic management. The aim of this study was toinvestigate the impact of homogenisation on vegetables added to rice meals in terms of acute glycaemic responses (GR). In a randomisedcrossover trial, sixteen healthy volunteers completed thirteen test sessions, which included two sessions for glucose control, two for rice andnine for different vegetable-rice mixed meals: cooked pak choi and cooked rice (CP + R); cooked cauliflower and cooked rice (CC+ R);cooked eggplant and cooked rice (CE +R); and their homogenised counterparts, both raw or cooked. Postprandial GR tests, in vitrocarbohydrate digestion and chemical analyses were carried out for each test meal. Compared with pure rice, CE +R, CP +R and CC+R mealsachieved significantly lower glycaemic indexes (GI) of 67, 71 and 73, whereas their homogenised counterparts failed to show significantdifference with rice. The hydrolysis indexes (HI) of CE + R, CP + R and CC+R were 69·6, 83·8 and 80·6% of the HI of the rice control. CE hadthe greatest effect on lowering the GI, the incremental area under the blood glucose curve from 0 to 120min, the peak glucose value, themaximum amplitude of glucose excursion in 0–120 min (MAGE0–120), the HI and rapid available starch. Both in vitro and in vivo testsdemonstrated that incorporating non-homogenised cooked vegetables into a rice meal could slow the carbohydrate digestion and improvepostprandial GR. Texture properties of vegetable may play an important role in underlying glycaemic control mechanisms.
Key words: Glycaemic responses: Homogenised vegetables: Cooked vegetables: In vitro carbohydrate digestion
Rice is the most commonly consumed staple food and themajor dietary source of carbohydrates in many Asian coun-tries. However, refined white rice has been classified as a highglycaemic index (GI) food in previous studies(1,2), and dailyconsumption of a high-GI rice-based diet may inducehyperglycaemia after meals, even in healthy people(3). Asustained elevated postprandial blood glucose level isstrongly associated with an elevated risk of type 2 diabetesmellitus (T2DM)(4). It is estimated that the number of diabetespatients will reach 123·0 and 201·8 million in 2035 in SouthEast Asia and the West Pacific region, respectively(5). Dietaryinterventions that can attenuate postprandial glycaemicresponses (GR) have been proven beneficial for T2DM pre-vention(6), and these interventions are encouraged by pro-fessional bodies(7).
As a staple food, rice is usually co-consumed with otherdishes, such as vegetables, meat, fish and soya foods in EastAsia and South Asia. The addition of vegetables deserves to behighlighted as vegetables are high nutrient density food, rich indietary fibre and phytochemicals such as polyphenols andcarotenoids. Accumulating epidemiological evidence andintervention trials support that sufficient vegetable intake,especially the intake of green leafy vegetables(8–10) and cruci-ferous vegetables(11), are associated with reduced risk of T2DM.
A number of research reports have shown that, comparedwith the GR of pure rice, the GR of rice-based mixed mealscould be reduced by the incorporation of a variety of vege-tables, although the amount of total available carbohydrate ofthe vegetable–rice mixed meal was higher than that of thepure rice meal(12–14). Eating vegetable dishes before taking
Abbreviations: CC, cooked cauliflower; CE, cooked eggplant; CP, cooked pak choi; GI, glycaemic index; GR, glycaemic response; iAUC, incremental AUC; RS,resistant starch.
* Corresponding author: Z. Fan, fax +86 10 62737717, email [email protected]
British Journal of Nutrition (2018), 120, 1023–1033 doi:10.1017/S0007114518002489© The Authors 2018
Dow
nloaded from https://w
ww
.cambridge.org/core . IP address: 65.21.228.167 , on 05 Feb 2022 at 09:07:11 , subject to the Cam
bridge Core terms of use, available at https://w
ww
.cambridge.org/core/term
s . https://doi.org/10.1017/S0007114518002489

carbohydrate-based food improved postprandial glucoseexcursions in day-long glycaemic tests and lowered the HbA1cafter year-long intervention in diabetes patients(15). Leafyvegetable juices were also reported as a possible contributor tosupressing postprandial GR in preload studies in both healthyadults(16) and rats(17) when consumed before ingestion of high-GI foods.The possible mechanisms of mitigating GR by adding vege-
table to a high-GI carbohydrate diet can be explained as fol-lows: (1) dietary fibre can delay gastric emptying(18,19);(2) soluble fibre may lower the postprandial GR(20) and (3)phytochemicals, including polyphenols, may inhibit intestinalα-glucosidase activity and thus could slow the digestion rate offood carbohydrates(21). However, the gastric emptying processmay be affected by food texture factors, and the type of dietaryfibre might make a difference in the GR-suppressing effect, asinsoluble fibre has been shown to be ineffective in loweringfood GI or GR(22).In the previous studies, the vegetable samples were prepared
as salad(15), boiled(23), microwaved(21) or juiced(16,21). However,it has not yet been reported whether the physical structures ofvegetable samples or their cooking status could significantlycontribute to their glycaemic suppression capacity.Therefore, we assumed that texture/physical properties of
vegetables would have a crucial effect on postprandial GR. Toexamine this hypothesis, three kinds of commonly consumedvegetables including Pak choi, cauliflower and eggplant werechosen as samples. The vegetables were (1) cooked,(2) cooked and homogenised or (3) homogenised raw, beforebeing incorporated into vegetable–rice mixed test meals. Theacute GR of the test meals, as well as the in vitro carbohydratedigestion indicators of the above-mentioned vegetable–ricemixed meals, was measured.
Methods
Pre-treatment of test foods
Pak choi (Brassica rapa var. chinensis), cauliflower (Brassicaoleracea L.) and eggplant (Solanum melongena L.) werebrought from the local market. Pak choi leaves were peeledfrom the roots and were washed in tap water for 4min. Floretbouquets were cut from the cauliflower heads and werewashed in tap water for 4min. Eggplant was washed in tapwater for 2min and cut into 4-mm slices.
Preparation of test meals
After the pre-treatment, a preliminary sensory test was conductedto evaluate the acceptability of multiple vegetable samplescooked with minimal amount of oil (2·5/300 g fresh vegetable).The steamed eggplant, boiled cauliflower and boiled pak choiwere chosen for their satisfactory acceptability. Subjects wereoffered nine different white-rice-based meals, as shown in Fig. 1.Glucose (50 g of Glucolin® (The British Dispensary (L.P.) Co. Ltd)dissolved in 250ml of water) and rice containing 50 g of availablecarbohydrates were prepared as dual reference foods. The testedrice meals were as follows: (1) cooked rice (R) (2) cooked rice
with cooked vegetables, including cooked pak choi (CP), cookedcauliflower (CC) and cooked eggplant (CE); (3) cooked rice withhomogenised raw vegetables, including homogenised raw pakchoi (HRP), homogenised raw cauliflower (HRC) and homo-genised raw eggplant (HRE); and (4) cooked rice with homo-genised cooked vegetables, including homogenised cooked pakchoi (HCP), homogenised cooked cauliflower (HCC) andhomogenised cooked eggplant (HCE). The sensory test showedthat homogenised raw vegetables had lower scores comparedwith their non-homogenised counterparts, but they wereaccepted by the subjects.
The test meals were combinations of cooked rice and 300 g ofvegetable samples (Table 1). Long-grain fragrant white rice wasused and steamed in a single-portion plastic container at1000W for 40min. Each rice portion (66·1 g of raw rice) wascooked individually using 99·0 g of water. The vegetables wereprepared as follows. (1) Cooked vegetables were prepared byeither boiling or steaming, including steamed eggplant, boiledpak choi and boiled cauliflower. For boiling, well-cut pak choi/cauliflower was placed in a saucepan with 300 g of boilingwater, 1·5 g of salt and 2·5 g of sesame oil. Vegetables werecooked for exactly 2min at a power of 1000W with an induc-tion cooker. The boiled vegetables were given to the subjectsalong with the remaining water (about 100 g). For steaming,sliced eggplant was tiled on the removable bottom of an electricsteamer (Viva Collection; Philips) and steamed for exactly10min. The steamed eggplant was immediately placed ona plate and sprinkled with 2·5 g of oil and 1·5 g of salt. Tobalance the size of the meals, half a glass of water (100 g) wasoffered, when participants consumed the steamed eggplant.
HRV
HCV CE
CV
CV†
CE�CE�
CE�
W¶
CV† HRV‡ HRV‡
Rice* CV† Rice*
Rice*Rice*
HRV‡
HCV§HCV§
HCV§
Fig. 1. Composition of vegetable–rice mixed meals; the size of each meal is569·1 g (water used for cooking or balancing the weight included) or 370 g(water used for cooking or balancing the weight not included); participants weregiven one serving of a vegetable sample first (shown in grey squares), and theywere instructed to consume two additional servings of vegetable samples withcooked rice. CV, cooked vegetable; HRV, homogenised raw vegetable; HCV,homogenised cooked vegetable; CE, cooked eggplant; W, water. * Cooked rice(raw materials: 66·1 g of raw rice and 99·0g of water). † One serving of cookedvegetable, except CE. ‡ One serving of HRV. § One serving of HCV. || Oneserving of CE. ¶ 100 g of W.
1024 R. Zhu et al.
Dow
nloaded from https://w
ww
.cambridge.org/core . IP address: 65.21.228.167 , on 05 Feb 2022 at 09:07:11 , subject to the Cam
bridge Core terms of use, available at https://w
ww
.cambridge.org/core/term
s . https://doi.org/10.1017/S0007114518002489

(2) Homogenised raw vegetables were prepared by putting theraw vegetables in a high-performance blender (WBL1031S;Midea) along with 100 g of water, 2·5 g of oil and 1·5 g of saltand was mashed for exactly 30 s at the top speed (25 000 rpm).(3) Homogenised cooked vegetables were cooked beforemashing. The prepared vegetable samples were equally dividedinto three servings before the blood glucose tests, each servingcontaining 100 g of raw vegetable (Fig. 1).
Chemical analysis of test meals
The nutrient composition and phenolic compound content ofvegetables and rice were analysed as follows. Total starchcontent was examined using a Megazyme assay kits (MegazymeInternational Ireland Limited) according to AOAC 996.11.Reducing sugar content was assayed using Lane–Eynon generalvolumetric method according to AOAC 945.66 and AOAC923.09. Available carbohydrate content was calculated by thesum of total starch content and reducing sugar content(24).Protein content was estimated using the method of Kjeldahlaccording to ISO 1871:2009. Total fat content was assessed byISO 6492:1999. Total dietary fibre, soluble dietary fibre andinsoluble dietary fibre contents were examined using an enzy-matic–gravimetric method according to AOAC 991.43. Watercontent was determined according to ISO 1026:1982. Totalenergy was calculated as described by EU Council Directive1169/2011(25). Total polyphenol content was determined withFolin–Ciocalteu reagents according to the method of Singletonet al.(26), and expressed as mg gallic acid equivalent/100 g freshweight (FW) basis. Total flavonoid content was determined withaluminium trichloride reagents, and expressed as mg rutinequivalent/100 g FW basis(27). Total tannin content was deter-mined using acidified vanillin(28) and expressed as mg catechinequivalent/100 g FW basis.
Glycaemic response testing subjects
Healthy young women aged between 18 and 24 years with BMIbetween 20 and 24·9 kg/m2 were recruited through advertise-ments on the university website. Questionnaires were given tosubjects to ensure that all individuals met the following criteria:not pregnant; not in their menstrual period; non-smoker; non-drinker; free from food allergies; stable weight for the past3 months; regularly eating three meals, not skipping breakfast;not on diet to gain or to lose weight; not on prescriptionmedication in the past 3 months; no metabolic disease orfamilial history of diabetes; and no impaired glucose toleranceor impaired fasting glycaemia. The sample size was calculatedusing PASS 13 Power Analysis and Sample Size software(NCSS). It revealed that the test would have 80% power toexamine a difference (P< 0·05) with sixteen subjects in incre-mental AUC (iAUC) of 20·0mmol/l× 2 h. Potential female sub-jects who met these initial criteria were invited to the laboratoryto finish additional exams, including an oral glucose tolerancetest and a rice control test, which were tested twice for eachsubject. All eligible individuals signed informed consent forms.This study was conducted according to the Declaration ofHelsinki and carried out at the College of Food Science andTa
ble
1.Com
positio
nof
test
mea
ls*
(g(fresh
weigh
t)/portio
n†)
Veg
etab
leCoo
kedric
eSes
ameoilSaltACHO
Totals
tarch
Protein
FatTo
tald
ietary
fibre
Solub
ledietaryfib
reInso
lubledietaryfib
reWater‡
Water§
Ene
rgy(kJ)
G–
––
–50
·0–
––
––
–25
0·0
–83
6·8
R–
165·1
––
49·9
49·9
6·2
0·5
0·7
ND
0·7
507·9
8·8
957·7
CP/HRP/HCP+R
300
165·1
2·5
1·5
52·9
49·9
10·3
3·9
6·7
0·3
6·4
495·6
296·5
1204
·6CC/HRC/HCC+R
300
165·1
2·5
1·5
50·8
49·9
11·5
3·9
4·2
0·3
3·9
487·2
288·1
1189
·5CE/HRE/HCE+R
300
165·1
2·5
1·5
53·5
49·9
8·6
3·9
5·8
0·8
5·1
489·9
290·8
1186
·2
ACHO,av
ailableca
rboh
ydrate;G,gluc
ose;
R,co
oked
rice;
ND,no
tde
tected
,so
lubledietaryfib
reco
nten
t<0·01
/100
g;CP+R,co
oked
pakch
oiwith
cook
edric
e;HRP+R,ho
mog
enised
raw
pakch
oiwith
cook
edric
e;HCP+R,
homog
enised
cook
edpa
kch
oiwith
cook
edric
e;CC+R,co
oked
cauliflow
erwith
cook
edric
e;HRC+R,ho
mog
enised
raw
cauliflow
erwith
cook
edric
e;HCC+R,ho
mog
enised
cook
edca
uliflow
erwith
cook
edric
e;CE+R,co
oked
eggp
lant
with
cook
edric
e;HRE+R,ho
mog
enised
raw
eggp
lant
with
cook
edric
e;HCE+R,ho
mog
enised
cook
edeg
gplant
with
cook
edric
e.*Proximates
wereob
tained
forindividu
alfood
s(raw
pakch
oi,raw
cauliflow
er,raw
eggp
lant
andraw
rice)
andus
edto
calculatethenu
trient
compo
sitio
nof
themixed
mea
ls.
†For
vege
table–
ricemixed
mea
ls,on
epo
rtioninclud
edthreese
rvings
(300
g)of
vege
tablean
dric
e.‡Includ
ingthewater
used
forco
okingor
balanc
ingtheweigh
t.§Not
includ
ingthewater
used
forco
okingor
balanc
ingtheweigh
t.
Glycaemic effects of homogenised vegetables 1025
Dow
nloaded from https://w
ww
.cambridge.org/core . IP address: 65.21.228.167 , on 05 Feb 2022 at 09:07:11 , subject to the Cam
bridge Core terms of use, available at https://w
ww
.cambridge.org/core/term
s . https://doi.org/10.1017/S0007114518002489

Nutritional Engineering, China Agricultural University. Thestudy protocol was approved by the Ethics Committee of ChinaAgricultural University (ethics no. 2016011) and all the subjectssigned written informed consent. There was no uncomfortableoccasion during the test sessions.
Glycaemic response testing procedures
The study protocol used was in line with the standard proce-dures recommended by the FAO and the WHO. This study wasconducted using a randomised crossover design in whichsubjects ate test meals in a randomised order on thirteenseparate mornings, including nine times for different vegetable–rice mixed meals, twice for glucose control and twice for ricecontrol, with a wash-out period of 1 week between each testsession. In all, 1 d (24 h) before each trial day, the participantswere instructed to refrain from excessive eating, alcoholicbeverages, staying up late and strenuous exercise. The subjectsarrived at the laboratory at 08.00 hours, and their baseline bloodglucose level was tested after a 10-min rest. The test meals weregiven to the subjects at 08.15 hours. At the beginning of eachtest meal, participants were given one serving (equivalent to100 g of vegetable material) of a vegetable sample first (pre-load), and they were instructed to consume the preload in10min. Then they were given two additional servings ofvegetable samples with cooked rice (co-ingestion) and wereasked to finish the meal within 20min. The ingestion time wasrecorded and the eating rate was calculated as the total energyof a meal (kJ) consumed per unit time (min). The finger-prickblood samples were taken at 30, 45, 60, 90, 120, 150, 180, 210and 240min following the start of the test meals (Fig. 2). Thesecond drop of blood was used for testing to avoid possibleplasma dilution. Subjects were served 200ml of water between90 and 120min. Subjects were provided with books, magazinesand Wi-Fi and were advised to remain seated during the testsession. They were not permitted to eat foods that were notrelated to the experiment or to discuss the test meals. To assessthe reliability of the study procedure, the glucose reference andthe rice samples were tested twice. Plasma blood glucose wasanalysed using a ONE TOUCH UltraEasy glucometer (Johnson& Johnson), which used the glucose oxidase method.
In vitro determination of starch digestibility
In vitro digestion of starch from the test meals was assessedusing a modified Englyst method(29,30). The enzyme solutionwas prepared by adding 0·45 g of porcine pancreatic α-amylase(150 U/mg; EC 3.2.1.1; A3176; Sigma) into 16ml of water at37°C. The mixture was stirred for 10min and centrifugedfor 10min. Then, 2ml of amyloglucosidase (3000U/ml, EC
3.2.1.3.; Megazyme) was quickly added to 10ml of the enzymesupernatant. The pre-treatment and cooking procedures of thewhite rice and vegetables were the same as those used in bloodglucose testing. After treatment, a portion of cooked rice andthree servings of vegetable samples were mashed togetherevenly with a Midea high-performance blender at the lowestspeed (3000 rpm) for 30 s to simulate chewing. Approximately500mg of mash was mixed into 4ml of sodium acetate buffer(0·1mol/l, pH 5·1). The mixture was incubated in a shakingwater bath (37°C, 200 strokes/min) as soon as 1ml of the freshenzyme solution was added. The aliquot (200 μl) from thisphase was mixed with 95% ethanol at 0, 2, 5, 10, 20, 60 and120min to stop enzyme activity. Released glucose was analysedusing a GAGO20 Glucose Assay Kit (Sigma).
Statistical analysis
The total AUC of postprandial GR (iAUC), the incremental value ofpeak blood glucose and the maximum amplitudes of glucoseexcursion in 240min (MAGE240)
(31) were calculated. The iAUC ofpostprandial GR was determined using the trapezoidal method(32),ignoring the area beneath the fasting level. The rapidly digestiblestarch (RDS), slowly digestible starch (SDS), resistant starch (RS)and hydrolysis index (HI)(29) were also calculated. The GI wasdefined as the iAUC0–120 of the blood glucose response curve of50g of the glycaemic carbohydrate portion expressed as a per-centage of the response to the same amount of carbohydrate fromthe glucose as a reference. The GI was calculated from the twoiAUC0–120 areas. The data were analysed using SPSS 21.0 software(SPSS Inc.). The Kolmogorov–Smirnov test found that most datawere normally distributed, and natural logarithmic transformationwas used where data failed to present normality. Then data analysiswas performed by one-factor repeated-measures ANOVA, with posthoc analysis when applicable. P values were adjusted for multiplecomparisons using the Bonferroni correction. Statistical significancewas considered to be P<0·05. The correlation of data was deter-mined using Pearson’s correlation analysis, P<0·05. Data werepresented as mean values (standard deviations) or mean values(standard errors) where appropriate.
Results
Chemical composition of test meals
The nutrient composition of raw vegetables is shown in Table 1,and phenolic compound content of vegetable meals (rice notincluded) is presented in Table 2. CE had the highest totalpolyphenol and total flavonoid contents. There was no differ-ence between cooked vegetables and homogenised raw vege-tables in terms of total polyphenol and total flavonoid contents.
Bloodcollection
point
Two servings ofvegetable with
rice were served
Subjectsarrived at
the lab
08.00 08.05 08.10 08.20 08.40 08.55 09.10 09.40 10.10 10.40 11.10 11.40 12.10t
Fastingblood collection
point
One servingof vegetablewas served
Waterwas
served
Bloodcollection
point
Bloodcollection
point
Bloodcollection
point
Bloodcollection
point
Bloodcollection
point
Bloodcollection
point
Bloodcollection
point
Fig. 2. Glycaemic response test flow.
1026 R. Zhu et al.
Dow
nloaded from https://w
ww
.cambridge.org/core . IP address: 65.21.228.167 , on 05 Feb 2022 at 09:07:11 , subject to the Cam
bridge Core terms of use, available at https://w
ww
.cambridge.org/core/term
s . https://doi.org/10.1017/S0007114518002489

Subject enrolment
The study subject flow of both reference food tests and vegetable–rice mixed meals is shown in a Consolidated Standards of ReportingTrials (CONSORT) flow diagram (Fig. 3). A total of sixteen subjectscompleted all the test meals and reference food, and each subjectwas a control of themselves. All data were included in analyses.
Subject characteristics
Subject baseline characteristics are shown in Table 3.
Blood glucose
The postprandial GR for all test meals are shown in Fig. 4. In all,sixteen subject had a mean fasting blood glucose concentration
Table 2. Phenolic compound content of test vegetables (per serving, 100 g)(Mean values and standard deviations)
Total polyphenol (mg GAE)* Total flavonoid (mg RUE)† Total tannin (mg CAE)‡
Sample Mean SD Mean SD Mean SD
CP 6381·0b 146·6 1034·5d 67·1 722·8c 11·6HRP 6115·2b 72·8 1335·3b,c,d 166·2 722·1c 14·0HCP 5385·5c 88·7 1335·3b,c,d 166·2 549·7d 8·5CC 6698·0a,b 75·5 1736·4b 224·7 742·6c 15·4HRC 6516·4b 199·5 1732·0b 108·4 762·1c 15·6HCC 4691·9d 60·9 1536·7b,c 157·3 493·5e 11·2CE 6978·2a 145·5 2491·3a 242·6 858·2b 24·1HRE 6913·7a 81·4 2207·4a 175·0 939·8a 19·7HCE 5254·8c 132·6 1133·9c,d 66·4 584·3d 20·8
GAE, gallic acid equivalent; RUE, rutin equivalent; CAE, catechin equivalent; CP, cooked pak choi; HRP, homogenised raw pak choi; HCP, homogenised cooked pak choi; CC,cooked cauliflower; HRC, homogenised raw cauliflower; HCC, homogenised cooked cauliflower; CE, cooked eggplant; HRE, homogenised raw eggplant; HCE, homogenisedcooked eggplant.
a,b,c,d,e Mean values within a column with unlike superscript letters were significantly different (P< 0·05).* Total polyphenol content is expressed as mg GAE/100g fresh weight.† Total flavonoid content is expressed as mg RUE/100g fresh weight.‡ Total tannin content is expressed as mg CAE/100 g fresh weight.
Excluded (n 0)Not meeting inclusion criteria (n 0)Declined to participate (n 0)Other reasons (n 0)
Randomised to treatment order and receivedallocated intervention (n 16)
Did not receive allocated intervention (n 0)
Analysed (n 16)Excluded from analysis (n 0)Analysis
Withdrawal
Consented to participate (n 16)
Enrolment
Expressed interest (n 23)
Assessed for eligibility (n 16)
No longer interested after obtainingstudy details (n 7)
Withdrawal (n 0)
Fig. 3. Consolidated Standards of Reporting Trials (CONSORT) flow diagram of the study subjects.
Glycaemic effects of homogenised vegetables 1027
Dow
nloaded from https://w
ww
.cambridge.org/core . IP address: 65.21.228.167 , on 05 Feb 2022 at 09:07:11 , subject to the Cam
bridge Core terms of use, available at https://w
ww
.cambridge.org/core/term
s . https://doi.org/10.1017/S0007114518002489

of 4·8 (SE 0·4) mmol/l, and there was no difference amongtreatments in terms of fasting blood glucose concentrations. Allrice-based meals attained peak glucose values at 45min.Compared with the rice control (7·2 (SE 0·2)mmol/l), the CE+ Rmeal had significantly lower glucose levels at both 30 and45min (6·5 (SE 0·2)mmol/l, P= 0·008; 6·7 (SE 0·2)mmol/l,P= 0·005, respectively), whereas the CP +R and CC+R mealshad significantly lower blood glucose values at 60min (6·4(SE 0·3)mmol/l, P= 0·033; 6·4 (SE 0·3)mmol/l, P= 0·037, respec-tively). The CP+R and CC+R meals better maintained glucoseconcentrations than the rice control did during 150–240min.All three kinds of non-homogenised vegetable–rice mixed
meals had significantly reduced GI values compared with therice control. Compared with ingestion of rice control, ingestionof the CE + R meal significantly reduced the peak, iAUC0–120 andMAGE240 values, which resulted in a medium GI value of 67without causing a significant reduction in the iAUC120–240 value(Table 4). The iAUC0–120 values of both CE +R and CC+R weresignificantly smaller than those of the rice control. However,their homogenised counterparts did not show significantreduction in any of the glycaemic characteristics compared withthe rice control.
Eating rates
The eating rates of CC +R and CE +R were significantly lowerthan those of pure rice and rice mixed with homogenisedvegetables (Table 4). The eating rates of the meals showed asignificant positive correlation with postprandial glycaemiccharacteristics, including iAUC0–120 values, peak values andMAGE240 values (P< 0·01).
In vitro starch digestibility
The amounts of glucose released from rice–vegetable mealsand rice alone increased rapidly over 20min during in vitrodigestion and reached plateaus at 60–90min (Fig. 5). Thepercentages of in vitro starch hydrolysis of CP + R, CC + R andCE + R were significantly lower than the percentages of thewhite rice sample at 20min and beyond. The in vitro starchhydrolysis percentages of CE + R at 20, 60 and 120min (52·5,58·3 and 62·2%) were significantly lower than the percen-tages of HRE + R (73·8%, P= 0·008; 77·9%, P= 0·006 and84·4%, P= 0·011) and HCE + R (67·2 %, P= 0·001; 72·6 %,P= 0·005 and 77·0%, P= 0·002) at the time points mentionedabove.
Among all test meal samples, the HI value and RDS content ofCE + R were the lowest, whereas the RS fraction of CE + R wasthe highest (Table 5). The addition of CC, CP, HRC and HREincreased the RS content, whereas the ingestion of HCC, HCPand HRP with rice caused an increase in SDS content. However,
Table 3. Subject baseline characteristics(Mean values and standard deviations, n 16)
Characteristics Mean SD
Number of participants (n) 16Age (years) 22·8 1·2Body height (cm) 161·1 3·9Body weight (kg) 54·2 4·2BMI (kg/m2) 21·0 1·6Fat mass (%) 24·8 2·8BMR (kJ/d) 5017 226
9(a)
(b)
(c)
8
7
Blo
od g
luco
se (
mm
ol/l)
6
5
*
4
9
8
7
Blo
od g
luco
se (
mm
ol/l)
6
5
4
9
0 60 120
Time (min)
180 240
8
7
Blo
od g
luco
se (
mm
ol/l)
6
5
4
*
****
Fig. 4. Postprandial plasma glucose changes in subjects after the consumptionof reference food and test meals, including (a) pak choi meals, (b) cauliflowermeals and (c) eggplant meals, with glucose and rice as references ( ,glucose; , cooked rice; , cooked pak choi with cooked rice; ,homogenised raw pak choi with cooked rice; , homogenised cooked pakchoi with cooked rice; , cooked cauliflower with cooked rice; ,homogenised raw cauliflower with cooked rice; , homogenised cookedcauliflower with cooked rice; , cooked eggplant with cooked rice; ,homogenised raw eggplant with cooked rice; , homogenised cookedeggplant with cooked rice). Values are the mean changes in blood glucose levels(n 16), with their standard errors represented by vertical bars. Differences betweenthe cooked vegetable–rice mixed meal and two homogenised vegetables (cookedor raw) are shown (*P<0·05, **P<0·01).
1028 R. Zhu et al.
Dow
nloaded from https://w
ww
.cambridge.org/core . IP address: 65.21.228.167 , on 05 Feb 2022 at 09:07:11 , subject to the Cam
bridge Core terms of use, available at https://w
ww
.cambridge.org/core/term
s . https://doi.org/10.1017/S0007114518002489
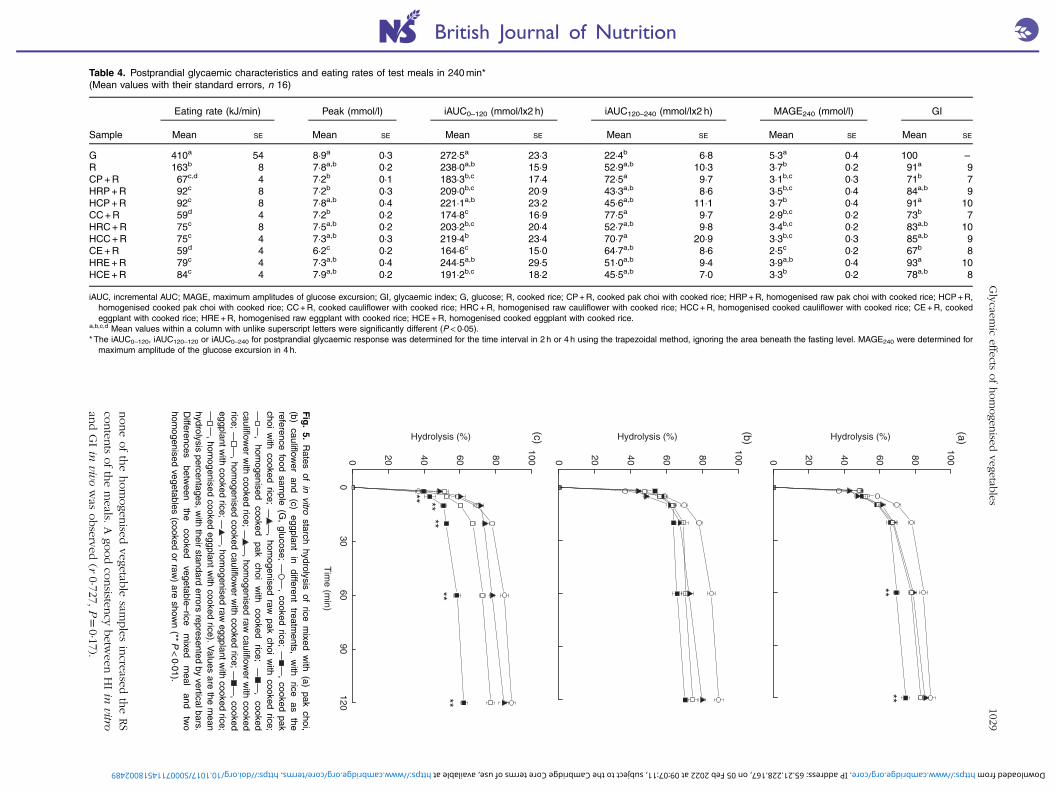
noneofthehomogen
isedvegetab
lesam
ples
increased
theRS
conten
tsofthemeals.
Ago
odco
nsisten
cybetw
eenHIin
vitroan
dGIin
vivowas
observed
(r0·727,
P=0·17).
Table 4. Postprandial glycaemic characteristics and eating rates of test meals in 240min*(Mean values with their standard errors, n 16)
Eating rate (kJ/min) Peak (mmol/l) iAUC0–120 (mmol/lx2 h) iAUC120–240 (mmol/lx2 h) MAGE240 (mmol/l) GI
Sample Mean SE Mean SE Mean SE Mean SE Mean SE Mean SE
G 410a 54 8·9a 0·3 272·5a 23·3 22·4b 6·8 5·3a 0·4 100 –
R 163b 8 7·8a,b 0·2 238·0a,b 15·9 52·9a,b 10·3 3·7b 0·2 91a 9CP+R 67c,d 4 7·2b 0·1 183·3b,c 17·4 72·5a 9·7 3·1b,c 0·3 71b 7HRP+R 92c 8 7·2b 0·3 209·0b,c 20·9 43·3a,b 8·6 3·5b,c 0·4 84a,b 9HCP+R 92c 8 7·8a,b 0·4 221·1a,b 23·2 45·6a,b 11·1 3·7b 0·4 91a 10CC+R 59d 4 7·2b 0·2 174·8c 16·9 77·5a 9·7 2·9b,c 0·2 73b 7HRC+R 75c 8 7·5a,b 0·2 203·2b,c 20·4 52·7a,b 9·8 3·4b,c 0·2 83a,b 10HCC+R 75c 4 7·3a,b 0·3 219·4b 23·4 70·7a 20·9 3·3b,c 0·3 85a,b 9CE+R 59d 4 6·2c 0·2 164·6c 15·0 64·7a,b 8·6 2·5c 0·2 67b 8HRE+R 79c 4 7·3a,b 0·4 244·5a,b 29·5 51·0a,b 9·4 3·9a,b 0·4 93a 10HCE+R 84c 4 7·9a,b 0·2 191·2b,c 18·2 45·5a,b 7·0 3·3b 0·2 78a,b 8
iAUC, incremental AUC; MAGE, maximum amplitudes of glucose excursion; GI, glycaemic index; G, glucose; R, cooked rice; CP+R, cooked pak choi with cooked rice; HRP+R, homogenised raw pak choi with cooked rice; HCP+R,homogenised cooked pak choi with cooked rice; CC+R, cooked cauliflower with cooked rice; HRC+R, homogenised raw cauliflower with cooked rice; HCC+R, homogenised cooked cauliflower with cooked rice; CE+R, cookedeggplant with cooked rice; HRE+R, homogenised raw eggplant with cooked rice; HCE+R, homogenised cooked eggplant with cooked rice.
a,b,c,d Mean values within a column with unlike superscript letters were significantly different (P<0·05).* The iAUC0–120, iAUC120–120 or iAUC0–240 for postprandial glycaemic response was determined for the time interval in 2 h or 4 h using the trapezoidal method, ignoring the area beneath the fasting level. MAGE240 were determined for
maximum amplitude of the glucose excursion in 4 h.
100(a)
(b)
(c)
8060
Hydrolysis (%)
40200
1008060
Hydrolysis (%)40200
1008060
Hydrolysis (%)
40
030
6090
120
Tim
e (min)
200
******
****
** **
Fig.5.
Rates
ofin
vitrostarch
hydrolysisof
ricemixed
with
(a)pak
choi,(b)
cauliflower
and(c)
eggplantin
differenttreatm
ents,with
riceas
thereference
foodsam
ple(G
,glucose;
,cooked
rice;,cooked
pakchoi
with
cookedrice;
,hom
ogenisedraw
pakchoi
with
cookedrice;
,hom
ogenisedcooked
pakchoi
with
cookedrice;
,cooked
cauliflower
with
cookedrice;
,hom
ogenisedraw
cauliflower
with
cookedrice;
,hom
ogenisedcooked
cauliflower
with
cookedrice;
,cooked
eggplantwith
cookedrice;
,homogenised
raweggplantw
ithcooked
rice;,hom
ogenisedcooked
eggplantwith
cookedrice).
Values
arethe
mean
hydrolysispercentages,w
iththeir
standarderrors
representedby
verticalbars.Differences
between
thecooked
vegetable–rice
mixed
meal
andtwo
homogenised
vegetables(cooked
orraw
)are
shown(**P
<0·01).
Glycaem
iceffects
ofhomogen
isedvegetab
les1029
Downloaded from https://www.cambridge.org/core. IP address: 65.21.228.167, on 05 Feb 2022 at 09:07:11, subject to the Cambridge Core terms of use, available at https://www.cambridge.org/core/terms. https://doi.org/10.1017/S0007114518002489

Discussion
A number of previous studies reported that adding vegetablesto a high-GI meal could exert a glycaemic mitigationeffect(16,17,23,33), but, to our knowledge, the present study is thefirst study to compare the postprandial GR of non-homogenisedand homogenised vegetables added to rice-based meals.In this study, both the in vivo postprandial blood glucose
tests and the in vitro carbohydrate digestion assays demon-strated that, compared with their homogenised counterparts,non-homogenised low-fat cooked vegetables could contributemore effectively to slow the carbohydrate digestion process ormitigate the postprandial GR. Co-ingestion of three servings(300 g of vegetable) of non-homogenised low-fat cooked pakchoi, cauliflower and eggplant significantly lowered the GIvalues of rice-based meals, whereas the homogenised vege-tables failed to achieve significant reduction in GI values. Theoutcomes of in vitro carbohydrate digestibility of vegetable–ricemixed meals echoed the results of the human blood glucosetests. These results strongly support our research hypothesis –
that is, the natural texture of vegetables might play an importantrole in GR and starch hydrolysis, as the homogenised vege-tables, either cooked or uncooked, failed to render comparableglycaemic effects to their non-homogenised cooked counter-parts in the first hour after the meal.Some previous studies reported that both vegetables and
vegetable juice might have simultaneous positive effects on GRand insulinaemic responses(16,33). It was reported that a mealwith 164 g of spinach elicited significantly lower insulin andC-peptide responses than the control meal did(13). Comparedwith a meal consisting of 200 g of boiled rice, a mixed mealconsisting of 200 g of rice and 120 g of Chinese cabbage had a14·6% lower incremental area above the blood insulin curveover 120min(14). In light of these results, the blood-glucose-suppressing effect of vegetables could not be attributed toraising insulin level, although the plasma insulin was not mea-sured in the present study. The mechanism of glycaemicattenuation of vegetables might partly be explained by their
slow ingestion, the dietary fibre’s delaying effect on gastricemptying(18,19) and the polyphenol’s carbohydrate digestion(34).
It is noteworthy that the meals added with non-homogenisedvegetable had significantly lower ingestion rates compared withtheir homogenised counterparts. Low eating rates mightincrease the level of anorexigenic gut peptide glucagon-likepeptide 1 and peptide YY, and these peptide hormones have animportant role to play in enhancing the glucose-stimulatedinsulin secretion(35–37). It was reported that eating slowly andmore chewing were associated with reduced GR and HbA1cand lower risk of diabetes(38). In contrast, eating fast might beassociated with insulin resistance in middle-aged individuals(39).
The contribution of dietary fibre on glycaemic control hasbeen well established. Soluble fibre such as pectin may absorbwater, swell, become viscous and then establish a physicalbarrier between foods and digestion enzymes(40). It is reportedthat pectin could delay gastric emptying of both liquid and solidmeals by increasing the viscosity of the meals in normal humansubjects while not causing significant variations in plasmainsulin levels in healthy subjects(41). In an animal study, pectinextracted from citrus improved glucose tolerance throughregulation of the phosphoinositide 3-kinase/protein kinaseB (PI3K/Akt) signalling pathway(42). Soluble dietary fibre couldbe fermented to generate SCFA, which would up-regulateGLUT-4 and attenuate the postprandial GR(43).
However, the vegetable’s texture itself could be an importantfactor to affect GR. Compared with liquid and semisolid foods,solid foods may have longer gastric emptying times(44,45), whichin turn delay the absorption of glucose into blood(23). There is arandomised trial which proved that the physicochemical prop-erties of dietary fibre influenced fibre's capacity for reducingappetite and energy intake when added to a diet as preload,because gelled pectin was more effective compared with theliquid pectin solution, though both the gelled and viscous liquidpectin lowered insulin responses(46).
With the popularity of high-performance blenders in themodern kitchen, homogenised and juiced vegetables (semisolidor liquid) are often consumed instead of traditionally prepared
Table 5. Hydrolysis index and constituents of starch fractions of meal samples(Mean values and standard deviations)
RDS (%*) SDS (%*) RS (%*) HI (%)
Sample Mean SD Mean SD Mean SD Mean SD
R 35·5a 0·8 4·9c 1·0 10·2c 1·3 100 –
CP+R 34·9a 2·0 4·5c 0·2 13·4b 1·7 83·8b 1·7HRP+R 35·6a 0·8 8·4a 1·8 8·9c 1·2 91·2a 1·2HCP+R 35·8a 0·4 9·6a 0·5 7·6d 0·8 92·5a 1·7CC+R 35·2a 2·2 3·6c,d 0·1 16·5a,b 1·8 80·6b 1·0HRC+R 38·2a 4·1 2·9d 0·2 14·1b 1·1 85·5a,b 0·8HCC+R 37·1a 2·4 6·9b 0·5 11·3b,c 1·1 87·2a,b 0·9CE+R 28·7b 1·1 5·3b,c 0·3 20·7a 1·1 69·6c 0·3HRE+R 36·6a 1·9 5·3b,c 0·1 12·9b 1·0 86·8a,b 2·1HCE+R 38·1a 2·4 5·8b,c 0·1 8·8c 0·4 94·6a 0·9
RDS, rapidly digestible starch; SDS, slowly digestible starch; RS, resistant starch; HI, hydrolysis index; R, cooked rice; CP+R, cooked pak choi with cooked rice; HRP+R,homogenised raw pak choi with cooked rice; HCP+R, homogenised cooked pak choi with cooked rice; CC+R, cooked cauliflower with cooked rice; HRC+R, homogenised rawcauliflower with cooked rice; HCC+R, homogenised cooked cauliflower with cooked rice; CE+R, cooked eggplant with cooked rice; HRE+R, homogenised raw eggplant withcooked rice; HCE+R, homogenised cooked eggplant with cooked rice.
a,b,c,d Mean values within a column with unlike superscript letters were significantly different (P<0·05).* The percentage of RDS, SDS or RS belonging to total starch.
1030 R. Zhu et al.
Dow
nloaded from https://w
ww
.cambridge.org/core . IP address: 65.21.228.167 , on 05 Feb 2022 at 09:07:11 , subject to the Cam
bridge Core terms of use, available at https://w
ww
.cambridge.org/core/term
s . https://doi.org/10.1017/S0007114518002489

vegetable dishes in many families, especially among youngpeople who are less likely to cook at home. It should be notedthat, with respect to their glycaemic benefits, homogenisedvegetables may not be as effective as vegetable dishes in whichthe natural structure is well preserved.In addition to the effect of fibre, the polyphenols in vege-
tables have the potential to inhibit the activity of carbohydratedigestion enzymes, such as α-amylase and α-glucosidase(47).In an in vitro study, polyphenols from eggplant stronglyinhibited α-amylase and α-glucosidase activities and thusprovided a strong biochemical basis for management ofhyperglycaemia-induced pathogenesis(48). There is evidencethat the absorbed polyphenols might up-regulate GLUT-4 inskeletal muscle, PI3K in muscle and adipocytes and AMP-activated protein kinase in muscle, adipocytes, pancreas andliver, which would help to improve glucose homoeostasis(34).In this study, the steaming treatment of CE could maximise
the phenolic retention, whereas the boiling treatment of CC andCP minimises the loss of polyphenols by the addition of a smallamount of water and serving with the remaining water. In ananimal study, it was also reported that the polyphenol content,the intestinal α-glucosidase inhibitory activity and the anti-glycation potential of green Amaranthus leafy juice were eitherenhanced or unchanged after cooking(21).The timing of ingestion of vegetables might make a difference
in terms of glycaemic effect. A study found that co-ingestion of75 g of spinach with fat-rich and starch-rich meals failed toachieve a lowered GR in both healthy and obese subjects(32),whereas another study reported that as little as 60 g of spinachor broccoli significantly lowered the iAUC of GR when taken asa side dish before the ingestion of starchy food(49). In this study,one serving of the vegetable was given before the ingestion ofrice, as the effects of eating vegetables before carbohydratefoods on glucose excursions was elaborated by Imai et al.(15).It is noticed that the CE + R meal had the lowest GI, peak and
MAGE values among all GR test meals, and had the highest RSand lowest RDS in the in vitro digestion tests. Starchy foods oflow RDS and high RS tend to result in relatively low post-prandial GR(50), and have the potential to enhance insulinsensitivity. Not coincidently, eggplant had the highest totalpolyphenol and total flavonoid contents, and the highest fibrecontent among the three vegetables. As eggplant is rich inpolyphenols(51) and fibre, it has been recommended by theNational Diabetes Education Program of National Institute ofHealth, Mayo Clinic and American Diabetes Association formanagement of type 2 diabetes(52).However, given the fact that both the polyphenol and dietary
fibre did not have any substantial loss after homogenisation, thedifference of glycaemic effect among the three test samples of asame vegetable could only be explained by the divergence inphysical structure. In light of this result, it is suggested that thestrong GR mitigating effect of vegetables depends on the naturalphysical structure. The underlying mechanism requires furtherinvestigation.This study has several limitations. First, the human subjects
were healthy young Asian women of normal BMI and body fatpercentages. Males, overweight and obese people and peoplewith impaired blood glucose tolerance were excluded to avoid
the confounders brought by differences in sex or metabolicstatus. The blood glucose modulation effect of vegetables maybe more positive in abdominal obese people and prediabeticpeople, and thus deserve further investigation. Second, thegastric emptying rates, insulinaemic responses and gastro-intestinal hormones were not determined in this study, althoughthey would provide a more convincing explanation of gly-caemic control mechanisms of the vegetable–rice mixed diet.Third, we only examined the effect of large amounts (300 g) ofnon-homogenised and homogenised vegetable on GR andstarch digestion, and the effect of small amounts of vegetablewas not evaluated. As mentioned above, the impact of smallamounts remained controversial. Finally, although we analysedthe polyphenols and dietary fibre, the biological active com-pounds such as solanine in eggplant and glucosinolates incauliflower and pak choi, which might exert a positive role inGR, were not tested.
In conclusion, we found that both in vitro and in vivo testssupported the hypothesis that the texture/physical properties ofvegetables might be a determinant of vegetables’ postprandialglycaemic effects, whereas multiple factors including the eatingrate, polyphenol content and dietary fibre content may playimportant roles in the underlying glycaemic control mechan-isms as well.
Acknowledgements
The authors express their sincere gratitude to all the subjectswho participated in the blood test study.
This research received no specific grant from any fundingagency, commercial or not-for-profit sectors.
This description will cover the contribution of each author tothe research. Z. F. and R. Z. formulated the research question,designed the study and wrote the article; R. Z., M. L., Y. H., L. W.,T. Y. and J. L. carried out the experiments. R. Z. analysed the data.
The authors declare that there are no conflicts of interest.
References
1. Yang CH, Chang CW & Lin J (2017) White rice glycemic indexmeasured in venous and capillary blood samples. Food SciTechnol Res 23, 297–304.
2. Boers HM, ten Hoorn JS & Mela DJ (2015) A systematic reviewof the influence of rice characteristics and processing methodson postprandial glycaemic and insulinaemic responses. Br JNutr 114, 1035–1045.
3. Robert SD, Ismail AAS & Rosli WIW (2016) Reduction ofpostprandial blood glucose in healthy subjects by buns andflatbreads incorporated with fenugreek seed powder. Eur JNutr 55, 2275–2280.
4. Kolb H & Eizirik DL (2011) Resistance to type 2 diabetesmellitus:a matter of hormesis? Nat Rev Endocrinol 8,183–192.
5. Guariguata L, Whiting DR, Hambleton I, et al. (2014) Globalestimates of diabetes prevalence for 2013 and projectionsfor 2035. Diabetes Res Clin Pract 103, 137–149.
6. Tuomilehto J, Lindstrom J, Eriksson JG, et al. (2001) Preven-tion of type 2 diabetes mellitus by changes in lifestyle amongsubjects with impaired glucose tolerance. N Engl J Med 344,1343–1350.
Glycaemic effects of homogenised vegetables 1031
Dow
nloaded from https://w
ww
.cambridge.org/core . IP address: 65.21.228.167 , on 05 Feb 2022 at 09:07:11 , subject to the Cam
bridge Core terms of use, available at https://w
ww
.cambridge.org/core/term
s . https://doi.org/10.1017/S0007114518002489
7. Ceriello A & Colagiuri S (2010) International Diabetes Fed-eration guideline for management of postmeal glucose: areview of recommendations. Diabetic Med 25, 1151–1156.
8. Cooper AJM, Sharp SJ, Luben RN, et al. (2015) The associationbetween a biomarker score for fruit and vegetable intake andincident type 2 diabetes: the EPIC-Norfolk study. Eur J ClinNutr 69, 449–454.
9. Mamluk L, O’Doherty MG, Orfanos P, et al. (2017) Fruit andvegetable intake and risk of incident of type 2 diabetes: resultsfrom the Consortium on Health and Ageing Network ofCohorts in Europe and the United States (CHANCES). Eur JClin Nutr 71, 82–91.
10. Wu Y, Zhang D, Jiang X, et al. (2015) Fruit and vegetableconsumption and risk of type 2 diabetes mellitus: a dose–response meta-analysis of prospective cohort studies. NutrMetab Cardiovasc Dis 25, 140–147.
11. Jia X, Zhong L, Song Y, et al. (2016) Consumption of citrus andcruciferous vegetables with incident type 2 diabetes mellitusbased on a meta-analysis of prospective study. Prim CareDiabetes 10, 272–280.
12. Wolever TMS, Jenkins A, Vuksan V, et al. (1988) Effect of extravegetables added to a starchy meal on blood-glucoseresponses in patients with type-2 diabetes. Can J Diet Assoc49, 168–171.
13. Gustafsson K, Asp NG, Hagander B, et al. (1993) Effects ofdifferent vegetables in mixed meals on glucose homeostasisand satiety. Eur J Clin Nutr 47, 192–200.
14. Sun L, Ranawana DV, Leow MK, et al. (2014) Effect ofchicken, fat and vegetable on glycaemia and insulinaemia to awhite rice-based meal in healthy adults. Eur J Nutr 53,1719–1726.
15. Imai S, Matsuda M, Hasegawa G, et al. (2011) A simple mealplan of ‘eating vegetables before carbohydrate’ was moreeffective for achieving glycemic control than an exchange-based meal plan in Japanese patients with type 2 diabetes.Asia Pac J Clin Nutr 20, 161–168.
16. Kasuya N, Okuyama M, Yoshida K, et al. (2016) Prior orconcomitant drinking of vegetable juice with a meal attenu-ates postprandial blood glucose elevation in healthyyoung adults. Food Nutr Sci 7, 797–806.
17. Tiwari AK, Jyothi AL, Tejeswini VB, et al. (2013) Mitigation ofstarch and glucose-induced postprandial glycemic excursionin rats by antioxidant-rich green-leafy vegetables’ juice.Pharmacogn Mag 9, S66–S73.
18. Yu K, Ke MY, Li WH, et al. (2014) The impact of solubledietary fibre on gastric emptying, postprandial blood glucoseand insulin in patients with type 2 diabetes. Asia Pac J ClinNutr 23, 210–218.
19. Gopirajah R, Raichurkar KP, Wadhwa R, et al. (2016) Theglycemic response to fibre rich foods and their relationshipwith gastric emptying and motor functions: an MRI study.Food Funct 7, 3964–3972.
20. Argyri K, Sotiropoulos A, Psarou E, et al. (2013) Dessert for-mulation using sucralose and dextrin affects favorably post-prandial response to glucose, insulin, and c-peptide in type 2diabetic patients. Rev Diabet Stud 10, 39–48.
21. Kumar DA, Anusha SV, Oruganti S, et al. (2015) Raw versuscooked vegetable juice. Nutr Foods 14, 27–38.
22. Samra RA & Anderson GH (2007) Insoluble cereal fiberreduces appetite and short-term food intake and glycemicresponse to food consumed 75 min later by healthy men. Am JClin Nutr 86, 972–979.
23. Ballance S, Knutsen SH, Fosvold OW, et al. (2018) Glyceamicand insulinaemic response to mashed potato alone, or withbroccoli, broccoli fibre or cellulose in healthy adults. Eur JNutr 57, 199–207.
24. Ek KL, Wang S, Copeland L, et al. (2014) Discovery of a low-glycaemic index potato and relationship with starch digestionin vitro. Br J Nutr 111, 699–705.
25. European Union (2011) Regulation no. 1169/2011 of theEuropean Parliament and of the Council on the provision offood information to consumers. Off J Eur Union 304, 18–63.
26. Singleton VL, Orthofer R & Lamuela-Raventós RM (1999)Analysis of total phenols and other oxidation substrates andantioxidants by means of Folin–Ciocalteu reagent. MethodsEnzymol 299, 152–178.
27. Xu BJ, Yuan SH & Chang SK (2007) Comparative analyses ofphenolic composition, antioxidant capacity, and color of coolseason legumes and other selected food legumes. J Food Sci72, 167–177.
28. Broadhurst RB & Jones WT (1978) Analysis of condensedtannins using acidified vanillin. J Sci Food Agric 29, 788–794.
29. Englyst HN, Veenstra J & Hudson GJ (1996) Measurement ofrapidly available glucose (RAG) in plant foods: a potentialin vitro predictor of the glycaemic response. Br J Nutr 75,327–337.
30. Englyst KN, Englyst HN, Hudson GJ, et al. (1999)Rapidly available glucose in foods: an in vitro measurementthat reflects the glycemic response. Am J Clin Nutr 69,448–454.
31. Brandmiller JC, Stockmann K, Atkinson F, et al. (2009) Gly-cemic index, postprandial glycemia, and the shape of thecurve in healthy subjects: analysis of a database of more than1000 foods. Am J Clin Nutr 89, 97–105.
32. Wolever TMS (2004) Effect of blood sampling schedule andmethod of calculating the area under the curve on validity andprecision of glycemic index values. Br J Nutr 91, 295–300.
33. Gustafsson K, Asp NG, Hagander B, et al. (1993) Effects ofdifferent vegetables in mixed meals on glucose homeostasisand satiety. Eur J Clin Nutr 47, 192–200.
34. Kim Y, Keogh JB & Clifton PM (2016) Polyphenols and gly-cemic control. Nutrients 8, 17.
35. Kokkinos A, Le RC, Alexiadou K, et al. (2009) The post-prandial response of the anorexigenic gut hormones PYY andGLP-1 is affected by eating rate. Diabetologia 52, S227.
36. Sonoki K, Iwase M, Takata Y, et al. (2013) Effects of thirty-timeschewing per bite on secretion of glucagon-like peptide-1 inhealthy volunteers and type 2 diabetic patients. Endocr J 60,311–319.
37. Kokkinos A, Roux CWL, Alexiadou K, et al. (2010) Eatingslowly increases the postprandial response of the anorexi-genic gut hormones, peptide YY and glucagon-like peptide-1.J Clin Endocrinol Metab 95, 333–337.
38. Yamazaki T, Yamori M, Asai K, et al. (2013) Mastication andrisk for diabetes in a Japanese population: a cross-sectional study. PLOS ONE 8, e64113.
39. Otsuka R, Tamakoshi K, Yatsuya H, et al. (2008) Eating fastleads to insulin resistance: findings in middle-aged Japanesemen and women. Prev Med 46, 154–159.
40. Cassidy YM, McSorley EM & Allsopp PJ (2018) Effect ofsoluble dietary fibre on postprandial blood glucose responseand its potential as a functional food ingredient. J Funct Foods46, 423–439.
41. Sandhu KS, Samahi MME, Mena I, et al. (1987) Effect of pectinon gastric emptying and gastroduodenal motility in normalsubjects. Gastroenterology 92, 486–492.
42. Liu Y, Dong M, Yang Z, et al. (2016) Anti-diabetic effect ofcitrus pectin in diabetic rats and potential mechanism viaPI3K/Akt signaling pathway. Int J Biol Macromol 89, 484–488.
43. Galisteo M, Morón R, Rivera L, et al. (2010) Plantago ovatahusks-supplemented diet ameliorates metabolic alterations inobese Zucker rats through activation of AMP-activated protein
1032 R. Zhu et al.
Dow
nloaded from https://w
ww
.cambridge.org/core . IP address: 65.21.228.167 , on 05 Feb 2022 at 09:07:11 , subject to the Cam
bridge Core terms of use, available at https://w
ww
.cambridge.org/core/term
s . https://doi.org/10.1017/S0007114518002489

kinase: comparative study with other dietary fibers. Clin Nutr29, 261–267.
44. Okabe T, Terashima H & Sakamoto A (2017) A comparison ofgastric emptying of soluble solid meals and clear fluids mat-ched for volume and energy content: a pilot crossover study.Anaesthesia 72, 1344–1350.
45. Gonlachanvit S, Chey WD, Goodman KJ, et al. (2001) Effect ofmeal size and test duration on gastric emptying and gastricmyoelectrical activity as determined with simultaneous 13Coctanoate breath test and electrogastrography in normal sub-jects using a muffin meal. Digest Dis Sci 46, 2643–2650.
46. Wanders AJ, Feskens EJM, Jonathan MC, et al. (2014) Pectin isnot pectin: a randomized trial on the effect of different phy-sicochemical properties of dietary fiber on appetite andenergy intake. Physiol Behav 128, 212–219.
47. Tan Y & Chang SKC (2017) Digestive enzyme inhibition activityof the phenolic substances in selected fruits, vegetables and teaas compared to black legumes. J Funct Foods 38, 644–655.
48. Kwon YI, Apostolidis E & Shetty K (2008) In vitro studies ofeggplant (Solanum melongena) phenolics as inhibitors of keyenzymes relevant for type 2 diabetes and hypertension.Bioresour Technol 99, 2981–2988.
49. Kameyama N, Maruyama C, Matsui S, et al. (2014) Effects ofconsumption of main and side dishes with white rice onpostprandial glucose, insulin, glucose-dependent insulino-tropic polypeptide and glucagon-like peptide-1 responses inhealthy Japanese men. Br J Nutr 111, 1632–1640.
50. Kuma A, Sahoo U, Baisakha B, et al. (2018) Resistant starchcould be decisive in determining the glycemic index of ricecultivars. J Cereal Sci 79, 348–353.
51. Niño-Medinaa G, Urías-Oronab V, Muy-Rangelc MD, et al.(2017) Structure and content of phenolics in eggplant(Solanum melongena): a review. S Afr J Bot 111, 161–169.
52. National Institutes of Health (NIH) (2008) National DiabetesEducation Program. http://www.ndep.nih.gov/diabetes/Mealplanner/enlasagna.htm (accessed May 2007).
Glycaemic effects of homogenised vegetables 1033
Dow
nloaded from https://w
ww
.cambridge.org/core . IP address: 65.21.228.167 , on 05 Feb 2022 at 09:07:11 , subject to the Cam
bridge Core terms of use, available at https://w
ww
.cambridge.org/core/term
s . https://doi.org/10.1017/S0007114518002489