Embed Size (px)
Citation preview

U"II' ,-,-,~,-." ,-.r L'; ,,·Jr·"1 L',:)c; '\F~Y !'", ',' I::l~ .... ~): ; ~ ',jr .1..- ,./', , ",:, It_'1 '.,\ ,
THE EFFECTS OF ACUTE INFECTION AND
INFLAMMATION ON PHASE II DETOXIFYING
ENZYMES
A THESIS SUBMITTED TO THE GRADUATE DIVISION OF THE
UNIVERSITY OF HA WAI'I IN PARTIAL FULFILLMENT OF THE
REQUDffiMENTS FOR THE DEGREE OF
MASTER OF SCIENCE
IN
MICROBIOLOGY
DECEMBER 2007
By
Darcy L. Welch
Thesis Committee:
Karen Yamaga, Chairperson
Abby Collier
William Gosnell
Paul Patek

We certify that we have read this thesis and that, in om opinion, it is satisfactory in scope
and quality as a thesis for the degree of Master of Science in Microbiology.
THESIS COMMITTEE
CHAIRPERSON
eX Cttfh I
ii
Acknowledgments
The completion of this thesis would not have been possible were it not for the
substantial guidance. support, assistance and instruction of the following parties. So it is
with sincerest thanks that I acknowledge the following individuals.
I would like to thank Dr. Vivek Nerurkar for graciously affording us the use of his
epifluroescent micrscope and Dr. Frederick Mercier for lending us his expertise as well as
his time to obtain the immunocytochemical pictures in this thesis.
1 would also like to deeply thank the members of my committee for their constant
encouragement and counsel throughout this process. I feel privileged to have had a
committee that was always constructive in their suggestions, inclined to my ideas and
optimistic of my endeavors. Dr. Gosnell was unshakably encouraging and unfailingly
left me with a feeling of reassurance in regards to my ability to complete this often
daunting task. Dr. Patek was nothing short of heroic in his assistance throughout my
graduate career. His calm demeanor and ability to get things done promptly salvaged
many a day from its downward spiral. Dr. Yamaga was instrumental in the success of
this project. Her support financially and academically throughout this entire process has
been a tremendous fortification for me.
For Dr. Abby Collier, I have the greatest appreciation and respect. Her continual
direction and instruction coupled with her ability to point me in down the right path
without holding my hand the whole way instilled in me an ownership of my project and
pushed me to take greater pride and interest in my work. And on the days when
instruction and direction were not enough, she gave me friendship and witticisms, which
I feel truly blessed to have received.
iii

And finally, I would like to dedicate this thesis to my parents, the source of this
and all future achievements in my life. Their unflinching love, ceaseless reassurance,
plucky comic relief, and above all, their ability to keep me grounded in reality without
hindering my dreams is the impetus for all things good I do.
iv

Abstract
Infection and inflammation may alter liver metabolism causing significant changes in
drug efficacy and toxicity. The expression and activity of the Cytochromes P450 in
human liver are significantly down-regulated during acute infection and inflammation but
little is known about Phase II metabolizing enzymes. We treated the human liver cell line
Hep02 with TNF-a and IL-1~ to at 0.1-1000 U/mL for 0-48 hours as a model of acute
infection and inflammation. Cells were harvested at each time point and assessed for cell
death (MIT assay) and levels of reactive oxygen species (ROS) and for the expression
and activity of the major Phase II enzymes UDP-glucuronosyl transferase (UOT),
Glutathione-S-transferase (OS1') and Sulfotransferase (SULT). Since all of these
enzymes have hepatic nuclear factor (HNF) recognition sequences in their genes, we
assessed the effects of the cyrokines on HNF1 and HNF4 expression and nuclear
translocation with immunofluorescence. UOT enzymes are not significantly affected by
pro-inflammatory cytokines and SUL T enzymes showed no change in activity while OST
enzymes showed a significant increase in activity but returned to norma1levels by 48
hours. Higher OST activity may confer lower efficacy of drugs during acute infection
and inflammation.
v

Table of Contents
Acknowledgments ................................................................................... .iii
Abstract ................................................................................................. v
List of Figures ........................................................................................ ix
List of Abbreviations ................................................................................ xi
Chapter 1: Introduction .............................................................................. 1
Phase I vs. Phase II metabolism ............................................................ 1
UDP glucuronosyltransferases (UOTs) ................................................... 2
Sulfotransferases (SUL Ts) .............•................................................... .4
Olutathione ransferases (OSTs) ............................................................ 6
Immune markers of infection and the acute inflammatory response .................. 8
Interleukin-l beta (IL-lj3) .................................................................. 9
Tumor necrosis factor alpha (1NF-Il) ................................................... 10
Infection, inflammation and drug metabolism ............................................ .11
Effects of infection and inflammation on CYP450-mediated metabolism ......... 12
Effects of infection and inflammation on VOTs ....................................... 14
Effects of inflammation and infection on SULTs ...................................... 16
Effects of inflammation and infection on OSTs ....................................... 18
Effect of reactive oxygen species on Phase II enzymes .............................. 19
Nuclear regulation of Phase II enzyme expression and activity ..................... 21
Importance of human studies and the suitability ofHep02 cells as a model.. ..... 23
Summary ...............•••..••.•.•........•.•..•..••.......••....•••............•.•..•...••• 24
vi

Chapter 2: Materials and Methods ................................................................ 26
Materials .................................................................................... 26
Methods ...................................................................................... 27
HepG2 Cell Culture Treatments ................................................ 27
Preparation of cellular S9 and determination of protein content ............ 27
Standardization of protein concentration ....................................... 27
Biochemical detection of total UGT activity .................................. 28
Biochemical detection of total SULT activity ................................. 28
Biochemical detection of total GST activity ................................... 29
Measurement of cell viability ................................................... 30
Detection of reactive oxygen species ........................................... 30
Immunocytochemical staining for the presence ofUGT, SUL T and
GST isofonns ..................................................................... 30
Irnrnunocytochemicallocalization ofHNFl and HNF4 proteins ........... 3l
Chapter 3: Results ................................................................................... 33
Measurement of cell viability ............................................................ 33
Effects of cytokines on reactive oxygen species ....................................... 37
Biochemical detection of total UGT activity ........................................... 44
Biochemical detection of total SUL T activity .......................................... 50
Biochemical detection of total GST activity ............................................ 54
Irnrnunocytochemicallocalization ofHNFl and HNF4 proteins .................... 57
vii

Chapter 4: Discussion .............................................................................. 60
Suggestions for Further Research ........................................................ 67
Summary .................................................................................... 68
Appendix A: IRB approval ........................................................................ 69
References ............................................................................................ 71
viii

List of Figures
Figure I: MIT assays demonstrate that an increase in cell viability occurs at 12 hours,
thereafter; viability declines ...................................................................... 33
Figure 2: ANOVA performed on MIT assays to see the effect ofIL-If3 over time, show
that changes in cell viability were only significant at 0.1 and I u/mL IL-If3 ............. 34
Figure 3: MIT assays demonstrate that an increase in cell viability occurs at 12
hours, thereafter; viability declines markedly at 24 and 48 hr .............................. .35
Figure 4: ANOV A performed on MIT assays to see the effect of1NF-1l over time,
show that changes in cell viability were significant at all concentrations of1NF-Il.
Since all concentrations were equally significant, this may indicate that cell death is
a function of time rather than 1NF-1l concentration .......................................... 36
Figure 5: Increases in ROS over time when HepG2 cells are treated with IL-If3 .......... 38
Figure 6: Increases in ROS over time when HepG2 cells are treated with IL-I f3 and
analyzed by IL-I f3 time ........................................................................... 39
Figure 7: ROS do not increase over time when HepG2 cells are treated with 1NF-1l .... .41
Figure 8: The lack of increase in ROS measured in HepG2 cells is consistent over time.
Note especially the effects of1NF-1l 10 U/mL ............................................... .42
Figure 9: The lack of increase in ROS measured in HepG2 cells is consistent across all
concentrations ofTNF-Il. Note especially the effects of1NF-1l 10 U/mL ............... .43
Figure 10: Effects of proinflammatory cytokines on UGT activity ........................... 45
Figure 11: The trend of a fall in activity until 12 hours and then rebounding is consistent
throughout and significant at 1.0U/ml for IL-I f3 ............................................. .46
ix

Figure 12: The trend of a fall in activity until 12 hours and then rebounding is consistent
throughout and significant at 1.0U/ml for 1NF -a ............................................ .47
Figure 13: Immunohistochemical detection of the expression ofUGTlA and UGT2B in
Hep G2 cells shows that the isofonns are present and that apoptosis is likely not
occurring (based on cell morphology) ......................................................... .49
Figure 14: Effects of pro inflammatory cytokines on SULT activity ......................... 51
Figure 15: Immunohistochemical detection of the expression ofSULT isoforms in
HepG2 cells ......................................................................................... 53
Figure 16: The proinflammatory cytokine IL-l/3 does not affect GST activity. lNF-a
significantly increases GST activity initially and then levels return to normal by 12
hours ................................................................................................. 55
Figure 17: Immunohistochemical detection of the expression of total GST in HepG2
cells .................................................................................................. 56
Figure 18: Immunohistochemical localization ofHNFI proteins in HepG2 cells ......... 58
Figure 19: Immunohistochemical localization ofHNF4 proteins in HepG2 cells ......... 59
x

Abbreviations
IlMSH
4MU
AIDS
ANOVA
CF
cGST
CYP450
DCF
DCFH-DA
DDT
DHEA
DNA
ElS
EPL
EST
GSH
GST
HIV
HNFl
HNF4
Hr
IFN-y
alpha melanocyte stimulating hormone
4-methylumbelliferone
acquired immunodeficiency syndrome
analysis of variance
cystic fibrosis
cytosolic gluthathione S-transferase
cytochrome P450
dichlorofluorescein
dichlorofluorescein diacetate
dichloro-diphenyl-trichloroethane
dehydroepiandrosterone
deoxyribonucleic acid
estrone sulfate
eicosanoids, prostaglandins, and leukotrienes
estrogen sulfotransferase
glutathione
gluthathione-S-transferase
human immunodeficiency syndrome
hepatic nuclear factor one
hepatic nuclear factor four
hours
interferon-gamma
xi

IFNs
IL-I
IL-IP
IL-2
IL-3
IL-6
LPS
MAPEG
Min
mRNA
MTT
NaOH
NDS
NFICB
NKs
PAPS
PBS-T
PMNs
ROS
SD
STS
interferons
interleukin-one
interleukin-one beta
interleukin-two
interleukin-three
interleukin-six
lipopolysaccharide
membrane associated proteins in eicosanoid and
glutathione metabolism
minutes
messenger ribonucleic acid
3-( 4,S-dimethylthiazol-2-yl)-2,S-diphenyltetrazolium
bromide
sodium hydroxide
normal donkey serum
nuclear factor kappa B
natural killer cells
3'phosphoadenosine S'-phosphosulfate
phosphate buffered saline with Tween-20
polymorphonuclear leukocytes
reactive oxygen species
standard deviation
steroid sulfatase
xii

SULT
TGFf3
TNF-a
U/ml
UDPGA
UGT
vHNF-lC
sulfotransferase
transforming growth factor beta
tumor necrosis factor-alpha
unite per milliliter
uridine diphosphate glucuronic acid
UDP-glucuronosyltransferase
variant hepatic nuclear factor I-e
xiii
Chapter 1: Introduction
This thesis explores the effects of the acute inflammatory response on the major Phase II
metabolizing enzymes uridine diphosphate glucuronosyl transferase (VOT),
su1fotransferase (SUL T) and glutathione transferase (OST). We hypothesize that acute
infection and inflammation affect enzyme expression and activity in the liver.
Additionally, we hypothesize that regulatory co-promoters may playa pivotal role in
altering UOT, SULT and OST expression and activity during acute infection and
inflammation. The implications of this are that during inflammation and acute infection,
phase II metabolism and clearance from the liver may be altered to such an extent that it
may affect the safety and efficacy of some drugs.
Phase I lIS. Phase H meIilbolism
Drug metabolism mechanisms fall into two categories: Phase I and Phase II. Phase I
mechanisms involve structura1 alterations of the drug molecule while Phase II
mechanisms consist of conjugation with another more water-soluble moiety (Benedetti,
2005). The Cytocbromes P450 (CYP450s), one of the most well known and most
important drug metabolizing families, are Phase I enzymes. The UOTs, SUL Ts and OSTs
are the 3 major Phase II enzymes accounting for as much as 90% of drug, chemical,
hormone and dietary detoxification. Phase II reactions, in general, are more difficult to
determine since more than one enzyme is usually involved in the reaction pathway.
Additionally, an intracellular conjugating agent (co-factor) usually needs to be available.
Phase I reactions are responsible for the majority of metabolism in the body (Cassarte and
Doull). In situations where Phase I reactions are down-regulated or suppressed, the
1

concern is that the burden of metabolism now falls onto Phase II reactions. Conversely,
where Phase II reactions are altered (particularly when they are inhibited) clearance of
reactive intermediate metabolites may be impaired resulting in toxic consequences
(Cassaret and Doull).
UDP glucuronosyltransferases (UGTs)
The major function of glucuronidation is to make compounds more soluble and
hydrophilic, allowing them to be detoxified and excreted. Rarely, this process can also
synthesize derivatives that are biologically active and in some cases, demonstrate
increased toxicity. For example benzol a]pyrene is a polycyclic aromatic hydrocarbon
found widely in the environment, including in tobacco smoke (Wells, 2004). It is
eliminated primarily via glucuronidation and when this pathway is blocked or eliminated,
the metabolites are found to bind to both protein and DNA, leading to increased oxidative
DNA damage and micronucleus formation (Wells, 2004). Acetaminophen, the widely
used analgesic drug, is also eliminated primarily by glucuronidation. If glucuronidation
of this substrate is decreased, enhanced CYP450-cataIyzed bioactivation can occur
resulting in enhanced hepatocellular and renaI cellular necrosis (Ouengerich, 2006).
UOTs are the enzymatic catalysts for glucuronidation reactions. They are a family of
enzymes which reside in the endoplasmic reticulum and catalyze the transfer of
glucuronic acid to an electron rich atom on the substrate (typically hydrophobic
chemicals, such as drugs, xenobiotics and products of endogenous catabolism) forming
water soluble conjugates that are excreted in the urine and feces (Wells, 2004; Mackenzie
2003). Additionally, the UOTs are responsible for detoxifYing a vast group of potentially
2

carcinogenic or teratogenic compounds that enter the body through airborne pollutants or
through diet (de Wildt, 1999). Although they are also present and active in the
alimentary tract, lung, brain, skin, prostate and kidneys (Radominska-Pandya, 1999), the
UOT enzymes in the liver are the main source of glucuronidation reactions in the body.
Evidence suggests that of the nearly 50 mammalian UOT isoforms that exist, 12 of which
are expressed in the human liver, although 3 of these have no known physiological or
xenobiotic substrates (Radominska-Pandya, 1999; Levesque,2001). The UOT isoforms
have been separated into two main families: the UOTl and the UOT2. Members of the
UOTlA family are all encoded by a complex gene consisting of 16 exons localized on
chromosome 2 and all share more than 50% sequence identity to one another. Each
UOTl protein is encoded by a transcript that is formed by alternate splicing of the first
exon to a set of 4 downstream exons, designated 2-5. They have variable amino(n}
terminal halves and identical carboxy(c}-terminal halves (Radominska-Pandya, 1999;
Mackenzie,2003). Nomenclature is systematic and numbered with human isoforms
using capital roman letters and other mammalian isoforms using lowercase letters
respectively. For example, UOT1A4 is a human isoform and ugtla12 is a rat isoform
(Mackenzie 1997). Five of these isoforms, UOTlA1, UOTlA3, UOTlA4, UOTlA6 and
UOTlA9 are expressed in the liver and have individual catalytic activity profiles
(Radominska-Pandya, 1999). In contrast, the UOT2 enzymes do not share a common
carboxy-terminal and are encoded by separate genes, clustered on chromosome 4, each
containing 6 exons (Mackenzie, 2003). The UOT2 family is further subdivided into three
groups: 2A, 2B and 2C. UOT2B isoforms are the most abundant and most studied and in
3

the liver they are represented by VOT2B4, V0T2B7, V0T2810, V0T2811, V0T2815,
V0T2817 and V0T2828 (Levesque, 200 I; Mackenzie, 2003). The major endogenous
substrates of the 28 isoforms are steroids and their metabolites and bile acids
(Radominska-Pandya, 1999). VOT2A are only found in the nasal epithelium and are
involved in olfaction (Barbier, 2000) while the VOT2C subfamily currently has only one
representative isolated from a rabbit (Barbier, 2000). As VOT2A and VOT2C are not
involved in metabolism in the liver, they are not subjects of this research and will not be
discussed further.
Sulfotransferases (SULTs)
Sulfotransferase enzymes catalyze the conjugation of sulfate groups onto a wide number
ofxenobiotic and endogenous substrates, including drugs, toxic chemicals, hormones and
neurotransmitters (Kauffman, 2004). The sulfonation pathway involves the transfer of a
sulfonate group from the universal donor 3'-phosphoadenosine 5'-phosphosulfate (PAPS)
to a substrate that possesses an acceptor moiety such as a hydroxyl or amine group
(Coughtrie, 2002). In general, sulfonation causes molecules to lose their biological
activity, but in some circumstances, the addition of a sulfate can lead to highly reactive
intermediates, such as minoxidil, and reactive electrophilic cations like N-hydroxy 2-
acetylaminotluorene (McCall, 1983; Miller 1994). Sulfonation has a major role in
regulating the endocrine system of an individual by modulating receptor activity in
steroid biosynthesis, activity of estrogens and androgens, and metabolism of
catecholamines and iodothyronines (Kauffinan, 2004). Additionally, this pathway is
4

responsible for catecholamine inactivation (BUll, 1981) and is estimated to metabolize as
much as 10% of the dopamine and norepinephrine in the brain (Rivett, 1982).
Sulfonation is also a key response in the body's defense against toxic chemicals and may
playa major role in early development since high levels of SUL Ts have been
documented in the human fetus (Kauffinan, 2004). For example, Barker et at (1994)
found that production ofDHEA sulfate through SULT2AI by the fetal adrenal is
established as a critical step in providing substrate for estrogen biosynthesis by the
placenta during pregnancy.
Cytosolic sulfotransferases have been classified into five families with less than 40%
similarity between them (Kauffinan, 2004). SULTl and SULT2 are the largest families
and sulfonate the largest number of endogenous and foreign compounds. Currently there
are 10 known sulfotransferases in humans and five of these (SULTlAl, SULTlA2,
SULTlA3, SULTlE and SULT2Al) are expressed in the adult liver (Coughtrie, 2002).
Inter-individual variances in the expression of SUL T isoforms have pharmacological and
toxicological significance. For example, SULTlAl, a broad spectrum sulfotransferase,
has been linked with early-onset breast cancer as well as the occurrence of other tumors
in individuals having higher amounts of the enzyme (Seth, 2000). High activity of
SUL Tl A 1 has also been linked with increased risk from dietary constituents, such as the
consumption of charcoaled meats such as may be produced by barbequing (Zheng. 2001;
5

Nowell,2004). A principle pathway for chemical carcinogenesis is through the
fonnation of toxic and reactive sulfuric acid esters, which are then cleaved to generate
sulfate ions and electrophiles that combine with nucleophilic groups in cellular DNA and
proteins (Kauffinan, 2004).
G1Ulllthione trans/erases (GSTs)
Glutathione transferases catalyze the fonnation ofthioether conjugates between
glutathione (GSH) and reactive xenobiotics either by direct addition or through
displacement of an electron-withdrawing group (Lin, 2007). Important substrates include
polycyclic aromatic hydrocarbon epoxides produced from the catalytic actions ofPbase I
CPY450s as well as by-products of oxidative stress (Strange, 2001). There are three
families of GSTs: cytosolic, mitochondrial and microsomal (Hayes, 2005). The
mitochondria, and thus the mitochondrial GSTs, were removed during preparation of the
cellular S9, so they will not be discussed further. Cytosolic GSTs are by far the most
abundant family. In man and other mammalian species, 15-20 different cGST genes have
been identified (Hayes, 2005). In humans, seven distinct gene families encode the
cytosolic GSTs: Mu, Alpha, Theta, Pi, Zeta, Sigma and Chi (Strange, 2001; Hayes,
2005). GSTs are biologically active as dimers and share greater than 40% sequence
identity within a class (Hayes, 2005).
6

The GST pathway is important for the metabolism of exogenous substrates such as drugs,
and important examples include the cancer chemotherapeutic agents andriamycin,
busulfan and chlorambucil, pesticides and herbicides like DDT and atrazine, and
environmental pollutants found in cigarette smoke and exhaust fumes (Hayes, 2005).
Similar to the other phase II enzymes, conjugation with GSH generally leads to the
formation ofless reactive, more readily excreted byproducts. However, in a few
instances, the product is more reactive than the parents compound. Conjugation with the
solvent dichloromethane results in the formation of highly unstable S
chloromethylglutathione, capable of modifying DNA. Conjugation with haloalkenes,
which occurs primarily in the liver, can lead to the generation of reactive byproducts in
the kidney (Hayes, 200 I).
Microsomal GSTs, now designated as membrane-associated proteins in eicosanoid and
glutathione metabolism (MAPEG), are less numerous that cytosolic GSTs and are far less
characterized. Four MAPEG subgroups have been described (I-IV) and six human
MAPEGs have been identified to date (Hayes, 200 I). Most microsomal GST proteins are
involved in the synthesis of eicosanoids, leukotrienes and prostaglandins, catalyzing
GSH-dependent transferase and isomerase reactions (Frova, 2006). This is especially
significant to our work since eicosanoids, leukotrienes and prostaglandins are commonly
involved in inflammatory and pain reactions. These compounds have vast interactive
networks with interleukins, which can influence pro-inflammatory cytokine production
7

and the time-course of physiological inflammation and its consequences. Therefore,
through their synthesis of these compounds, microsomal GSTs may play an important
role in the etiology of infectious and inflammatory morbidity, as well as contributing to
chemical and hormone metabolism and removal.
Immune markers of infection and the acute inflammatory response
The immune response is a complex sequence of events that is triggered by the
introduction of a stimulus and culminates in the elimination of the intrusive agent There
are two stages in the immune response: innate immunity and adaptive immunity. Innate
immunity is present at birth and is characterized by the activation of macrophages,
polymorphonuclear neutrophils (PMNs), eosinophils and Natural Killer (NK) cells
(Goodman, 1991). If the innate immune system fails to clear the foreign agent then the
adaptive immune system comes into play. This system is characterized by the activation
ofT and B cells and by the specificity of the activated cell for the invading antigen. The
adaptive immune system also possesses memory cells that can mount an intensified
attack on repeat invaders.
The inflammatory response, like the immune response, can be activated by cells, such as
neutrophils and macrophages, or by circulating proteins including components of
complement or coagulation (Broide, 2001). The inflammatory response is generated as a
means of defending the body against infection and repairing datnaged tissue. However,
acute or prolonged inflammatory reactions can lead to disease states and morbidities,
8

including further tissue damage that can be detrimental to the host. In order to protect the
host, cellular inflammatory mediators are stored either preformed in cytoplasmic granules
or as phospholipids ready to be generated in the cell surface membrane (Broide, 2001).
Cytokines are mediators of immunologic, inflammatory and reparative host responses to
invasion or injury. Cytokines function as intercellular signals that regulate local and
systemic inflammatory responses (Oppenheim et al,,2001). They work by modulating
the growth, mobility and differentiation ofleukocytes and other cells. Although a battery
of cytokines exist, this thesis will focus on interleukin-l ~ (lL-l~) and tumor necrosis
factor alpha (lNF -a) which are mediators of acute infection and inflammation.
Interleuldn 1 beta (lL-l~)
IL-l is produced by 11 types of cells, namely: macrophages, kemtinocytes, dendritic
cells, astrocytes, microglial cells, normal B lymphocytes, cultured T cell clones,
fibrob1asts, neutrophils, endothelial cells and smooth muscle cells (Oppenheim et al,
2001). Production ofIL-1 is stimulated by diverse adjuvants such as lipopolysaccharide
(LPS), vira1 RNA and bacterial peptidoglycans. It acts on target cells through high
affinity receptors present on the plasma membrane. Activity can be regulated by
endogenous factors that affect cytokine production by modulating either receptor
expression or signal transduction after the signals are triggered (Oppenheim et ai, 2001).
Potent antagonists ofIL-I~ include transforming growth factor ~ (TGF~), corticosteroids
9

and a melanocyte-stimulating hormone (aMSH). Pharmacologic inhibition of IL-l
activity through these antagonists may be useful in controlling some inflammatm"y
reactions (Oppenheim et aI2001).
Injection oflL-1 induces local acute inflammatory responses that begin within 1 hour and
peak within 3-4 hours (Oppenheim et a12001). Initially, neutrophils adhere to
endothelial cells and spread along the blood vessel walls. This is followed by neutrophil
infiltration and edema from the flow of fluids into the tissues. IL-l can also stimulate
other cytokines such as IL-2 which stimulates the proliferation and maturation ofT cells;
the interferons, which induce the expression of major histocompatability complex
proteins in macrophages and activate monocytes and macrophages; 1L-3 which acts on
pluripotent hematopoietic stem cells to promote cell development of granulocytes,
macrophages, and mast cells, and 1L-6 which promotes the proliferation and maturation
ofB cells (Rang, 1995).
Tumor necrosis factor alpha (TNF-a)
lNF-a is a pleiotropic cytokine that can induce proliferation, apoptosis, or inflammatory
reactions in target cells. These different cellular reactions depend on the activation of
distinct cellular signaling pathways that interact with each other through complex
signaling networks, allowing for a wide range of cellular responses (Baud, 2001). lNF-a
is a known activator of the apoptotic signaling cascade, but does not commonly induce
10

apoptosis in target cells due to the parallel activation of protective signaling pathways
that interfere with the onset of apoptosis (Schwabe, 2002). TNF-a is also known to
strongly activate the nuclear factor-KB pathway which prevents hepatocytes from
undergoing TNF-a induced apoptosis during development, liver regeneration and other
conditions associated with high levels ofTNF-a (Scwabe, 2002).
TNF-a is produced by activated macrophages, lymphocytes and NK cells and has a broad
spectrum of biologic actions on target cells. Although the high-affinity receptors for IL-I
and TNF are unrelated structurally, they possess a high degree of overlap in terms of their
immunologic and nonimmunologic activities. For example, both act to enhance IL-2
receptor expression in T lymphocytes as well as inducing lymphokine expression in these
cells, and both are known to enhance antibody production in B lymphocytes and promote
B cell proliferation (Oppenheim et ai, 2001). In vivo, however, 1NF is known to have
more potent effects on neutrophils, monocytes and endothelial cells and at higher
concentrations (1000 VIm!) are chemotactic for neutrophils, activating neutrophil
respiratory burst and degranulation (Oppenheim et ai, 2001). Both IL-l and TNF can
cause monocytes to produce inflammatory mediators such as prostaglandins and IL-6
(Oppenheim et ai, 2001). Both are also known to increase the adhesiveness of
endothelial cells by inducing the expression of cell-adhesion molecules.
Infedion, injlammation and drug metabolism
Infection and inflammatory reactions induce alterations in hepatic drug metabolism that
may also cause significant increases or decreases in drug efficacy and toxicity. Because
11

little is known about the effects of infection and inflammation on Phase II metabolizing
enzymes in human livers, cytokine effects on CYP450s can be used as an indication of
potential consequences for cytokine effects on Phase II enzymes. The CYP450s share
many similarities with UOTs, SULTs and OSTs including broad substrate specificity and
the ability to catalyze metabolism of a variety of endogenous and exogenous substrates
(Cassaret and Doull). The expression and metabolism in liver and extrahepatic tissues of
the CYP450s can be significantly down-regulated during inflammation and it is likely
that hepatic phase IT metabolism is similarly affected. Alterations of Phase IT metabolism
could be important becanse it may change drug efficacy or enhance toxicity in patients
that have infectious disease and/or are experiencing an inflammatory response (Morgan,
2006).
Effects o/ln/ection and lnjlammotion on CYP450-mediated metabolism
As mentioned above. bacterial infections and/or inflammation have been shown to
suppress hepatic and extrahepatic CYP450 expression and activity (Richardson, 2006;
Morgan 2001; Renton, 2004). Work done by Richardson and Morgan (2005)
demonstrated that administration of LPS significantly decreased the hepatic expression of
CYP1A2, 2AS, 2C29, 2EI, 3A11, 4A10 and 4A14 mRNAs and proteins in mice.
Richardson et al. used bacterial infection of Citrobacter rodentium in mice to study the
effects on CYP450s. They found that C. rodentium infection down-regulated CYP4A10
and 4A14 mRNAs to 4% of the control. CYP3A11 was down-regulated to 16% of the
control, and CYP2C29, 4F14, and 4Fl5 exhibited 50%,55% and 45% reductions,
12

respectively. Protein expression was likewise reduced in CYP4A mice to 6% and 18% of
the control (Richardson, 2006).
Cytokines have also shown to play an important role in CYP450 drug metabolism during
inflammation and infection, when the levels of cytokines are dramatically increased.
Again, in Richardson's study of bacterial infection in mice. hepatic mRNA levels ofin
IL-l/3. interleukin-6 (1L-6) and TNF- increased significantly above control (Richardson,
2006.) Raised levels ofTNF-a. IL-Ia, IL-6 and interferons (IFNs), have been shown to
depress CYP450 mRNA levels and enzyme synthesis. Monshouwer's study (1996) in
pig hepatocytes showed that these pro-inflammatory cytokines inhibited CYCYP450
activities up to 41 % (Monshouwer. 1996). There are three proposed mechanisms by
which cytokines alter CYP450 gene expression; the destruction of the enzyme by a free
radical (parent, 1992). the inhibition of translation of CYP450 mRNA and reduction in
CYP450 mRNA levels (Renton, 1990). and most recently is has been proposed that
suppression of CYP450 activity is be mediated by nitric oxide (Stadler. 1994.) The
suppression ofCYP450s by nitric oxide is controversial (Monshouwer, 1996).
Cytokines may also control regulation ofCYP450s at the genetic level. Morgan et al.
(2002) have found that the Cyp2C II promoter contains a NF-KB response element that
allows down-regulation of the CYP gene by cytokines up to 60% of control. It was
presumed that the binding ofNF-KB inhibits transcription initiation (Morgan, 2002).
Another regulator is the transcription factor is hepatic nuclear factor-I (HNF -1), which is
known to be involved in the regulation of CYP27, that converts cholesterol to 27
13

hydrocholesterol. During infection, LPS decreases the binding ofHNF-l in nuclear
extracts, suggesting that the CYP27 promoter region is compromised (Renton, 2004). It
is known that HNF-l expression can be dependent on HNF-4 co-expression and both are
decreased in response to LPS in rats, therefore; it was suggested that the loss ofCYP450
in the liver caused by LPS was due to nitrosylation of the HNF-4 binding domain causing
down-regulation ofCYP450 transcription (Renton, 2004.) These results provide an
interesting frame of reference for studying the effects of pro-inflammatory cytokines on
Phase II metabolizing enzymes. Furthermore, they provide possible avenues of
investigation to study the mechanisms by which enzyme activities are up- or down
regulated by pro-inflammatory cytokines; namely through the nuclear transcription
factors.
Effects of infection and inflammation on UGTs
Although CYP450s provide a good model to begin from, the focus of these studies is the
regulation of Phase II enzymes during inflammation and infection, which are far less well
characterized. Most of the studies have been performed in animals and utilized injection
of lipopolysaccharide (LPS) as a model of inflammation. Chen et al (1995) found that
LPS administration to rat hepatocytes resulted in up to -80% decrease in UOT activity,
while Morgan et al (2006) have shown that LPS administration to mice reduced hepatic
mRNAs for UOTlAl, UOTIA9 and UOTIB5 by approximately 40 % compared to
control (untreated) mice and significantly down-regulated hepatic UOTlA and UOTIB
14

proteins by up to 60% of control. The difference between the -40% change in mRNA
and 60% change in protein levels is further indication of the importance of studying
metabolizing enzymes at the protein/activity levels since, due to post-transcriptional and
post-translational changes, alterations in mRNA message are rarely reflective of
functional modification of enzyme activities.
Other studies using rats, with turpentine injection as a model of inflammation found that
the UOT activity towards testosterone was significantly reduced to 65% of control along
with a concurrent decrease in UOT mRNA levels (Strasser, 1998). This was consistent
with studies in primary rat hepatocytes exposed to cytokines as a model of the
inflammatory response (Strasser, 1998).
The effects on hepatic UOTs during inflammation are thought to be cytokine dependent,
similar to CYP450 suppression after LPS administration. In Morgan's experiments with
mice (discussed above), both LPS and Citrobacter rodentium infection increased hepatic
expression ofIL-l~, IL-6 and TNF-a (Morgan. 2006). This was confirmed by Strasser's
experiments, where exposure ofhepatocytes to IL-l~ caused no significant changes in
UOTlAI or U0T2B3 mRNA levels, but administration ofIL-6 significantly suppressed
both isozymes (Strasser, 1998). Similar effects were reported by Monshouwer et al
(1996) using pig hepatocytes which showed that TNF-a, IL-l a, IFN-y and IL-6 all
inhibit glucuronidation, but that different cytokines affected different UOT iso-enzymes
to smaller and greater capacities.
15

Time dependency for the effects on UGT expression and activity was observed for IL-6
but not IL-1a. and lNF -a. which could mean that the latter two act via different
mechanisms (Monshouwer, 1996). Alternatively, IL-Ia. and lNF-a. could be degraded
more rapidly in culture than IL-6, allowing for recovery in the hepatocytes. Alternatively
decreases in glucuronidation caused by cytokines may be through by a lack of the UGT
cofactor, UDP glucuronic acid (Monshouwer, 1996). This work gives insight into
cytokine effects on UGT activity in pigs which may translate to human effects. For
example, porcine IL-1 a. is about 80% simiIar to human IL-1a. and monoclonal antibodies
to human lNF-a. cross-react with porcine TNF-a.. However, important discrepancies
exist between human and pig Phase II metabolism, including that porcine hepatocytes are
unable to form sulfate conjugates of I-naphthol and paracetamol (Monshouwer, 1996).
This makes our aim to characterize the expression and secretion of pro-inflammatory
cytokines in human liver cells during inflammation and acute infection and their relation
to UGT expression and activity all the more important.
Effects ofin.flamrtudion and infection on SULTs
Little work has been done on the effects of inflammation and infection on SUL T enzymes
in the liver. To date, research has focused on gastrointestinaI, neuronal, bronchial and
cardiovascular expression of these enzymes. Davies et 01 (2004) cultured neuronal and
gastrointestinaI cell lines with varying concentrations oflNF-a. and TGF-~ and found
that the cytokines had relatively little effect on the neuronal cell line, but in the
gastrointestinaI cell line, TNF-a. increased activity of SUL T1 Al and SUL T1 A3 while
16

TGF-(3 decreased the activity of these SULTs. These results were significant because
when diet-derived heterocyclic amines become bioactivated by sulfonation, they produce
carcinogenic metabolites that may be a factor in the increased incidence of colorectal
cancer in patients with inflammatory bowel disease.
Delmotte et al (2002) studied the effects ofTNF-a on human bronchial mucosa where
the cytokine is an important determinant in airway mucosa inflammation. It acts as an
initial inflammatory cytokine that subsequently regulates both early neutrophil infiltraion
and eosinophil recruitment into the lung and airspace (Lukacs, 1995). When TNF -a was
applied to bronchial microsomes, elevated levels of galactose 3-0-sulfotransferase and
N-acetylglucosamine 6-0-su1fotransferase were found. This is significant because this
may increase the synthesis of epitopes on airway mucins, allowing the attachment of
leukocytes to the mucus film which covers the airway lumen. These epitopes are largely
expressed on cystic fibrosis mucins and are also possible sites of attachment for
Pseudomonas aeruginosa, a frequent colonizer in the lungs of CF patients. Therefore, if
TNF-a upregulate the synthesis of these epitopes, this may be contributing to the
chronicity of airway infections in CF patients as well as other chronic bronchial diseases
that involve severe inflammation (Delmotte, 2002).
The effects of 11-1(3 on SUL Ts in estrogen metabolism were also studies by Nakamura et
al (2003). Specifically they assessed estrone sulfate (EIS), a major circulating plasma
estrogen that is converted into the biologically active estrogen and estrone, by steroid
sulfatase (STS) and estrogen sulfotransferase (EST). Their study found 11-1(3 markedly
17

inhibited the expression of STS mRNA and enzyme activity, but stimulated the
expression of EST mRNA and enzyme activity. Since IL-l13 is known to be expressed in
atherosclerotic lesions, researchers believe that the expressions levels of both STS and
EST mRNA and activity levels may be significantly associated with the degree of
atherosclerotic changes in the female aorta (Nakamura, 2003).
Effects of inflammation and infection on GSTs
Glutathione transferases are of interest to pharmacologists and toxicologists becanse they
provide targets for antiasthmatic and antitumor drug therapies (Hayes, 2005).
Additionally, research has been conducted on the effects of cytokines in animal
hepatocytes, but little has been done in human hepatocytes. Maheo et al (1997) treated
rat hepatocytes with IL-l13 and found OST activity levels to decrease to 50-60% of the
control levels. OST mRNA were also found to be downregulated in the subunit rGSTPI
after 24 hours and similar effects were seen at the protein level. Further research found
that the decrease in mRNA was due to mRNA destabilization which demonstrated that
IL-l regulates some major OST subunits in hepatocytes through a post-transcriptional
mechanism (Maeho, 1997).
Cytokines are known to affect cells differently during acute and chronic infections.
Desmots et al (2002) used cytokines TNF-a and IL-6 in murine hepatocytes and studied
18

their effects during liver regeneration. They found that introduction of these cytokines
positively regulated mGSTA4 via survival signaling pathways and that during
regeneration, several GST isoforms, including mGSTAI and Pi, are induced by these
cytokines.
Characterizing the expression and secretion of cytokines in human liver cells during
inflammation and acute infection and their subsequent effect on UGT, SUL T and GST
activity and protein levels is important to understand events occurring in the liver during
inflammation and infection. It may also provide insight into the metabolic capacity of the
liver during chronic infection, where increased cytokine expression and altered UGT
mRNA levels are not present. Congiu et al. compared mRNA levels from all UGT
isoforms in human livers from patients with inflammation and compared these to UGT
mRNA expression in patients with chronic liver fibrosis (Congiu 2002). Reduction in
UGT mRNA levels was associated with the degree of inflammation, but the authors
reported no correlation ofUGT mRNA with the level of fibrosis. Previous to this, studies
had indicated that levels ofUGT enzymes are maintained or elevated in human and
animal models of cirrhosis, thereby correlating with Congiu's findings (Congiu et al
2002, Debinsky, 1995).
Effect of reactive oxygen species on Phase II enq1lU!S
Molecular oxygen is the premier biological electron acceptor and serves vital roles in
multiple fundamental cellular processes (Scana1ios, 2005). However, using oxygen
produces reactive oxygen species (ROS) such as superoxide, hydrogen peroxide, and
19

hydroxyl radicals. ROS can cause serious damage in aerobic cells by oxidizing lipids,
proteins and DNA and can even cause cell death. To combat these ROS, organisms have
evolved antioxidant defenses such as cataiases, peroxidases, superoxide dismutases, and
GSTs (Scandalios, 2005). The GSTs reduce phospholipids, fatty acid and cholesteryl
hydroperoxides, curtailing the formation of downstream epoxides and reactive carbonyls
(Hayes, 2005). GST accomplishes this by conjugating these compounds with the co
factor glutathione (GSH). This is significant because depletion of GSH decreases GST
activity levels, preventing the metabolism of the ROS. Additionally, lower GSH levels
conferring lower GST activities also enhances renal and hepatotoxicity caused by
acetaminophen, impairs survival in HIV diseases and has been clinically correlated with
a number of human diseases including Alzheimer's, cancer, Parkinson's, cirrhosis. heart
attack, stroke, diabetes ad infections caused by HIV and AIDS (Lin, 2007).
ROS have been also shown to activate immediate early genes such as NFKB and the jun
Kinase pathway (JNK, Davis 2001). Classically, ROS activation of these genes and
pathways has been demonstrated to be involved in apoptotic cell death and inappropriate
proliferation that can lead to tissue necrosis and cancer respectively (Wang and Davis
2001). The depletion of GSH is believed to playa key role in the overproduction and
prolonged action ofROS which tends towards the apoptotic pathway. Therefore,
depletion of GSH and lowered GST activities may be responsible for tissue necrosis. In
our studies, such a finding would be interesting, since it may imply a mechanism for liver
failure caused by excessive inflammation or infection.
20

Nuclear regulation of Phase II enr,yme expression and activity
Other than cytokine effects on protein synthesis, alterations in phase II enzyme
expression and activity may occur through innate regulation of transcription by conserved
sequences in the gene promoter regions. Inter-individual differences in expression of
these phase II enzymes may contribute to an individual's response to pharmaceuticals and
even possibly predisposition to cancer if exposed to a carcinogenic agent. Thus it is
desirable to understand the mechanisms that drive transcription and attempt to determine
the cause for their variable expression. Hepatocyte nuclear factor 1 (HNFl) is an
important regulator of expression in UGT, SUL T and GST in the liver (Wells, 2004).
Deletion ofHNFl is lethal and a mutation of the HNFl gene causes hyperbilirubinemia
caused by inactivity ofUGT enzymes and the inability to metabolize and excrete
bilirubin (Usui, 2006). In the extreme this can lead to jaundice bilirubin accumulation in
the ventricles of the brain, brain damage and/or death. The co-promoter HNFl is highly
dependent on the expression ofHNF4 and, critically; this has been demonstrated to
affect CYP450 metabolism through transcriptional regulation (Renton, 2004).
The presence of the HNFl site is essential for expression ofUGTIB7 and UGTIB17 in
the liver (Gregory, 2002) and the HNFl site is conserved in sequence in location in
UGTIB4, UGTIB10, UGTIBll, and UGTIB15. HNFla is a homeodomain-containing
protein that forms homodimers, or heterodimers with HNFI /3, and regulates transcription
of liver and extrahepatic genes through a DNA binding site (Gregory, 2002). Gardner
Stephen and Mackenzie have also demonstrated that UGTlAJ, lA4 and lAS dependant
on HNFla in the proximal promoters of these UGTs. Additionally. mutation of the
21

HNFI binding site in UGTlA3 promoter abolished promoter function (and thus
transcription) in all cell types (Gardner-Stephen and Mackenzie, 2007). Furthermore, it
has been shown that induction ofUGTlAI is not dependent on the elevation ofHNFI
levels, but on nuclear glucocorticoid receptors that can induce UGTlAI expression
through intracellular signaling with the HNFI site (Usui, 2006). HNFla has also been
shown to be an important factor in expression ofUGT2B7 (Kamataki 2002). Kamataki
et al (2002) showed that UGT2B7 expression was determined by HNFla with the
amount ofmRNAs expressed for UGT2B7 being comparable to that ofHNFla. This
suggests that HNFla is a limiting factor for the expression ofUGT2B7 and may be a
causal factor for differential expression in individual human livers (Kamataki, 2002).
Similar to UGT, several studies have identified a role for HNFI in GSTA regulation. For
example, Whalen et al (2004) found that reduction ofHNFI in GSTA2levels during the
acute phase response where mediated by HNFI. Klone et al (1990) found that decreased
GSTA2 expressions is human renal cell carcinomas is associated with reduced levels of
HNFl. Additionally, it has been demonstrated that when IL-lf3 was introduced to Caco-2
cells, reduced GSTAI mRNA levels were seen at all stages, but HNFI mRNA levels
were unaltered (Ng, 2007). It was determined that IL-lf3 repressed GSTAI
transcriptional activity and similar results were reported in HT -29 and HepG2 cells. The
mechanism for this appears to be through the involvement of the transdominant repressor
C isoform of variant HNFI (vHNF-l C) (Ng,2007). Other work performed in this area
found that ceramide. a key regulator of apoptotic death, inhibits in GST gene
transactivation through decreases in nuclear HNFI (park, 2004).
22
Imporlllnce of human studies and the suitability of HepG2 cells as a model
It is of major importance that little work on Phase II enzyme expression has been
performed in humans. The majority ofVOT studies to date have focused on rat
hepatocytes (Strasser, 1998), mouse hepatocytes (Banhegyi, 1995; Morgan, 2006) or pig
hepatocytes (Monshouwer, 1996). Clearly, other species are easier to manipulate
(rodents) or may be more readily available, however; although metabolic activities of
these laboratory animals may be similarly affected by cytokines, marked differences are
observed in their ability to suppress or induce enzyme activities and in their time
dependency (Monshouwer, 1996). Additionally, human cytokines vary in their similarity
to other mammalian cytokines. In the case of pigs, IL-l a is about 80% similar to human
IL-l a (Monshouwer, 1996). Work performed on SUL T and GST enzymes has focused
mainly on steroidogenic cell lines such as testis, breast and placenta (SUL n or
neurological cell lines (glia, neurons; GSn and little is known about their effects in
human hepatocytes. Likewise, study has been performed in primary human tumor tissues
for all three enzymes, but little has been done for primary normal human tissues,
especially the important sites of metabolism such as the liver, kidney and, to a lesser
extent, intestine.
The HepG2 cell line is an appropriate model for these experiments due to the fact that it
is a liver cell line that expresses all of the human Phase II enzymes. This model also
offers additional benefits due to the availability of cell: several experiments can be
performed multiple times without the difficulties that come with obtaining human tissues.
23

This model also allows us to avoid any problems that may occur from in vivo studies such
as metabolites being transformed via an alternate pathway (phase I). These
circumstances will result in more accurate and more reliable data. The drawbacks of
using a cell line as opposed to actual human tissue or performing in vivo studies include
the lack of other cell types normally present in the body that may alter the response as in
the case of the combination of lymphoid tissue response and organ-level tissue response,
or the lack of complexity in a cell line compared to a human subject, and even the
artificiality of the cell line: alterations may have occurred when it was transformed
creating an abnormal karyotype. However, on the balance off actors, Hep02 cells are
clearly superior to an animal cell lines to their direct human derivation and may be
superior to primary animal cells and in vivo animal studies due to their direct reflection of
human enzymes and pathways, not homologues.
Sumnuuy
It is of great importance to understand the regulation of phase II enzymes during infection
and inflammation. In situations where expression of enzymes is depressed, the
metabolism and clearance of drugs and xenobiotics may be severely decreased.
Alternatively, carcinogenic compounds and/or reactive intermediate metabolites (for
example from Phase I metabolism) could accumulate, leading to toxic consequences such
as DNA damage or oxidative stress.
24

However, if the enzymes can be induced during infection and inflammation, higher rates
of drug metabolism and clearance would occur. This could prevent drugs from having
their intended therapeutic effects since the concentration in the body will not be high
enough.
We propose to study phase II enzyme expression in the liver by investigating UGT,
SULT and GST enzyme activity during acute infection and inflammation. Our specific
aims are to use individual cytokines 1NF -a and IL-l a as a model of acute infection and
inflammation to: study the subsequent effects on pro-inflammatory cytokine expression
and secretion in the human liver cell line HepG2; to study the effects on UGT, SULT and
GST expression and activity in the human liver cell line HepG2, and to study the effects
on regulatory co-promoters HNFl and HNF4 to see if this is a mechanism for altering
UGT, SULT and GST expression and activity.
25

Chapter 2: Materials and Methods
Materials
l-chloro-2,4-dinitro benzene, 2', 7' -dichlorofluoresceine diacetate, 2', 7'
dichlorofluoresceine, 4-methylumbelliferone sodium salt (4MU), 4-methylumbelliferone
glucuronide (4MUG), 4-nitorphenol, alamethicin (from trichoderma viridae), p
glucuronidase (from E. coli), glutathione, MgCh, sacchrolactone, Tris-HCl and uridine
diphosphoglucuronic acid (UDPGA) were purchased from Sigma Chemical Company (St
Louis, MO). The co-factor 3'phosphoadenopsine-5'-phosphosulfate (PAPS) was from
EMD biosciences (San Diego CA). Glutamine, HamsF12 media 3-(4,5-Dimethylthiazol-
2-yl)-2,5-diphenyltetrazolium bromide (MTT reagent) and Vectashield with propidium
iodide were purchased from Van Waters (vWR. West Chester, PA),
penicillin/streptomycin and fetal bovine serum (FBS) were purchased from Invitrogen
(La Jolla, CA) , Primary antibodies to UGTlA, UGT2B, HNFla and HNF4 were
purchased from Santa Cruz Biotechnologies (Satna Cruz, CA) while primary antibodies
to SULTIA1, lA3 and 2Bl and total GST were from Abnova.com (Taipei City, Taiwan)
Secondary donkey a rabbit-biotin, donkey a goat-biotin and donkey a mouse-biotin as
well as normal sera were obtained from Jackson Immunolabs (West Grove, PA).
Streptavidin-FITC was from GE Hea1thcare (piscataway, NJ). All other salts, solvents
and chemicals were of analytical grade or higher.
26

Methods
HepG2 Cell Culture Treatments
HepG2 cells were cultured in DMEM media with 10% fetal bovine serwn, 2%
penicillin/streptomycin, and 2% glutamine. They were maintained in a humidified
atmosphere of95% air, 5% C~. Cells were mycoplasma free as detennined by routine
testing in our laboratory using Hoescht 33342. HepG2 cells were seeded at a density of
100,000 ce1lsff-75 flask and cultured for 5 days until confluent then treated with lNFa
or IL-l p for 0, 2, 4, 8, 12, 24 and 48 hours at concentrations of 1000, 100, 10, 1.0, 0.1
and 0 U/ml.
Preparation of cellulur S9 and determination of protein content
Cells were harvested by trypsinization (0.05%), centrifuged and re-suspended in 200 !JL
Tris-HCI pH 7.4 containing 5 mM MgCh. The cell suspension was sonicated for 30
seconds, vortexed, then centrifuged at 10,000 x g for 20 minutes at 4°C. The resulting
supernatant (S9) was removed and frozen at -80°C until use.
Standtudirotion of protein concentration
Protein content of samples was performed according to published biochemical methods
(Smith, 1985). Briefly, 10 !JL of protein at the native concentration was added to a clear
microplate and then 90 ILL ofO.! M NaOH was added. Equal volume ofbicinchoninic
acid solution was then added and plate was allowed to incubate at room temperature for
27

15 minutes on a belly rocker. Absorbance was then read at 562 run. Values were them
compared to a standard curve and all concentrations were standardized to 0.25 mgfml of
protein for all subsequent assays.
Biochemical detection orto(qJ UGT activltv
Detection of total UGT activity was performed using a fluorescent assay with the
universal substrate 4-methyl umbelliferone as previously described (Collier et aI2000).
Briefly, cellular S9 (10 j.LL at 0.25 mgfmL), 0.1 M Tris-HCl pH 7.4 containing MgCh
(69.5 J.!.L at 5 mM), alametbicin (0.5 J.!.L, final concentration 50 I1gfmg protein) and 4MU
(10 J.!.L, final concentration 100 11M) were added to a microplate on ice. The plate was
warmed to 37°C for 2 minutes then UDPGA (10j.LL, final concentration 5 mM) added
and the microplate returned to the Fluorescence Reader (Gemini XS. Molecular Devices,
Sunnyvale CAl. Fluorescence was monitored at 355 run excitation and 460 run emission
wavelengths. Metabolism was assessed by substrate depletion (fall in fluorescence) over
10 minutes where initial rate of reaction (loss of less than 10% initial product) and
transformed to a rate ofrunollminlmg protein using a standard curve of 4MU (n = 7,
average r =0.9984). Experiments were performed on 3 separate occasions and each
aliquot was assessed in triplicate for separate HepG2 treatments.
Biochemical detection ortotal SULT activity
Detection of total SULT activity was assessed spectrophotometrically by a decrease in
the color of the parent product (Mulder et aI, 1975). The assay proceeded as follows:
Cellular S9 (30J.!.L at 0.25 mgfmL), 50 mM potassium phosphate buffer containing 5 mM
28

MgCh (210 ,..L),p-nitrophenol (30f.tL, final concentration 400 f,lM) and PAPS (30,..L,
final concentration 60 f,lM) were added to an eppendorf tube and incubated in a water
bath at 37°C for 20 minutes. The reaction was terminated and developed by the addition
of an equal volume of I M NaOH. Then 3 aliquots were transferred to a microplate and
absorbance read once at 400 run. Quantitation is by a comparison to a standard curve of
4-NP prepared in I M NaOH and is through depletion of absorbance (n=3, average r =0.9998). Under these conditions, the assay detects the combined activity of SULTl AI,
IA3, lBl, lEI and 2AI although SULTlAI and SULT IBI may show substrate
inhibition with such high levels of 4-NP (Tabrett and Coughtrie 2003).
Biochemkal detection of total GST activitv
Detection of total GST activity was assessed spectrophotometrically (Gonzalez et ai,
1989). The assay proceeded as follows: Cellular S9 (0.25 mglmL), 0.1 M potassium
phosphate buffer pH 6.5 (79,..L), and glutathione (10 ,..L, final concentration I mM) were
added to a microplate and warmed for 2 minutes. The substrate 1-chloro-2,4-dinitro
benzene (CDNB, I ,..L at 0.5 mM final concentration) was added and the reaction is
monitored every 10 seconds for 20 minutes at 340 run. Specific activity is calculated
using e=9.6 mMlcm2 (Habig, Pabst and Jakoby 1974)
29

Measurement of cell viability
HepG2 cells were plated in a clear microplate at a density of 10,000 cells per well and
left to adhere overnight. Cells were then treated with TNFa or IL1~ (1000, 100, 10, 1.0,
0.1,0 U/mL) for 2-48 hours. At each time point, the cells were removed from the
incubator and 2 ilL ofMTI reagent (10 mM) was added., then cells returned to the
incubator. After 4 hours the cells were removed., the media and MTI reagent were
aspirated, and 200 ilL of 10% SDS solution were added to each well. Cells were then
returned to the incubator overnight and then the optical density assessed at 595 nm.
Results were calculated as percent of the zero dose control.
Derectipn of reactive oxygen species
HepG2 cells were plated in a clear microplate at a density of 10,000 cells per well and
left to adhere overnight. Cells were then treated with TNFa or IL1~ (1000, 100, 10, 1.0,
0.1,0 U/mL) for 2-48 hours. At each timepoint, media was removed and fresh media
containing 5 ).1M diclorofluorescene diacetate was added fluorescence was read every 30
seconds at 485 and 535 nm. Values were then compared to a standard curve of
dichlorofluorescene.
Immunocvtochemical staining lOr the presence of UGT. SULT and GST isolOnns
HepG2 cells were cultured on sterile glass coversJips in 10 em dishes. When confluent,
cells were treated with TNFa or IL-1~ (lOOu/mL) 24 hours. Subsequently, culture media
was removed and cells were fixed by addition of 1: 1 acetone-methanol fixative for 2
minutes. The fixative was then removed and discarded and PBS added. Cells were
30

stored at 4°C until immunocytochemistry was performed. After fixing, PBS was
removed and 200lllslide ofbiotinylated primary antisera (1:50 concentration for UGTlA
and UGT2B, 1:100 for SULTlAI, lA3, 2Bl and pan-specific GST antibodies) diluted in
wash buffer (PBS-T) with 5% normal donkey serum (NDS) was added and incubated at
room temperature for 1 hour. After incubation, antiserum was removed and wash
solution added gently to avoid dislodging the cells from the slide. This was performed
three times, then 200 j.ll/slide of secondary antisera (1 :500 donkey a rabbit-biotin for
UGTlA and GST, donkey a goat-biotin for UGT2B, donkey a mouse-biotin for all
SUL T enzymes) diluted in wash buffer (PBS-T) with 5% NDS was added and incubated
at room temperature for 1 hour. After incubation, the cells were again washed in wash
buffer three times and then streptavidin-fitc complex diluted 1 :500 in wash buffer was
added and incubated for 15 minutes in the dark. Subsequently cells were washed (1 time
for 10 minutes) and then allowed to dry. Coverslips were then affixed to slides using
Vectashield mounting medium containing prodidium iodide. Photomicrographs were
taken with an Zeiss Axiovert 200 M fluorescence microscope using 63X oil immersion.
Immunocvtochemicallocalization ofHNFl and HNF4 proteins
HepG2 cells were cultured on sterile glass coverslips in 10 cm dishes. When confluent,
cells were treated with TNFa or IL-lf:! (100UlmL) for 0,15,30 and 60 minutes.
Subsequently, culture media was removed and cells were fixed by addition of 1:1
acetone-methanol fixative for 2 minutes. The fixative was then removed and discarded
and PBS added. Cells were stored at 4°C until immunocytochemistry was performed.
After fixing, PBS was removed and 200 IIIslide ofbiotinylated primary antisera (1 :50
31

concentration for HNF I and HNF4) diluted in wash buffer (PBS-T) with 5% normal
donkey serum (NDS) was added and incubated at room temperature for I hour. After
incubation, antiserum was removed and wash solution added gently to avoid dislodging
the cells from the slide. This was performed three times, then 200 jJl/slide of secondary
antisera biotin (I :500 donkey (l rabbit-biotin) diluted in wash buffer (PBS-T) with 5%
NOS was added and incubated at room temperature for I hour. After incubation, the
cells were again washed in wash buffer three times and then streptavidin-fitc complex
diluted I :500 in wash buffer was added and incubated for 15 minutes in the dark.
Subsequently cells were washed (I time for 10 minutes) and then allowed to dry.
Coverslips were then affixed to slides using Vectashield mounting medium with
prodidium iodide. Photomicrographs were taken with an Zeiss Axiovert 200 M
fluorescence microscope using 63X oil immersion.
32

Chapter 3: Results
Measuremeflt of cell viability
Results were compared to internal controls meaning cel ls were grown for an equivalent
amount of time as treated cells, but controls remained untreated . Thus, any increase or
decrease seen in treated cells is reflective of the effects of the cytokine. When cells were
treated with 1L- I~, the results showed a nearly twofold increase in cell viability at 12
hours, compared to the zero dose control. After 12 hours, the viability began to decl ine
(Figure I). One-way ANOV As, used to see if time was the cause of cell death, showed
that between the 6 and 12 hour timepoints, for 1.0 VIm! and 0.1 Vlml, cell viability was
significant (P < 0.05, Figure 2). ANOVA analysis also demonstrated that, for each time
point, viability did not change when increasing amounts of 1L-I ~ were administered.
Together, these data indicate that viability of the HepG2 cell s was time-dependent but not
1L-I ~-concentration dependent so this means that the cells are growing over time but not
proliferating due to 1L-I ~ effects.
e 200
<: .3 150
e ~ 100
:l: 8 50 ';I!
ILlS
Concentration
_ 2 Hour 6 Hour
c::::l , 2 Hour
c::::l 24 Hour EmlI 48 Hour
Figure 1: MTT assays demonstrate that an increase in cell viability occurs at 12
hours, thereafter; viability declines. Results were calculated as percent of the zero dose
control. Bars are means of 3 separate experiments, performed in triplicate ± SD.
33

ANOVA for IL·18
IL1B MTT 1000U/ml
Time (in hours)
ILl B MTT 10U/ml
Time (in hours)
~ o u
" .. o c e ~
'"
IL 1B MTT O.lU/ml
Time {in hours}
IL 1B MTT 100Ulml
Time (in hours)
1L1 B MTT 1.0U/ml
Time (in hours)
Tp<O.05
l ANOVA
Tp <O.05
lANOVA
Figure 2: ANOVA performed on MTT assays to see the effect of IL-l~ over time,
show that changes in cell viability were only significant at 0.1 and 1 U/mL lL-l~.
Results were calculated as percent of the zero dose conlTol. Bars are means of 3 separate
experiments, performed in triplicate ± SD.
34

When cells were treated with TNF-a, an increase is also observed at 12 hours. However a
sharp decrease in viability is observed at 24 hours followed by recover at 48 hours
(Figure 3). When the graphs were statistically analyzed using one-way A OVAs to see if
variations in time were significantly different, for all concentrations, the decrease in cell
growth from the 12 to 24 hour timepoints was statistically significant (P < 0.0 I, Figure
4). ANOVA analysis also demonstrated that, at each time point, there were no significant
differences in viability caused by the increasing amounts ofTNF-a administered.
Together, these data indicate that viability of the HepG2 cells was time-dependent but not
TNF-a-concentration dependent since the pattern of cell death was consistent across all
doses ofTNF-a . Alternatively, it could be that even as low as 0.1 U/mL, TNF-a is a
potent pro-apoptotic agent that takes 24 hr to manifest.
TN Fa
200
"0 _ 2 Hour ~ -g 150 6 Hour u c:::J 12 Hour .. ~ 100 c:::J 24 Hour c 0 ~48Hour ~
50 .. N ~ •
0 .1 1 10 100 1000
Concentration
Figure 3: MTT assays demonstrate that an increase in cell viability occurs at 12
hours, thereafter ; viability declines markedly at 24 and 48 hr. Results were
calculated as percent of the zero dose control. Bars are means of 3 separate experiments,
performed in triplicate ± SO.
35

ANOVA for TNFa
TNFa MIT 1000U/mJ TNFa MTT 100U/ml
200 20.
2 } ""' 2 t ""' .:l .... .:l ....
Time (in hours) Time (in hours)
TNFa MTT 10Ulmi TNFa MTI 1.0U/ml
~ 1<"' 2 t oo
.:l .... ....
Time (in hours) Tim. lin hours)
TN Fa MTT 0.1 U/ml
200
1<., _2 --1:::1 12 1:::12'
2 =46 .:I ....
Time (In hours)
Figure 4: ANOVA performed on MTT assays to see the effect ofTNF-a over time,
show that changes in cell viability were significant at all concentrations of T F-a.
Since all concentrations were equally significant, this may indicate that cell death is
a function of time rather than T IF-a concentration. Results were calculated as
percent of the zero dose control. Bars are means of3 separate experiments, performed in
triplicate ± SO.
36

Effect of cytokines on reactive oxygen species
When HepG2 ceUs are treated with IL-l ~ for 0 - 48 hr, ROS increased at every
concentration of lL-l j3 application. The levels of ROS recorded were consistent with the
levels produced in control ceUs when no cytokine was administered. Therefore, increases
in ROS are most likely caused by ceU growth in the wells of the plate and not by IL-l ~
administration (Figure 5). When the graphs were statistica11y analyzed using one-way
ANOV A to observe variation in ROS with time, an timepoints were found to be
statistica11y significant (p < 0.000 I, Figure 6). This analysis also demonstrated that, at
each individual time point, there were no significant differences in ROS compared to
control caused by increasing amounts of IL-I ~ administered. Together these data indicate
that increases in ROS were time-dependent but not lL-I ~ concentration-dependent.
Along with the known doubling time of HepG2 cells (around 16 hours) these data show
that ROS levels are proportional to ceU number and the increases observed likely
represent over-crowding.
37

CD ~ .s: E iii .. "0 E Q.
IL-1B ROS
10000
8000
6000
-~ 0.1 U/ml 4000
- -<;> -1 .0 U/ml
- .., - 10 U/ml 2000 __ 100 U/ml
-e-1 000 U/ml O~~~~~--~~--~~~
o 6 12 18 24 30 36 42 48 Time (in hours)
Figure 5: Increases in ROS over time wben HcpG2 cells are treated witb IL-l~.
Results were calculated by comparison to a staodard curve of dichlorofluoresceine. Points
are means on separate experiments, performed in triplicate ± SD.
38

9000
8000
'i:i 7000 ~ 6000 E 5000
1~: [ 2000
1000
9000
8000
~ 7000
~ 6000 0e; 5000
.. 4<100 -a 3000 a 2000
1000
9000 8000
::;:: 7000
{ 6000
E SODa : 4000
~ 3000 ao 2000
1L1 BROS 1000U/ml
IL 1 BROS 10U/ml
Time (in hours)
IL1B ROS O.1U/ml
1000
0.1.-,--,,--Time (in hours)
AN OVA for IL-1B
Ip<O.0001 ANOVA
9000
8000
"ii 7000 { 6000
°e 5000 1 4000 "0 3000
[ 2000
9000 8000
1000
- 7000
{
I 6000
5000
IL1B ROS 100U/ml
Time (In hours)
IL 1 BROS 1.0U/ml
Time (In hours)
IL1B ROS OU/ml
Time (In hours)
Figure 6: Increases in ROS over time when HepG2 cells are treated with IL-l13 and
analyzed by IL-t 13 time. Results were calculated by comparison to a standard curve of
dichlorofluoresceine. Points are means of 3 separate experiments, performed in triplicate
± SD.
39

For TNF-a treatment, the amount ofROS increased rapidly and dramatically within 2 hr
to levels equivalent to those observed after 24 - 48 hr in untreated cells. After this
massive increase at 2 hr, ROS did not further increase over time with the amount ofROS
for all concentrations except 10 Ulml consistently in the range of -5000
pmoles/min/well over the entire timecourse. When 10 VIm! ofTNF-a. was administered,
the amount of ROS was not dramatically raised and remained in the range of 1000-2000
pmoles/min/well over the entire timecourse. ROS variations over time were not
significantly different for TNF-a. administration, except at the 6 hour timepoint with 0.1
Ulm! ofTNF-a (Figure 8). When the graphs were analyzed with respect to TNF-a
concentration, 10 Ulm! TNF-a caused significantly lower ROS levels than any other
concentration tested and significantly lower than control concentrations at all time points
(Figure 9). These data indicate that when HepG2 cells are treated with TNF-a, ROS
production is dependent on both time in culture and the concentrations ofTNF-a applied
to the cells.
40

10000
8000 a; ~ c 6000 E -III GO "0 4000 E c..
2000
0 0 6 12
TNFa ROS
18 24 30 Time (in hours)
-e- 0 U/ml ~0. 1 U/ml
-;;- 1.0 U/ml
~10U/ml
_ 100 U/ml
-e- 1000 U/ml
36 42 48
Figure 7: ROS do not increase over time when HepG2 cells are treated with TNF-ct.
Results were calculated by comparison to a standard curve of dichlorofluoresceine. Points
are means of 3 separate experiments, performed in trip licate ± SD.
41

10000
i i '0 E Co
ANOVA for TNFa
TNFa ROS 1000U/ml
Time (in hours)
TNFa ROS 10U/ml
Time (in hours)
TNFa ROS O.1U/ml
Time (in hours)
TNFa ROS 100Ulml
Time (in hours)
TN Fa ROS 1.0U/ml
Time (in hours)
_0 _2 CJ6
P<O.0001 CJ 12 ANOVA CJ 24
1!!\5148
Figure 8: The lack of increase in ROS measured in HepG2 cells is consistent over
time. Tote especially the effects ofTNF-CllO U/mL. Results were calculated by
comparison to a standard curve of dichlorofluoresceine. Bars are means of 3 separate
experiments, performed in triplicate ± SO.
42

ANOVA for TNFa
TN Fa 48HR ROS TNFa 24HR RQS
Concentration IU/mlj Concentration (U/ml)
TN Fa 12HR ROS TNFa 6HR ROS
Concentration (U/ml) Concentration (U/ml)
TNF. 2HR ROS TNFa OHR ROS
I ~ P<O.01 t
Concentratoln (U/ml) Concentration (Ufml)
Figure 9: The lack of increase in ROS measured in HepG2 cells is consistent across
all concentrations ofT F-a. ote especially the effects of Tl'I'F-a 10 u/mL. Results
were calculated by comparison to a standard curve of dichlorofluoresceine. Bars are
means of 3 separate experiments, performed in triplicate ± SD.
43

Biochemical detection oftolal vcr activity
The UaT assay results are shown in Figure 10. Each concentration has nearly the same
shape both for 1L-1 ~ (Figure IDA) and TNF-a (Figure 1 DB). This shape is also seen in
the control. We observed a consistent trend of decreasing UaT activity until the 12 hour
timepoint, whereupon the level ofUaT activity in the cells rebounded. When the graph
was analyzed statistically only the 1.0 U/ml treatments reached significance (P < 0.05)
for the decrease in UaT activity and this was significant for both IL-1 ~ and TNF-a
administration.
44

c: Qj
o 70 ... c.. 60 Cl E 50 :s E Ui II)
(5 E c:
90 c: 80
~ 70 c.. 60 C>
..E 50 c:: 40 E Ii; 30
~ 20 E 10 c:
o
IL1S UGT
Concentration
TNFa UGT
Concentration (U/ml)
_2 Hour
6 Hour
c=J12 Hour
c=J24 Hour _48 Hour
~O Hour
A
B
Figure 10: Effects of proinflammatory cytokines on VeT activity. lOA: IL-l ~ does
not significantl y alter UGT activity. lOB: TNF-a causes a significant decline in UGT
activity for lip to 12 hrs at 1.0 U/ml, whereafter the enzymes recover to control levels.
Bars are means of 3 separate experiments performed in triplicate.
45
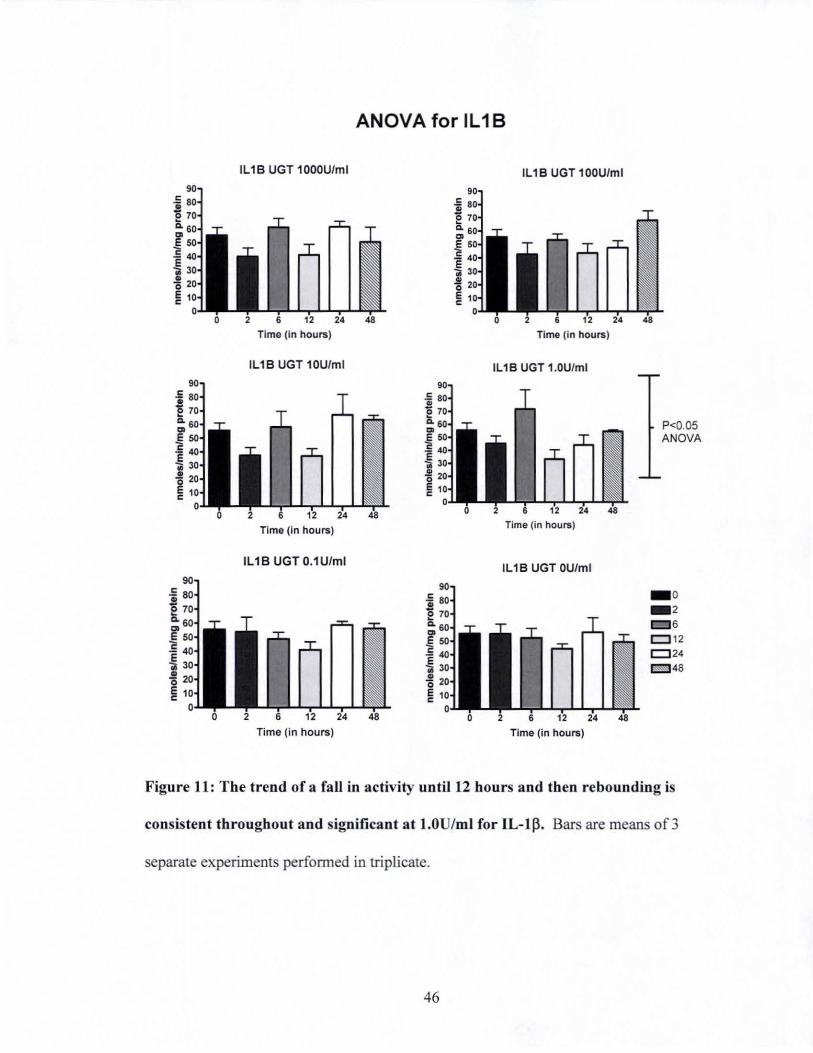
c
~ 0.
f i "0 E c
IL 16 UGT 1000U/ml
Timo (In hours)
IL 16 UGT 10U/ml
Time (in hours)
IL16 UGTO.1U/ml
Time (in hours)
ANOVA for IL 18
c
i co
~ ~ ... o E c
c
I ~ :§ • .!! o E c
c
I co E C
~ ~ E c
1L16 UGT 100U/ml
Time (in hours)
1L1 6 UGT 1.0U/ml
Time (in hours)
IL 16 UGT OU/ml
Time (in hours)
P<O.05 ANOVA
Figure 11: The trend of a fall in activity until 12 hours and then rebounding is
consistent throughout and significant at l.OU/mt for lL-l13. Bars are means of 3
separate experiments performed in triplicate.
46

c
~ Q. COl E "2
j o E c
c ... e Q. COl
.E c E .. m '0 ~ 1
c
~ Q.
COl
.E c
~ .!! 0
~ 1
TNFa UGT 1000U/ml
Time (in hours)
TN Fa UGT 10Ulml
Time (in hours)
TNFa UGT 0.1 Ulml
Time (in hours)
ANOVA for TNFa
TNFa UGT 100Ulml
Time (in hours)
TNFa UGT 1.0Ulml
c
i P<O.05 .. ~ ANOVA
E .. -B E c
Time (In hours)
TNFa UGT OUlml
c _0
~ _2
Q. 6 COl
CJ12 ~ CJ 24 :§ .48 • m
'0 E c
Time (in hours)
Figure 12: The trend of a fall in activity until 12 hours and then rebounding is
consistent throughout and significant at 1.0U/ml for TNF-u. Bars are means of3
separate experiments performed in triplicate.
47

Immunohistochemistry confirmed the presence of both UGTlA and UGTIB enzymes in
Hep02 cells both before and after cytokine treatment (Figure 13). Staining for UOTlA
and UGT2B isoforms was cytoplasmic, and punctate. For HepG2 cells treated with IL-
l p, some nuclear staining for UGTIA was observed (FigureI3A). The presence ofUGTs
in the nucleus or nuclear envelope has not previously been reported.
Additionally, despite our previously reported fall in viability (MTT assay) at 24 hr with
TNF-a administration, no apoptosis was visible in cells treated with IL-IP or TNF-a
(100 UlmL) for 24 hrs since no nuclear or cytoplasmic shrinkage was observed nor was
any cytoplasmic blebbing recorded (Figure 13).
48

Figure 13: Immunohistochemical detection of the expression of UGTIA and UGT2B
in Hep G2 cells shows that the isoforms are prescnt and that apoptosis is likely not
occurring (based on cell morphology). Figure 13A: The expression of UGTlA in cells
treated with IL-ll3. Figure 13B: The expression of UGTlA in cells treated with 1NF-u.
Figure 13e: The express ion of UGT28 in cell s treated with IL-ll3 . Figure ID: The
expression ofUGT l A in cells treated with TNF-u . Magnification is 63X.
49

Biochemical detection of total SULT activity
The SUL T assay revealed that there is apparent increase in SULT activity over time.
This happens also in the control, so it appears to be independent of IL-t f3 administration.
When these results were analyzed, the increase in SULT activity in controls and treated
cells was not statistically significant (Figure 14A). In the case of1NF-a., again we
observed an increase in SUL T activity consistent with the zero dose control and again,
none of the concentrations of1NF-a. caused significant increases in SULT over the
control. Therefore increases in SUL T were time dependent only and likely reflective of
increased numbers of cells as they proliferated (Figure 148).
50

IL-1B SULT
i _0 1!!!!!!12 1::]6 ca.
CD 1::112 E C 1::124
i ~48
0
A E c:
Concentration (U/ml)
TNFa
c _0
i 1!!!!!12 ICL C]6 In
c:l12 ~ c:l24
I ~48
E B c
Concenuatlon(U/ml
Figure 14: Effects of pro inflammatory cytokines on SULT activity. Figure 14A: IL-
1 f3 does not significantly alter SUL T activity although a consistently increased level of
activity was observed. Figure 14B: lNF-a does not cause significant changes in SUL T
at any concentration of lNF-a. Bars are means of 3 separate experiments performed in
niplicate ± SD.
51

Immunohistochemistry confirmed the presence of SUL TlAl, 1 A3 and 2El in HepG2
cells both before and after cytokine treatment (Figure 15). Staining for SULT isoforms
was cytoplasmic. For HepG2 cells treated with IL-l(3. some nuclear staining for
SULT2El was observed (Figure 15E).
Similar to results reported for UGT immunohistochemistry (above), no apoptosis was
caused by IL-l (3 or 1NF-a for 24 hrs since no nuclear or cytoplasmic shrinkage was
observed nor was any cytoplasmic blebbing recorded (Figure 13).
52

Figure 15: Immunohistochemical detection of the expression of SU LT isoforms in
Rep G2 cells. Figure 15A: The expression ofSULTIAI in cells treated with TL- Ip.
Figure 158: The expression ofSULTIA I in cells treated with TNF-u. Figure 15C: The
expression of SUL T1A3 in cell s treated wi th IL-l p. Figure 15D: The expression of
SUL TIA3 in cells treated with TNF-u. Figure 15E: The expression of SUL TIE l in cells
treated wi th IL-I p . Figure 15F: The express ion ofSULTIEl in cells treated with TNF
a.. Magnification is 63X.
53

Biochemical detection of total GST activity
Results from the GST assay showed no change in the amount of GST activity when IL-
l f3 was applied at all concentrations and timepoints compared to the zero dose control
(Figure 16). When 1NF-a was administered, initial increases in GST activity were
observed at the 2 hr and then by 12 hours, GST activity returns to nonna!, control levels.
These increases were analyzed using a t-test and were found to be statistically significant
with P < 0.05 for all concentrations.
54

c l!l e Co til .§ C
:g III GI o E c
C GI
~ Co CI E C 1 E u; 1 GI
o E c:
IL 1B GST
Concentration (U/ml)
TNFa GST
Concentration (U/ml)
_ OHour _2Hour
6 Hour c::J 12 Hour c::J24 Hour _48 Hour
A
_0 Hour _2 Hour
6 Hour
c::J 12 Hour
Cl24 Hour _48 Hour
B
Figure 16: The proinflammatory cytokine TL-l~ does not affect CST activity. TNF-
a. significantly increases CST activity initially and then levels return to normal by
12 hours. With IL-I~ treatment, GST activities are unaffected (Figure 16A) but for TNF-
a., GST activities significantly increase at 2 hours and then recover by 12 hours (Figure
168).
55

Immunohistochemistry confirmed the presence of GST in HepG2 cells both before and
after cytokine treatment (Figure 17). Staining for GST was cytoplasmic and very strong.
This parallels the known high abundance of GST proteins in the cytosol.
Similar to those data reponed above, no apoptosis was caused by IL- I B or TNF-a for 24
hrs since no nuclear or cytoplasmic shrinkage was observed nor was any cytoplasmic
blebbing recorded (Figure 17).
Figure 17: Immunohistochemical detection of the expression of total CST in HepC2
cells. Figure 17A: The expression of GST in cells treated with IL-I p. Figure 17B: The
expression ofGST in cell s treated with TNF-a. Magnification is 63X.
56

Immunocytochemicallocallzation of HNFl and HNF4 proteins
Immunocytochemistry for HNFI and HNF4 showed no translocation to the nucleus
within 60 minutes when HepG2 cells were treated with either IL-l ~ or lNF-a at 100
U/ml (Figure 18 and Figure 19 respectively). Staining was punctate and cytoplasmic for
controls and did not change after 30 minor 60 min oflNFa and IL-l~ exposure. This
indicates that it is unlikely that HNFI or HNF4 are nuclear signaling mechanisms utilized
by IL-l ~ and lNF-a. These data also indicate that the significant changes in enzyme
activities observed where UGT activity was decreased for up to 12 hours and GST
activity was dramatically increased within 2 hours, were not caused by HNFl or HNF 4
nuclear signaling.
Additionally, similar to the results reported for the enzyme immunohistocehmistry, no
apoptotic morphology was observed. None of the micrographs taken showed significant
apoptotic morphology in HepG2 cells after treatment with wither IL-l ~ or lNFa at 100
u/mL (28 micrographs are shown although since all experiments were performed on 3
separate days, they are representative of over 100 slides). No nuclear shrinkage was
observed in any slide (Figures 13, 15, 17, 18 or 19). The cytoplasm of treated cells was
not fragmented or stellate, with the lone exception ofFigure 16E that demonstrates
slightly stellate and extended cytoplasm in HepG2 cells treated with lNFa for 60 min.
Blebs were not routinely observed. Blebbing was never observed in IL-l B treated cells
(Figures 13,15,17,18 or 19), although some suspicion of bleb bing is observed in
57

Figures l8D and 18E (TNFa 30 and 60 min treatments, indicated by white arrow) and
Figure 19B (TNFa 60 min, white arrow).
Figure 18: Immunohistochemical localization ofHNFl proteins in HepG2 cells.
Figure 18A: The localization of HN F 1 in the cytoplasm of cells treated with IL-l ~ after
30 minutes. Figure 18B: The locali zation ofHNFl in the cytoplasm of cell s treated wi th
IL- I ~ after 60 minutes. Figure 18C: The localization ofHNFI in the cytoplasm of cells
treated wi th TNF-u after 30 minutes. Figure 180: The localization ofHNFl in the
cytoplasm of cells treated with TNF-u after 60 minutes. Figure 18E: The localization of
58

HNFI in the cytoplasm of cell s untreated at time zero. Arrows indicate possible areas of
blebbing. Magnification is 63X.
Figure 19: Immunohistochemical localization of HNF4 proteins in HepG2 cells.
Figure 19A: The localization of HNF4 in the cytoplasm of cells treated with lL-J ~ after
30 minutes. Figure 198: The localization ofHNF4 in the cytoplasm of cells treated with
IL-I ~ after 60 minutes. Figure 19C: The localization ofHNF4 in the cytoplasm of cells
treated with TNF-a after 30 minutes. Figure 19D: The localization ofHNF4 in the
cytoplasm of cells treated with TNF-a after 60 minutes . Figure 19E: The local ization of
59

HNF4 in the cytoplasm of cells untreated at time zero. Arrow indicates possible area of
blebbing. Magnification is 63X.
Chapter 4: Discussion
In summary, the MIT assay showed that cytokine administration causes an increase in
cell viability at 12 hours and then viability declines while ROS assays demonstrated that
increases in ROS occur over time with application of IL-l ~ in a manner that is
proportional to cell number. In contrast ROS levels are immediately and dramatically
increased by TNF-a to high levels that persist over time, regardless of cell growth. The
levels ofUGT activity exhibited a consistent trend when cells were treated with both
cytokines by decreasing until 12 hours and then rebounding. For both cytokines, 1.0
U/ml was found to decrease significantly. SUL T enzymes displayed no change in
activity caused by IL-I ~ or TNF -a. Finally, GST activity increased twofold within two
hours when cells were treated with TNF-a but did not change due to IL-l ~
administration. All enzymes were detected using immunocytochemistry before and after
cytokine treatment, but neither lNF-a nor IL-I B cause translocation ofHNFI and
HNF4 to the nucleus minutes.
To demonstrate that the pro-inflammatory cytokines IL-I ~ and TNF-a may be
responsible for changes in phase IT enzyme activity, we first had to demonstrate that
administration of these cytokines did not cause cell death. IflL-I~ and TNF-a cause
significant cell death in themselves, decreases in enzyme activities could be attributed to
decreases in cell number. Since the cells were not dying (in fact MIT assays indicated
60

cells were proliferating) changes in enzyme activity were likely through another
mechanism.
A caveat to using MIT to report cell viability is that the may be inaccurate since
intracellular components other than the mitochondria are able to reduce the formazsn salt
used for the assay. Although MIT reduction is usually considered a measure of
mitochondrial viability, the actual location of the enzymes responsible for reduction is
unknown. The original proof that MIT reduction occurred primarily through conversion
in the mitochondrial electron transport chain was published by Slater et. al. (1963) using
rat liver homogenates and respiratory inhibitors. Subsequently, it has been demonstrated
that mitochondrial-dependent reduction of MIT accounts for some of the formazan
produced, but that nicotinamide-dependent MIT reduction occurs outside of the
mitochondrial membrane. The extra-mitochondrial reduction of MIT associated with the
cytosolic compartment was equal to the reduction associated with the mitochondria in rat
livers (Gonzalez, 2001). Most important to this thesis, it has previously been shown that
that only - 45% of reduced MIT reagent in the human cell line HepG2 is performed
within the mitochondrial membrane (Bernas, 2002).
Essentially these published studies indicate that MIT may report greater viability than is
actually present when HepG2 cells are under conditions of oxidative stress or when
reductive cytoplasmic enzymes are induced (Collier el ai, 2003). In the context of this
project, even though the MIT assay provided evidence that HepG2 cells were
61

proliferating and not dying, this may be inaccurate since changes in ROS were observed
in our cell.
Since ROS have been shown to alter enzyme expression and activity due to signaling
pathways of their own (Hayes, 1995) and also to ensure ROS had not confounded our
MIT data, we assessed the levels of intracellular ROS in HepG2 cells treated with pro
inflammatory cytokines. Our data indicate that ROS levels increase as cells proliferate
but not due to IL-IB treatment for up to 48 hr, therefore, at earlier timepoints, MIT data
is likely accurate. However after 24 and 48 hr in culture (when HepG2 cells have doubled
once and twice respectively) the viability reported may be falsely elevated. When TNF-a
was administered, extremely high levels ofROS were recorded as early as 2 hr at all
concentrations ofTNF-a except IOU/mI. Thus for TNF-a, viability reported by MIT is
likely to be overestimated, except for cells treated with 10 u/mL. Additionally, high
levels of intracellular ROS and ROS signaling pathways may confound our enzyme
activity data for TNF-a at all concentrations except 10 U/mI and for IL-IB after 24 h.
Examples of how this may be occurring are discussed below.
Microscopy consistently showed no apoptotic morphology in HepG2 cells treated with
IL-I ~ and TNF-a. This may indicate that the cells were not dying due to the cytokines
administered or due to ROS-initiated apoptotic pathways however, since HepG2 cells are
an adherent cell line and apoptotic cells lift from slides, it is also possible that cells
62

showing apoptosis were lifting from slides during washing steps. This is mitigated
somewhat by the observation that slides treated with cytokines did not appear (visually)
to have markedly less cells than untreated slides. Over 30 micrographs were taken and in
only 3 cases « 1 0%) were possible signs of bleb bing or cytoplasmic shrinkage observed.
Since apoptosis does occur at a low background rate in all cells, it is likely that this is
what was observed and not an effect of the cytokines. Therefore, we believe that any
significant changes in enzyme activity reported can be attributed to cytokine effects on
the cell when IL-I~ is administered before 12 hours and when TNF-a. is administered at
10 U/rnl. For all other circumstances, changes in enzyme activity may be due to ROS
effects.
UGT levels declined consistently within the first 12 hours of cytokine administration.
This was significant at 1.0 U/rnl. After 12h UGT activities recovered to control levels.
These data answer a very important question related to earlier work in this area where
cytokines were found to depress UGT mRNA levels acutely but not chronically in the
human liver (Congiu, 2002). Our acute decreases in UGT activity that do not persist after
12 hours correlate extremely well to the acute decreases in mRNA but lack of chronic
effects observed by Congiu e/ at (2002) in studying UGT mRNA levels in acutely and
chronically damaged human livers.
Additionally, we report that SUL T activities were not significantly altered when IL-I ~ or
TNF-a. were administered which is interesting in light of other results reported for UGT
and GST activities. There is considerable overlap and redundancy in phase II
63

metabolism, so if changes in enzyme are occurring, it is likely that changes in another
enzyme will be observed in an attempt to maintain homeostasis. However, even though
there is a consistent decrease in UOT activity at 12 hours and a significant increase in
OST activity at 2 hours, SULT activity remains unaltered. There are several possible
reasons for this, although two are oflikely importance. Firstly, UOT enzymes are high
abundance enzymes that are high capacity, low affinity metabolizers. They are seldom
saturated by physiological levels of substrates. Therefore, a reduction ofUOT activity by
~30% within 12 hr rnay not meaningfully affect the clearance of substrates and hence the
cell does not to upregulate other mechanisms. Alternatively, significant increases in OST
activity of up to 2-fold are observed within 2 hr. Hence, the greater OST activity rnay be
compensating for decreases in UOT activity. Of the three enzyme families studied, the
UOT and SUL Ts have the most similar substrate affinity profiles, thus; this
complementary UOT/SULT regulation might be expected. Therefore, increases in OST
activity to compensate for decreased UOT activity would be a surprising compensatory
mechanism.
OST activity increases nearly twofold within two hours oflNF-a administration. These
levels return to normal levels by about 12 hours. Studies performed using 10 U/mllNF
a are the only reliable results for the affects of this cytokine on enzyme activity because
this is the only concentration that did not cause significant levels of ROS. Although a
similar trend is evident with all concentrations of lNF-a administered to Hep02 cells,
64

the increase in GST activity at other concentrations may be due to the high levels ofROS
that were induced by the cytokine. The main way in which ROS affect GST enzymes is
to upregulate their activity through increased transcription of GST protein using the
Antioxidant Response Element nuclear receptor (Hayes, 1995). However, since
increases in GST activity occur within 2 hours (before transctiption and translation can
occur) even when high levels ofROS are not present, we can conclude that TNF-a. does
increase GST activity independent ofROS-mediated transcription.
By 12 hours, GST levels have returned to their norrnallevels. There could be several
explanations for this. Depletion of glutathione likely occurs since the co-factor itself is a
key player in antioxidant defenses by binding and deactivating ROS which protects the
cell from oxidative injuries (Winiarska, 2003; Whitekus, 2002). If glutathione may is
reacting with ROS it becomes oxidized and is not available for the GST reaction.
Another possible explanation involves the microsomal GSTs known as MAPEGs which
are involved directly in inflammatory responses.
MAPEGs are known to be involved in the production of eicosanoids, prostaglandins and
leukotrienes (EPLs), which are all known to increase propagation of inflammation and
pain. An upregulation of MAPEGs, like the one seen at 2 hours, would coincide with an
increase in EPLs and acute inflammation. Thus if GSTs are decreased, like the decreased
seen at 12 hours, it could be as a protective mechanism to prevent over-production of
EPLs, preventing inflammation and pain. Thus, the body maintains homeostasis.
65

We also performed immunocytochemistry studies to determine whether 1NF-a and IL-
1(3 can cause translocation of the nuclear transcription factors HNFl or HNF4. Since all
of our Phase II enzymes of interest can be regulated by these transcription factors, this
was a logical direction to study enzyme activation. These studies demonstrated that 1NF
a and IL-l(3 do not induce translocation of the HNFI or HNF4 transcription factors to the
nucleus ofHepG2 cells. Thus, the activation ofGST enzymes and apparent suppression
ofUGT enzymes by 1NF-a and IL-l(3 must occur through a mechanism independent of
HNFI or 4 signaling.
Since a twofold increase of GST activity is very high, these results have potential clinical
significance. As an example, patients on long term drug therapy may be at risk of altered
drug metabolism if they contract an acute infection. Additionally, since the body
maintains homeostasis, this is an issue during the initial stages (first 2-6 hours) of
infection. An example of how this could have serious consequences for certain drugs
would be to consider the use of nitroglycerin on a long term basis for the treatment of
angina, a chronic heart disease characterized by chest pain and an irregular heartbeat.
Nitroglycerin is known to have an extremely rapid onset of action and is also metabolized
and removed rapidly. Since nitroglycerin also has a very narrow therapeutic index
(meaning there is a small dosage range between effectiveness and toxicity for this drug),
it is conceivable that if a drastic increase in the metabolism and removal of nitroglycerin
66

occurred, a dose of the drug in the blood would not reach clinically effective levels at the
desired site of action. Nitroglycerin is primarily metabolized by OST enzymes (Cassaret
and Doull) so increases in OST activity, such as those reported; might result in enhanced
clearance of nitroglycerin. The mechanism of action for nitroglycerin is to reduce
pressure on the heart, lowering heart rate, and dilate the blood vessels, lowering blood
pressure. If the drug is metabolized too quickly, high levels of pressure on the heart and
elevated blood pressure may not be relieved.
Suggestions for Further ResetU'ch
Further research possibilities in studying the effects of pro-inflammatory cytokines on
detoxification defenses may include investigating which transcription factors are
responsible for the changes observed in UOT and OST detoxification enzymes when
TNF-a and IL-l ~ are administered Since we have shown no apparent translocation of
the HNFI and HNF4 transcription factors, simple gel-shift assays may be useful to
further confirm that TNF -a and IL-l ~ do not bind these transcription factors. Secondly.
we could pursue other candidate gened that may be responsible for changes in Phase 11
enzyme expression and activity, one possible gene is the RXR:RAR gene which is also
known to be present in the promoter region of all three enzymes (Li, 2002).
Additional research may center on the role of ROS. Much study has been performed
using TNF-a and IL-l ~ as promoters of apoptosis and it is known that ROS can deplete
67

glutathione, the co-factor necessary for the GST reaction. Biochemical assays to
determine glutathione depletion are readily available and performing these studies would
be extremely helpful in confirming depletion of the glutathione co-factor as a mechanism
for lowered GST activity after the initial 2 hr spike. Furthermore, in order to determine if
the changes in enzyme activity levels are due to changes in the amount of protein
available to metabolize substrates, Western blots on all the enzymes could be used to
compare protein levels at different timepoints when IL-l (3 and TNF-o; are applied to
normal, control HepG2 cells.
Summary
In summary, acute infection and inflammation do cause significant changes phase II
detoxifying enzymes. The SUL T enzymes are unaffected and the UGT enzymes may
decline slightly but, within 12 hours return to their pre-inflammatory levels. In contrast
GST activity increased twofold within a very short period (2 hours). These results,
particularly for GST enzymes, have potential clinical and biological relevance. It would
be useful to expand upon them in a more physiological paradigm such as primary human
hepatocytes or an animal model to assess their applicability to acute infection and
inflammation in vivo. Additionally, these studies are important in demonstrating that
TNF-a and IL-l(3 do not induce translocation ofHNFI or HNF4 to the nucleus, thereby
presenting evidence that increases in GST activity and and suppression of UGT activity
caused by proinflammatory cytokines likely do not occur through HNF signaling
pathways.
68

Appendix A
BiologIcal Safety Program June 12, 2007
MEMORANDUM
TO: Dr. Abby C. Collier T3MP JABSOM BSB320
Dr. James T. Douglas, Chair j. 1M- ,~-", L. Institutional Biosafety Committee <tI
FROM:
~~~;~:I~~:ty Officf~~. O~. LETTER of AUTHORIZATION No.: 42300a07G
SECTION ill. EXPERIMENTS COVERED BY THE NIH GUIDELINES Section ill-F. Exempt Experiments
APPROVED: "Detoxification Is altered by Inflammatory cytoklnes: HepG2 cells as a model for Immunotoxlcology studies"
The Environmental Health and Safety Office, Biological Safety Program (BSP) and the UH Executive Committee of the Institutional Biosafety Committee (IBC), have reviewed your biological activities on Friday, June 8, 2007. The IBC and BSP have approved the use as described in your protocols as submitted on the BSP- Registration. Your facility at the John A. Bums School of Medicine, Department of Tropical Medicine, Medical Microbiology and Pharmacology, Biosciences Research Building, Room 320 been certified and rated a minimum as a Biological Safety Level 2 according and as appropriate to the Nationallnst/tutas of Heelth, Centers for Disease Control and Prevention, US Department of Agriculture (USDA) anel/or as required by Hawaii Occupational Safaty and Health. The biological safety guidelines for use of biological materials, including recombinant activities at the University of Hawaii are being met, to Its satisfaction.
This memorandum and signed copy of your BSP form is your authorization as approved by the UH IBC. Upon conducting a risk assessment of the facility, procedures, practices, training and expertise of personnel of this protocol and containment levels required by the guidelines, it meets a Blosafety Level 2. Laboratory inspected in April 2007. This authorization is good for five yeers (through June 2012). However, if there are major changes from this registration and authorization, please complete an updated form. Fun review must be done In 2012.
2040 East-West Road, Hono!ulu. Hawai'j 96822 Telephol1e: (808) 956-8860. Facsimile, (808) 956-3205
An Equal Opportunrty/Afflrmattva Action Institution 69
Memo IBC Authorization 492300607G June 12,2007 Page 2
This project conforms with UH Biosafety Guidelines as applicable to the NIH -"Guidelines for Research InvoMng Recombinant DNA Molecules" (DHHS, NIH April 2002), USDA (7 CFR Parts 340), or the CDC-NIH Blosafety in the Microbiological and Biomedical Laboratories (5th edition, Feb 2007).
All facility that houses regulated biological commodities must have a written security plan and wastes management must be properly treated (preferably autoclaved), including end of project destruction. All necessary transportation requirements must be adhered with according to US Department of Transportation. There is an UH policy on moving local isolates. Local Isolates are not considered regulated biological commodities; however, standard blosafety practices (good laboratory practices) must be adhered with during active manipulation.
Remember that all Imported "live biological commodities," come under the jurisdiction of State Departments of Agriculture and Health "Import and Use" permits, Including, live biological materials such as E. coif, animals, plasmlds, bacteriophage, DNA, and call lines. All staff, faculty and students manipulating biological commodities must be Initially and annually trained and documents of their training and assurances of project kept for a minimum of three years. There may be additional requirements from the (1) UH Veterinarian- Laboratory Animal Services and the Compliance Office of the Institutional Animal Care and Use Committee, (2) Committee.on Human Subjects, (3) DMng Safety Control Board for scientific dMng, (4) Radiation Safety Committee for radioactive usage and (5) the Workplace Safety Committee.
A final report should be provided, once the project Is completed. Report immediately any injury, theft, lost, unanticipated problems and damage to the experiments or to workers. This requirement is necessary as an assurance from the National Institutes of Health and US Department of Agriculture on recombinant activities.
If there are further questions or request, more information please calls me at 956-3197.
c: Karen Quinn
70

References
Banhegyi, G., Mucha, I., Garzo, T., Antoni, F., Mandl, J. Endotoxin inhibits
glucuronidation in the liver. Biochemical Pharmacology 1995;49:65-68.
Barbier, 0., Lapointe, H., EI Alfy, M., Hum, DW., Belanger, A. Cellular localization of
uridine diphosphoglucuronosyltransferase 2B enzymes in the human prostate by in situ
hybridization and immunohistochemistry. Journal o/Clinical Endocrinology and
Metabolism 2000;85:4819-26.
Barker, EV., Hume, R., Hallas, A., Coughtrie, WH. Dehydroepiandrosterone
sulfotransferase in the developing human fetus: quantitative biochemical and
immunological characterization of the hepatic, renal and adrenal enzymes. Endocrinology
1994;134:982-989.
Baud, V., Karin, M. Signal transduction by tumor necrosis factor and its relatives Trends
in Cellular Biology 2001;11:372-7.
Benedetti, MS., Whomsley, R., Baltes, E., Tonner, F. Alteration of thyroid hormone
homeostasis by antiepileptic drugs in humans: involvement of glucuronosyltransferase
induction. European Journal 0/ Clinical Pharmacology 2005;61:863-72.
71

Broide, DH. Inflammatory Cells: Structure and Function in: Basic and Clinical
Immunology. Stites, DP. And Terr, AI., ed. 1991;7:141-153.
Buu, NT., Duhaime, J., Savard, C., Truong, L., Kuchel, O. Presence of conjugated
catecholamines in rat brain: a new method of analysis of catecholamine sulfates. Journal
of Neurochemistry 1981 ;36:769-772.
Chen, J., Nikolova-Karakashian, M., Merril, AH. Jr., Morgan, ET. Regulation of
cytochromes P450 2Cll (CYP2Cll) gene expression by interleukin-l, sphingomyelin
hydrolysis and ceramides in rat hepatocytes. Journal of Biological Chemistry
1995;270:25233-8.
Collier, AC., Pristos, C.A. The mitochondrial uncoupler dicumarol disrupts the MIT
assay. Biochemical Pharmacology 2003;66:281-287.
Congiu, M., Mashford, M.L., Slavin, J.1., Desmond, P.V. UDP glucuronosyltransferase
mRNA levels in human liver disease. Drug Metabolism and Disposition 2002;30: 129-
134.
Coughtrie, MW. Sulfation through the looking glass-recent advances in sulfotransferase
research for the curious. Pharmacogenomics Journal 2002;2:297-308.
72

Davies, E., Tsang, C-W., Ghaza1i, A.R, Harris, R.M., Waring, RH. Effects of culture
with TNF-a, TGF-~ ad insulin sulphotransferase (SULT 1A1 and 1A3) activity in human
colon and neuronal cell lines. Toxicology in Vitro 2004;18:749-754.
Davis, W., Ronai, Z., Tw, K.D. Cellular thiols and reactive oxygen species I drug
induced apoptosis. The Journal of Pharmacology and Experimental Therapeutics
2001;296:1-6.
De Wildt, S.N., Kearns, G.1., Leeder, J.S., van den Anker, J.N. Glucuronidation in
Humans. Clinical Pharmacokinetics 1999; 36:439-452.
Delmotte, P., Degroote, S., Lafitte, J-J., Lamblin, G., Perini, J-M., Roussel, P. Tumor
necrosis factor a increases the expression of glycosyltransferases and sulfotransferases
responsible for the biosynthesis of sialylated and/or sulfated Lewis x epitopes in the
human bronchial mucosa. The Journal of Biological Chemistry 2002;277:424-431.
Desmots, F., Rissel, M., Gilots, D., Lagadic-Gossman, D., Morel, F., Guguen-Guillouzo,
C., Gui1louzo, A., Loyer, P. Pro-inflammatory cytokines tumor necrosis factor a and
interleukin-6 and survival factor epidermal growth factor positively regulate the murine
GST A4 enzyme in hepatocytes. The Journal of Biological Chemistry 2002;277: 17892-
17900.
73

Duvoix, A., DelhaIle, S., Blasius, R., Schnekenburger, M., Morceau, F., Fougere, M.,
Henry, E., Galteau, M-M., Dicato, M., Diedrich, M. Biochemical Pharmacology
2004;68:1101-1111.
Frova, C. Glutathione transferases in the genomics are: new insights and perspectives.
Biomolecular Engineering 2006;23: 149-169.
Gardner-Stephen, D., Heydel, I-M., Goyal, A., Lu, Y., Xie, W., Lindblom, T.,
Mackenzie. P., Radominska-Pandya, A. Human PXR variants and they differential
effects on the regulation of human UDP-giucuronosyltransferase gene expression. Drug
Metabolism and Disposition 2004;32:340-347.
Gardner-Stephen, D.A. and Mackenzie, P.I. Isolation of the UDP-giucuronosyltransferase
lA3 and lA4 proximal promoters and characterization of their dependence on the
transcription factor hepatocyte nuclear factor I a. Drug Metabolism and Disposition
2006;35:116-120.
Goodman, JW. The Immune Response in: Basic and Clinical Immunology. Stites, DP.
And Terr, AI., ed. 1991;7:34-60.
Gregory, P.A., Mackenzie, P.I. The homeodomain Pbx2-Prepl complex modulates
hepatocyte nuclear factor la-mediated activation of the UDP-giucuronosyltransferase
2B17 gene. Molecular Pharmacology 2002;62:154-161.
74

Gupta, S. Molecular steps of death receptor and mitochondrial pathways of apoptosis.
Life Sciences 2001;69:2957-2964.
Gutierrez-Ruiz, C., Quiroz, S.C., Souza, V., Bucio, L., Hernandez, E., Olivares, LP.,
Llorente, L., V argas-Vorackova, F., Kershenobich, D. Cytokines, growth factors, and
oxdative stress in HepG2 cells treated with ethanol, aceta1dehyde, and LPS. Toxicology
1999;134:197-207.
Hayes, J.D., Flanagan, J.U., Jowsey, LR. Glutathione transferases. Annual Review of
Pharmacology and Toxicology 2005;45:51-88.
Kamataki, T. Hepatocyte nuclear factor-a. is a causa1 factor responsible for
interindividual differences in the expressions ofUDP-glucuronosyltransferase 2B7
mRNA in human livers. Drug Metabolism and Disposition 2002;30:613-615.
Kauffman, F.C. Sulfonation in phannacology and toxicology. Drug Metabolism Reviews
2004;36:823-843.
Klaassen, Curtis D., ed. Casarett & Doull's Toxicology - The Basic Science of Poisons
(6th Edition). McGraw-Hill, 2001.
75

Klone, A., Weidner, U., Hussnatter, R., Harris, J., Meyer, D., Peter, S., Ketterer, B., Sies,
H. Decreased expression of the glutathione S-transferases alpha and pi genes in human
renal cell carcinoma. Carcinogenesis 1990;11 :2179-83.
Levesque, E., Turgeon, D., Carrier, J-S., Montminy, V., Beaulieu, M., Belanger, A.
Isolation and characterization of the UGT2B28 cDNA encoding a novel human steroid
conjugating UDP-glucuronosyltransferase. Biochemistry 2001 ;40:3869-3881.
Li, D., Zimmerman, T.L., Thevananther, S., Lee, H-Y., Kurie, J.M., Karpen, S.J.
lnterleukin-l J3-mediated suppression of RXR:RAR transactivation of the Ntcp promoter
is JNK-dependent. The Journal of Biological Chemistry 2002;277:31416-31422.
Lin, T. and Yang, M.S. Benzo[ a. ]pyrene-induced elevation of GSH level protects against
oxidative stress and enhances xenobiotic detoxification in human HepG2 cells.
Toxicology 2007;235: 1-10.
Lukacs, NW., Strieter, RM., Chensue, SW., Widmer, M., Kumkel, SL. TNF-alpha
mediates recruitment of neutrophils and eosinophils during airway inflammation. Journal
of Immunology 1995;154:5411-7.
Mackenzie, P.I., Gregory, PA, Garner-Stephen, D.A .. Lewinsky, R.H., Jorgensen, B.R.,
Nishiyama, T., Xie, W., Radominsja-Pandya, A. Regulation ofUDP
glucuronosyltransterase genes. Current Drug Metabolism 2003;4:249-257.
76

Maheo, K., Antras-Ferry, J., Morel, F., Langouet, S., Guillouzo, A. Modulation of
glutathione s-transferase subunits A2, Ml, and PI expression by interleukin-l ~ in rat
hepatocytes in primary culture. The Journal of Biological Chemistry 1997;272: 16125-
16132.
McCalI, IM., Aiken, JW., Chidester, CG., DuCharme, DW., Wending, MG. Pyrimidine
and triazine 3-oxide sulfates: a new family of vasodilators. Journal of Medical Chemistry
1983;26:1791-1793.
Miller, JA. Sulfonation in chemical carcinogenesis-history and present status. Chemical
and Biological Interactions 1994;92:329-341.
MitchelI, S.R., Sewer, M.B., Kardar, S.S., Morgan, E.T. Characterization ofCYP4A
induction in rat liver by inflammatory stimuli: dependence on sex, strain, and
inflammation-evoked ypophagia. Drug Metabolism and Disposition 2001 ;29: 17-22.
Monshouwer, M., Witkamp, R.F., Nijmeijer, S.M., van Amsterdam, J.G., van Miert,
A.S.J.P.A.M. Suppression of cytochrome P450- and UDP glucuronosyl transferase
dependent enzyme activities by proinflammatory cytokines and possible role of nitric
oxide in primary culture of pig hepatocytes. Toxicology and Applied Pharmacology
1996;137:237-244.
77

Morgan, E.T. Expression ofUDP-glucuronosyltransferase isofonn mRNAs during
inflammation and infection in mouse liver and kidney. Drug Metabolism and Disposition
2006;34:351-353.
Morgan, E.T., Li-Masters, T., Cheng, P-Y. Mechanisms of cytochrome P450 regulation
by inflammatory mediators. Toxicology 2002;181-182:207-210.
Nakamura, Y., Mild, Y., Suzuki, T., Nakata, T., Darnel, A.D., Moriys, T., Tazawa, C.,
Saito, H., Ishibashi, T., Takahashi, S., Yamada, S., Sasano, H. Steroid sulfatase and
estrogen sulfotransferase in the atherosclerotic human aorta. American Journal of
Pharmacology 2003;163:1329-1339.
Ng, L., Nichols, K., O'Rourke, K.., Maslen, A., Kirby, G.M. Repression of human
GSTA1 by interleukin-1f3 is mediated by variant hepatic nuclear factor-1C. Molecular
Pharmacology 2007;71:201-208.
Nowell, S., Ratnasinghe, DL, Ambrosone, CB., Williams, S., Teague-Ross, T., Trimble,
L., Runnels, G., Carrol, A., Green, B., Stone, A., Johnson, D., Greene, G., Kadlubar, FF.,
Lang, NP. Association of SUL TlAI phenotype and genotype with prostate cancer risk in
African-Americans and Caucasians. Cancer Epidemiology, Biomarkers, and Prevention
2004;13:270-6.
78

Oppenheim, 11., Ruscetti, FW., Faltynek, C. Cytokines in: Basic and Clinical
Immunology. Stites, DP. And Terr, AI., ed. 1991;7:78-100.
Park, I-N., Cho, IJ., Kim, S.O. Ceramide negatively regulates glutathione S-transferase
gene transactivation via repression of hepatic nuclear factor-l that is degraded by the
ubiquitin proteasome system. Molecular Pharmacology 2004;65: 1475-1484.
Radmoninska-Pandya, A., Czernik, P J., Little, 1.M. Structural and functional studies of
UDP-glucuronosyltransferases. Drug Metabolism Reviews 1999;31 :817-899.
Renton, K.W., Cytochrome P450 regulation and drug biotransformation during
inflammation and infection. Current Drug Metabolism 2004;5:235-243.
Richardson, T.A. and Morgan. E.T. Hepatic cytochrome P450 gene regulation during
endotoxin-induced inflammation in nuclear receptor knockout mice. The Journal of
Pharmacology and Experimental Therapeutics 2005;314:703-709.
Richardson, T A., Sherman. M., Atonovic, 1., Karar, S.S., Strobel, H.W., Kalman, D.,
Morgan. E.T. Hepatic and renal cytochrome P450 gene regulation during Citrobacter
rodentium infection in wild-type and toll-like receptor 4 mutant mice. Drug Metabolism
and Disposition 2006;34:354-360.
79

Scandalios, J.G. Oxidative stress: molecular perception and transduction of signals
triggering antioxidant gene defenses. Brazilian Journal of Medical and Biological
Research 2006;38:995-1014.
Schwabe, RF., Brenner, DA. Role of glycogen sythase kinase-3 in lNF-aipha-induced
NF-kappaB activation and apoptosis in hepatocytes. American Journal of
Gastrointestinal Liver Physiology 2002;283:G204-11.
Seth, P., Lunetta, KL., Bell, DW., Gray, H., Nasser, SM., Rhei, E., Kaelin, CM.,
Inglehart, DJ., Marks, JR, Garber, JE., Haber, DA., Polyak, K. Phenol su1fotransferase:
hormonal regulation, polymorphism, and age of onset of breast cancer. Cancer Research
2000;60:6859-63.
Sewer, M.B., Koop, D.R., Morgan, E.T. Differential inductive and suppressive effects of
endotoxin and particulate irritants on hepatic and renal cytochrome P450 expression. The
Journal of Pharmacology and Experimental Therapeutics 1997;280: 1445-1454.
Slater, EC., Tager, 1M. Synthesis of glutamate from alpha-oxoglutarate and ammonia in
rat-liver mitochondria: energetics and mechansisms. Biochemica et biophysica acta
1963;77:276-300.
80

Stadler, J., Trockfeld, J., Schmalix, WA., Brill, T., Siewart, JR., Greim, H., Doehmer, J.
Inhibition of cytocbromes P4501A by nitric oxide. Proceedings of the National Academy
of Sciences of the USA 1994;91:3559-63.
Strange, R.C., Spiteri, M.A., Ramachandran, S., Fryer, A.A. Glutathions-S-transferase
family of enzymes. Mutation Research 2001 ;482:21-26.
Strasser, S.I., Mashford, M.L., Desmond, P.V. Regulation ofuridine diphosphate
glucuronosyltransferase during the acute-phase response. Journal of Gastroenterology
and Hepatology 1998;13:88-94.
Sugatani, J., Yamakawa, K., Tonda, E., Nishitani, S., Yoshinari, K., Degawa, M., Abe, I.,
Noguchi, H., Miwa, M. The induction of human UDP-glucuronosyltransferase 1A1
mediated through a distal enhancer module by flavonoids and xenobiotics. Biochemical
Pharmacology 2004;67:989-1000.
Usui, T., Kuno, T., Ueyama, H., Ohkubo, I., Mizutani, T. Proximal HNF1 element is
essential for the induction of human UDP-glucuronosyltransferase lAI by glucocorticoid
receptor. Biochemical Pharmacology 2006;71:693-701.
81

Wells, P.G., Mackenzie, P.I., Chowdhury, J.R., Guillemette, C., Gregory, P .A., Ishii, Y.,
Hansen, A.J., Kessler, F.K., Kim, P.M., Chowdhury, N.R. Glucuronidation and the UDP
glucuronosyltransferases in health and disease. Drug Metabolism and Disposition
2004;32:281-290.
Whalen, R., Voss, SH., Boyer. Decreased expression levels ofrat liver glutathione S
transferase A2 and albumin during the acute phase response are mediated by HNFI
(hepatic nuclear factor I) and ILlDEX-NP. Biochemical Journal 2004;377:763-8.
Zheng, W., Xie, D., Cerhan, JR., Sellers, TA., Wen, W., Folsom, AR. Sulfotransferase
IAI polymorphism, endogenous estrogen exposure, well-done meat intake, and breast
cancer risk. Cancer Epidemiology, Biomarkers, and Prevention 200 I ;10:89-94.
82