Embed Size (px)
DESCRIPTION
Dining Services. ACUHO-I/EBI 2002 Resident Study. Distributed in February 2002 by RA’s Given to students residing in campus-owned residence halls 1,114 distributed; 655 returned = 59% return 319 Freshmen, 240 Sophomores, 78 Juniors, 4 Seniors, & 14 graduate, non-degree or other. - PowerPoint PPT Presentation
Citation preview
ACUHO-I/EBI 2002 Resident Study

Distributed in February 2002 by RA’sGiven to students residing in campus-owned
residence halls1,114 distributed; 655 returned = 59% return319 Freshmen, 240 Sophomores, 78 Juniors, 4
Seniors, & 14 graduate, non-degree or other
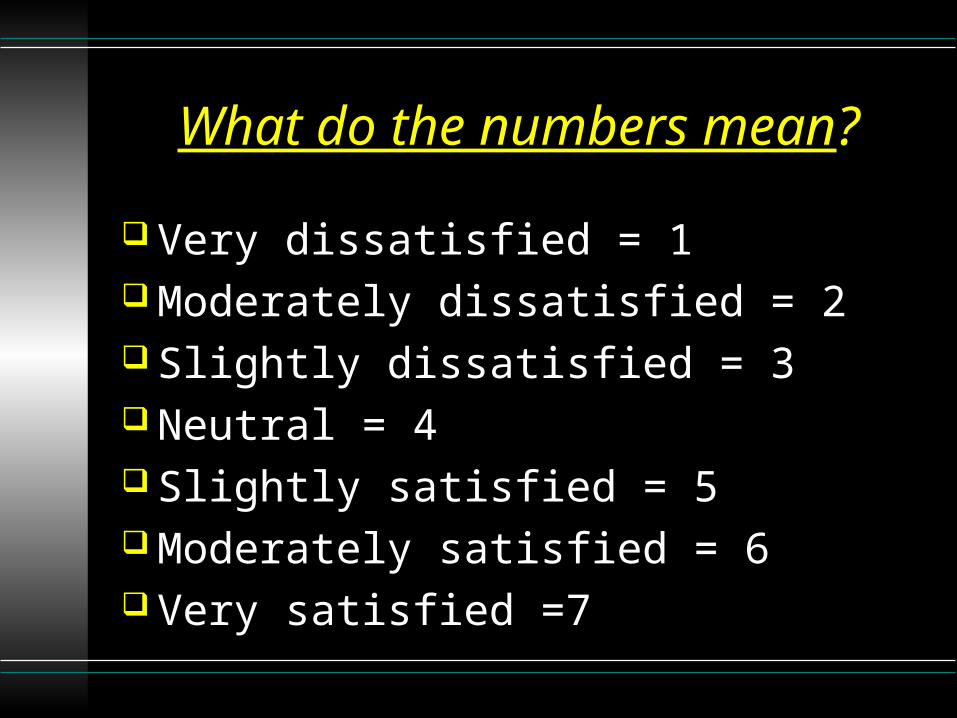
What do the numbers mean?
Very dissatisfied = 1 Moderately dissatisfied = 2 Slightly dissatisfied = 3 Neutral = 4 Slightly satisfied = 5 Moderately satisfied = 6 Very satisfied =7
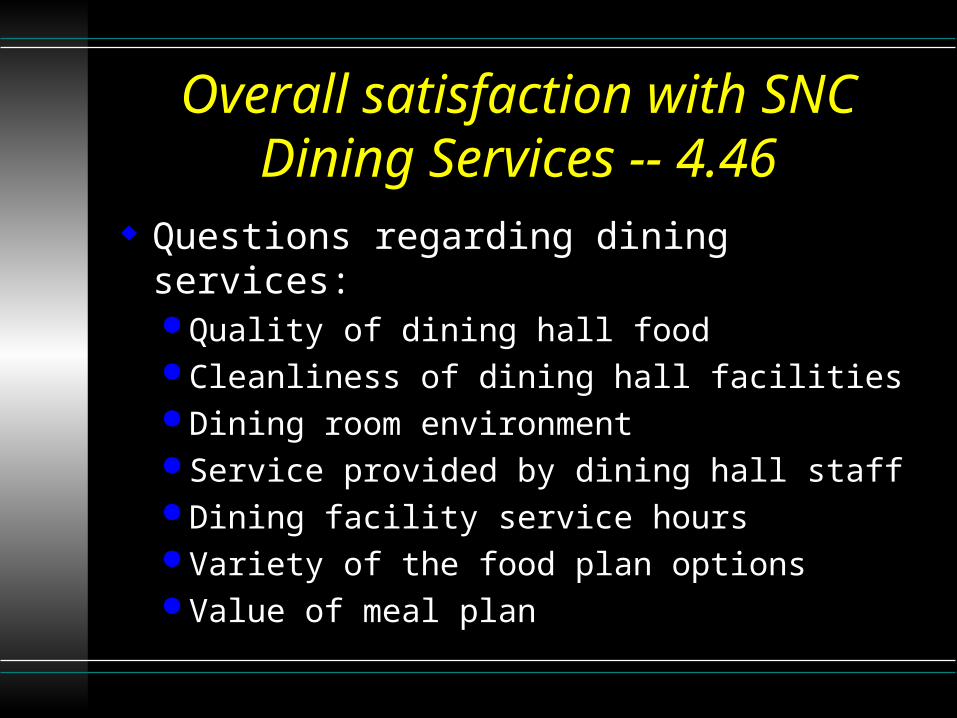
Overall satisfaction with SNC Dining Services -- 4.46
Questions regarding dining services: Quality of dining hall food Cleanliness of dining hall facilities Dining room environment Service provided by dining hall staff Dining facility service hours Variety of the food plan options Value of meal plan
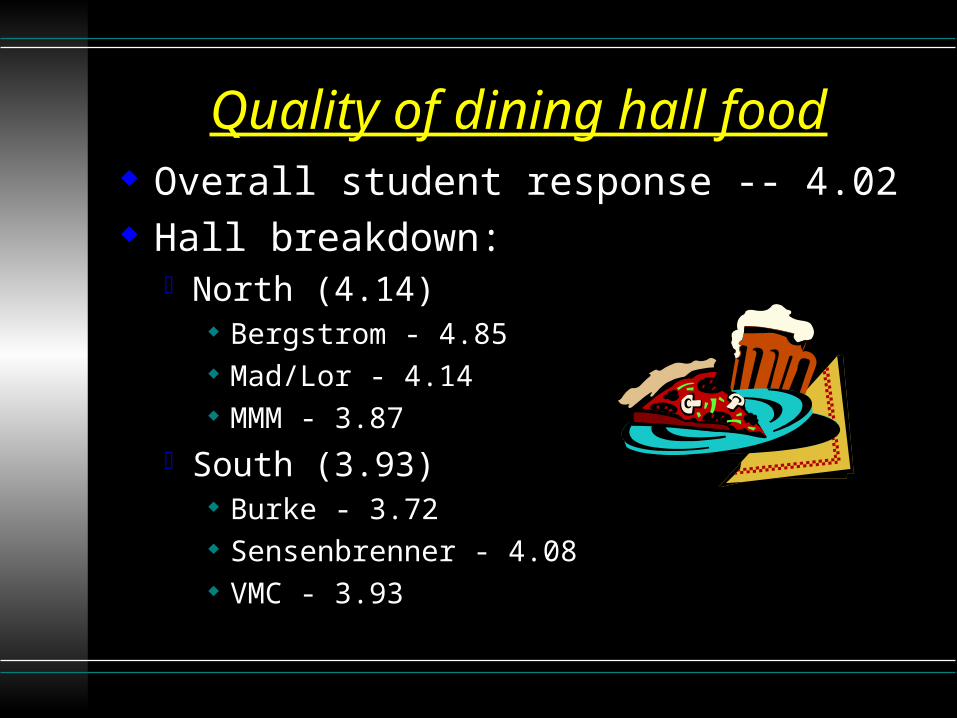
Quality of dining hall food Overall student response -- 4.02 Hall breakdown:
North (4.14) Bergstrom - 4.85 Mad/Lor - 4.14 MMM - 3.87
South (3.93) Burke - 3.72 Sensenbrenner - 4.08 VMC - 3.93
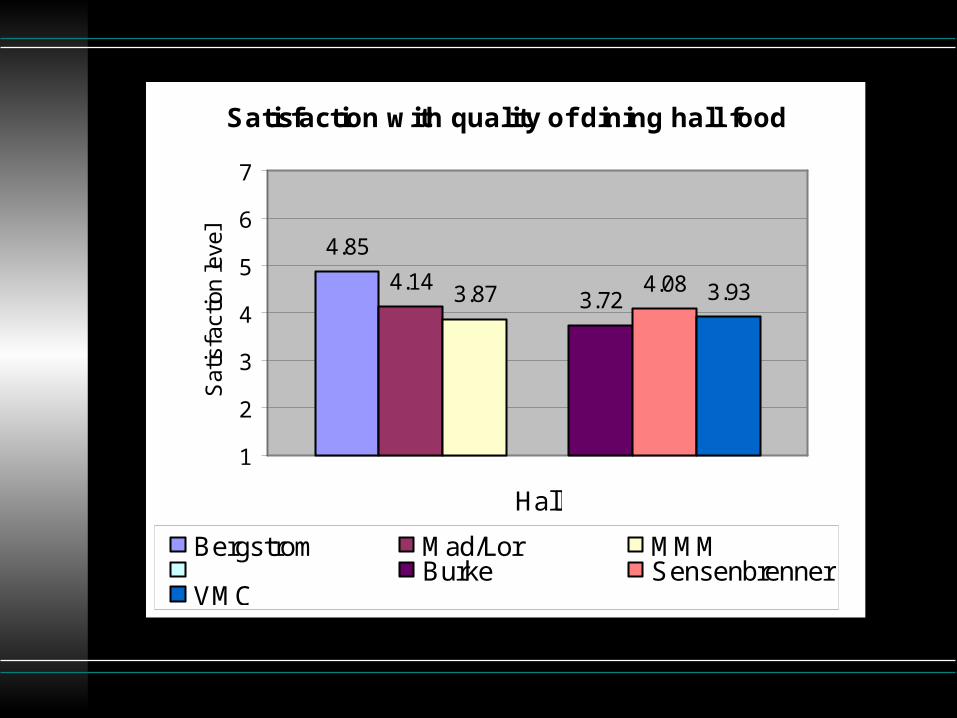
Satisfaction with quality of dining hall food
4.85
4.14 3.87 3.724.08 3.93
1
2
3
4
5
6
7
Hall
Sat
isfa
ctio
n le
vel
Bergstrom Mad/Lor MMMBurke Sensenbrenner
VMC
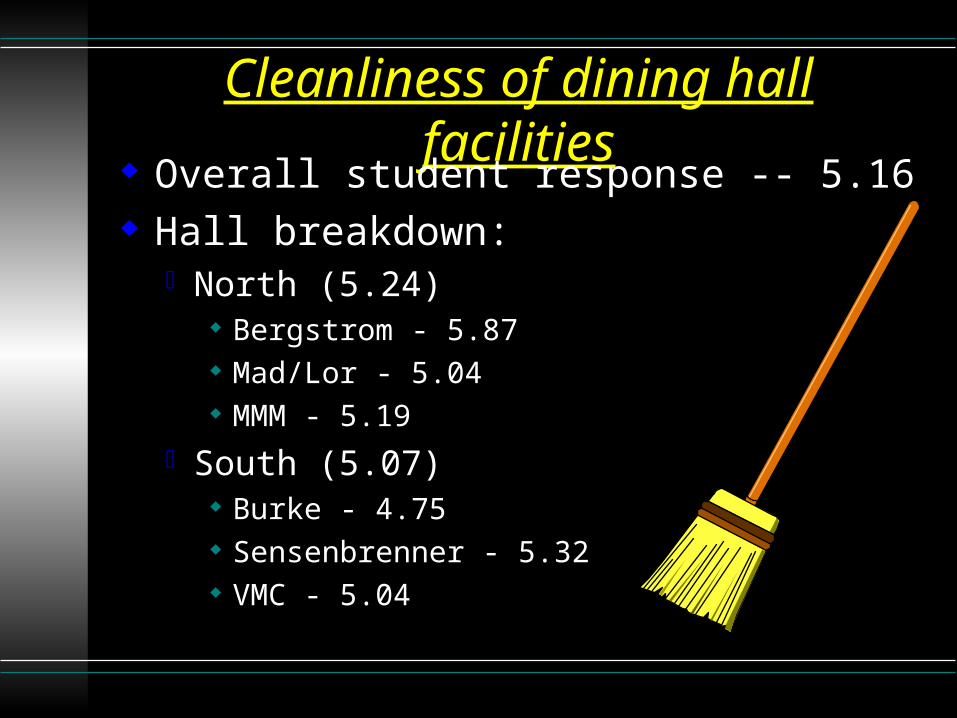
Cleanliness of dining hall facilities Overall student response -- 5.16 Hall breakdown:
North (5.24) Bergstrom - 5.87 Mad/Lor - 5.04 MMM - 5.19
South (5.07) Burke - 4.75 Sensenbrenner - 5.32 VMC - 5.04

Satisfaction with cleanliness of dining hall facilities
5.87 5.04 5.194.75
5.32 5.04
1234567
Hall
Sat
isfa
ctio
n le
vel
Bergstrom Mad/Lor MMMBurke Sensenbrenner
VMC
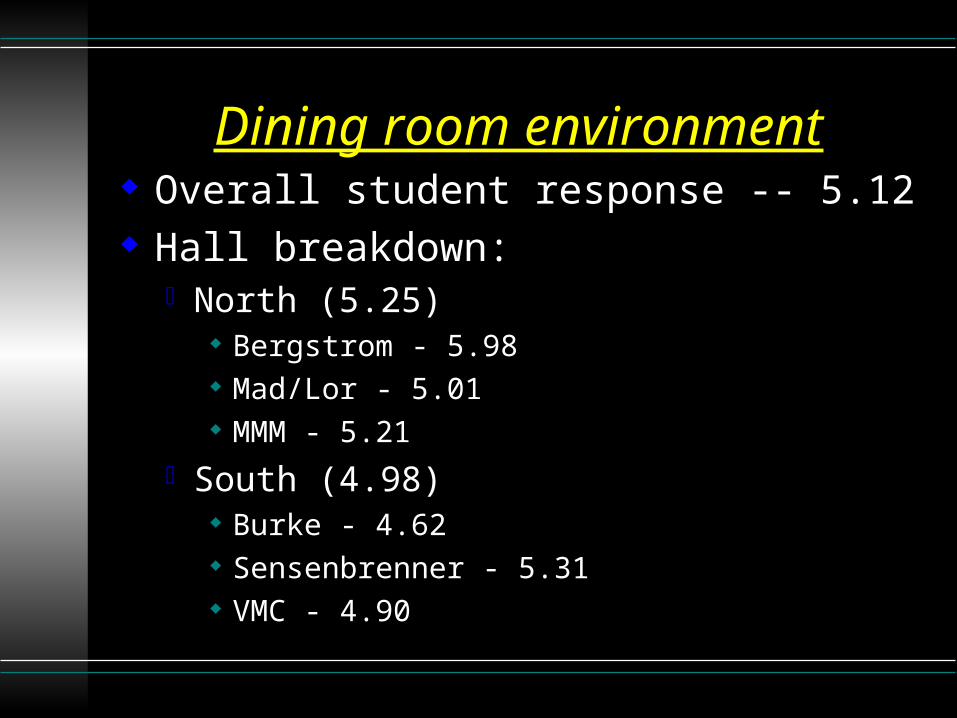
Dining room environment Overall student response -- 5.12 Hall breakdown:
North (5.25) Bergstrom - 5.98 Mad/Lor - 5.01 MMM - 5.21
South (4.98) Burke - 4.62 Sensenbrenner - 5.31 VMC - 4.90
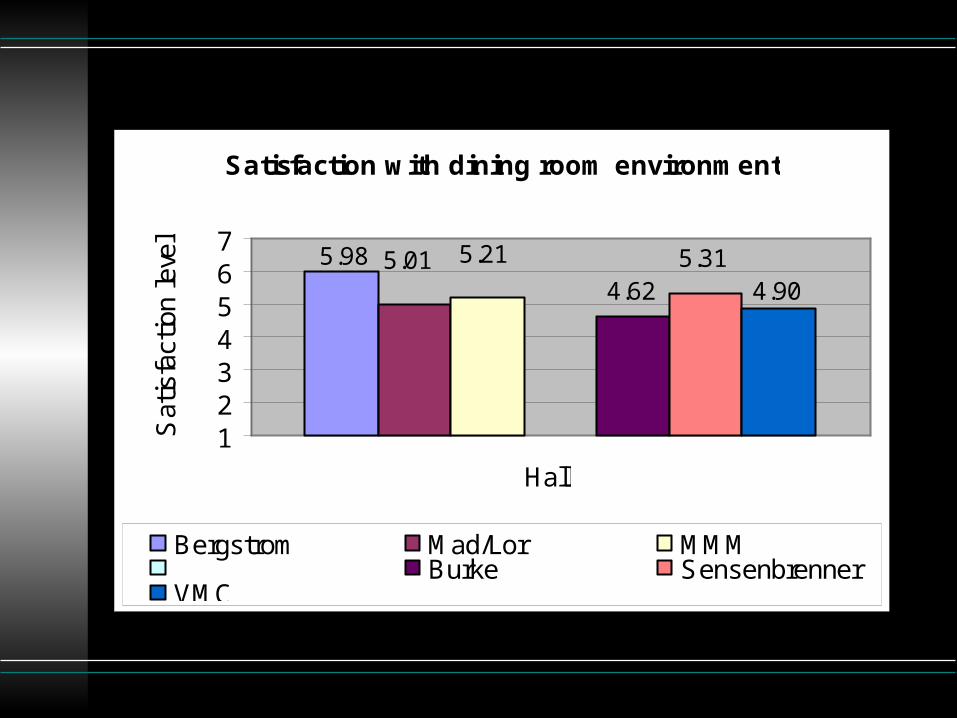
Satisfaction with dining room environment
5.98 5.01 5.21
4.625.31
4.90
1234567
Hall
Sat
isfa
ctio
n le
vel
Bergstrom Mad/Lor MMMBurke Sensenbrenner
VMC
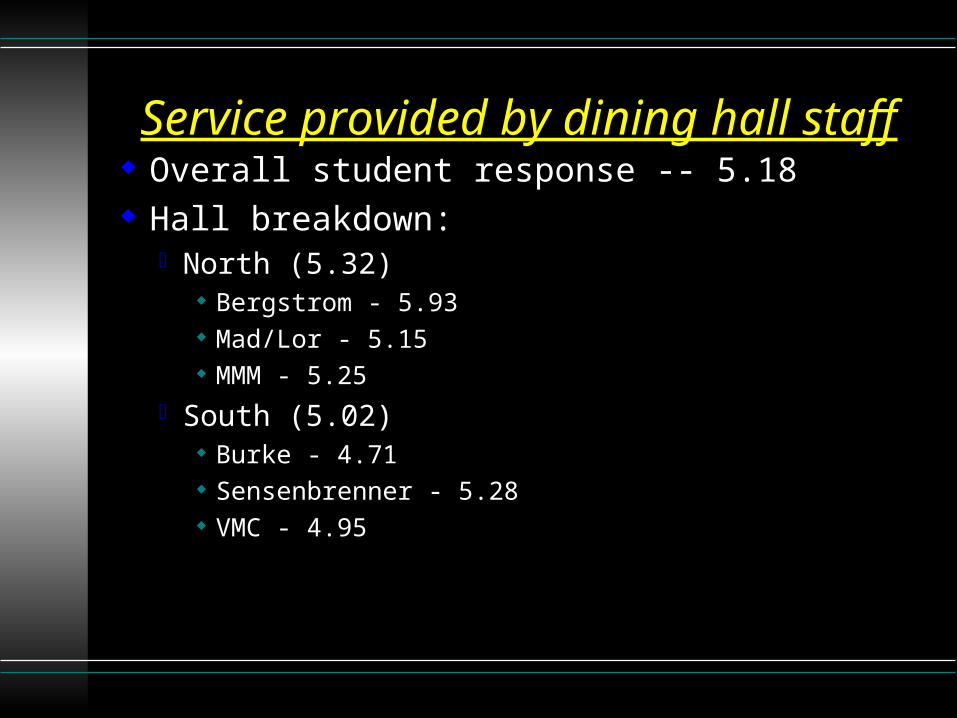
Service provided by dining hall staff Overall student response -- 5.18 Hall breakdown:
North (5.32) Bergstrom - 5.93 Mad/Lor - 5.15 MMM - 5.25
South (5.02) Burke - 4.71 Sensenbrenner - 5.28 VMC - 4.95

Satisfaction with service provided by dining hall staff
4.715.93 5.15 5.25 5.28
4.95
1234567
Hall
Sat
isfa
ctio
n le
vel
Bergstrom Mad/Lor MMMBurke Sensenbrenner
VMC

Dining facility service hours Overall student response -- 4.65 Hall breakdown:
North (4.79) Bergstrom - 5.50 Mad/Lor - 4.72 MMM - 4.59
South (4.43) Burke - 3.98 Sensenbrenner - 4.60 VMC - 4.60
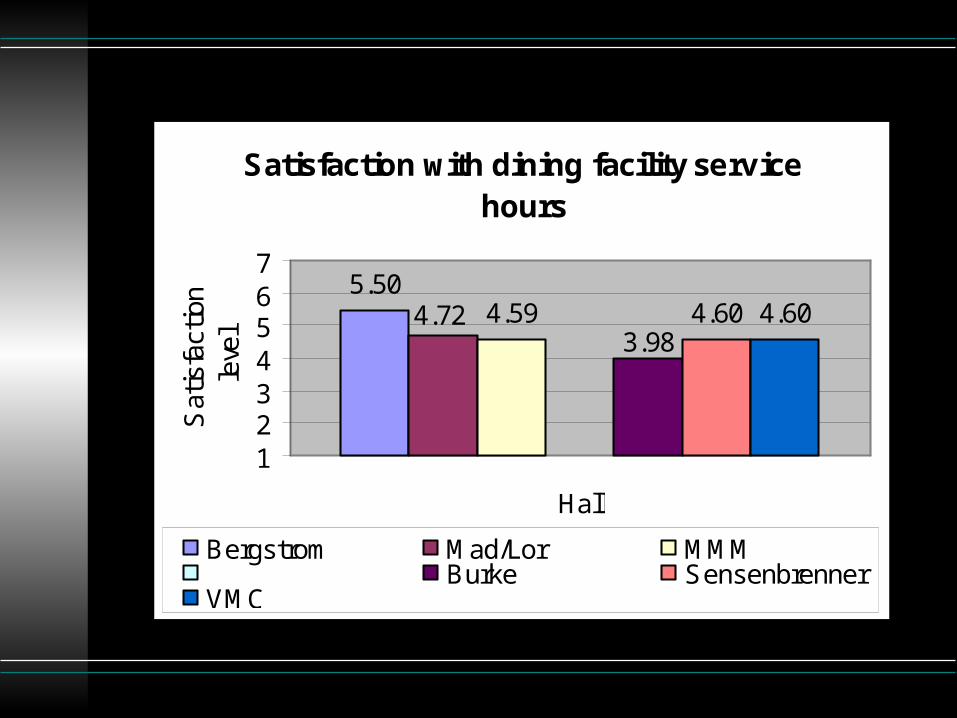
Satisfaction with dining facility service hours
5.504.59 4.60 4.604.72
3.98
1234567
Hall
Sat
isfa
ctio
n le
vel
Bergstrom Mad/Lor MMMBurke Sensenbrenner
VMC

Variety of food plan options Overall student response -- 3.73 Hall breakdown:
North (3.83) Bergstrom - 4.82 Mad/Lor - 3.64 MMM - 3.64
South (3.69) Burke - 3.55 Sensenbrenner - 3.59 VMC - 3.91
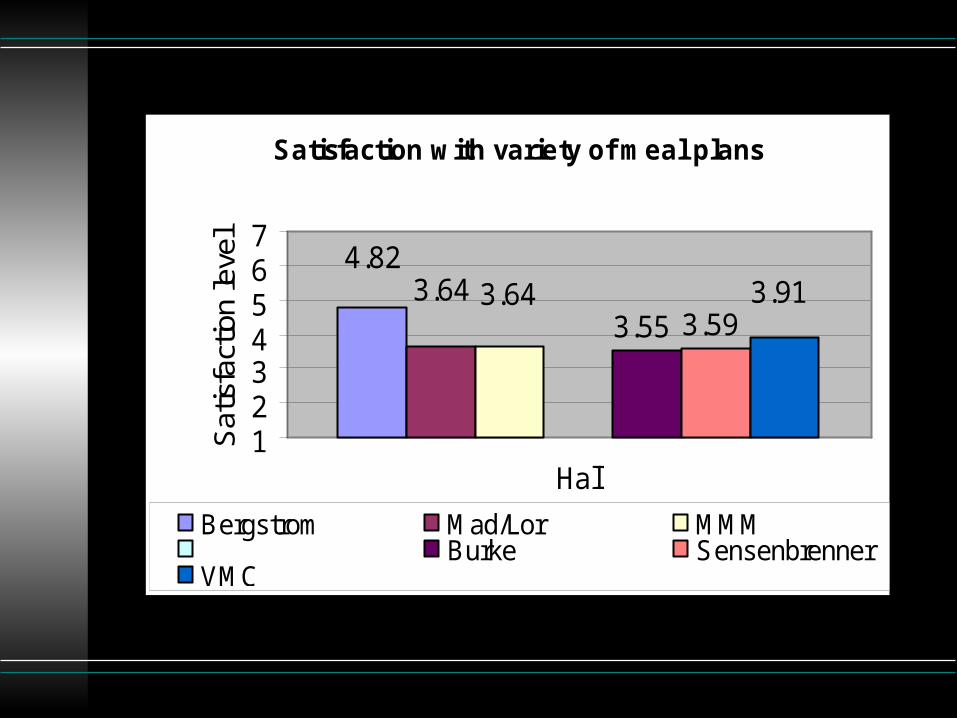
Satisfaction with variety of meal plans
4.823.64 3.64
3.55 3.593.91
1234567
Hall
Sat
isfa
ctio
n le
vel
Bergstrom Mad/Lor MMMBurke Sensenbrenner
VMC
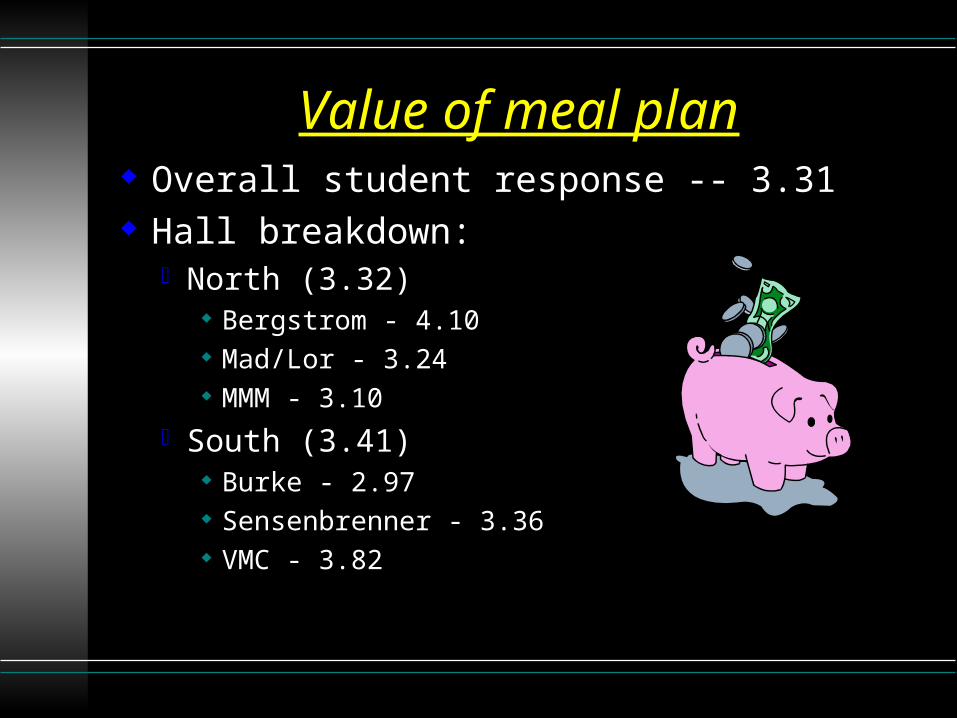
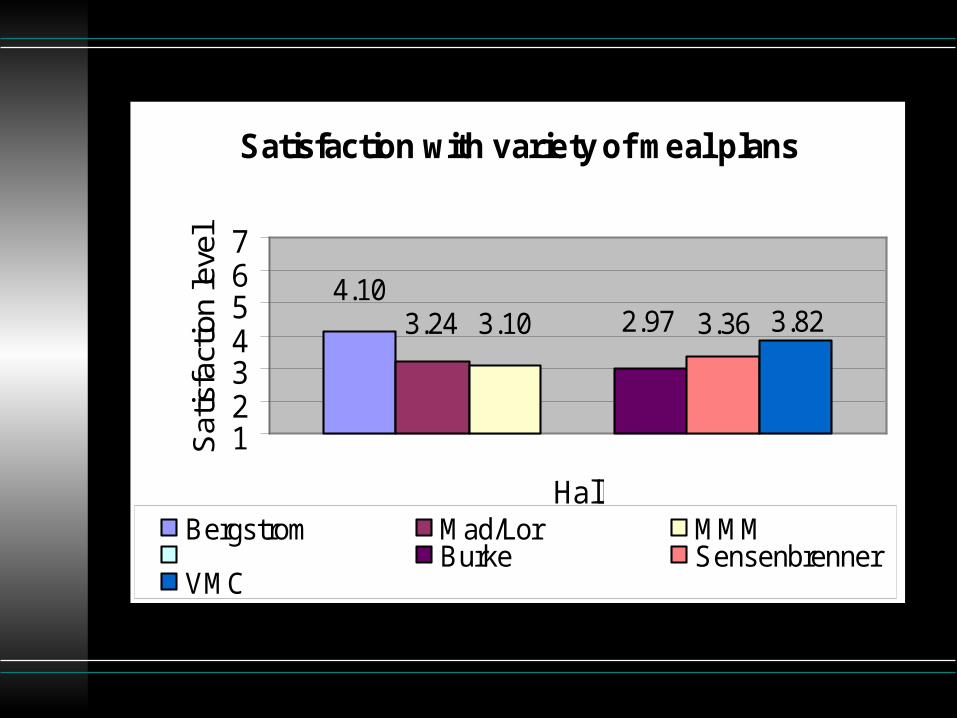
Value of meal plan Overall student response -- 3.31 Hall breakdown:
North (3.32) Bergstrom - 4.10 Mad/Lor - 3.24 MMM - 3.10
South (3.41) Burke - 2.97 Sensenbrenner - 3.36 VMC - 3.82
Satisfaction with variety of meal plans
4.103.24 3.10 2.97 3.36 3.82
1234567
Hall
Sat
isfa
ctio
n le
vel
Bergstrom Mad/Lor MMMBurke Sensenbrenner
VMC
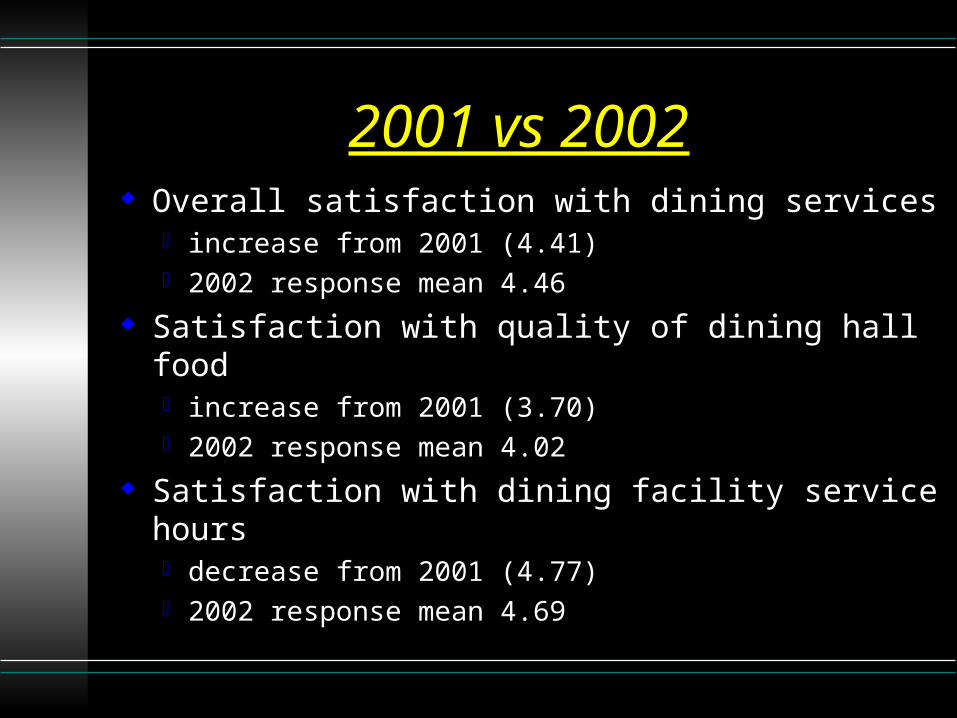
2001 vs 2002 Overall satisfaction with dining services
increase from 2001 (4.41) 2002 response mean 4.46
Satisfaction with quality of dining hall food increase from 2001 (3.70) 2002 response mean 4.02
Satisfaction with dining facility service hours decrease from 2001 (4.77) 2002 response mean 4.69

SNC vs Carnegie Schools Carnegie schools
include: Columbia College-
Missouri Lenoir-Rhyne College Methodist College Ramapo College of New
Jersey Saint Leo University University of Charleston Wingate University
Elmhurst CollegeMerrimack CollegeMillikin UniversityRoger Williams UniversitySt. Norbert CollegeUniverity of the Ozarks
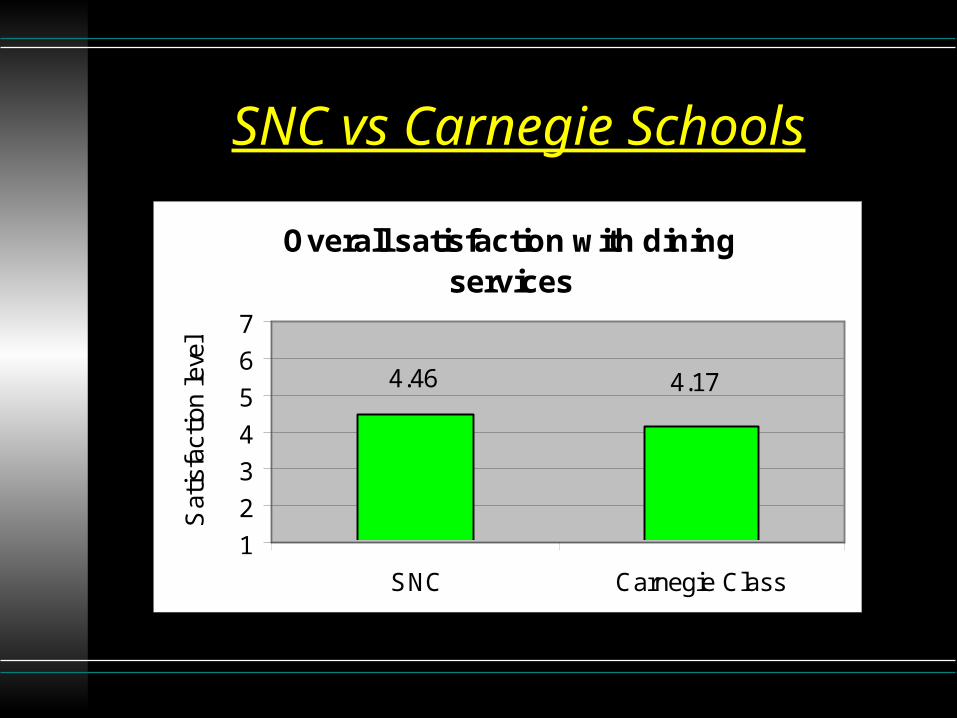
SNC vs Carnegie Schools
Overall satisfaction with dining services
4.174.46
1
2
3
4
5
6
7
SNC Carnegie Class
Sat
isfa
ctio
n le
vel

SNC vs Select Six Schools
Select Six Schools (chosen by SNC) include: Marquette University Millikin University Occidental College John Carroll University Xavier University Canisius College
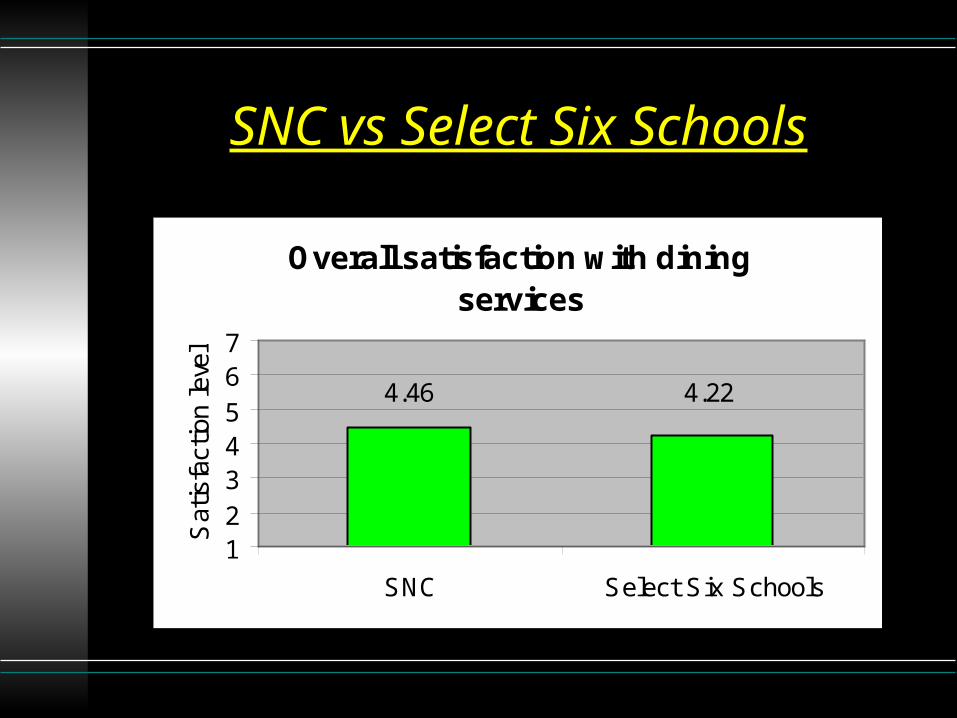
SNC vs Select Six Schools
Overall satisfaction with dining services
4.46 4.22
1234567
SNC Select Six Schools
Sat
isfa
ctio
n le
vel
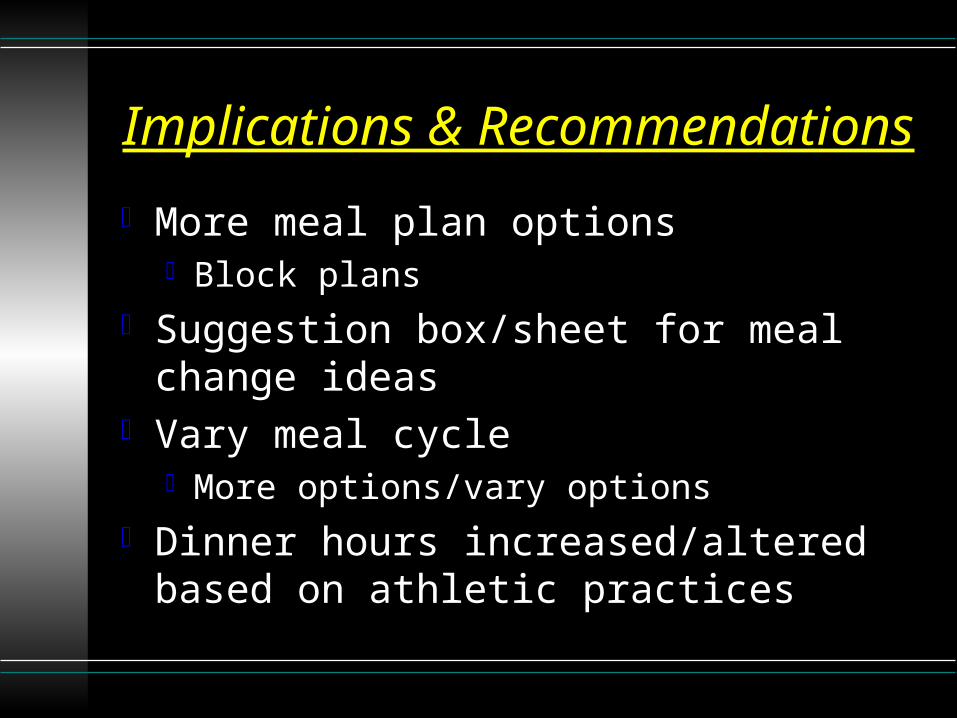
Implications & Recommendations
More meal plan options Block plans
Suggestion box/sheet for meal change ideas
Vary meal cycle More options/vary options
Dinner hours increased/altered based on athletic practices


![The State of Housing Facilities: Trends & Best Practices [ACUHO-i/APPA 2017]](https://img.dokumen.tips/doc/110x75/5a6e195e7f8b9aab3a8b5f0b/the-state-of-housing-facilities-trends-best-practices-acuho-iappa-2017.jpg)