Embed Size (px)
Citation preview

ATTACHMENT 2
Actuarial Report for 2013(Workpaper for Schedule 35 of TO9 Draft Annual Update posted on SCE website June 13, 2014)
Showing information used as inputs for Attachment 1 (TO9 Schedule 35):
1) Forecast PBOPs Expenses (Input on Schedule 35, Note 2, Lines d‐h)
See page 44 of Actuarial Report
2) Cumulative PBOPs Recovery difference (Input on Schedule 35, Note 1)
See last page

SOUTHERN CALIFORNIA EDISON COMPANY
POSTRETIREMENT HEALTH AND LIFE BENEFITS
ACTUARIAL ACCOUNTING REPORT
PLAN YEAR: 2013
Actuarial Report

Southern California Edison Company
TABLE OF CONTENTS
Section Page
I. Executive Summary 1
II. Accounting Results 3
III. Plan Provisions 19
IV. Demographic Data 25
V. Actuarial Assumptions 32
VI. Five-Year Expense Projection 43
Actuarial Report

SECTION I
EXECUTIVE SUMMARY
Actuarial Report

Southern California Edison Company
POSTRETIREMENT HEALTH & LIFE BENEFITS ACTUARIAL ACCOUNTING REPORT
FOR THE 2013 PLAN YEAR
This report provides accounting results for 2013 with respect to Southern California Edison's (Edison's) postretirement welfare benefits, as measured under Accounting Standards Codification (ASC) 715-60 (referred to throughout the report as the Statement of Financial Accounting Standards No. 106: Employers Accounting for Postretirement Benefits Other than Pensions (FAS106)). The liabilities and components of the Net Periodic Postretirement Benefit Cost (NPPBC) for 2013 are as follows (in thousands):
Liabilities as of 1/1/2013 Expected Postretirement Benefit Obligation (EPBO) $2,862,602 Accumulated Postretirement Benefit Obligation (APBO) 2,320,680
Net Periodic Postretirement Benefit Cost (NPPBC) A) Service Cost – End of Year $ 48,690 B) Interest Cost 96,797 C) Expected Return on Plan Assets 114,029 D) Net Amortization Amounts ( 11,461) E) NPPBC [A) + B) – C) + D)] $ 19,997
Actuarial computations under FAS 106 are for purposes of fulfilling certain employer accounting requirements. The calculations reported herein have been made on a basis consistent with our understanding of FAS 106. Determinations for purposes other than meeting the financial accounting requirements of FAS 106 may differ significantly from the results reported herein. In preparing this actuarial valuation, Aon Hewitt has relied on information provided to us concerning plan participants, plan assets and plan provisions. Aon Hewitt considers this information provided to be reasonable. However, we have not audited or independently verified this information. The actuarial assumptions, and accounting methods and policies are the responsibility of the plan sponsor. Aon Hewitt believes the actuarial assumptions used in the calculations are individually reasonable and reasonable in the aggregate. It should be noted, however, that Actuarial Standards of Practice defines an actuary’s best estimate assumption as one that falls within a “range” of potential assumptions. Thus, a different set of actuarial assumptions drawn from the best estimate range could result in reasonable valuation results different from those presented herein. Aon Hewitt’s relationship with the plan and plan sponsor is strictly professional. There are no aspects of the relationship that may impair or appear to impair the objectivity of our work. This report was prepared by the actuaries whose signatures appear below and, unless otherwise indicated, reflects know information as of the signature date. They certify that, to the best of their knowledge, the methods and assumptions used in the determination of Edison's 2013 liabilities and annual cost for postretirement benefits other than pensions are reasonable and conform to Actuarial Standard of Practice No. 6: Measuring Retiree Group Benefit Obligations, and ASOP No. 41: Actuarial Communications. The undersigned are members of the American Academy of Actuaries and meet the Qualification Standards of the American Academy of Actuaries to render the actuarial opinion contained herein
Respectfully submitted,
_______________________________ _________________________________ Jonathan M. Nemeth, FSA, MAAA Stephen J. Hoeffner, FSA, MAAA, EA Senior Vice President Vice President December 12, 2013
Actuarial Report

SECTION II
ACCOUNTING RESULTS
Actuarial Report

Southern California Edison Company
SECTION II – TABLE OF CONENTS
SUB-SECTIONS PAGE
A. Introduction 5
B. Key FAS 106 Components 5
C. Assumptions as to Future Experience 7
D. 2013 Claims Costs 8
E. Market Related Value of Assets 8
F. Plan Provisions 9
G. Demographic Data 9
H. Non-Regulated Enterprises 9
I. Projected Annual Postretirement Pay-As-You-Go Claims 9
J. Employer Group Waiver Plan 9
K. Impact of the Patient Protection and Affordable Care Act of 2010 10
EXHIBITS
1. Expected and Accumulated Postretirement Benefit Obligations and Service Cost at January 1, 2013 12
2. 10 Year Projected Postretirement Pay-As-You-Go Claims 13
3. Determination of 2013 Net Periodic Postretirement Benefit Cost (FAS 106) 14
4. Development of (Accrued)/Prepaid Benefit Cost (FAS 106) 15
5. Development of Unrecognized Net (Gains)/Losses (FAS 106) 16
6. Development of Market Value of Assets as of December 31, 2012 17
7. Development of Prior Service Cost at January 1, 2013 18
Actuarial Report

Southern California Edison Company
5
A. Introduction
Statement of Financial Accounting Standards No. 106 (FAS 106) requires accounting for postretirement benefits other than pensions (PBOP) on an accrual basis. Southern California Edison (Edison) requested that Aon Hewitt determine its 2013 PBOP liabilities and expense. Pursuant to this request, an actuarial valuation of PBOP liabilities was performed as of January 1, 2013, reflecting the plan provisions in effect at that date.
B. Key FAS 106 Components A description of some of the key components of FAS 106 follows: 1. Expected Postretirement Benefit Obligation (EPBO) The EPBO is equal to the actuarial present value of future benefit payments. It is
estimated by projecting all future liabilities of current active employees who will retire in the future and retired employees at a given level of trend selected in accordance with FAS 106. These liabilities are then discounted based on the discount rate assumption. Exhibit 1 shows the EPBO as of the January 1, 2013 valuation date.
2. Accumulated Postretirement Benefit Obligation (APBO) The APBO is equal to the actuarial present value of future benefit payments that are
considered accrued to date. For retired employees and active employees who are eligible to retire, the APBO equals their EPBO. Exhibit 1 shows the APBO as of the January 1, 2013 valuation date.
3. Net Periodic Postretirement Benefit Cost The total FAS 106 net periodic postretirement benefit cost accrued during any year is
comprised of the following components:
Service Cost: The cost of benefit accruals attributed to the current year, developed on the same basis as the APBO. Service cost will generally be the expected postretirement benefit obligation divided by the expected credited service at eligibility for full benefits. There is no service cost where a participant is currently eligible for full benefits, or is currently receiving benefits. Service cost includes interest to the end of the year. Exhibit 1 shows the service cost as of the January 1, 2013 valuation date (without interest to the end of the year).
Interest Cost:
Interest on the liability for benefits attributed to past service (i.e. the APBO), adjusted for benefit payments.
POSTRETIREMENT HEALTH & LIFE BENEFITS ACTUARIAL ACCOUNTING REPORT
FOR THE 2013 PLAN YEAR
Actuarial Report
Southern California Edison Company
6
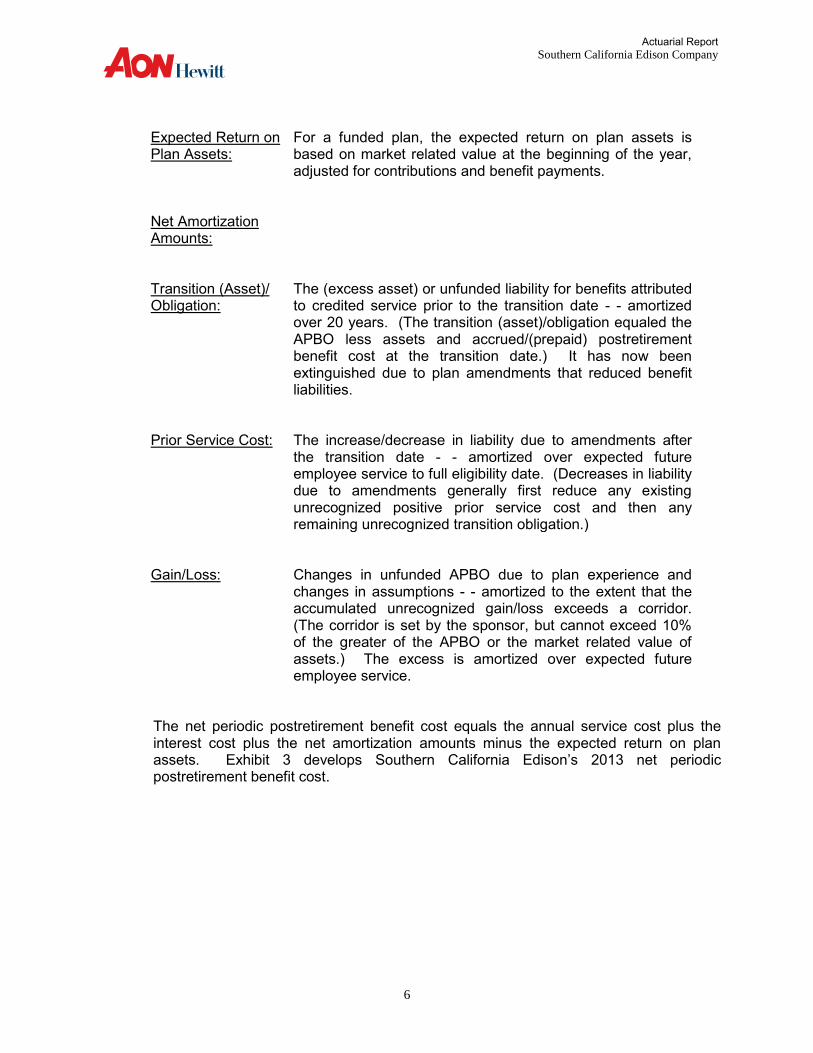
Expected Return on Plan Assets:
For a funded plan, the expected return on plan assets is based on market related value at the beginning of the year, adjusted for contributions and benefit payments.
Net Amortization Amounts:
Transition (Asset)/ Obligation:
The (excess asset) or unfunded liability for benefits attributed to credited service prior to the transition date - - amortized over 20 years. (The transition (asset)/obligation equaled the APBO less assets and accrued/(prepaid) postretirement benefit cost at the transition date.) It has now been extinguished due to plan amendments that reduced benefit liabilities.
Prior Service Cost: The increase/decrease in liability due to amendments after the transition date - - amortized over expected future employee service to full eligibility date. (Decreases in liability due to amendments generally first reduce any existing unrecognized positive prior service cost and then any remaining unrecognized transition obligation.)
Gain/Loss: Changes in unfunded APBO due to plan experience and changes in assumptions - - amortized to the extent that the accumulated unrecognized gain/loss exceeds a corridor. (The corridor is set by the sponsor, but cannot exceed 10% of the greater of the APBO or the market related value of assets.) The excess is amortized over expected future employee service.
The net periodic postretirement benefit cost equals the annual service cost plus the
interest cost plus the net amortization amounts minus the expected return on plan assets. Exhibit 3 develops Southern California Edison’s 2013 net periodic postretirement benefit cost.
Actuarial Report
Southern California Edison Company
7
C. Assumptions As To Future Experience To determine the actuarial present value of the liabilities for postretirement benefits, estimates must be made of the benefits that will be paid in future years on behalf of (1) existing retirees and, (2) after retirement, on behalf of all currently active employees. In addition, it is necessary to estimate the premiums that retirees will be required to contribute in order to receive the projected level of coverage. These benefits and contributions are then discounted to the valuation date using actuarial assumptions selected in accordance with FAS 106. These assumptions are summarized in Section V. For these calculations, experience is analyzed and actuarial assumptions are developed. Assumptions include: mortality rates for active and retired employees, withdrawal rates, disability retirement rates, retirement rates, the long-term average rate of earnings on Trust fund assets, the percentage of retirees with spouses at retirement, current health benefit costs, and the trend in future health benefit costs. The major actuarial assumptions underlying the PBOP liabilities are as follows:
1. Mortality, Termination, Disability and Retirement Rates, and Dependent Assumptions The mortality, termination, disability and retirement rates used in the postretirement
health and life insurance benefit valuations are consistent with those used for the 2013 FAS 87 valuation of the Southern California Edison Company Retirement Plan (“Retirement Plan”). These assumptions are shown in Section V.
2. Discount Rate and Expected Investment Returns The discount rate assumption for FAS 106 purposes is 4.25%. (The discount rate as of
January 1, 2012 was 4.75%) The assumptions for the expected return on assets are 5.00% for the 1992 and 1999 VEBAs, and 7.00% for all non-taxable assets (The expected return on assets reflected in 2012 expense were 5.00% for taxable assets and 7.50% for all non-taxable).
3. Health Care Cost Gross Trend Rates
Trend rates reflect expected increases in per capita health benefit claims costs from
factors such as health care cost inflation, increasing utilization, cost shifting by healthcare providers, governmental agencies, and technological and pharmacological advances. Assumed trend rates (i.e., gross rates) for the 2013 actuarial valuation, were the same as those reflected in the 2012 FAS106 valuation, except that, consistent with December 31, 2012 corporate financial statement disclosure information, the ultimate trend rate was reduced from 5.25% to 5.00%. These assumptions are shown in Section V.
Health care cost trend rates do not take into account anticipated changes in the future
demographic composition of the employees, retirees or their eligible dependents. That variable is provided for by the age adjustment factors applied to Edison's composite
Actuarial Report

Southern California Edison Company
8
claims costs. The trend rates also do not reflect any future changes in plan provisions or legislation.
These assumptions in combination reflect the actuary's best judgment of future events.
D. 2013 Claims Costs
Due to the lack of credible 2012 and preliminary 2013 self-insured claim experience, Aon Hewitt relied on self-insured claim experience utilized in the 2012 Southern California Edison Postretirement Health and Life Actuarial Accounting Report. In general, this claim data was for 2011 and prior periods. For both PrimeCare and Flex the medical claims costs were developed by averaging the projected historical self-insured 2011 and prior claim experience with the 2013 fully insured premium rates. Consistent with December 31, 2012 corporate financial statement disclosure information, post-65 claims costs were further adjusted to reflect the January 1, 2013 implementation of a self-insured, customized Medicare Part D prescription drug plan (referred to throughout this report as an Employer Group Waiver Plan or “EGWP”.) Primecare and Flex per capita claims costs shown in this report are net of retiree contributions. To adjust gross claims costs for retiree contributions, determined under the plan’s Lowest Cost Option pricing methodology, the average future pricetag of the Lowest Cost Option available in each geographic area was assumed to be 15%/20% lower than the average future cost of all postretirement health benefit options available in that area for retirees under/over age 65. Relativity factors were applied to the medical claims costs to develop claims costs by quinquennial age group. In addition, for Flex retirees, claim costs were further adjusted for estimated cost differences between management and represented retirees. Dental and vision claim costs were estimated based on the 2013 price tags utilized by Southern California Edison for benefit pricing purposes.
E. Market Related Value of Assets
The market related value of assets is determined at market value. Asset data as of January 1, 2013 was supplied by Edison. Exhibit 6 shows a reconciliation of January 1, 2013 asset data with prior year’s assets.
Actuarial Report

Southern California Edison Company
9
F. Plan Provisions Postretirement health and life benefit plan provisions (including any substantive commitments), which are reflected in the January 1, 2013 actuarial valuation, are described in Section III. As required by FAS 106, this valuation assumes that those plans provisions will continue in effect. However, this assumption does not imply any obligation by Edison to continue the plans. There were no plan amendments since the January 1, 2012 actuarial valuation. Based upon discussion with Southern California Edison, the 2013 EGWP implementation was not considered a plan amendment since the benefits received by retirees did not materially change.
G. Demographic Data PBOP liabilities and expense as of the January 1, 2013 valuation date reflect active and retiree census data from mid-2013 that was adjusted by Aon Hewitt to be representative of the data as of January 1, 2013. A summary of the adjusted census data is shown in Section IV. This data was found to be reasonable and consistent with other data available to the actuary. The data for retirees excludes retirement plan participants with deferred vested benefits since they are not eligible for postretirement health and life insurance benefits. The census data includes Management and Represented participants.
H. Non-Regulated Enterprises The valuation excludes all non-regulated enterprises.
I. Projected Annual Postretirement Pay-As-You-Go Claims A ten-year projection of annual postretirement health and life pay-as-you-go claims is shown in Exhibit 2. These amounts are net of retiree contributions and are after reflecting the implementation of the EGWP, and expected payments under the Early Retirement Reinsurance Program.
J. Employer Group Waiver Plan Effective January 1, 2013, prescription drug coverage for Medicare eligible retirees (not enrolled in the Kaiser Medicare Advantage option) is being provided through an Edison sponsored EGWP. The EGWP replaced the commercial prescription drug benefit provided to these retirees in 2012 and prior years. As a result of this change, Edison is no longer eligible for the Medicare Part D subsidy benefit on post-2012 Medicare eligible prescription drug claims. In place of the Medicare Part D subsidy, Edison is eligible to receive different government subsidies, as well as payments from pharmaceutical manufacturers.
Actuarial Report

Southern California Edison Company
10
Overall, the impact of implementing the EWGP was a reduction in Edison’s postretirement health benefits liability. For Primecare retirees, since retirees do not contribute for coverage, 100% of the EGWP savings were assumed to reduce employer cost. For Grandfathered Flex retirees, EGWP savings, reflecting both government and pharmaceutical manufacturer revenue, were assumed to be incorporated into the Edison contribution strategy. As a result, EGWP savings were shared by Edison and Medicare eligible retirees, consistent with the overall contribution strategy. For Non-grandfathered Flex retirees, Edison’s costs are capped. Since the caps were not changed, the implementation of the EGWP did not reduce employer cost.
Aon Hewitt adjusted the 2013 claims costs to reflect the implementation of the EGWP. In addition, the projected 2014 through 2020 claims costs were adjusted to reflect the expected impact of future increases in government reimbursements for prescription drug claims under the EGWP, as promulgated under current law. (Increases in claims costs for post-65 Primecare/Flex retirees were reduced 0.5%/0.3% for the years 2013 through 2020.)
K. Impact of the Patient Protection and Affordable Care Act of 2010 The January 1, 2013 actuarial valuation takes into account the anticipated impact of the Patient Protection and Affordable Care Act of 2010 (ACA). The provisions of this legislation that have impacted, or are expected to impact Edison postretirement health benefit cost (i) extend coverage of children of retirees to age 26 and eliminate most lifetime benefit maximums, (ii) provide for Early Retirement Reinsurance Program (ERRP) payments for some postretirement health benefit claims, (iii) reduce government payments to Medicare HMOs, and (iv) levy excise taxes on certain high cost health benefit options. The provisions of ACA that extended health coverage for children of retirees to age 26 and eliminated most lifetime health benefit maximum payment amounts were reflected in 2011 postretirement health benefit claims, and therefore in expected 2013 per capita costs. The ERRP program covered claims by retirees (including their dependents) who are not Medicare eligible that are between $15,000 and $90,000 (for any individual). ERRP program payments were placed in a separate account as received. Edison shared some of these payments with active employees and retirees in 2012, but these incurred costs have not yet been reimbursed from the separate account. It was assumed for actuarial valuation purposes that all separate account funds will be used to reduce net Edison-paid 2013 postretirement health benefit claims costs. Changes in the methodology used by the government to reimburse Medicare HMOs may impact the premiums charged by these HMOs to employers. However, because Edison utilizes a “relative value pricing methodology” to develop annual price tags, any impact of these government changes will be spread over all plan options, which mitigates the impact on expected future changes in Edison cost. Excise taxes on high cost health benefit options (the so-called “Cadillac Tax”) begin in 2018. Because of this delayed effective date, Edison has not yet developed a strategy concerning
Actuarial Report

Southern California Edison Company
11
how the cost of any future excises taxes will be split between the Company and retirees. Based on discussions with Edison, the best interpretation of the existing pricing strategy for retirees subject to the LCO feature is to assume that any future excise taxes levied on higher cost options will effectively be paid 100% by both grandfathered and non-grandfathered (i.e., capped) Flex retirees. Thus, no financial impact was reflected in Edison’s postretirement health benefit costs. The (predominately Medicare–eligible) PrimeCare retiree population will be minimal by the time future excise taxes would likely apply to that group. Thus, no loading of future benefit costs was considered necessary to reflect the impact on Edison cost of expected future ACA excise taxes on high cost options for either Flex or PrimeCare retirees.
Actuarial Report

Southern California Edison Company
Exhibit 1
12
Represented Management Life
Employees Employees* Insurance Total
A. EPBO $ 979,393 $1,835,284 $ 47,925 $2,862,602
B. APBO
1. Retirees 468,166 790,983 29,460 1,288,609
2. Actives
a. Fully Eligible 152,526 262,812 8,406 423,744
b. Other 199,240 402,947 6,140 608,327
c. Total Actives $ 351,766 $ 665,759 $ 14,546 $1,032,071
3. Total APBO $ 819,932 $1,456,742 $ 44,006 $2,320,680
C. Service Cost $ 12,994 $ 33,167 $ 544 $ 46,705
* Includes " Pay-as you-go" management retirees
Expected, Accumulated Postretirement Benefit Obligation
And Service Cost At January 1, 2013
(in $ thousands)
Actuarial Report

Southern California Edison Company
Exhibit 2
13
Represented Management Life
Year Employees Employees Insurance Total
2013 $ 31,754 $ 53,613 $ 1,779 $ 87,146
2014 34,007 57,607 1,817 93,431
2015 36,339 62,144 1,852 100,335
2016 38,613 65,939 1,885 106,437
2017 40,634 70,166 1,917 112,717
2018 42,516 74,038 1,951 118,505
2019 44,257 77,491 1,986 123,734
2020 45,669 81,115 2,026 128,810
2021 46,764 84,752 2,069 133,585
2022 47,959 87,966 2,117 138,042
* Net of retiree contributions and ERRP program payments.
10 Year Projected Postretirement Pay-As-You-Go Claims*
(in $ thousands)
Actuarial Report

Southern California Edison Company
Exhibit 3
14
Represented Management Life
Employees Employees Insurance Total
A. Service Cost (EOY) $ 13,546 $ 34,577 $ 567 $ 48,690
B. Interest Cost at 4.25% on:
1. APBO $ 34,847 $ 61,912 $ 1,870 $ 98,629
2. Expected Benefit Payments 668 1,127 37 1,832
3. Total = (1) - (2) $ 34,179 $ 60,785 $ 1,833 $ 96,797
C. Expected Return on Assets: *
1. Market Value of Assets $ 66,056 $ 49,141 $ 945 $116,142
2. Expected Benefit Payments 1,093 1,040 61 2,194
3. Expected Contributions 0 55 26 81
4. Total = (1) - (2) + (3) $ 64,963 $ 48,156 $ 910 $114,029
D. Amortization Amounts:
1. Transition (Asset)/Obligation $ 0 $ 0 $ 0 $ 0
2. Prior Service Cost ( 14,575) ( 21,250) 347 ( 35,478)
3. Net (Gain)/Loss 8,486 15,076 455 24,017
4. Total = (1) + (2) + (3) ($ 6,089) ($ 6,174) $ 802 ($ 11,461)
E. Net Periodic Postretirement Benefit Cost
= (A) + (B3) - (C4) + (D4) ($ 23,327) $ 41,032 $ 2,292 $ 19,997
* Interest rate for return on assets for 1992 VEBA trust is 5.0%, for 1999 VEBA trust is 5.0%, and for other funding vehicles is 7.0%.
Determination of 2013 Net Periodic Postretirement Benefit Cost (FAS 106)
(in $ thousands)
Actuarial Report

Southern California Edison Company
Exhibit 4
15
Represented Management Life
Employees Employees Insurance Total
A. Funded Status at 1/1/2013
1. APBO $ 819,932 $1,456,742 $ 44,006 $2,320,680
2. Market Value of Assets 943,657 784,891 13,505 1,742,053
3. Funded Status = (2) - (1) $ 123,725 ($ 671,851) ($ 30,501) ($ 578,627)
4. Unrecognized Transition
(Asset)/Obligation 0 0 0 0
5. Unrecognized Prior Service
Cost ( 49,043) ( 41,286) 776 ( 89,553)
6. Unrecognized Net
(Gain)/Loss 192,115 326,947 18,029 537,091
7. (Accrued)/Prepaid Benefit
Cost = (3) + (4) + (5) + (6) $ 266,797 ($ 386,190) ($ 11,696) ($ 131,089)
B. Reconciliation of Funded Status
1. (Accrued)/Prepaid Benefit
Cost at 1/1/2012 $ 256,344 ($ 377,547) ($ 10,165) ($ 131,368)
2. NPPBC for 2012 ( 10,453) 57,544 2,531 49,622
3. Special termination benefits charges 0 2,500 0 2,500
4. 2012 Contributions 0 50,555 1,000 51,555
5. Adjustment 0 846 0 846
6. (Accrued)/Prepaid Benefit Cost
at 12/31/2012 = (1)-(2)-(3)+(4)+(5) $ 266,797 ($ 386,190) ($ 11,696) ($ 131,089)
Development of (Accrued)/Prepaid Benefit Cost (FAS 106)
(in $ thousands)
Actuarial Report

Southern California Edison Company
Exhibit 5
16
Represented Management Life
Employees Employees Insurance Total
A. APBO (Gain)/Loss For 2012
1. APBO at 1/1/2012 $ 829,807 $1,435,745 $ 39,814 $2,305,366
2. Service Cost at EOY 13,717 32,618 538 46,873
3. Expected 2012 Benefit Payments 31,917 51,366 1,735 85,018
4. Interest Cost 38,667 66,992 1,850 107,509
5. Plan Amendment 0 0 0 0
6. Special Termination Benefit Charge 0 2,500 0 2,500
7. Adjustment 0 ( 846) 0 ( 846)
8. Expected APBO at 12/31/2012
= (1)+(2)-(3)+(4)+(5)+(6)+(7) $ 850,274 $1,485,643 $ 40,467 $2,376,384
9. Actual APBO at 1/1/2013 819,932 1,456,742 44,006 2,320,680
10. 2012 (Gain)/Loss = (9) - (8) ($ 30,342) ($ 28,901) $ 3,539 ($ 55,704)
B. Asset (Gain)/Loss For 2012
1. MV of Assets at 1/1/2012 $ 846,799 $ 693,383 $ 12,217 $1,552,399
2. 2012 Contribution* 0 50,555 1,000 51,555
3. Expected 2012 Benefit Payments 31,917 51,366 1,735 85,018
4. Expected Return on Assets 62,335 45,166 879 108,380
5. Expected MV of Assets at 12/31/2012
= (1) + (2) - (3) + (4) $ 877,217 $ 737,738 $ 12,361 $1,627,316
6. MV of Assets at 12/31/2012 943,657 784,891 13,505 1,742,053
7. 2012 Asset (Gain)/Loss
= (5) - (6) ($ 66,440) ($ 47,153) ($ 1,144) ($ 114,737)
C. Unrecognized Net (Gain)/Loss and Amortization
1. Net (Gain)/Loss at 1/1/2012 $ 302,970 $ 427,351 $ 16,309 $ 746,630
2. 2012 APBO (Gain)/Loss ( 30,342) ( 28,901) 3,539 ( 55,704)
3. 2012 Asset (Gain)/Loss ( 66,440) ( 47,153) ( 1,144) ( 114,737)
4. Total (Gain)/Loss = (2) + (3) ($ 96,782) ($ 76,054) $ 2,395 ($ 170,441)
5. Net (Gain)/Loss Amortized in 2012 14,073 24,350 675 39,098
6. Net (Gain)/Loss at 12/31/2012 192,115 326,947 18,029 537,091
7. Max[APBO, Asset] N/A N/A N/A 2,320,680
8. Corridor = 10% of (7) N/A N/A N/A 232,068
9. Amortizable Net (Gain)/Loss ** 107,769 191,470 5,784 305,023
10. Amortization Period 12.7 12.7 12.7 12.7
11. Amortization Amount $ 8,486 $ 15,076 $ 455 $ 24,017
* Includes claims for "Pay-as-you-go" management retirees.
** Allocated based on APBO.
Development of Unrecognized Net (Gains)/Losses (FAS 106)
(in $ thousands)
Actuarial Report

Southern California Edison Company
Exhibit 6
17
Represented Life
VEBA 401(h) VEBA Total VEBA Total
Assets at 12/31/2011 $ 846,799 $ 429,119 $ 264,264 $ 693,383 $ 12,217 $1,552,399
Additions
Contributions $ 0 $ 15,000 $ 18,254 $ 33,254 $ 1,000 $ 34,254
Interest 9,029 3,971 2,531 6,502 0 15,531
Dividends 9,481 420 4,903 5,323 137 14,941
Realized Gain/(Loss) 21,987 10,262 ( 3,398) 6,864 226 29,077
Unrealized Gain/(Loss) 87,875 47,904 28,642 76,546 1,074 165,495
Change in Accrued Income ( 643) 0 ( 24) ( 24) 6 ( 661)
Transfers In 0 0 0 0 0 0
Other 4,703 284 43 327 0 5,030
Total Additions $ 132,432 $ 77,841 $ 50,951 $ 128,792 $ 2,443 $ 263,667
Disbursements
2012 Reimbursements Paid in 2012 $ 0 $ 0 $ 0 $ 0 $ 833 $ 833
2012 Reimbursements Paid in 2013 33,181 11,192 22,213 33,405 289 66,875
Administrative Expenses:
Investment Management Fees 1,517 710 335 1,045 7 2,569
Actuarial, Audit and Consulting Fees 229 111 117 228 17 474
Custodial/trustee Fees 249 89 130 219 9 477
Recordkeeping Fees 398 0 479 479 0 877
Other Fees 0 26 0 26 0 26
Income Taxes - IRS 0 0 1,289 1,289 0 1,289
Income Taxes - FTB 0 0 593 593 0 593
Transfers Out 0 0 0 0 0 0
Other 0 0 0 0 0 0
Total Disbursements $ 35,574 $ 12,128 $ 25,156 $ 37,284 $ 1,155 $ 74,013
Net Change $ 96,858 $ 65,713 $ 25,795 $ 91,508 $ 1,288 $ 189,654
Assets at 12/31/2012 $ 943,657 $ 494,832 $ 290,059 $ 784,891 $ 13,505 $1,742,053
Management
Development of Market Value of Assets as of December 31, 2012
(in $ thousands)
Actuarial Report

Southern California Edison Company
Exhibit 7
18
Represented Management Life
Employees Employees Insurance Total
Prior Service Cost #1
Unrecognized Amount ($ 19,284) ($ 49,489) $ 776 ($ 67,997)
Amortization Amount ($ 8,635) ($ 22,164) $ 347 ($ 30,452)
Prior Service Cost #2
Unrecognized Amount ($ 11,058) $ 0 $ 0 ($ 11,058)
Amortization Amount ($ 3,455) $ 0 $ 0 ($ 3,455)
Prior Service Cost #3
Unrecognized Amount ($ 6,166) $ 0 $ 0 ($ 6,166)
Amortization Amount ($ 1,233) $ 0 $ 0 ($ 1,233)
Prior Service Cost #4
Unrecognized Amount ($ 13,644) ($ 771) $ 0 ($ 14,415)
Amortization Amount ($ 1,375) ($ 78) $ 0 ($ 1,453)
Prior Service Cost #5
Unrecognized Amount $ 1,109 $ 8,974 $ 0 $ 10,083
Amortization Amount $ 123 $ 992 $ 0 $ 1,115
Total Prior Service Cost
Unrecognized Amount ($ 49,043) ($ 41,286) $ 776 ($ 89,553)
Amortization Amount ($ 14,575) ($ 21,250) $ 347 ($ 35,478)
Development of Prior Service Cost at January 1, 2013
(in $ thousands)
Actuarial Report

SECTION III
PLAN PROVISIONS
Actuarial Report

Southern California Edison Company
20
A. Eligibility
Retired employees who were hired before 8/1/83 and attained at least age 55, and their
eligible dependents.
Retired employees who were hired on or after 8/1/83, attained at least age 55 and had at least 10 years of service, and their eligible dependents.
Eligible retirees and survivors may participate in any available health care plan in their
geographic area.
Employees who retire under special early retirement windows or through severance programs may have retiree health care eligibility with different provisions.
In addition, survivors of certain retired and active employees are eligible for health
benefits:
Surviving spouses or eligible domestic partners of eligible retirees, and their eligible dependents.
Surviving spouses or eligible domestic partners of active employees who were at
least age 55 or had at least 25 years of service when they died, and their eligible dependents.
B. Benefits 1. Medical Edison retirees prior to 1991 are referred to as PrimeCare retirees. Retirees in 1991
and beyond are referred to as Flex retirees. All medical plans cover physician services, physical examinations, blood products and
tests, prescription drugs, diabetic counseling, medical equipment, home health care, hospital room & board, special care units, services and supplies, hospice services, immunizations, maternity services, occupational therapy, radiation therapy, reconstructive surgery, speech therapy, sterilization, X-rays and laboratory tests, acupuncture, chiropractic and treatment for mental illness and substance abuse. Specific limitations and restrictions may apply to certain types of services or treatments.
POSTRETIREMENT HEALTH & LIFE BENEFITS ACTUARIAL ACCOUNTING REPORT
FOR THE 2013 PLAN YEAR
Actuarial Report

Southern California Edison Company
21
PrimeCare: For participants who retired before January 1, 1991, Edison provides the option of
enrolling in point-of-service (POS) managed care networks and HMOs (where available). A summary of the key cost-sharing provisions associated with the POS Plans is as follows:
With POS Providers
Without POS Providers
Out of Area
Coinsurance 100% 80% 90% Calendar Year Deductible $0 $0 $0 Annual Out-Of-Pocket Limit Per Person $1,500 $1,500 $1,500 Lifetime Maximum Unlimited Unlimited Unlimited
Flex Retirees: For participants who retired after December 31, 1990, in 2013, Edison provides the
option of enrolling in Preferred Provider Organization (PPO) managed care networks, Exclusive Provider Organization (EPO) and HMOs (where available). A summary of the key cost-sharing provisions associated with the Pre-Medicare Plans follows:
90/70 PPO 80/60 PPO 70/50 PPO HMO/EPO
Coinsurance* 10%/30% 20%/40% 30%/50% NA Calendar Year Deductible Per Person $300 $600 $1,700 None Per Family $600 $1,200 $3,400 None Annual Out-of-Pocket Limit Per Person $3,995 $3,995 $5,990 $1,995 Per Family $7,990 $7,990 $11,980 $3,990 Lifetime Maximum (millions) None None None None
* In Network/Out of Network (of R&C). In network office visit copays = $25 PPO / $20
HMO.
Actuarial Report

Southern California Edison Company
22
Coverage options for retirees who are eligible for Medicare benefits include a 90%/70% PPO, a UHC Senior Supplement option, a UHC Senior Supplement 3500 option, and Kaiser and a Health Net Medicare Advantage HMO (if available in the retirees geographic area), all of which may serve as the lowest cost option.
The Senior Supplement (Plan K) covers 50% of charges up to the Medicare Part A
deductible amount, but 0% of charges up to the Medicare Part B deductible. Once the Part B deductible is reached, the plan pays 90% of all additional Medicare approved charges not covered by Medicare. Under the UHC Senior Supplement 3500 option, after the deductible of $3,500 is met, the plan pays 100% of all Medicare Allowable charges.
Under all options, except the Kaiser Medicare Advantage HMO, prescription drug
benefits are provided separately, subject to 10%/20% coinsurance payments for generic/brand name prescription drugs and pharmacy stop loss amounts of $1,160/$2,320 for single/family coverage. Deductibles, copayments, and out-of-pocket limits are indexed.
2. Dental Benefits There are three options: Delta Dental, an indemnity plan Blue Cross Dental Net, an HMO Safeguard Dental, an HMO All three plans cover oral examinations, X-rays, preventive services, basic services,
prosthodontic services and orthodontic services, at differing percentages. 3. Vision Benefits Services are provided through the Vision Service Plan (VSP). There is a deductible of
$20 per calendar year. The plan covers eye examinations, frames, and standard and contact lenses on a payment schedule.
4. Term Life Insurance Benefits All Edison employees who retired on or after October 1, 1978 receive the following
postretirement group term life insurance amounts: Retirement Category Benefit For those who retired on or after 10/01/78, but before 08/01/83 (On or after 10/01/79 for IBEW employees) $ 2,500 For those who retired on or after 08/01/83 (Including IBEW employees) $ 5,000
Actuarial Report

Southern California Edison Company
23
Edison employees who retired on or after October 1, 1978, who were enrolled for paid-
up insurance before October 1, 1978 (before October 1, 1979 for IBEW employees) and who were age 50 or older within the six months before or after May 1, 1978 (May 1, 1979 for IBEW employees) also receive additional life insurance benefits, which are partially paid by Edison.
The portion of the postretirement life coverage paid for by Edison is 25% of the face
amount of preretirement coverage less the amount of paid-up insurance purchased by the employee while working.
5. Medicare Part B Premium Reimbursement For those who retired before January 1, 1989, Edison reimburses the retiree for his or
her own Medicare Part B premiums, including future increases in those premiums. For those who retired on or after January 1, 1989 and before January 1, 1993, Edison
provides a reimbursement to the retiree for his or her own Medicare Part B premiums at the 1992 premium level. The retiree pays any increases in the Medicare Part B premium above the 1992 level.
For those who retire on or after January 1, 1993, reimbursement for Medicare Part B
premiums is not available. 6. Retiree Contributions Employees retiring before 1991 pay nothing for all postretirement health benefit
coverage. These are referred to as PrimeCare retirees. Employees retiring after 1990 are referred to as Flex retirees. Employees retiring in 1991 and 1992 are required to contribute for Dental, but not for Medical coverage. Employees retiring after 1992 must contribute for all health coverage. Contribution amounts vary depending on date of retirement, age and service, plan option selected, eligibility for Medicare, coverage tier (single, family, etc.), and geographic area.
Employees who retired between 1993 and 2008, as well as employees as of December
31, 2008 who were retirement eligible, or who had completed at least 25 years of service as of that date, are referred to in this report as Grandfathered Flex retirees. Post-2008 retirees who did not meet these criteria are referred to as Non-Grandfathered Flex retirees.
Grandfathered Flex retirees who select the lowest cost healthcare option available in
their geographic area generally pay 15% of the cost (i.e., the “pricetag”) of that option for their own medical coverage and 20% of that cost for dependents’ medical coverage. Retirees selecting higher cost options pay additional amounts equal to the difference between the cost of the option they select and the cost of the lowest cost option available to them in their geographic region.
Actuarial Report

Southern California Edison Company
24
All employees retiring after 1992 pay 50% of the cost of dental and vision benefits. Retiree contributions for pre-65 medical coverage are determined on the basis of the
aggregate experience of all active employees and Flex retirees who are not eligible for Medicare. Retiree contributions for post-65 medical coverage are determined on the basis of per capita claims costs reflecting the implementation of the EGWP.
Relative value pricing methodology is used, as appropriate, to help mitigate the effects
of cost differences between the retiree populations selecting various options, and to help ensure claims data credibility. Relative values may be subject to change.
Required contributions for Non-Grandfathered Flex retirees are similar to required
contributions for Grandfathered Flex Retirees, but with the following differences. Edison medical benefit contributions for Non-Grandfathered Flex retirees are capped at 2008 levels, indexed to the Consumer Price Index (or, if higher, 50% of the increase in the cost of the lowest cost option, limited in any year to CPI plus 2%). In addition, 50% cost sharing applies to these retirees if they retire before age 60, or with less than 15 years of service.
The 2013 cap amounts for the four separate geographic regions that have unique sets
of medical benefit options are described in Section V of this report.
Actuarial Report

SECTION IV
DEMOGRAPHIC DATA
Actuarial Report
Southern California Edison Company
26
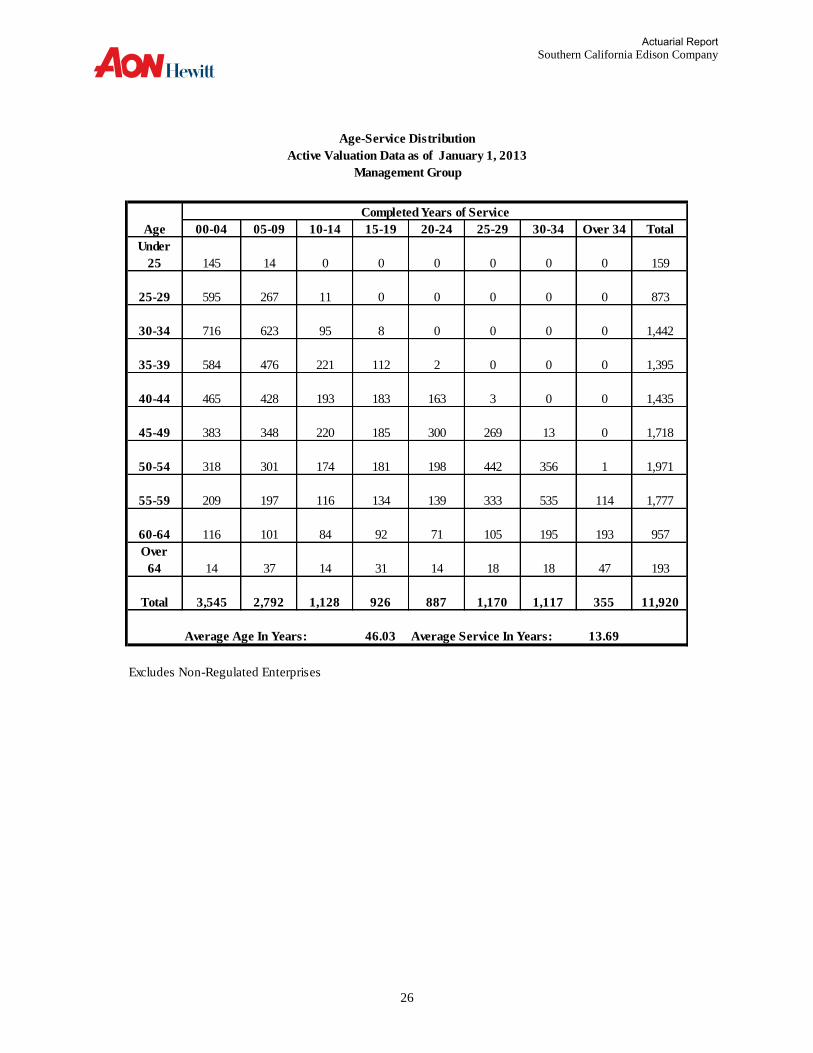
Age-Service Distribution
Active Valuation Data as of January 1, 2013
Management Group
Completed Years of Service
Age 00-04 05-09 10-14 15-19 20-24 25-29 30-34 Over 34 Total
Under
25 145 14 0 0 0 0 0 0 159
25-29 595 267 11 0 0 0 0 0 873
30-34 716 623 95 8 0 0 0 0 1,442
35-39 584 476 221 112 2 0 0 0 1,395
40-44 465 428 193 183 163 3 0 0 1,435
45-49 383 348 220 185 300 269 13 0 1,718
50-54 318 301 174 181 198 442 356 1 1,971
55-59 209 197 116 134 139 333 535 114 1,777
60-64 116 101 84 92 71 105 195 193 957
Over
64 14 37 14 31 14 18 18 47 193
Total 3,545 2,792 1,128 926 887 1,170 1,117 355 11,920
Average Age In Years: 46.03 Average Service In Years: 13.69
Excludes Non-Regulated Enterprises
Actuarial Report

Southern California Edison Company
27
Age-Service Distribution
Active Valuation Data as of January 1, 2013
Represented Group
Completed Years of Service
Age 00-04 05-09 10-14 15-19 20-24 25-29 30-34 Over 34 Total
Under
25 52 8 0 0 0 0 0 0 60
25-29 212 264 14 0 0 0 0 0 490
30-34 211 402 126 7 0 0 0 0 746
35-39 133 319 165 108 1 0 0 0 726
40-44 70 194 125 68 65 6 0 0 528
45-49 47 152 73 46 158 127 5 0 608
50-54 38 84 70 36 126 288 181 1 824
55-59 26 28 28 23 71 202 312 46 736
60-64 8 15 15 9 38 99 117 92 393
Over
64 1 5 2 1 8 7 7 24 55
Total 798 1,471 618 298 467 729 622 163 5,166
Average Age In Years: 44.82 Average Service In Years: 16.16
Excludes Non-Regulated Enterprises
Actuarial Report

Southern California Edison Company
28
Age-Service Distribution
Active Valuation Data as of January 1, 2013
All Actives
Completed Years of Service
Age 00-04 05-09 10-14 15-19 20-24 25-29 30-34 35 + Total
Under 25 197 22 0 0 0 0 0 0 219
25-29 807 531 25 0 0 0 0 0 1,363
30-34 927 1,025 221 15 0 0 0 0 2,188
35-39 717 795 386 220 3 0 0 0 2,121
40-44 535 622 318 251 228 9 0 0 1,963
45-49 430 500 293 231 458 396 18 0 2,326
50-54 356 385 244 217 324 730 537 2 2,795
55-59 235 225 144 157 210 535 847 160 2,513
60-64 124 116 99 101 109 204 312 285 1,350
Over 64 15 42 16 32 22 25 25 71 248
Total 4,343 4,263 1,746 1,224 1,354 1,899 1,739 518 17,086
Average Age In Years: 45.66 Average Service In Years: 14.44
Excludes Non-Regulated Enterprises
Actuarial Report

Southern California Edison Company
29
Age Distribution
Retiree Valuation Data as of January 1, 2013
Management Group
Retirees Survivors Spouses
Age Male Female Male Female Male Female Total
Under 50 0 0 17 15 5 55 92
50-54 39 13 2 12 12 142 220
55-59 246 124 11 42 59 406 888
60-64 736 374 9 70 128 736 2,053
Subtotal 1,021 511 39 139 204 1,339 3,253
65-69 1,153 429 7 138 184 793 2,704
70-74 970 297 10 171 171 522 2,141
Over 74 1,041 316 46 713 118 521 2,755
Subtotal 3,164 1,042 63 1,022 473 1,836 7,600
Total 4,185 1,553 102 1,161 677 3,175 10,853
Average
Age 70.97 69.56 66.73 78.14 69.17 67.23 70.30
Excludes Non-Regulated Enterprises
Excludes Children
Actuarial Report

Southern California Edison Company
30
Age Distribution
Retiree Valuation Data as of January 1, 2013
Represented Group
Retirees Survivors Spouses
Age Male Female Male Female Male Female Total
Under 50 0 0 18 20 1 24 63
50-54 11 0 2 19 3 55 90
55-59 167 13 1 36 7 270 494
60-64 485 60 5 66 17 461 1,094
Subtotal 663 73 26 141 28 810 1,741
65-69 736 67 2 107 24 428 1,364
70-74 668 61 6 139 22 357 1,253
Over 74 765 67 7 538 20 395 1,792
Subtotal 2,169 195 15 784 66 1,180 4,409
Total 2,832 268 41 925 94 1,990 6,150
Average
Age 71.41 70.70 54.45 76.43 69.35 68.11 70.90
Excludes Non-Regulated Enterprises
Excludes Children
Actuarial Report

Southern California Edison Company
31
Age Distribution
Retiree Valuation Data as of January 1, 2013
All Inactives
Retirees Survivors Spouses
Age Male Female Male Female Male Female Total
Under 50 0 0 35 35 6 79 155
50-54 50 13 4 31 15 197 310
55-59 413 137 12 78 66 676 1,382
60-64 1,221 434 14 136 145 1,197 3,147
Subtotal 1,684 584 65 280 232 2,149 4,994
65-69 1,889 496 9 245 208 1,221 4,068
70-74 1,638 358 16 310 193 879 3,394
Over 74 1,806 383 53 1,251 138 916 4,547
Subtotal 5,333 1,237 78 1,806 539 3,016 12,009
Total 7,017 1,821 143 2,086 771 5,165 17,003
Average
Age 71.15 69.73 63.21 77.38 69.19 67.57 70.52
Excludes Non-Regulated Enterprises
Excludes Children
Actuarial Report

SECTION V
ACTUARIAL ASSUMPTIONS
Actuarial Report

Southern California Edison Company
33
A. Interest Rates
Discount Rate 4.25% Expected Long-Term Rate of Return on assets
7.00% For assets in trusts not subject to unrelated business tax
5.00% For assets in 1992 and 1999 VEBA Trusts B. Spouse Assumption
Dependents of female employees are assumed to be 3 years older. Dependents of male employees are assumed to be 3 years younger.
C. Mortality Statutory RP2000 mortality table for 2009 PPA actuarial valuation purposes (which include an additional projection beyond 2009 of 7 years for annuitants and 15 years for non-annuitants) projected an additional 9 years from 2009 to 2018.
D. Plan Participation The valuation assumes that all retirees will continue to participate in available health benefit options, consistent with current elections (including “no coverage” elections).
E. Dependent Assumption 75% of male and female employees are assumed to be married or have eligible domestic partners.
F. Life Insurance Administrative Fees: 10% G. Retiree Contributions
For Grandfathered Flex retirees, contributions are assumed to remain a constant percentage of total cost. For Non-Grandfathered Flex retirees, Edison’s contribution for coverage is capped at greater of CPI or 50% of the increase in the lowest cost option (maximum of CPI + 2%). For both pre-65 and post-65 retirees, the valuation assumes a 3% CPI. For valuation purposes, the assumed annual increases in employer cost are higher than 3% to reflect 50% of the increase in the lowest cost option (maximum of CPI + 2%) and that pre-65 retiree contributions are developed using blended active and pre-65 experience.
POSTRETIREMENT HEALTH & LIFE BENEFITS ACTUARIAL ACCOUNTING REPORT
FOR THE 2013 PLAN YEAR
Actuarial Report

Southern California Edison Company
34
H. Claims Costs
The estimated 2013 average per capita Edison claims costs for postretirement health benefits for all Primecare and Grandfathered Flex retirees are shown in Tables 1, 2, and 3. These claims costs, which are the average amounts across all geographic regions and options, reflect the implementation of the EGWP and are net of retiree contributions. These claim costs also reflect retirees who waive coverage.
I. Cap Amounts Cap amounts on employer cost applicable to Non-Grandfathered Flex retirees are different for each of the four distinct geographic regions that have unique sets of benefit options. These regions, and their 2013 (pre- / post- age 65) cost caps for single coverage (for those who retired at age 60 or older with at least 15 years of service) are as follows: Region 1: $3,647/$1,700 Region 2: $3,827/$2,137 Region 3: N/A/$4,181 Region 4: $4,804/$4,181 Lower caps apply for retirement before age 60, and/or with less than 15 years of service. If per capita net Edison paid claims costs would otherwise be lower than the existing cap amounts, retiree contribution amounts are reduced so that Edison paid cost will be consistent with these cap amounts. For valuation purposes, Aon Hewitt assumes no changes in the average geographic distribution of retiree population.
J. Trend Rates See attached Tables 4 and 5.
K. Termination Rates See attached Table 6.
L. Retirement Rates See attached Table 7.
Actuarial Report

Southern California Edison Company
35
M. Disability Rates
Sample rates are as follows:
Age Male Female
25 0.0581% 0.0603% 35 0.0744 0.1576 45 0.1452 0.2737 55 0.3485 0.4258 60 0.6165 0.5908
Actuarial Report

Southern California Edison Company
36
Table 1
Annual 2013 Postretirement Per Participant Claims Costs
Benefit
Claims Costs*
Pre-65 Post-65 Medicare Part B Premium Reimbursements
- Retirees Prior To 1/1/89 N/A $1,259 - Retirees Between 1/1/89 - 12/31/92 N/A 382
Dental Benefits
$ 603 $ 603
Vision Benefits 79 79
*Before Retiree Contributions
Actuarial Report

Southern California Edison Company
37
Table 2
Annual 2013 PrimeCare Per Participant Medical Claims Costs
Age
Male
Female
Less than 45 $ 4,504 $ 4,504
45 – 49 5,258 5,258 50 – 54 6,284 6,284 55 – 59 7,434 7,434 60 – 64 8,976 8,976 65 - 69 4,141 4,141 70 - 74 4,757 4,757 75 – 79 5,333 5,333 80 - 84 5,775 5,775 85 - 89 6,011 6,011
90 and over 6,102 6,102
Actuarial Report

Southern California Edison Company
38
Table 3
Annual 2013 Flex Retiree Per Participant Medical Claims Costs (Net of Retiree Contributions)
Management
Age
Male
Female
Less than 45 $ 3,488 $ 3,488
45 - 49 4,072 4,072 50 - 54 4,867 4,867 55 – 59 5,758 5,758 60 - 64 6,951 6,951 65 – 69 2,102 2,102 70 - 74 2,414 2,414 75 – 79 2,706 2,706 80 – 84 2,930 2,930 85 - 89 3,049 3,049
90 and over 3,095 3,095
Represented
Age
Male
Female
Less than 45 $ 3,663 $ 3,663
45 - 49 4,276 4,276 50 – 54 5,110 5,110 55 – 59 6,045 6,045 60 - 64 7,299 7,299 65 – 69 2,207 2,207 70 - 74 2,535 2,535 75 – 79 2,841 2,841 80 – 84 3,076 3,076 85 – 89 3,201 3,201
90 and over 3,250 3,250
Actuarial Report

Southern California Edison Company
39
Table 4
Medical Trend Rates and Future Annual Increases in Cap Amounts
Years
PrimeCare
Retirees
Flex Retirees Increases in Cap
Amounts
From To Pre-65 Post-65 Pre-65 Post-65 Pre-65 Post-65
2013 2014 8.25% 8.25% 8.25% 9.00% 4.00% 5.00%
2014 2015 7.75 7.75 7.75 8.50 3.75 4.50
2015 2016 7.25 7.25 7.25 8.00 3.75 4.25
2016 2017 6.50 6.50 6.50 7.25 3.75 4.00
2017 2018 6.00 6.00 6.00 6.50 3.75 3.75
2018 2019 5.50 5.50 5.50 6.00 3.75 3.75
2019 2020 5.25 5.25 5.25 5.25 3.75 3.75
2020 and later 5.00 5.00 5.00 5.00 3.75 3.75
Actuarial Report

Southern California Edison Company
40
Table 5
Other Trend Rates
Years
Benefit
From To Dental Vision Medicare
Part B
2013 2014 5.0% 4.5% 0.0% 2014 2015 4.5 4.5 5.0 2015 2016 4.5 4.5 5.0 2016 and later 4.5 4.5 5.0
Actuarial Report

Southern California Edison Company
41
Table 6
Termination Rates
Years of Service
Select Rate
Age
Ultimate Rate
0 0.15 20 0.08000 1 0.12 21 0.07600 2 0.07 22 0.07200 3 0.06 23 0.06800 4 0.05 24 0.06400 25 0.06000 26 0.05850 27 0.05700 28 0.05550 29 0.05400 30 0.05250 31 0.05100 32 0.04950 33 0.04800 34 0.04650 35 0.04500 36 0.04350 37 0.04200 38 0.04050 39 0.03900 40 0.03750 41 0.03600 42 0.03450 43 0.03300 44 0.03150 45 0.03000 46 0.02850 47 0.02700 48 0.02550 49 0.02400 50 0.02250 51 0.02100 52 0.01950 53 0.01800 54 0.01650 55 0.01500
Actuarial Report

Southern California Edison Company
42
Table 7
Retirement Rates
Age Rate
55 12.00%
56 10.00
57 10.00
58 10.00
59 10.00
60 15.00
61 12.00
62 22.00
63 15.00
64 20.00
65 50.00
66 50.00
67 50.00
68 50.00
69 50.00
70 100.00
Actuarial Report

SECTION VI
FIVE-YEAR EXPENSE PROJECTION
Actuarial Report

Southern California Edison Company
44
POSTRETIREMENT HEALTH AND LIFE BENEFITS
FIVE YEAR EXPENSE PROJECTION
This section of the report provides a five year projection of Edison’s Postretirement Health and Life Benefits expense based on December 31, 2013 financial statement disclosure information. Unless otherwise indicated, the December 12, 2013 actuarial certification found on the first page of this report is incorporated into this certification by reference. The projected expenses (in $ thousands) are as follows:
2013 2014 2015 2016 2017 2018
January 1st APBO $2,320,680 $2,211,479 $2,269,818 $2,324,379 $2,377,961 $2,430,459
Net Periodic Postretirement
Benefit Cost (NPPBC) $ 31,425 $ 3,362 $ 29,458 $ 42,379 $ 45,557 $ 49,341 The actuarial assumptions, including per capita claims costs and trend rates, reflected in the December 31, 2013 disclosure information and in the expense projection are the same as those in the January 1, 2013 actuarial valuation except that the discount rate was increased from 4.25% to 5.00%, the expected return on plan assets was reduced to 5.50%, and the assumed increases in the cap amounts for years after 2020 were reduced from 3.75% to 3.50%. No changes in plan provisions were reflected. The census data was the same as reflected in the January 1, 2013 actuarial valuation. The market value of plan assets was provided by Edison. Because plan assets were not adjusted for reimbursements payable to Edison for 2013 claims payable from the trusts, plan liabilities were increased by these estimated amounts. Projected actuarial liabilities are expected liabilities determined on a roll forward basis, starting with the disclosed December 31, 2013 APBO. No experience gains or losses, plan changes, or any extraordinary subsequent events were assumed. New entrants were generally added so that the active population remains constant. This section of the report was prepared by the actuaries whose signatures appear below and, unless otherwise indicated, reflects know information as of the signature date. They certify that, to the best of their knowledge, the methods and assumptions used in the determination of Edison's 2013 liabilities and annual cost for postretirement benefits other than pensions are reasonable and conform to Actuarial Standard of Practice No. 6: Measuring Retiree Group Benefit Obligations, and ASOP No. 41: Actuarial Communications. Respectfully submitted,
_______________________________ _________________________________ Jonathan M. Nemeth, FSA, MAAA Stephen J. Hoeffner, FSA, AAA, EA Senior Vice President Vice President March 19, 2014
Actuarial Report
Southern California Edison Company
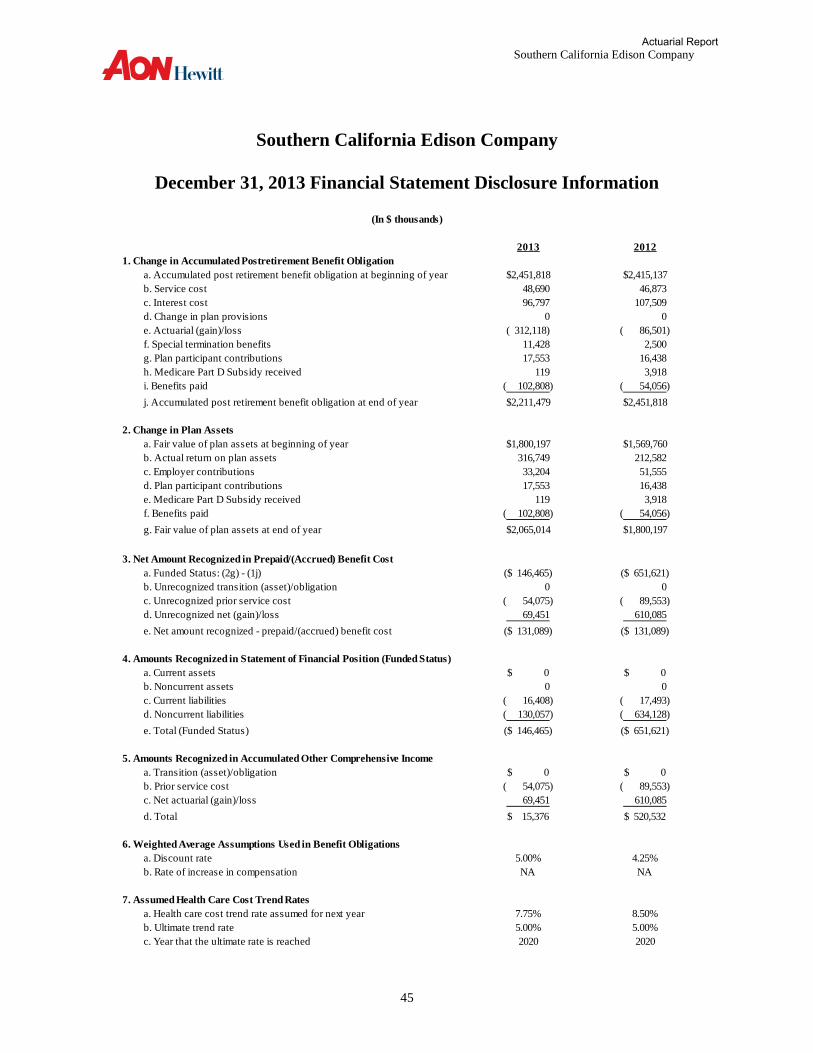
45
Southern California Edison Company
December 31, 2013 Financial Statement Disclosure Information
2013 2012
1. Change in Accumulated Postretirement Benefit Obligation
a. Accumulated post retirement benefit obligation at beginning of year $2,451,818 $2,415,137
b. Service cost 48,690 46,873
c. Interest cost 96,797 107,509
d. Change in plan provisions 0 0
e. Actuarial (gain)/loss ( 312,118) ( 86,501)
f. Special termination benefits 11,428 2,500
g. Plan participant contributions 17,553 16,438
h. Medicare Part D Subsidy received 119 3,918
i. Benefits paid ( 102,808) ( 54,056)
j. Accumulated post retirement benefit obligation at end of year $2,211,479 $2,451,818
2. Change in Plan Assets
a. Fair value of plan assets at beginning of year $1,800,197 $1,569,760
b. Actual return on plan assets 316,749 212,582
c. Employer contributions 33,204 51,555
d. Plan participant contributions 17,553 16,438
e. Medicare Part D Subsidy received 119 3,918
f. Benefits paid ( 102,808) ( 54,056)
g. Fair value of plan assets at end of year $2,065,014 $1,800,197
3. Net Amount Recognized in Prepaid/(Accrued) Benefit Cost
a. Funded Status: (2g) - (1j) ($ 146,465) ($ 651,621)
b. Unrecognized transition (asset)/obligation 0 0
c. Unrecognized prior service cost ( 54,075) ( 89,553)
d. Unrecognized net (gain)/loss 69,451 610,085
e. Net amount recognized - prepaid/(accrued) benefit cost ($ 131,089) ($ 131,089)
4. Amounts Recognized in Statement of Financial Position (Funded Status)
a. Current assets $ 0 $ 0
b. Noncurrent assets 0 0
c. Current liabilities ( 16,408) ( 17,493)
d. Noncurrent liabilities ( 130,057) ( 634,128)
e. Total (Funded Status) ($ 146,465) ($ 651,621)
5. Amounts Recognized in Accumulated Other Comprehensive Income
a. Transition (asset)/obligation $ 0 $ 0
b. Prior service cost ( 54,075) ( 89,553)
c. Net actuarial (gain)/loss 69,451 610,085
d. Total $ 15,376 $ 520,532
6. Weighted Average Assumptions Used in Benefit Obligations
a. Discount rate 5.00% 4.25%
b. Rate of increase in compensation NA NA
7. Assumed Health Care Cost Trend Rates
a. Health care cost trend rate assumed for next year 7.75% 8.50%
b. Ultimate trend rate 5.00% 5.00%
c. Year that the ultimate rate is reached 2020 2020
(In $ thousands)
Actuarial Report

Southern California Edison Company
46
Southern California Edison Company
December 31, 2013 Financial Statement Disclosure Information
2013 2012
8. Components of Net Periodic Benefit Cost
a. Service cost $ 48,690 $ 46,873
b. Interest cost 96,797 107,509
c. Expected return on plan assets ( 114,029) ( 108,380)
d. Amortization of unrecognized transition (asset)/obligation 0 0
e. Amortization of unrecognized prior service cost ( 35,478) ( 35,478)
f. Amortization of unrecognized net actuarial (gain)/loss 24,017 39,098
g. Net periodic benefit cost $ 19,997 $ 49,622
h. Special termination benefits charges 11,428 2,500
i. Total Cost $ 31,425 $ 52,122
9. Amount Recognized in Other Comprehensive Income
a. Prior service cost/(credit) $ 0 $ 0
b. Net actuarial (gain)/loss (including adjustments) ( 516,617) ( 189,857)
c. Amortization of transition (obligation)/asset 0 0
d. Amortization of prior service (cost)/credit 35,478 35,478
e. Amortization of net actuarial gain/(loss) ( 24,017) ( 39,098)
f. Total ($ 505,156) ($ 193,477)
10. Total Amount Recognized in Benefit Cost and Other Comprehensive Income
(8i) + (9f) ($ 473,731) ($ 141,355)
11. Weighted Average Assumptions Used in Benefit Cost:
a. Discount rate 4.25% 4.75%
b. Rate of increase in compensation NA NA
c. Expected return on plan assets 6.70% 7.00%
12.
$ 520,532 $ 714,009
( 505,156) ( 193,477)
$ 15,376 $ 520,532
13. Reconciliation of Funded Status
a. Prepaid/(accrued) benefit cost at beginning of year: ($ 131,089) ($ 131,368)
b. Net periodic benefit cost 19,997 49,622
c. Special termination benefits charges 11,428 2,500
d. Employer contributions 33,204 51,555
e. Adjustment ( 1,779) 846
f. Prepaid/(accrued) benefit cost at end of year: ($ 131,089) ($ 131,089)
Reconciliation of Accumulated Other Comprehensive Income
a. AOCI at beginning of year
b. Amount Recognized in OCI
(In $ thousands)
c. AOCI at end of year
Actuarial Report
Southern California Edison Company
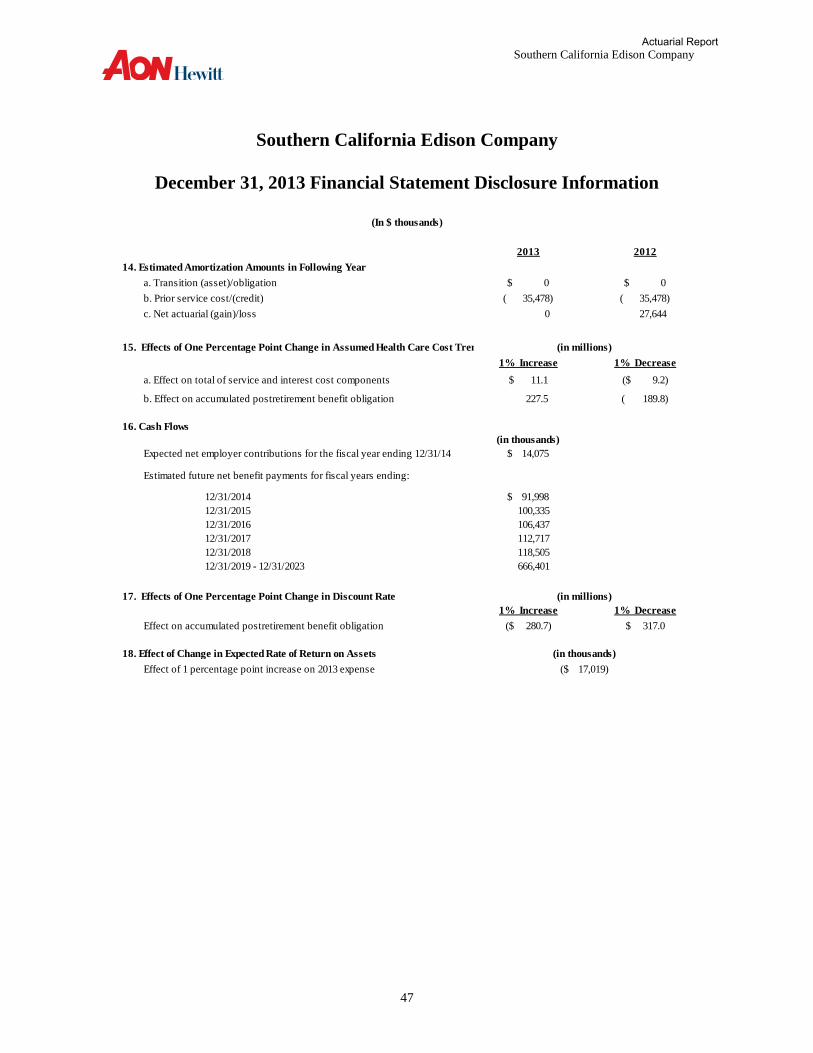
47
Southern California Edison Company
December 31, 2013 Financial Statement Disclosure Information
2013 2012
14. Estimated Amortization Amounts in Following Year
a. Transition (asset)/obligation $ 0 $ 0
b. Prior service cost/(credit) ( 35,478) ( 35,478)
c. Net actuarial (gain)/loss 0 27,644
15. Effects of One Percentage Point Change in Assumed Health Care Cost Trend Rates
1% Increase 1% Decrease
a. Effect on total of service and interest cost components $ 11.1 ($ 9.2)
b. Effect on accumulated postretirement benefit obligation 227.5 ( 189.8)
16. Cash Flows
(in thousands)
Expected net employer contributions for the fiscal year ending 12/31/14 $ 14,075
Estimated future net benefit payments for fiscal years ending:
12/31/2014 $ 91,998
12/31/2015 100,335
12/31/2016 106,437
12/31/2017 112,717
12/31/2018 118,505
12/31/2019 - 12/31/2023 666,401
17. Effects of One Percentage Point Change in Discount Rate
1% Increase 1% Decrease
Effect on accumulated postretirement benefit obligation ($ 280.7) $ 317.0
18. Effect of Change in Expected Rate of Return on Assets
Effect of 1 percentage point increase on 2013 expense
(in millions)
(in thousands)
($ 17,019)
(In $ thousands)
(in millions)
Actuarial Report

Southern California Edison Company
48
Southern California Edison Company
Five-Year Expense Projection
2013 2014 2015 2016 2017 2018
A. Service Cost (EOY) $ 48,690 $ 42,063 $ 43,913 $ 46,461 $ 49,135 $ 51,923
B. Interest Cost
1. APBO $ 98,629 $ 110,574 $ 113,491 $ 116,219 $ 118,898 $ 121,523 2. Expected Benefit Payments 1,832 2,300 2,508 2,661 2,818 2,963 3. Total = (1) - (2) $ 96,797 $ 108,274 $ 110,983 $ 113,558 $ 116,080 $ 118,560
C. Expected Return on Assets *
1. Market Value of Assets $ 116,142 $ 113,576 $ 115,550 $ 117,296 $ 120,118 $ 122,920 2. Expected Benefit Payments 2,194 2,079 2,284 2,462 2,649 2,827 3. Expected Contributions 81 0 53 542 618 710 4. Total = (1) - (2) + (3) $ 114,029 $ 111,497 $ 113,319 $ 115,376 $ 118,087 $ 120,803
D. Net Amortization Amounts
1. Transition (Asset)/Obligation $ 0 $ 0 $ 0 $ 0 $ 0 $ 0 2. Prior Service Cost ( 35,478) ( 35,478) ( 12,119) ( 2,264) ( 1,571) ( 339) 3. Net (Gain)/Loss 24,017 0 0 0 0 0 4. Total = (1) + (2) + (3) ($ 11,461) ($ 35,478) ($ 12,119) ($ 2,264) ($ 1,571) ($ 339)
E. Termination Benefit Charge 11,428 0 0 0 0 0
F. Net Periodic Postretirement Benefit Cost
= (A) + (B3) - (C4) + (D4) + (E) $ 31,425 $ 3,362 $ 29,458 $ 42,379 $ 45,557 $ 49,341
* Return on assets is 5.5% for management VEBA and 5.5% for all other funding vehicles.
Exhibit 1
Determination of Net Periodic Postretirement Benefit Cost (FAS 106)
(in $ thousands)
Actuarial Report

Southern California Edison Company
49
Southern California Edison Company
Five-Year Expense Projection
2013 2014 2015 2016 2017 2018
A. Funded Status as of 1/1
1. APBO $2,320,680 $2,211,479 $2,269,818 $2,324,379 $2,377,961 $2,430,459
2. Market Value of Assets 1,742,053 2,065,014 2,098,588 2,130,317 2,181,635 2,232,562
3. Funded Status = (2) - (1) ($ 578,627) ($ 146,465) ($ 171,230) ($ 194,062) ($ 196,326) ($ 197,897)
4. Unrecognized Transition (Asset)/Obligation 0 0 0 0 0 0
5. Unrecognized Prior Service Cost ( 89,553) ( 54,075) ( 18,597) ( 6,478) ( 4,214) ( 2,643)
6. Unrecognized Net (Gain)/Loss 537,091 69,451 69,451 69,451 69,451 69,451
7. (Accrued)/Prepaid Benefit Cost = (3) + (4) + (5) + (6) ($ 131,089) ($ 131,089) ($ 120,376) ($ 131,089) ($ 131,089) ($ 131,089)
B. Reconciliation of Funded Status
1. (Accrued)/Prepaid Benefit Cost at 1/1/t-1 ($ 131,368) ($ 131,089) ($ 131,089) ($ 120,376) ($ 131,089) ($ 131,089)
2. NPPBC for t-1 52,122 31,425 3,362 29,458 42,379 45,557
3. Contributions for t-1 51,555 31,425 14,075 18,745 42,379 45,557
4. Adjustments for t-1 846 0 0 0 0 0
5. (Accrued)/Prepaid Benefit Cost at 1/1/t = (1)-(2)+(3)+(4) ($ 131,089) ($ 131,089) ($ 120,376) ($ 131,089) ($ 131,089) ($ 131,089)
Exhibit 2
Development and Reconciliation of (Accrued)/Prepaid Benefit Cost (FAS 106)
(in $ thousands)
Actuarial Report

Southern California Edison Company
50
Southern California Edison Company
Five-Year Expense Projection
2013 2014 2015 2016 2017 2018
A. Assets at 1/1 $1,742,053 $2,065,014 $2,098,588 $2,130,317 $2,181,635 $2,232,562
B. Additions
1. Contributions $ 31,425 $ 14,075 $ 18,745 $ 42,379 $ 45,557 $ 49,3412. Investment Income 376,672 111,497 113,319 115,376 118,087 120,8032. Total Additions= (1) + (2) $ 408,097 $ 125,572 $ 132,064 $ 157,755 $ 163,644 $ 170,144
C. Benefit Payments 85,136 91,998 100,335 106,437 112,717 118,505
D. Assets at 12/31 = (A) + (B3) - (C) $2,065,014 $2,098,588 $2,130,317 $2,181,635 $2,232,562 $2,284,201
Exhibit 3
Development of Projected Market Value of Assets as of Year End
(in $ thousands)
Actuarial Report

Southern California Edison Company
51
Southern California Edison Company
Five-Year Expense Projection
2013 2014 2015 2016 2017 2018
1. Unrecognized Prior Service Cost at Preceding 1/1 ($ 125,031) ($ 89,553) ($ 54,075) ($ 18,597) ($ 6,478) ($ 4,214)
2. Plan Amendment 0 0 0 0 0 0
3.Prior Service Cost Amortization Amount ( 35,478) ( 35,478) ( 35,478) ( 12,119) ( 2,264) ( 1,571)
4. Unrecognized Prior Service Cost at 1/1 = (1) + (2) - (3) ($ 89,553) ($ 54,075) ($ 18,597) ($ 6,478) ($ 4,214) ($ 2,643)
Exhibit 4
Bases for Unrecognized Prior Service Cost
(in $ thousands)
Actuarial Report
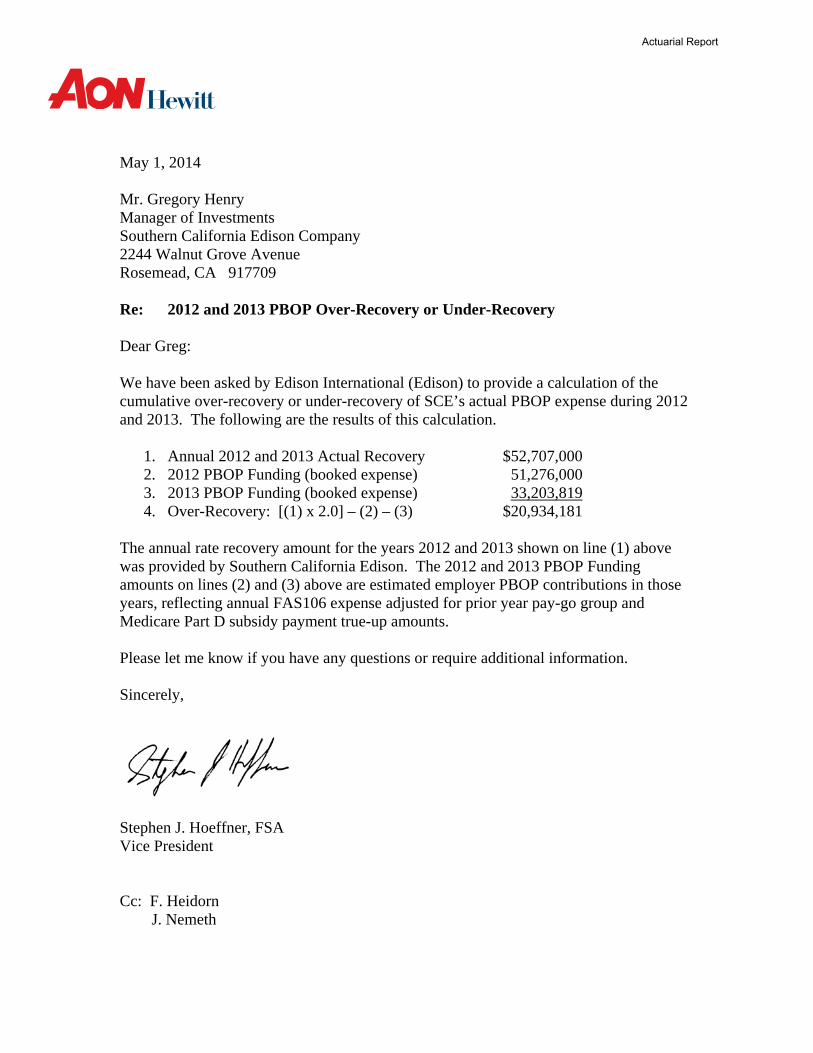
May 1, 2014 Mr. Gregory Henry Manager of Investments Southern California Edison Company 2244 Walnut Grove Avenue Rosemead, CA 917709 Re: 2012 and 2013 PBOP Over-Recovery or Under-Recovery Dear Greg: We have been asked by Edison International (Edison) to provide a calculation of the cumulative over-recovery or under-recovery of SCE’s actual PBOP expense during 2012 and 2013. The following are the results of this calculation.
1. Annual 2012 and 2013 Actual Recovery $52,707,000 2. 2012 PBOP Funding (booked expense) 51,276,000 3. 2013 PBOP Funding (booked expense) 33,203,819 4. Over-Recovery: [(1) x 2.0] – (2) – (3) $20,934,181
The annual rate recovery amount for the years 2012 and 2013 shown on line (1) above was provided by Southern California Edison. The 2012 and 2013 PBOP Funding amounts on lines (2) and (3) above are estimated employer PBOP contributions in those years, reflecting annual FAS106 expense adjusted for prior year pay-go group and Medicare Part D subsidy payment true-up amounts.
Please let me know if you have any questions or require additional information. Sincerely,
Stephen J. Hoeffner, FSA Vice President Cc: F. Heidorn J. Nemeth
Actuarial Report