Embed Size (px)
Citation preview

Active, Passive or Enhanced?
Sandip A. Bhagat, CFA
Managing Director, Citigroup Asset ManagementPresident, Travelers Investment Management Company
Presented at
University of ConnecticutStorrs, ConnecticutFebruary 20, 2004
2
Discussion PointsDiscussion Points
● Evolution of IndexingEvolution of Indexing
● Role of Active ManagementRole of Active Management
● Structured Management or Enhanced Structured Management or Enhanced Indexing as an AlternativeIndexing as an Alternative
● Implementation Choices in Asset AllocationImplementation Choices in Asset Allocation
3
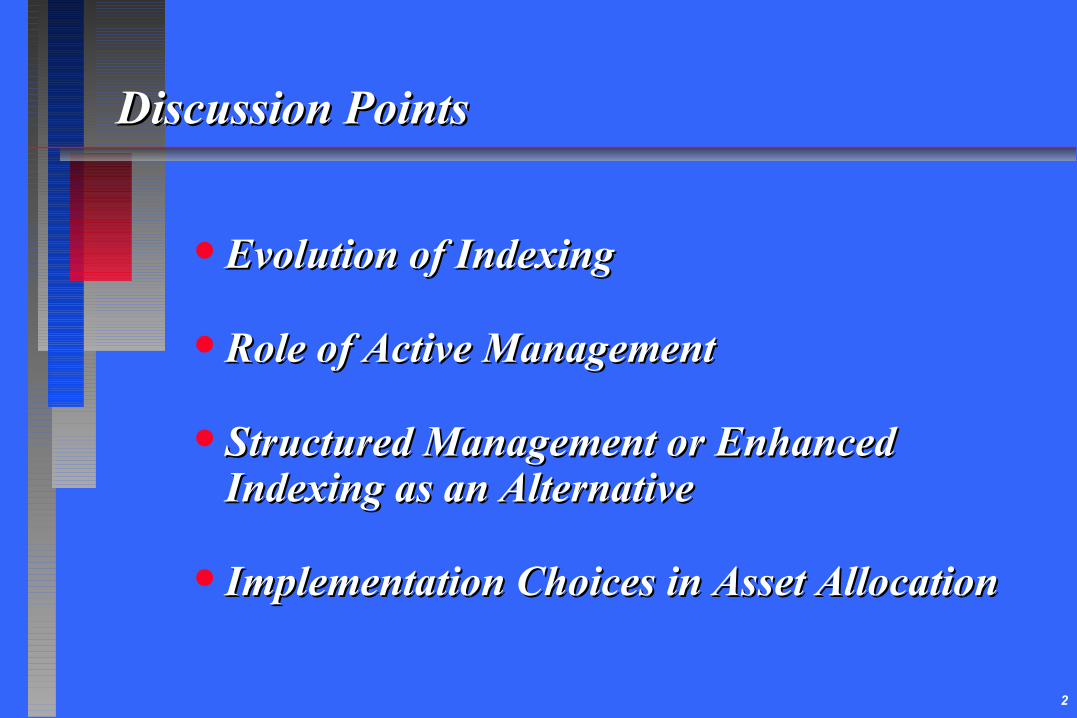
Growth of IndexingGrowth of Indexing
● $1.3 trillion in $1.3 trillion in institutional institutional indexed assetsindexed assets
● Vanguard S&P Vanguard S&P 500 index fund 500 index fund has grown 8 fold has grown 8 fold in the last 5 yearsin the last 5 years
0
10
20
30
40
50
60
70
80
1990 1995 2000
$ b
illi
on
0
0.2
0.4
0.6
0.8
1
1.2
1.4
Total Equity FixedIncome
$ tr
illio
n
4
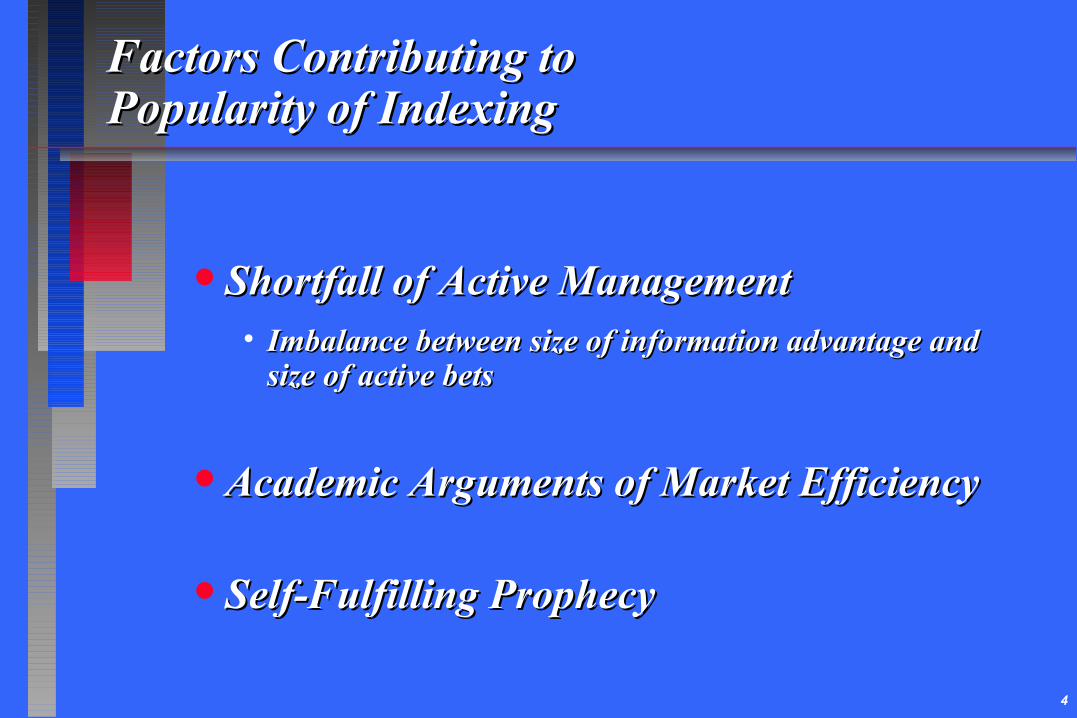
Factors Contributing toFactors Contributing toPopularity of IndexingPopularity of Indexing
● Shortfall of Active ManagementShortfall of Active Management• Imbalance between size of information advantage and Imbalance between size of information advantage and
size of active betssize of active bets
● Academic Arguments of Market EfficiencyAcademic Arguments of Market Efficiency
● Self-Fulfilling ProphecySelf-Fulfilling Prophecy

5
Relative Merits of Passive vs. Active Relative Merits of Passive vs. Active ManagementManagement
IndexingIndexing ActiveActive ReasonReason
Relative PerformanceRelative Performance- Efficient Asset Class- Efficient Asset Class ✓ ✕ ✓ ✕ EmpiricalEmpirical
- Inefficient Asset Class- Inefficient Asset Class ✕ ✓ ✕ ✓ EvidenceEvidence
Relative CostsRelative Costs ✓✕ ✓✕ Low Info. Needs/Low Info. Needs/TurnoverTurnover
Implementing Asset AllocationImplementing Asset Allocation✓✕ ✓✕ StyleStyleReliabilityReliability
Tax EfficiencyTax Efficiency ✓✕ ✓✕ Low TurnoverLow Turnover
6
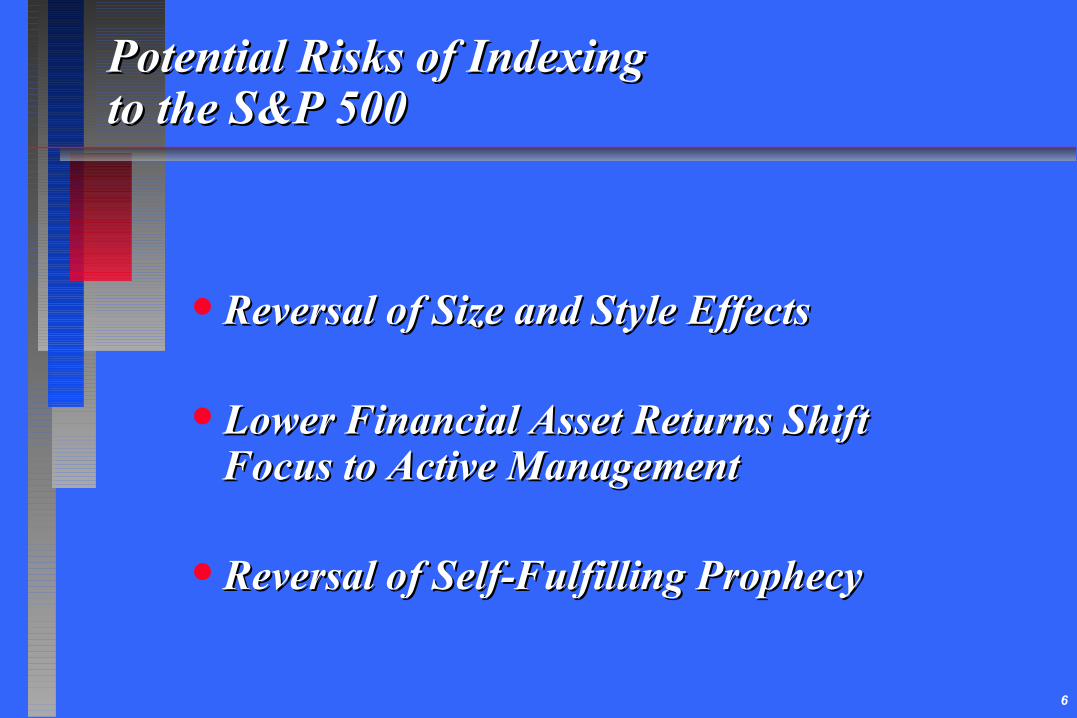
Potential Risks of IndexingPotential Risks of Indexingto the S&P 500to the S&P 500
● Reversal of Size and Style EffectsReversal of Size and Style Effects
● Lower Financial Asset Returns Shift Lower Financial Asset Returns Shift Focus to Active ManagementFocus to Active Management
● Reversal of Self-Fulfilling ProphecyReversal of Self-Fulfilling Prophecy

7
● GoodGood active managers deliver consistent active managers deliver consistent value-added relative to a benchmark.value-added relative to a benchmark.
● GoodGood active managers will never fall out of active managers will never fall out of favor or go out of style.favor or go out of style.
● Active management should be used in Active management should be used in inefficient asset classes.inefficient asset classes.
Role of Active ManagementRole of Active Management

8
Evaluating Active ManagementEvaluating Active Management
● Information ratios provide the litmus test of Information ratios provide the litmus test of active management.active management.
● IR = IR = = = = =
Active = Portfolio - BenchmarkActive = Portfolio - Benchmark
● A high information ratio differentiates skill A high information ratio differentiates skill from luck in active management.from luck in active management.
> + 0.5> + 0.5 GoodGood
< - 0.5< - 0.5 BadBad
Active ReturnActive ReturnActive RiskActive Risk
ααωω
γγ
9
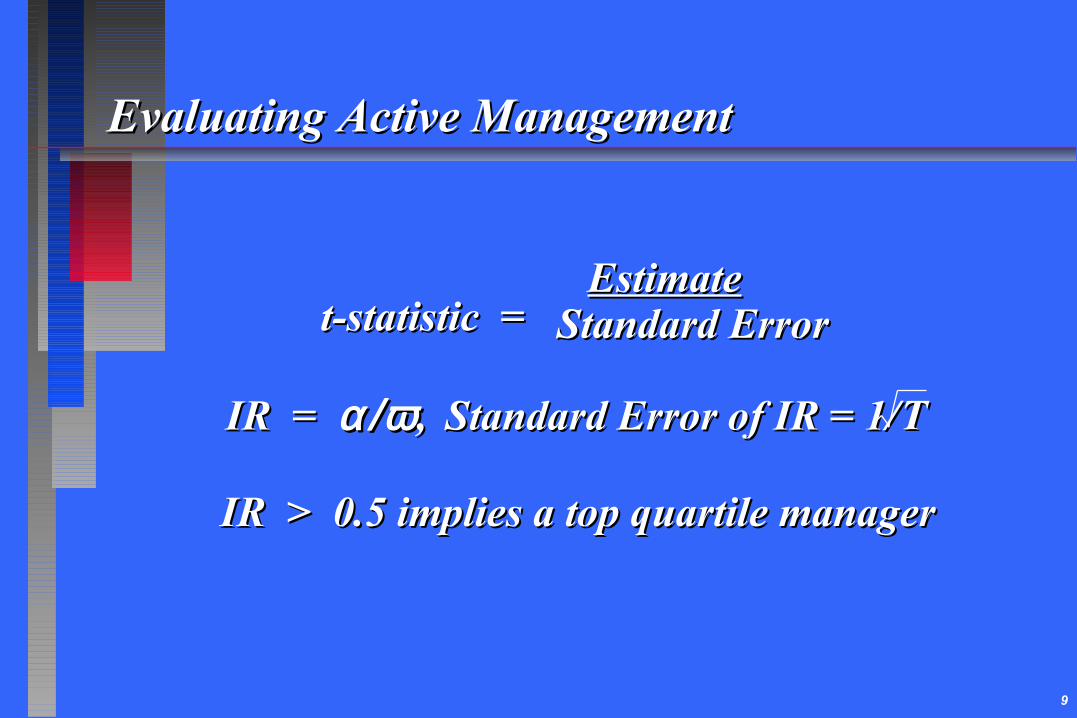
Evaluating Active ManagementEvaluating Active Management
t-statistic =t-statistic =
IR = IR = α/ωα/ω ,, Standard Error of IR = 1/ Standard Error of IR = 1/
IR > 0.5 implies a top quartile managerIR > 0.5 implies a top quartile manager
TT
EstimateEstimateStandard ErrorStandard Error
10
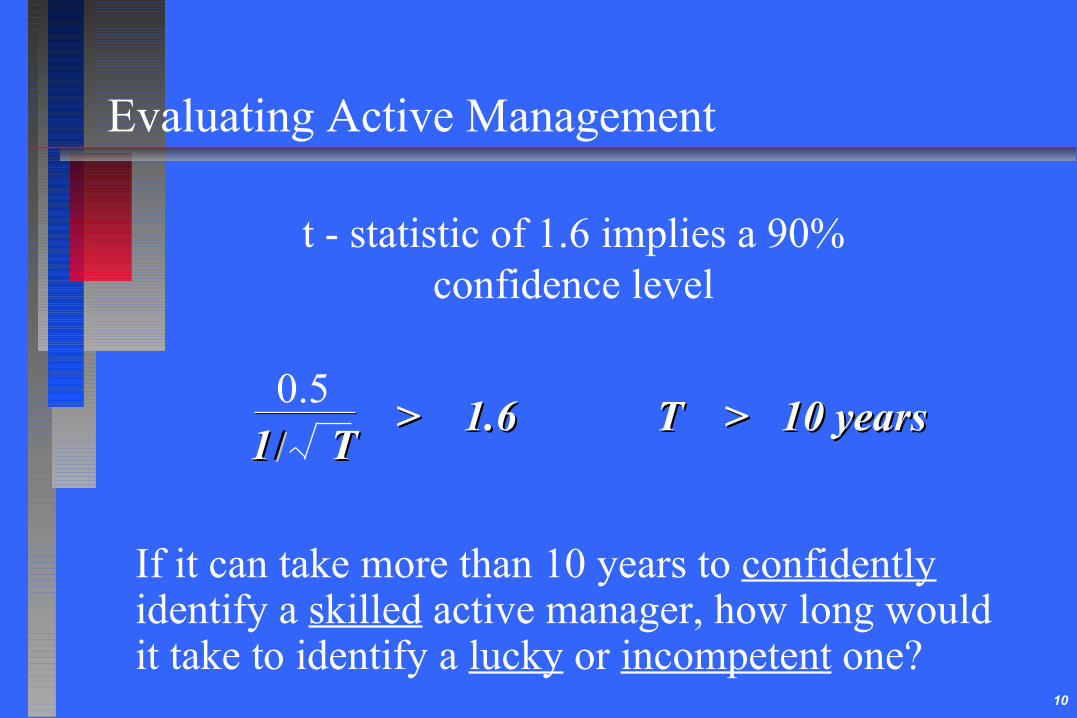
Evaluating Active Management
t - statistic of 1.6 implies a 90%confidence level
0.5
If it can take more than 10 years to confidently identify a skilled active manager, how long would it take to identify a lucky or incompetent one?
> 1.6 T > 10 years> 1.6 T > 10 years TT11 //

11
Skill and LuckSkill and Luck
BlessedBlessedInsufferableInsufferable
DoomedDoomed ForlornForlorn
Less SkillLess Skill More SkillMore Skill
More LuckMore Luck
Less LuckLess Luck
12
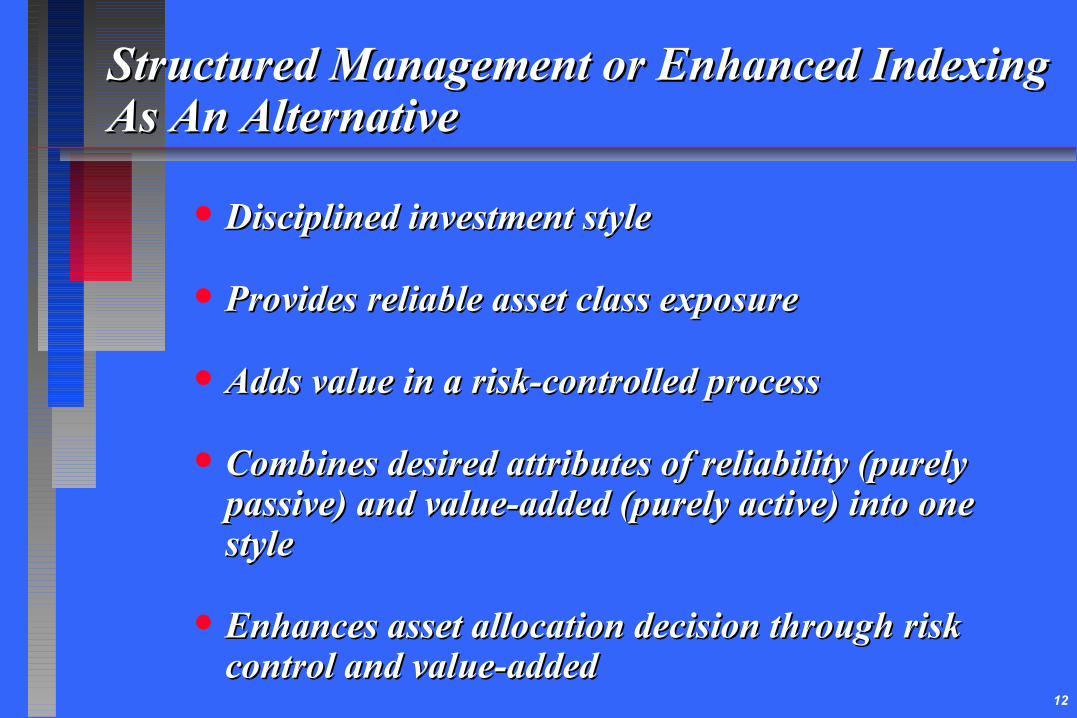
Structured Management or Enhanced IndexingStructured Management or Enhanced IndexingAs An AlternativeAs An Alternative
● Disciplined investment styleDisciplined investment style
● Provides reliable asset class exposureProvides reliable asset class exposure
● Adds value in a risk-controlled processAdds value in a risk-controlled process
● Combines desired attributes of reliability (purely Combines desired attributes of reliability (purely passive) and value-added (purely active) into one passive) and value-added (purely active) into one stylestyle
● Enhances asset allocation decision through risk Enhances asset allocation decision through risk control and value-addedcontrol and value-added

13
Evolution of Asset Management Evolution of Asset Management StylesStyles
Expected Return PayoffsExpected Return PayoffsRelative to BenchmarkRelative to Benchmark
Asset Class Asset Class LessLess MoreMore ReliableReliable
ExposureExposure ReliableReliable ReliableReliable
Value Added Value Added LessLess MoreMore Reliable,Reliable,
ReliableReliable ReliableReliable but zerobut zero
-10.0%
-8.0%
-6.0%
-4.0%
-2.0%
0.0%
2.0%
4.0%
6.0%
8.0%
10.0%
Conventional Active Structured Purely Passive
4 to 8%4 to 8%
-4 to -8%-4 to -8%
1 to 3%1 to 3%
-1 to -3%-1 to -3%
-0.1 to -0.3%-0.1 to -0.3%
Share of Enhancedvs. All Indexing
0
5
10
15
20
25
30
1995 2000
< 5%
30%
14
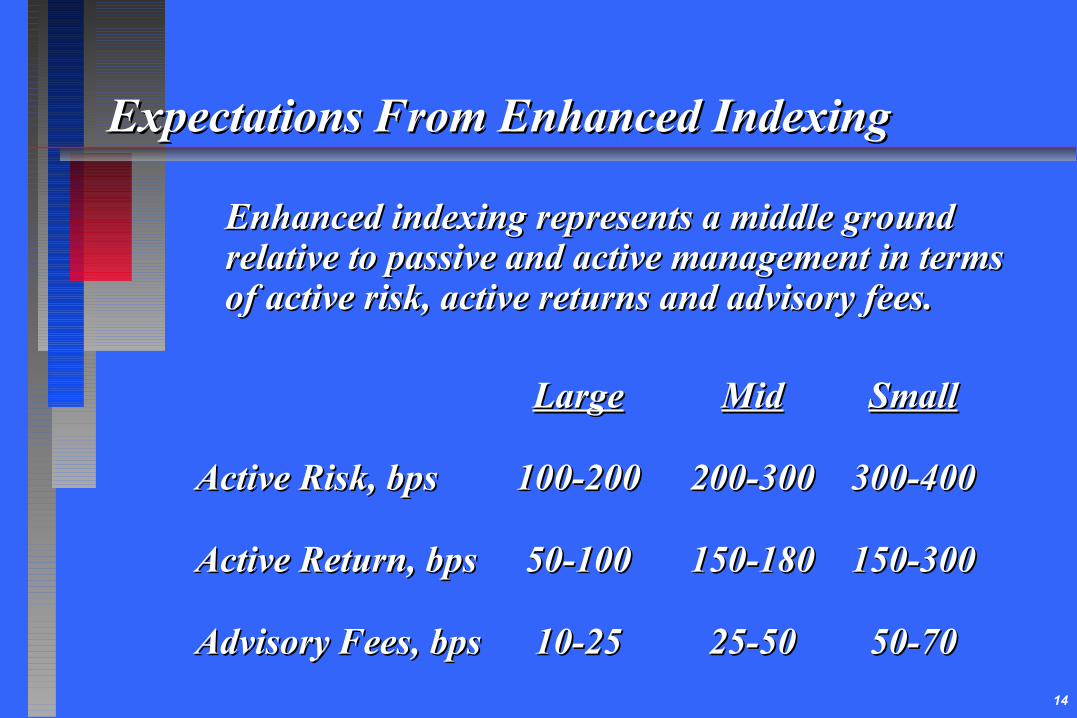
Expectations From Enhanced IndexingExpectations From Enhanced Indexing
Enhanced indexing represents a middle ground Enhanced indexing represents a middle ground relative to passive and active management in terms relative to passive and active management in terms of active risk, active returns and advisory fees.of active risk, active returns and advisory fees.
LargeLarge MidMid SmallSmall
Active Risk, bpsActive Risk, bps 100-200100-200 200-300200-300 300-400300-400
Active Return, bpsActive Return, bps 50-10050-100 150-180150-180 150-300150-300
Advisory Fees, bpsAdvisory Fees, bps 10-2510-25 25-5025-50 50-7050-70
15
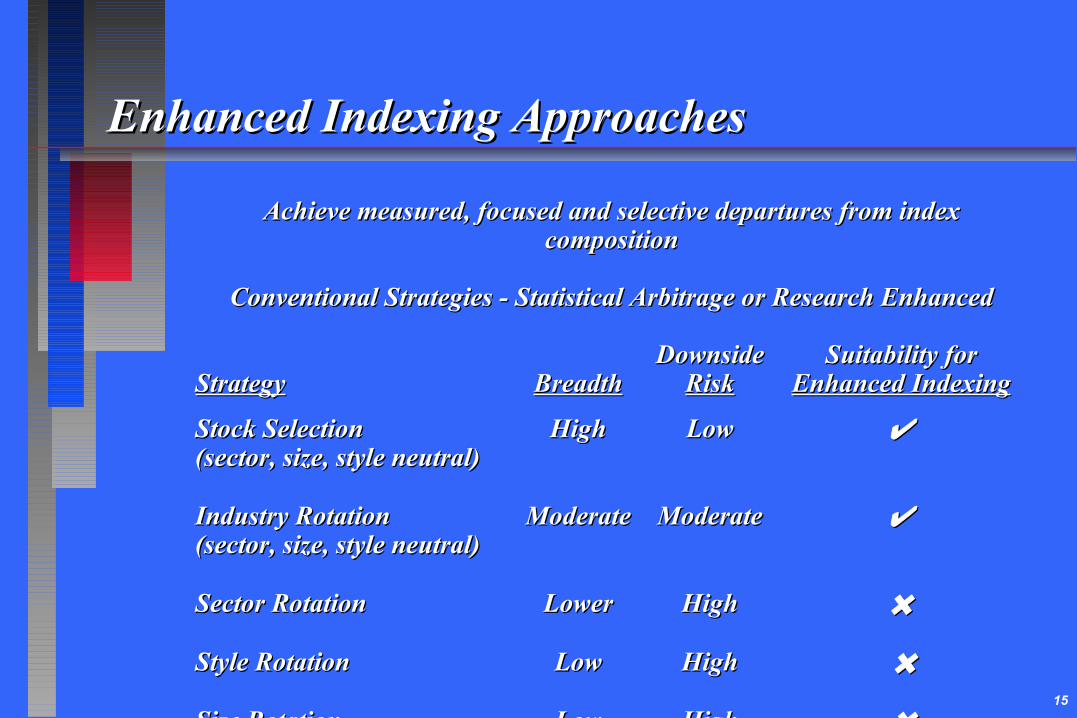
Achieve measured, focused and selective departures from index Achieve measured, focused and selective departures from index compositioncomposition
Conventional Strategies - Statistical Arbitrage or Research EnhancedConventional Strategies - Statistical Arbitrage or Research Enhanced
DownsideDownside Suitability forSuitability forStrategyStrategy BreadthBreadth RiskRisk Enhanced IndexingEnhanced Indexing
Stock SelectionStock Selection HighHigh LowLow ✔✔(sector, size, style neutral)(sector, size, style neutral)
Industry RotationIndustry Rotation ModerateModerate ModerateModerate ✔✔(sector, size, style neutral)(sector, size, style neutral)
Sector RotationSector Rotation LowerLower HighHigh ✖✖
Style RotationStyle Rotation LowLow HighHigh ✖✖
Size RotationSize Rotation LowLow HighHigh ✖✖
Enhanced Indexing ApproachesEnhanced Indexing Approaches

16
Enhanced Indexing ApproachesEnhanced Indexing Approaches
Portable Alpha Strategies (Tracking Error 1 to 3%):Portable Alpha Strategies (Tracking Error 1 to 3%):
LIBOR PlusLIBOR Plus ++ Futures Futures S&P 500S&P 500 == S&P 500 PlusS&P 500 Plus
Market NeutralMarket Neutral ++ Futures Futures S&P 500S&P 500 == S&P 500 PlusS&P 500 Plus
Long-shortLong-short
ConvertibleConvertible ++ Futures Futures S&P 500S&P 500 == S&P 500 PlusS&P 500 Plus
ArbitrageArbitrage
Mid Cap Alpha - Futures Mid Cap Alpha - Futures Mid capMid cap + Futures + Futures S&P 500S&P 500 = S&P 500 Plus = S&P 500 Plus
(Any Inefficient(Any InefficientAsset Class)Asset Class)
Derivatives arbitrage (eg. stock-index futures, rolling cheap calendar Derivatives arbitrage (eg. stock-index futures, rolling cheap calendar spreads) is now efficiently pricedspreads) is now efficiently priced

17
ICIC BRBR IR = IC IR = IC ..
StockpickerStockpicker 0.050.05 200200 0.71, Excellent0.71, Excellent
Market timerMarket timer 0.120.12 22 0.18, Mediocre0.18, Mediocre
Information RatioInformation Ratio == Skill Skill .. Breadth* Breadth*
IRIR = = IC IC ..
IC = Information CoefficientIC = Information Coefficient
BR = Number of Independent Bets per YearBR = Number of Independent Bets per Year
Importance of “Breadth”Importance of “Breadth”in Active Managementin Active Management
BRBR
BRBR
*Source: Grinold & Kahn*Source: Grinold & Kahn

18
SkillSkill ProbabilityProbabilityInvestment StrategyInvestment Strategy BreadthBreadth RequiredRequired of Successof Success
Diversified Active Diversified Active HighHigh LowerLower HigherHigher
Concentrated Active Concentrated Active Low/ModLow/Mod HigherHigher ModMod
Style AllocationStyle Allocation ModMod ModMod ModMod
TAA, Mkt. TimingTAA, Mkt. Timing LowLow HigherHigher LowerLower
Probability of Success Across Probability of Success Across Investment StrategiesInvestment Strategies
19
Passive vs. Active:Passive vs. Active:Role of Market EfficiencyRole of Market Efficiency
● Active management can be futile in Active management can be futile in efficiently priced markets (by definition).efficiently priced markets (by definition).
● Markets are generally efficient in the Markets are generally efficient in the longer term but may provide short-term longer term but may provide short-term opportunities to exploit mispricing.opportunities to exploit mispricing.
● Emphasize active management in Emphasize active management in inefficient asset classes.inefficient asset classes.

20
Market Efficiency and Market Efficiency and Implementation ChoiceImplementation Choice
MarketMarket Recommended MixRecommended MixAsset ClassAsset Class EfficiencyEfficiency PassivePassive EnhancedEnhanced ActiveActive
(%)(%) (%)(%) (%)(%)
Large U. S. StocksLarge U. S. Stocks HighHigh 4040 3030 3030
Small U. S. StocksSmall U. S. Stocks LowLow -- 3030 7070
Core Int’l. StocksCore Int’l. Stocks ModMod 3030 3030 4040
Emerging Mkts. StocksEmerging Mkts. Stocks LowLow -- 2020 8080
U. S. BondsU. S. Bonds HighHigh 3030 4040 3030
Foreign BondsForeign Bonds ModMod 2020 3030 5050
Emerging Mkts. DebtEmerging Mkts. Debt LowLow -- 2020 8080

21
SummarySummary
● Various forms of indexing are likely to dominate in efficient Various forms of indexing are likely to dominate in efficient asset classes.asset classes.
● Enhanced indexingEnhanced indexing
• combines reliability and value-added to enhance asset combines reliability and value-added to enhance asset allocation decisions and allocation decisions and
• may represent a cheaper outperformance call option may represent a cheaper outperformance call option
● Active management can add significant value in inefficient Active management can add significant value in inefficient asset classes by exploiting superior information.asset classes by exploiting superior information.
● Good active management, if you can find it, will always be Good active management, if you can find it, will always be in demand!in demand!