Embed Size (px)
Citation preview

A C T A U N I V E R S I T A T I S L O D Z I E N S I SFO LIA O E C O N O M IC A 194, 2005
Jan Żó ł towski*
APPLICATION OF PROBIT M ODELS AND SELECTED DISCRIMINATION ANALYSIS M ETHODS
FOR CREDIT DECISION EVALUATION
Abstract
Retail banking deals with servicing consum er credits and it constitutes one o f the m ajor banking activities. A custom er applying for the credit fills in the application which is basis to evaluated o f his creditw orthiness.
The paper considers the problem o f evaluation to which o f the two groups the person applying for a credit should be assigned to: a) those who possess the creditw orthiness; b) those who do no t possess the creditw orthiness. It analyses the possibility o f applying the p ro b it m odels and th e d iscrim ination analysis m ethods using the q u ad ra tic and linear discrim ination function. An evaluation o f the correctness o f the classification based on the real d a ta from a comm ercial bank is conducted.
Key words: Bayes discrim ination m ethods, quadratic d iscrim ination function, classification function, p rob it model.
I. IN T R O D U C T IO N
Am ong various types o f activities perform ed by banks, retail banking is one, which deals with the issue o f consumer credits. Each bank acts according to previously established regulations regarding credit granting and repaying. A client applying for a consum er credit fills out a credit application, which constitutes a basis for the client’s creditworthiness evaluation. D ata from the credit application are processed into scoring, which allows to assign the applicant to one o f the two groups: a) able to repay a credit, b) unable to repay a credit.

Therefore, a problem arises whether, and if so, how we can predict which of the two groups the credit applicant will be assigned to, based on the statistical da ta pertaining to credit granting and on the inform ation abou t the client. Also, how can we establish which values o f the socio- cconomic clicnt characteristics assure an appropriate scoring level?
A credit decision m ade by a bank can be described by a binary variable:
Y _ [1, when a credit was grantedjo, when a credit was not granted ^
Regression models are commonly used in the causality relationship analysis. One o f them is the following linear regression model:
Yt = x(7a + £r, for t = 1 ,..., T, (2)
where: x, is a vector of exogenous variables, a - a vector o f param eters, £, - an error term with the expected value of 0.
Let us consider a case, in which the endogenous variable Y is binary with probability distribution function given by:
p (Tr = 1) = n v P(Yt = 0) = 1 — я, and я , е ( 0 ,1). (3)
Hence E ( Y t) = nt. M oreover, based on the assum ptions and the model specification E(Y() = x /a . 1 he existence of a binary endogenous variable in the regression model causes a particular interpretation o f the theoretical values Ý, = x /á obtained from model (2). Specifically, they are not unbiased estim ators o f probabilities Р(У( = 1 ) = я (, if E(a) = a . As a result, it is necessary to select a m ethod, which while estim ating the param eters of m odel (2) satisfies the following condition: Ý, = x,r a e ( 0 , 1). A probit model is one o f such m ethods. After having estimated its param eters, one can estim ate the probability P(Y, = 1) also for other values o f the exogenous variables.
T he problem o f a bank, decision prediction analysed above can also be considered as classification issue. A population П o f credit applicants can be divided into two sub-populations П 0 i H j. Assigning an applicant to the sub-population П 0 is equivalent to denying a credit, while assigning him or her to the sub-population corresponds to granting a credit. A bank decision is m ade after the analysis of the client’s ability to repay the credit. The assignment to one o f the two described above groups is based on values o f m statistical characteristics describing client’s socioeconomic situation. A vector x e R m will represent them. The space o f values

of the characteristics can be divided (based on their values f o r the elements o f the learning set) into two disjoint regions and X x = R"' v X 0. A situation in which vector x belongs to the region X 0 is equivalent to assigning a credit applicant to the sub-population H 0.
This study examines an application o f both approaches in the prediction of credit granting decisions based on the example o f a branch o f a certain bank.
Let’s assume that we have a large sample (obtained from an independent sampling) and tha t we divide the set o f observations into M subsets. For each o f the subsets we can derive the frequency o f the variable Y taking a value o f one. Let each k-lh subset (i = 1,2, ....,M ) with nk elements have mk num ber o f ones. Then the empirical probability can be com puted as
frequency We assume that with the accuracy o f the error ek, it is equal
to the theoretical probability л к, which can be interpreted as the value of the cum ulative distribution function of a certain distribution, i.e.:
II. PR O B IT M O D E L S1
71 к = F(xJ a).
Therefore:
(4)
where:
Hence,
(5)
1 M odels with discrete exogenous variable are discussed by Jajuga in chapter 8 o f works by S. Bartosiewicz (1990).

A fter having expanded the function F 1 into T aylor series abou t the point nk we obtain the following model:
F - ^ W a -И *, (6)
where:
J 2 (n x _ *>0 ~ 4 '/ (x jo t) ' w’ / 2 (xf <x)ni
M odel (6) is called a probit m odel2 and it is a model, in which the error term is heteroscedastic. Such a model can be estim ated with the generalised least squares m ethod or with the maximum likelihood m ethod.
UI. SE L EC T E D BAYES D ISC R IM IN A TIO N M E T H O D S
A selection o f the discrimination method based on the theory o f statistical decision functions and a procedure in the case, in which there exist two sets o f elements П 0 and 111, depend on the inform ation regarding the prior probabilities p0 and p j o f a certain element belonging to a particular set and o f the distribution o f the variables X = [ X t , X 2, ..., X J T characterising the elements o f the population3. Applying Bayes classification rule, we can choose one o f the alternative decisions regarding whether the element belongs to a certain sub-population.Let,
/i(x ) = (2л) 2(det £;) exp — 2 (x ~ Ч х - Л ) (7)
be the probability density function o f the random variable X, when the analysed clement O e ll, dla ŕ = 0 ,1 .
S*(x) = p J fa) , i = 0, 1 can be used as the classification function provided that the loss is constant when an element is misclassified. M ore than one
2 Interesting exam ples o f the application o f p robit analysis can be found for example in publication by: W iśniewski (1986), Pruska (2001).
3 M ethods suggested in such cases were gathered by K. Jajuga (1990), p. 40-41 in Table 1.

particular classification function can be chosen, sincc the classification will not be altered, when function Sf(x), is replaced with:
Sj(x) = g(ST (x)), (8)
where g is any increasing function.Sf(x) = In(Pi/,(x)) m ay be applied as the classification function, i.e.
S*(x) = ~y 1п(2я) - 2 ( d e t L j ) - ^ ( x - ц / Е Г 4 * - f t) + ln Pi- (9)
Since the first element in the form ula (9) is constant with respect to i we can ignore it and the equivalent classification function is as follows:
St(x) = - 2 (x - ц,)т E f 4 x - fij) - \ (det Zj) + ln p„ for i = 0, 1. (10)
The function (10) contains a quadratic form o f a vector ( х - ц , ) , and as a result it is called a quadratic classification function. Its value for a given x depends upon the prior probability p, and upon the param eters ol thedistribution o f (i; and £ (.
A pplying Bayes classification rule with respect to a prior distribution (Po, Pl), we include an observation x in the population П,, for which the classification function S,(x) takes the biggest value for i = 0, 1. Classification regions are determ ined using the Bayes rule and take the following form:
X 0 = { x :S 0( x ) ^ S 1(x)}. (11)
о
The inequality in formula (11) can be substituted with the following equivalent inequality:
(S0(x) - ln p 0) - SL(x) - ln p j) > ln (12)Po
D enoting the left-hand side of the inequality (12) by S0i(x) and taking into consideration form ula (10) we receive the following function:
Soi(x) = !,[(x - ц ^ Е Г Ч х - щ ) - (x - И о № ( х - fi0) + b £ | l (13)
which is independent o f the prior probability p, and called a quadratic discrim ination function.
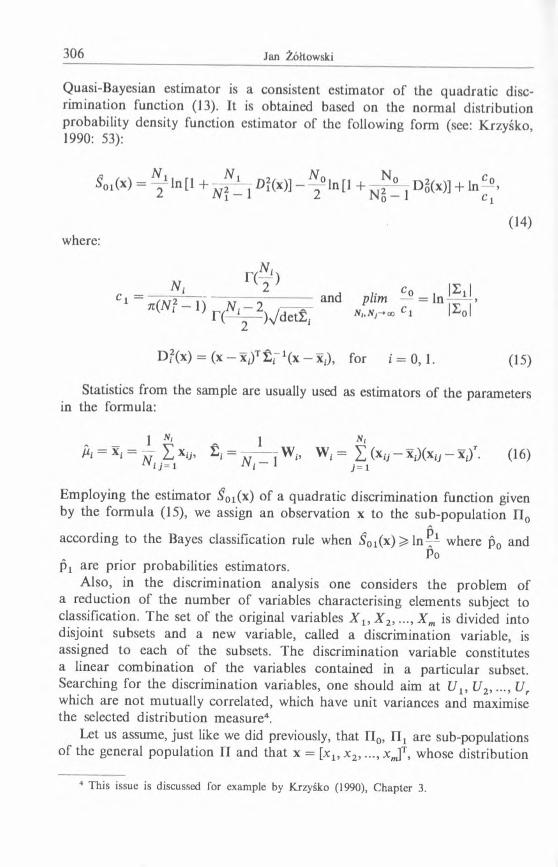
Quasi-Bayesian estim ator is a consistent estim ator o f the quadratic discrim ination function (13). It is obtained based on the norm al distribution probability density function estim ator o f the following form (sec: Krzyśko, 1990: 53):
V M = y ln t1 + - у ln [• + D° ^ + ln c~*
(14)where:
Г (— )N ‘ 2 c 0 , |X Jc i — ~Tkt2— T\ — ---- i ----------- and phm — = ln — —»
'x »l
D?(x) = (x — Xj)T £ f x(x — Xj), for i = 0 ,1 . (15)
Statistics from the sample are usually used as estimators o f the parameters in the formula:
1 Nl л 1 N<Á = x i = дг I х . , l ~ m T ^ = Z (*u - x i)(xu - X(). (16)
iVi J= 1 /V ;— J !
Em ploying the estim ator Ś0i(x) o f a quadratic discrim ination function given by the form ula (15), we assign an observation x to the sub-population П 0
according to the Bayes classification rule when S01(x) 55 l n 1,1 where p0 andPo
p x are prior probabilities estimators.A lso, in the discrim ination analysis one considers the problem of
a reduction o f the num ber o f variables characterising elements subject to classification. The set o f the original variables X u X 2, ..., X m is divided into disjoint subsets and a new variable, called a discrim ination variable, is assigned to each o f the subsets. The discrim ination variable constitutes a linear com bination o f the variables contained in a particular subset. Searching for the discrim ination variables, one should aim at U t , U2, ..., Ur which are no t m utually correlated, which have unit variances and maximise the selected distribution m easure4.
Let us assume, just like we did previously, that П 0, П , are sub-populations o f the general population П and that x = [x „ x 2, ..., x J T, whose distribution
4 T his issue is discussed for example by K rzyśko (1990), C hapter 3.

is m u ltiv aria te norm al, is the realisa tion o f a random vector X = [X ,, X 2, ..., X J 7 in the sample.Let Al t A2, —Д г be the largest roots of the equation:
det(B — IW ) = 0, (17)
and I , , I 2 )...,I , vectors o f length 1 satisfying the following m atrix equation:
( B - I j W ) í = 0, (18)
respectively for j = 1 ,2 ,..., r where
W = (W 0 + W 1),
В = N 0(x0 - x)(x0 - X)T + N f a - x)(xx - X)T,
_ = JV0 Xq + N ^ jx n 0 + n T
The discrim inatory variable Üj can be estimated from the sam ple as:
17 j = t jx . (19)
D enoting by 0 = [Üt , Ü 2, Ü r]T and v, = [ í t j í 2 J ... j i r ]Tx; for i = 0 ,1 we obtain the following form o f the classification function:
Si (0 ) = - ^ (0 - vf)T(C - V,.) + ln p , (20)
O bservation x is assigned to the sub-population П 0, when S0(C) > ^ (Ü ) .
IV. E M PIR IC A L E X A M PLE
In his o r her credit application a client provides basic data (such as personal inform ation, address, net income, additional sources of income, housing and other stable m onthly expenses, potential obligations to serve in the army) and supplemental data (regarding his or her housing situation, m arital status, num ber o f members o f the household, type o f employer and years worked for that employer, finally regarding the num ber o f credits taken or guaranteed).
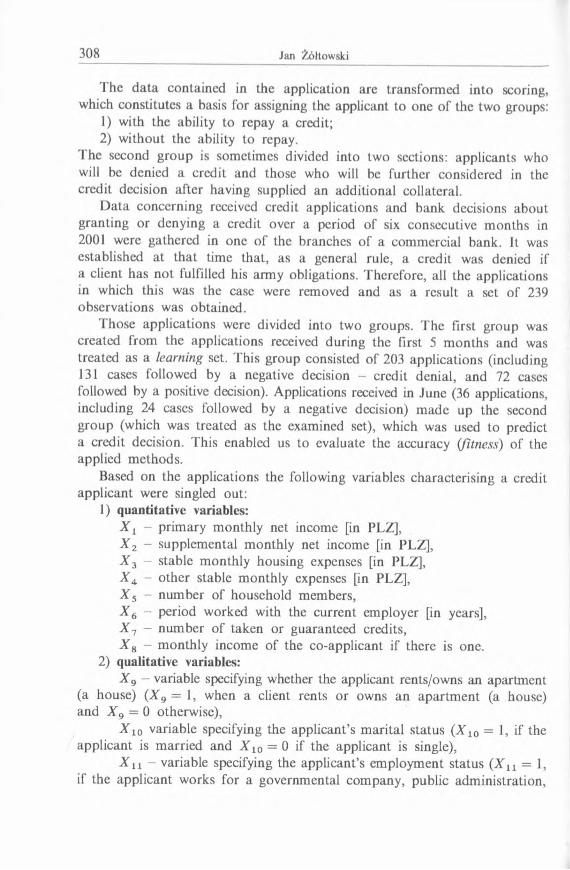
The da ta contained in the application are transform ed into scoring, which constitutes a basis for assigning the applicant to one o f the two groups:
1) with the ability to repay a credit;2) w ithout the ability to repay.
T he second group is sometimes divided into two sections: applicants who will be denied a credit and those who will be further considered in the credit decision after having supplied an additional collateral.
D ata conccrning received credit applications and bank decisions about granting or denying a crcdit over a period of six consecutive m onths in 2001 were gathered in one o f the branches o f a commercial bank. It was established at that time that, as a general rule, a credit was denied if a client has not fulfilled his army obligations. Therefore, all the applications in which this was the case were removed and as a result a set o f 239 observations was obtained.
Those applications were divided into two groups. T he first group was created from the applications received during the first 5 m onths and was treated as a learning set. This group consisted of 203 applications (including 131 cases followed by a negative decision - crcdit denial, and 72 cases followed by a positive decision). Applications received in June (36 applications, including 24 cases followed by a negative decision) m ade up the second group (which was treated as the examined set), which was used to predict a credit decision. This enabled us to evaluate the accuracy (fitness) o f the applied m ethods.
Based on the applications the following variables characterising a crcdit applicant were singled out:
1) quantitative variables:Xy - prim ary m onthly net incomc [in PLZ],X 2 - supplemental m onthly net income [in PLZ],X 3 - stable m onthly housing expenses [in PLZ],X 4 - o ther stable m onthly expenses [in PLZ],X s - num ber o f household members,X 6 - period worked with the current employer [in years],X 7 - num ber o f taken or guaranteed credits,X B - m onthly income o f the co-applicant if there is one.
2) qualitative variables:X 9 - variable specifying whether the applicant rents/owns an apartment
(a house) ( X g = 1, when a client rents or owns an apartm ent (a house) and X 9 = 0 otherwise),
X l0 variable specifying the applicant’s m arital status (X 10 = 1, if the applicant is m arried and A'lo = 0 if the applicant is single),
Xyy - variable specifying the applicant’s em ploym ent status ( I u = 1, if the applicant works for a governmental com pany, public adm inistration,

owns a proprie to rsh ip or is a partner in a partnersh ip and X u = 0 otherwise).
A crcdit application decision m ade by a bank can be described by a binary variable:
The am ount o f credit requested in the application [in PLZ] is an additional variable: У2.
Two new variables were derived:X 12 - net discretionary income (a sum of prim ary and supplemental
net income after deducting stable m onthly expenses, X 12 = (X j + X 2) —
X i2 - disposable gross income (the sum of the net income of the applicant and the co-applicant X 13 = X l2 + X 8).
Let us consider the problem o f predicting, which o f the two groups a client will be assigned to based on the decisions m ade in the learning set and on the d ata regarding the new client. We will utilise probit models and Bayes discrim ination analysis m ethod to examine this problem .
In order to com pare results o f the client classification obtained with different m ethods described above, we had to select variables, which can be employed by all m ethods. In particular, norm al distribution o f all utilised variables was assumed in Bayes discrim ination. We verified tha t X l2 and
Therefore, basic variables used in all examined models were: w1 = ln X 12 and w2 = lnA '13- l n У2.
Three types o f probit m odel were analysed:
1, when a credit was granted 0, when a credit was nokt granted
( * 2 + * 4 » ,and
2
(21)
Ф 1 = ßo + ß l Wl + ßzw2 + РзХд + t]2, (22)
Ф “ 1 = ľ o + ľ lWl + ľ 2 W2 + ľ 3 * 9 + ľ 4 * 1 0 + ' / 3 . (23)

where:w, = ln J ŕ 12 - logarithm o f net discretionary income,
Xw2 = In 13 - logarithm of gross disposable income and credit am ount,
^ 2X 9 - binary variable accepting the value of 1 if an applicant rents or
owns an apartm ent (house),X 10 - binary variable accepting the value of 1 if an applicant is married.
After an application of a probit analysis and estim ation5 of appropriate probit models param eters (based on the data from the learning set) we have obtained the following results:
Table 1. Accuracy of credit applications classification based on prob it m odels
M odelObserved value У,
Results for the learning set Results for the exam ined set
Predicted value У, %accurate
class.
Predicted value У1 %accurate
class.0 1 0 1
(21) 0 117 14 89.3 19 5 79.21 20 52 72.2 3 9 75.0
(22) 0 121 10 92.4 22 2 91.7
1 11 61 84.7 2 10 83.3
(23) 0 124 7 94.7 20 4 83.3
1 7 65 90.3 1 11 91.7
Source: A u th o r’s com putations.
While analysing the results, we note that for the learning set, the percentage o f accurate classification based on model (21) is relatively high (89% and 72%). However, classification based on probit m odels (22) and (23) is more accurate (the number o f correctly predicted credit decisions increases). Models “ perform better” in term s of identifying the cases o f credit denial in the learning sample. The percentage of an accurate prediction o f a credit denial is 17 points higher than the percentage o f an accurate prediction o f a credit granting decision (for model (21)). F o r the examined sample (unfortunately, not very numerous) the general situation regarding the accuracy o f prediction is similar.
Using the estim ator S0t(x) of a quadratic discrim ination function given by the form ula (14), observation x is assigned to sub-population П 0(У, = 0),
according to the Bayes classification rule if S01( x ) ^ ln „ .<?o

The mean values, variances and a covariance o f variables w ,, w2 for both sub-populations were derived from the learning set (including 203 observations from the first 5 m onths o f 2001) and x = wU) = [w ^w ^]7 was substituted in form ula (14). As a result, wc have arrived a t the following form of an estim ator o f a discrim ination function for an i-th observation:
Śoi(vyU)) = 36 ln [1 + 0.01389 D f(w 0))] — 65.5 ln [1 + 0.00763 Dg(wü))] - 1.0376
(24)where:
Do(wU)) = 11.6419(wV> — 6.7118)2 4.78541(w^> + 1.1622)2 +
- 4.5013(wi" - 6 .7118)(w ^)+ 1.1622)
D?(w“>) = 10.8785(wV> - 7.2581)2 + 12.1320(wj/> + 0.5310)2 +
- 7.2689(wV> - 7.2581 -I- 0.5310)
F o r each element j o f the learning set (j = 1 ,2 ,..., 203) and the examined set (j = 204, ...,239) (crcdit applicant), the values of a discrim ination function s ot(w 0)) were co m p u ted 6 based on the estim ated elem ents o f vector
wVn■ 1 hen credit applications were assigned to sub-population П 0,
namely to the set o f applications followed by a credit denial, when
Soi(wU))5= -0 .5985
and to sub-population П х of applications followed by a credit granting decision otherwise. The following classifications o f credit applications have been received:
Tabic 2. Accuracy of credit applications classification based on the value o f the quadraticdiscrim ination function estim ator
Results for the learning set R esults for the exam ined set
Observed Predicted value Predicted valuevalue У, % accurate
1% accurate
class. class.0 1 0 1
0 117 14 89.3 19 5 79.21 14 58 80.6 2 10 83.3
Source: A u th o r’s com putations.

While analysing the results we note that, the percentage o f accurate classifications for the learning set is 89% and 80%. The classification obtained with the estim ator o f a quadratic discrim ination function (24) “ performed better” in predicting credit denial. The percentage of accurate prediction o f credit denial is 9 points higher than that of a credit granting decision. F o r the examined sample (unfortunately not very num erous) the general situation regarding the accuracy o f prediction is similar. However, the percentage o f a correct prediction of a credit granting decision increased (by 3 points) and the percentage of a correct prediction o f credit denial decreased (by 10 points).
Variables used in the discrim ination were (just like above) variables wx, w2. Having com puted their m ean values, variances and their covariance for both sub-populations we received: x x, £ 0, W 0, x 1( £ 1; W „ and then derived for the entire learning set x, W, B.
In order to approxim ate a discrim ination variable from the sample ú, Л = т а х { Я 1,Д2} was introduced, where Я,,Я2 symbolise roots of the quadratic equation (17), and was estimated as 2 = 0.934984. Vector Í satisfying equation(18) turned out to have the following elements I = [0.8805 0.4741]T.
Therefore, the following linear com bination o f the variables Wj, w2 is a discrim ination variable form the sample:
ü = 0.8805 wt + 0.4741 w2. (25)
Having com puted constants v1 (for the sub-population I I0) and v2 (for the sub-population П ,) we received the explicit forms o f estim ators o f both classification functions7.
S0(ü) = - ^ (0.8805 wx + 0.4741 w2 - 5.3581)2 + ln p0,
S ^ ü ) = - *(0.8805 w i + 0.4741 w2 - 6.139)2 + ln p x.
On their basis the follow ing credit app lications classification was o b ta ined8:
7 Let us no te th a t the discrim ination function estim ator derived from both classification functions would take the following form: S01(u) = — 0.6877*v, —0.3702w2 +4.5963 .
8 C om putations obtained from Excel 5.0.
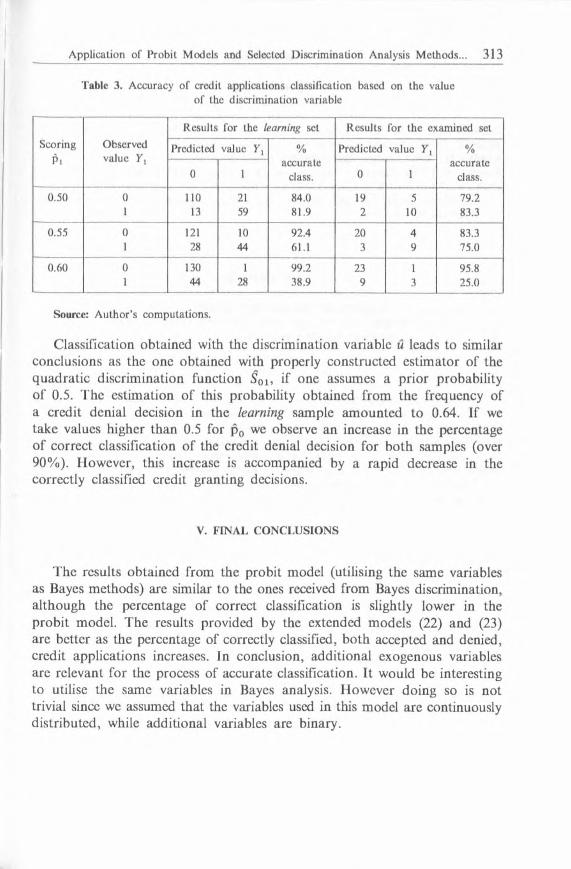
Table 3. Accuracy o f credit applications classification based on the value o f the discrim ination variable
ScoringPi
Observed value У,
Results for the learning set R esults for the exam ined set
Predicted value У, %accurate
class.
Predicted value У, %accurate
class.0 1 0 1
0.50 0 110 21 84.0 19 5 79.21 13 59 81.9 2 10 83.3
0.55 0 121 10 92.4 20 4 83.31 28 44 61.1 3 9 75.0
0.60 0 130 1 99.2 23 1 95.81 44 28 38.9 9 3 25.0
Source: A u th o r’s com putations.
Classification obtained with the discrim ination variable ü leads to similar conclusions as the one obtained with properly constructed estim ator of the quadratic discrim ination function S0x, if one assumes a prior probability o f 0.5. The estim ation o f this probability obtained from the frequency of a credit denial decision in the learning sample am ounted to 0.64. If we take values higher than 0.5 for p 0 we observe an increase in the percentage o f correct classification o f the credit denial decision for both samples (over 90% ). However, this increase is accompanied by a rapid decrease in the correctly classified credit granting decisions.
V. FIN AL C O N C LU SIO N S
The results obtained from the probit model (utilising the same variables as Bayes m ethods) are similar to the ones received from Bayes discrimination, although the percentage o f correct classification is slightly lower in the probit model. T he results provided by the extended m odels (22) and (23) are better as the percentage o f correctly classified, bo th accepted and denied, credit applications increases. In conclusion, additional exogenous variables are relevant for the process of accurate classification. I t would be interesting to utilise the same variables in Bayes analysis. However doing so is not trivial since wc assumed that the variables used in this model are continuously distributed, while additional variables are binary.

R EFER EN C ES
Bartosiewicz S. et al. (1990), Estymacja modeli ekonometrycznych, PW E, W arszawa.Jajuga K. (1990), Statystyczna teoria rozpoznawania obrazów, PW N, W arszawa.K rzyśko M . (1990), Analiza dyskryminacyjna, Wyd. N aukowo-Techniczne, W arszawa. K rzyśko M . (1998), S ta tystyka matematyczna, Wyd. N auk. U A M , Poznań.Pruska K . (2001), M odele probitowe i logitowe w program ach nauczania studiów ekonomicznych,
[in]: M etody analizy cech jakościowych w procesie podejmowania decyzji (working papers), W yd. U Ł , Łódź, 89-98.
J a n Ż ó łto w s k i
Z A ST O SO W A N IE M O D E LI PR O B ITO W Y C H I W YBRANYCH M E T O D AN ALIZY D Y SK R Y M IN A C Y JN EI
DO PR ZEW ID Y W A N IA D E C Y Z JI K R E D Y TO W E J
Streszczenie
O bsługa kredytów konsum pcyjnych jest jednym z rodzajów działalności banków . Zdolność kredytow a klienta jest oceniana na podstawie złożonego przez niego wniosku.
W pracy rozw ażany jest problem przewidywania, do której z dw óch grup klientów, posiadających zdolność kredytow ą lub nie (w ocenie banku), zostanie zaliczona osoba ubiegająca się o kredyt. Analizow ane są tu możliwości zastosow ania modeli probitow ych oraz m etod analizy dyskrym inacyjnej wykorzystujących kw adratow ą funkcję dyskrym inacyjną i zmienną dyskrym inacyjną z próby. Przeprow adzona jest także ocena popraw ności klasyfikacji danych z pewnego banku.