Embed Size (px)
Citation preview

ACS NSQIP: Preventing complications Reducing costs Improving surgical care
Wednesday, October 8, 2014 Presentation to: New South Wales Agency for Clinical Innovation Sydney, Australia

ACS Mission Statement
ACS Mission: Dedicated to improving the care of the surgical patient and to safeguarding
standards of care in an optimal and ethical practice environment

NSQIP: Improving Surgical Care and Outcomes
High Quality Surgical Care
Data Collection/ Analysis/
Risk-adjusted outcomes
Feedback; QI Planning
Tools/ Guidelines/ Teamwork/
Set Standards/ Partnerships

Improving Care, Reduce Costs

Current Participants

ACS NSQIP: Proven to Reduce Complications, Save Lives
2009 Annals of Surgery study:
• Prevent 250-500 complications annually
• Save 12-36 lives annually
• Leading to reduced costs

What is ACS NSQIP?
• Hospital based quality improvement program • Risk and Case Mix-Adjusted 30 Day Clinical Outcomes • Data collected by trained abstractors • Allows benchmarking among participating sites • Data entry via web-based Workstation • Based solely in English • Based upon CPT Codes • Multi-specialty (GS, Vasc, Ortho, NS, Uro, Gyn…) • Improvement/Educational “Tools”: Best
Practices/Guidelines (e.g. SSI, UTI), case studies, collaboratives, Calculator, partnerships (Joint Commission, IHI, CMS, AHRQ, CUSP, ERAS, others)

Data Integrity
• Trained Surgical Clinical Reviewers (SCRs)
• Annual SCR Certification Exam
• Data Validation in Workstation
• Inter Rater Reliability Audits
• Webinars/Conference calls
• Clinical & Technical Support
• ACS NSQIP National Conference
• Surgeon Champion/SCR/Administrator Toolkits
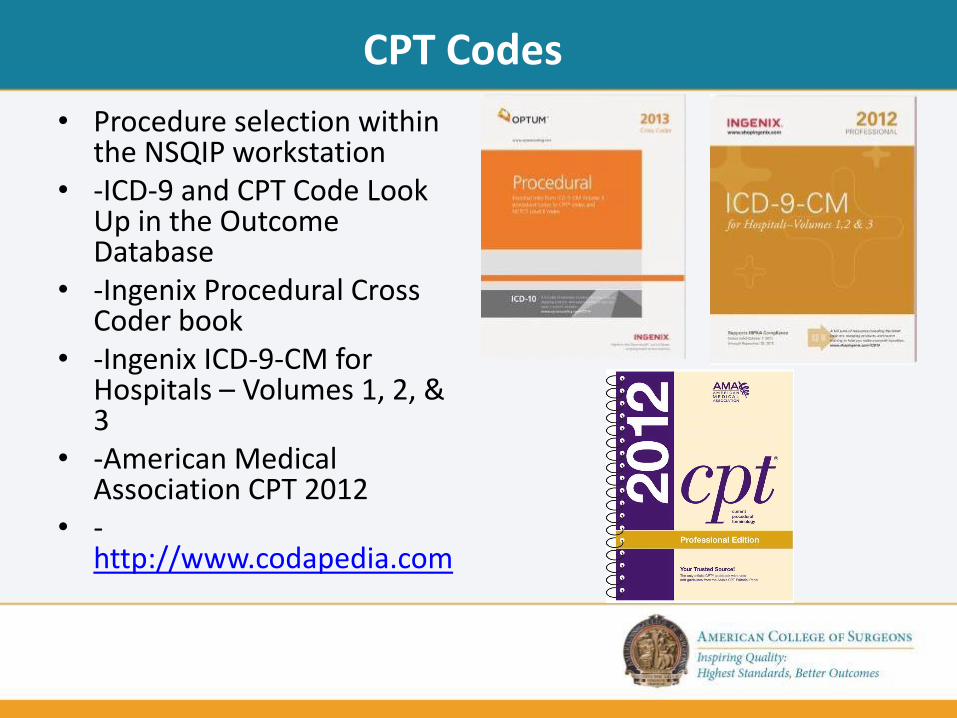
CPT Codes
• Procedure selection within the NSQIP workstation
• -ICD-9 and CPT Code Look Up in the Outcome Database
• -Ingenix Procedural Cross Coder book
• -Ingenix ICD-9-CM for Hospitals – Volumes 1, 2, & 3
• -American Medical Association CPT 2012
• -http://www.codapedia.com

Clinical Data Better for Measuring Quality

Following Patients After Discharge
• Half or more of all complications occur after discharge
• Quality programs based on admin data don’t track post-discharge
• Complications after discharge can lead to readmissions
Tracking quality can’t stop at the hospital’s door

30-Day Post-Op Follow Up Review
Outcome /follow-up information can be
obtained in a variety of ways:
• Review of the patient’s medical record.
• Screen for readmissions
• Separate clinic or the private surgeon’s office -outpatient follow-up visits
• Additional methods would be either a phone call placed directly to the patient or a follow-up letter can be mailed for the patient to respond to in writing

Surgeon Champion (SC) • Program Mentor/Advocate
Surgical Clinical Reviewer (SCR) • Data Collector
*Remember that the nature of this relationship will
determine the success of your program
Program Staffing

Surgeon Champion Qualifications
• Well Respected & Highly Regarded
• Chief of Surgery or Chief Medical Officer
• Program Mentor/Advocate
• Must be trusted by peers and administration
• Experience with Quality Improvement
• Lead Quality Improvement Initiatives
• Participate in Monthly SC Conference Calls
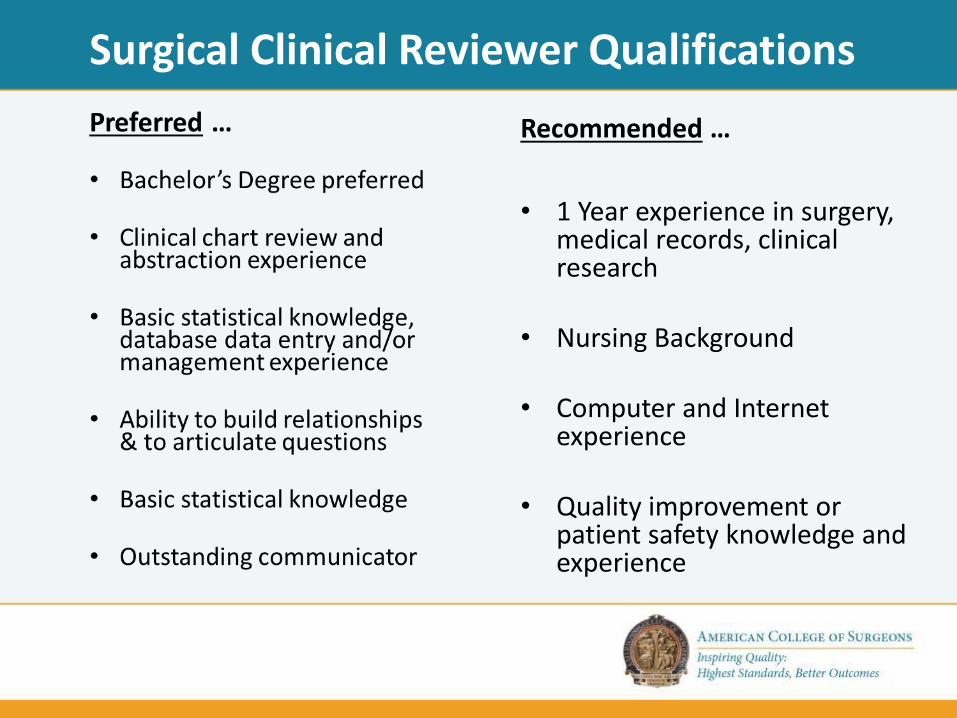
Recommended …
• 1 Year experience in surgery,
medical records, clinical research
• Nursing Background
• Computer and Internet experience
• Quality improvement or patient safety knowledge and experience
Surgical Clinical Reviewer Qualifications

SCR Training
• Registration available after invoice payment • Online, Web-Based Training • 4 Weeks Total • Weekly webinars and Conference Calls
– 1 to 2 every week
• Recorded Sessions available due to time difference
• Workstation Access – Week 2 • Data collection starts - Week 2 • Certification Exam - 6 months and every October
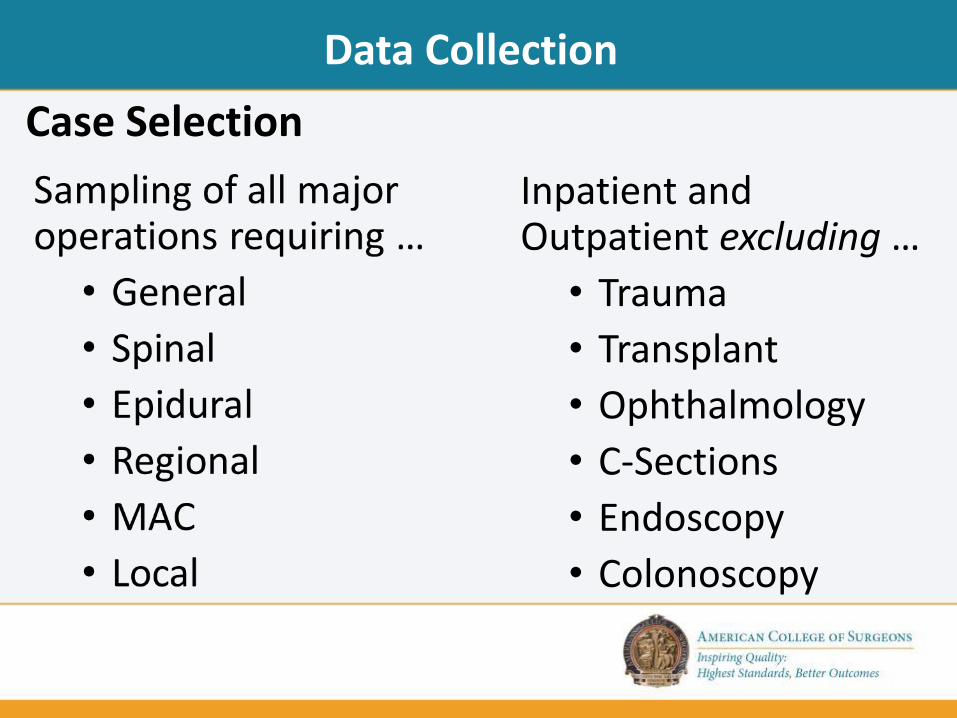
Inpatient and Outpatient excluding …
• Trauma
• Transplant
• Ophthalmology
• C-Sections
• Endoscopy
• Colonoscopy
Data Collection
Case Selection

Data Collection
• A randomized sampling system called
the 8-day cycle
- Required to submit data on 42, 8-day cycles/year - ~40 cases every 8-day cycle = 1,680 cases annually
Sampling Methodology

Risk and Case-Mix Adjustment Matters
To judge care fairly and understand where problems are occurring:
• Health of the patient must be considered
- Patient characteristics
- Pre-op Risk Factors
• Risk of the procedure must be considered
- All variations in surgical outcomes
- Surgical Complexity

Risk Adjustment
An Odds Ratio of 1 is like “par on a golf course” – the score that is expected It is a metric showing the risk-adjusted performance at a specific site compared to the average hospital
• An Odds ratio < 1 means that the site is performing better than expected, while a ratio > 1 indicates an excess of adverse events
• The odds is defined as the #events / #non-events i.e. 5/95=.053, is the odds for a hospital if there are 5 deaths among 100 patients • Our Odds Ratio is the risk-adjusted odds for an event at a site divided
by the odds for an event at the average site
• Our Odds Ratios are also adjusted so they are useful even for hospitals that provide very small samples
Odds Ratios

Audits
3.15%
2.26% 1.99% 1.56%
0%
10%
Inter-Rater Reliability (% Disagreement)
2005
2006
2007
2008
Data Needs to be Believed: Validation with Audits

Audits Annual random 5% selection of all ACS NSQIP participating hospitals
Hospital is given 4 to 6 weeks’ notice of a site visit
12 to 24 charts are selected and access to the OR Log Book
ACS representatives are sent to review charts
1 to 2 day process
Results are provided within a summary report
o Disagreement(s) of variables/operative log book
o Re-education requirements if needed
o Pass/Fail/Incomplete score

Available Data
Real-Time/On Line Reports •Allows comparison to other ACS NSQIP
hospitals using online reports
Interim & Semiannual Benchmark Reports •Provides risk-adjusted comparisons of all ACS
NSQIP hospitals regarding morbidity, mortality, and complications
Participant Use File •Contains all cases reported from 2004 to date

Reporting
• Workflow Reports
• Site-Level Reports
• Database Statistics
• Data Analysis
Real Time Reports

Reporting
30 Day Post-Op Summary

Reporting
Mortality Patient Report

Reporting Post-Operative Occurrence Analysis

Reporting

Reporting

Online Collaborative Report: Hospital

Online Collaborative Report: Leadership & Administration

Reporting
Semiannual Report
Risk adjusted for hospital-to-hospital patient mix differences.

Reporting
• 30-Day Mortality • 30-Day Morbidity • 30-Day Death and Serious Morbidity • Cardiac Occurrences • Pneumonia • Unplanned Intubation • Ventilator Dependence >48 hours • DVT/PE • Renal Failure • Urinary Tract Infection/UTI • Surgical Site Infection/Deep & Organ Space SSI • Colorectal LOS • Unplanned Return to the OR
Over 195 Risk-Adjusted Models

Reporting

SAR Model Summary Reports
Sit
es
Inclu
ded
Tota
l C
ase
s
Ob
serv
ed
Eve
nts
Ob
serv
ed
Rate
Low
Ou
tlie
rs
Hig
h O
utl
iers
1st
Decil
e
10th
Decil
e
Exem
pla
ry
Need
s Im
pro
vem
en
t
Overall (General / Vascular)
Mortality 289 278,198 4,429 1.59 2 6 28 29 28 29
Morbidity 1 289 278,198 27,427 9.86 34 41 28 29 37 45
Cardiac 3 289 278,198 2,423 0.87 5 16 28 29 28 29
Pneumonia 289 277,791 3,792 1.37 13 35 28 29 28 40
Unplanned Intubation 289 277,890 3,535 1.27 8 21 28 29 28 29
Ventilator > 48 Hours 289 276,643 4,505 1.63 9 21 28 29 28 33
DVT / PE 4 289 278,198 2,591 0.93 0 14 28 29 28 29
Renal Failure 5 289 277,979 2,096 0.75 1 9 28 29 28 29
UTI 11 289 277,724 3,881 1.40 15 38 28 29 28 40
SSI 6 289 275,905 11,002 3.99 32 46 28 29 35 54
Site
s In
clu
ded
Tot
al C
ases
Ob
serv
ed E
ven
ts
Ob
serv
ed R
ate
Low
Ou
tlie
rs
Hig
h O
utl
iers
1st
Dec
ile
10th
Dec
ile
Exe
mp
lary
Nee
ds
Imp
rove
men
t
Overall (Multispecialty - All Cases)
Mortality 289 398,906 5,368 1.35 7 6 28 29 28 29
Morbidity 1 289 398,906 34,993 8.77 43 54 28 29 45 56
Cardiac 3 289 398,906 2,968 0.74 9 24 28 29 28 33
Pneumonia 289 398,397 4,772 1.20 18 42 28 29 28 45
Unplanned Intubation 289 398,545 4,320 1.08 15 28 28 29 28 31
Ventilator > 48 Hours 289 397,033 5,362 1.35 17 31 28 29 28 35
DVT / PE 4 289 398,906 3,728 0.93 2 23 28 29 28 30
Renal Failure 5 289 398,656 2,540 0.64 1 11 28 29 28 30
UTI 11 289 398,137 5,847 1.47 28 48 28 29 34 50
SSI 6 289 396,257 12,961 3.27 31 59 28 29 32 60

Site Summary Report (SAR & ISAR)

Semi-Annual Report: Site Specific Bar Plot

SAR Collaborative Report

SAR Collaborative Report
Decile OR Range
Model Name 1 2 3 - 8 9 10 Min Max
GEN Mortality 7 7 7 7 7 0.79 1.38
GEN Morbidity 6 6 6 6 6 0.85 1.26
GEN Cardiac 9 9 9 9 9 0.87 1.55
GEN Pneumonia 6 6 6 6 6 0.55 1.46
GEN Unplanned Intubation 8 8 8 8 8 0.90 1.34
GEN Ventilator > 48 Hours 6 6 6 6 6 0.84 1.38
GEN DVT/PE 7 7 7 7 7 0.87 1.44
GEN Renal Failure 6 6 6 6 6 0.77 1.39
GEN UTI 7 7 7 7 7 0.72 1.64
GEN SSI 7 7 7 7 7 0.81 1.50
GEN ROR 8 8 8 8 8 0.91 1.66
• Collaborative ranking by decile for the most recent SAR period
• Collaborative “Minimum” and “Maximum” OR based on Hospital ORs

• Each collaborative hospital is represented by a yellow dot on the corresponding line (which represents all NSQIP hospitals) – All hospitals may not have cases fitting a specific model. Thus, fewer dots
would appear on the corresponding line.
• Rankings are based on Hospital ORs from the most recent SAR – Lower ranks indicate lower ORs, while higher ranks indicate higher ORs
Rank of Collaborative Hospitals

Collaborative GENERAL Dashboard
• Collaborative ORs and Deciles from the current and past SAR
• Percentage of “Exemplary”, “As Expected”, and “Needs Improvement” hospitals from the most recent SAR
• Provided for 6 GENERAL NSQIP models: – Mortality, Morbidity, Pneumonia, Unplanned Intubation, DVT/PE, SSI
Previous SAR values

Collaborative Current SAR Summary
• Collaborative Level – Case Counts
– ORs and Deciles
– Hospital Percentages
• All of NSQIP
– Full OR Range
– Interquartile OR Range
Collaborative NSQIP ORs
SAR Model Name Total
Cases
Observed
Cases OR Decile
Percent
"Exemplary"
Percent "As
Expected"
Percent "Needs
Improvement"
Minimum
OR
25th
Percentile
75th
Percentile
Maximum
OR
General
13 GEN Mortality 9031 119 1.10 7 0 71 29 0.56 0.90 1.14 2.02
14 GEN Morbidity 9031 680 1.06 6 0 86 14 0.51 0.87 1.19 3.00
15 GEN Cardiac 9031 57 1.16 9 0 71 29 0.60 0.91 1.10 1.78
16 GEN Pneumonia 9001 90 1.01 6 14 86 0 0.32 0.76 1.34 5.09
17 GEN Unplanned Intubation 9022 98 1.16 8 0 100 0 0.55 0.87 1.17 2.02
18 GEN Ventilator > 48 Hours 8996 97 1.01 6 0 100 0 0.36 0.83 1.22 2.81
19 GEN DVT/PE 9031 74 1.10 7 0 86 14 0.49 0.87 1.16 2.46
20 GEN Renal Failure 9023 46 1.03 6 14 57 29 0.52 0.90 1.13 3.25
21 GEN UTI 9014 97 1.19 7 0 86 14 0.46 0.84 1.23 2.26
22 GEN SSI 8935 345 1.14 7 0 71 29 0.49 0.83 1.22 4.54
23 GEN ROR 9031 250 1.16 8 0 71 29 0.54 0.89 1.14 2.14

ACS NSQIP: Proven to Reduce Complications, Save Lives
2009 Annals of Surgery study:
• Prevent 250-500 complications annually
• Save 12-36 lives annually
• Leading to reduced costs

Surgical Complications Drive Readmissions
2012 Journal of the American College of Surgeons study:
• Surgical complications key driver of 30-day readmissions
• SSIs – 22%
• Gastrointestinal – 28%
• Pulmonary – 8%

ACS NSQIP: Better Care, Lower Costs
Not only will patients benefit, but hospitals see a significant return on their investment with ACS NSQIP.
• Significant cost savings per year
• Reduced readmissions and reduced lengths of stay translate to better patient outcomes, better satisfaction and even more cost reduction
• Pays for itself by avoiding about a dozen surgical complications

ACS NSQIP: Reducing Costs Surry Memorial Hospital in Vancouver, BC
• $2.7 million savings over two years by reducing breast surgery SSI by 13.3% and general and vascular SSI by 5.7%
• Averted ~$380,000 in costs over 4 months via initiatives to reduce UTI’s
Henry Ford in Detroit
• $2 million annual savings and 1.54 days reduced LOS
Baptist Hospital of Miami
• $4 million annual savings • Sustained efforts to reduce its rate of hospital-acquired
infections have led to a savings of about $4 million a year since 2007

ACS NSQIP: Reducing Costs Winthrop University Hospital, Mineola, NY • Reduction in Pneumonia from 1.36% (July 2011) to 1.25% (July 2012)
= $1,436,305.00 (65 averted cases)
• Ventilator >48hours reduction from 1.9% (July 2011) to 1.04% (July 2012) = $2,903,655.00 (105 averted cases)
Savings exceeding >$4,000,000.00
Beaumont Hospital in Royal Oak, MI • $2.2 million savings reduced average LOS by 6.5 days by reducing SSI.
• Nearly 300 SSI’s prevented in 2009
Stanford in Stanford, CA • SSI reduced from 1.03 to 0.58 at a savings of $28,000 per SSI.
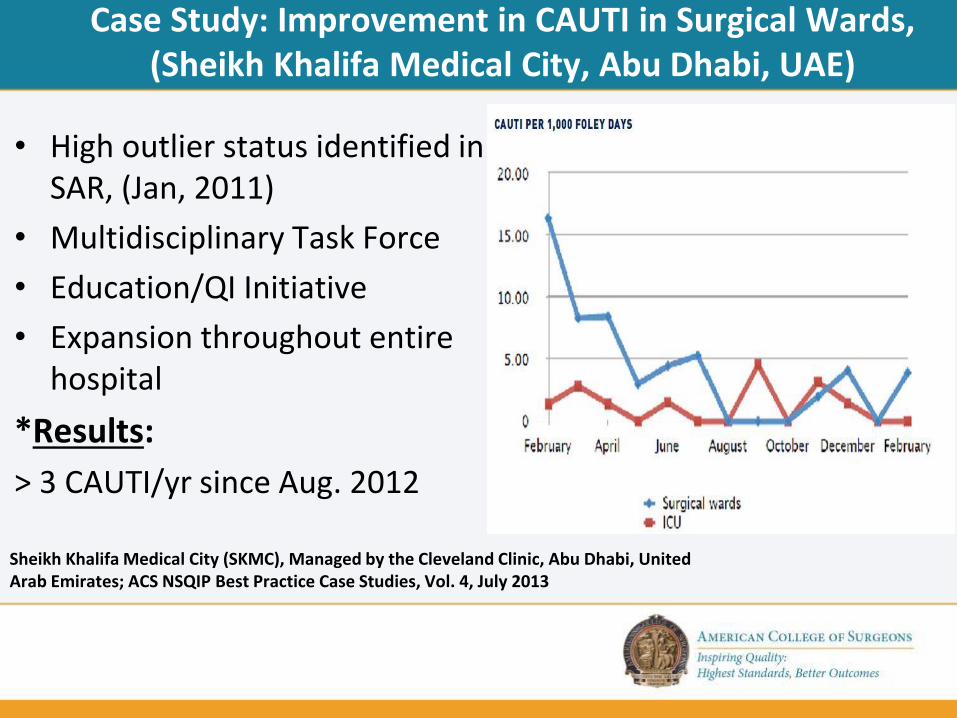
Case Study: Improvement in CAUTI in Surgical Wards, (Sheikh Khalifa Medical City, Abu Dhabi, UAE)
• High outlier status identified in SAR, (Jan, 2011)
• Multidisciplinary Task Force
• Education/QI Initiative
• Expansion throughout entire hospital
*Results:
> 3 CAUTI/yr since Aug. 2012
Sheikh Khalifa Medical City (SKMC), Managed by the Cleveland Clinic, Abu Dhabi, United Arab Emirates; ACS NSQIP Best Practice Case Studies, Vol. 4, July 2013

ACS NSQIP System Participation
• Discounts for systems enrolling multiple hospitals
• Ability to work on QI together, as other hospitals enroll
• Ability to collect custom variables to tailor to system’s needs
• Possible to share resources across system hospitals
• Greater impact on system’s bottom line

2
Collaborative Case Study: BC UTI Improvement Project
Notable Gains in UTI Rates across 10 Hospitals
• A collective drop in UTI rates from 3% before Apr. 2012 to 2.25% in 2013
• A combined average of 39 events/month before Apr. 2012 to 31.5/month after Apr. 2013

2
Case Study: Vancouver General Hospital CLEAN Program
Cost Avoidance of ~$100, 000.00 over 5 months • GOAL: Reduce
Cardiac SSI’s from 6% to 2% by Jan. 2014
• SSI team collaboration with Infection Control
• Best Practices identified & implemented
• No SSI’s since July 2013
• ~$100,000 cost avoidance

Return on Investment
• Valid benchmarking for surgical outcomes
• Provides proactive, value-oriented performance measurement before it’s dictated by outside agents
• Improves local market position through publicly visible improvement programs
• Optimizes cross-departmental partnerships and collaboration through shared knowledge
• Helps build high performance surgical teams and employee retention, (i.e. nurses)
• Offers CME’s for Surgeon Champions and CEU’s for SCR’s
Non-Monetary Benefits …

NSQIP Provides Improvement Tools and Education
• Robust Interactive Training for Abstractors (Surgical Clinical Reviewers)
• Surgeon Champion/SCR/Administrative Toolkits
• Best Practice Guidelines
• Case Studies
• Collaborative learning (Regional or Specialty)
• ERAS: Enhanced Recovery After Surgery in NSQIP
• NSQIP Annual Conference

Best Practice Guidelines
• Complete yet concise resource for health care providers and QI professionals
• Evidence-based
• Expert panel-rated
• Framework to:
• Prevent postsurgical complications
• Prioritize/direct QI efforts aimed at reducing incidence/impact of postsurgical complications

Best Practice Case Studies

Recent Publications
• American University of Beirut Medical Center, Beirut, Lebanon Postoperative outcomes after laparoscopic splenectomy compared with open splenectomy. Musallam KM, Khalife M, Sfeir PM, Faraj W, Safadi B, Abi Saad GS, Abiad F, Hallal A, Alwan MB, Peyvandi F, Jamali FR.Ann Surg. 2013 Jun;257(6):1116-23. doi: 10.1097/SLA.0b013e318275496a. [PubMed - in process]
• Vancouver General Hospital, Vancouver, British Columbia Surgical-site infections within 60 days of coronary artery by-pass graft surgery. Swenne CL, et al.; Society of Thoracic Surgeons. Adult Cardiac Surgery Database Executive Summary. Available at: http://www.sts.org/sites/default/files/documents/20112ndHarvestExecutiveSummary.pdf. Accessed July 27, 2014. • Sheikh Khalifa Medical City, Abu Dhabi, United American Emirates Are results of bariatric surgery different in the Middle East? Early experience of an international bariatric surgery program and an ACS NSQIP outcomes comparison. Nimeri A, Mohamed A, El Hassan E, McKenna K, Turrin NP, Al Hadad M, Dehni N. J Am Coll Surg. 2013 Apr 23. doi:pii: S1072-7515(13)00160-9. 10.1016/j.jamcollsurg.2013.01.063. [Epub ahead of print]
ACS NSQIP National Conference

ACS NSQIP Options
Four Adult ACS NSQIP options
1. ACS NSQIP Essentials
2. ACS NSQIP Small & Rural
3. ACS NSQIP Procedure Targeted
4. ACS NSQIP Measures
ACS NSQIP Pediatric

The Options
• Interim and Semi Annual Reports
• Real Time Online Reports (including new SPCs)
• Benchmarking
• ACS NSQIP Best Practices/Guidelines
• ACS NSQIP Improvement Case Studies
• Additional Items (e.g. Risk Calculator, Public Use File)
Regardless of Which Option, All Hospitals Will Receive:

The Options
• Risk Adjustment
• 30 Day Follow Up
• Clinical Data
• Data Audits
• SCR Training
• SCR Certification
For All Options, the Rigor and Validity of ACS NSQIP is Unchanged

ACS NSQIP Essentials
• General/Vascular = 1,680 cases per year,
8-day sampling cycle
• Multispecialty = 20% total case volume by specialty, 8-day sampling cycle
• Collection of core variables for QI purposes
– approximately 46 clinical variables
• 1 FTE

ACS NSQIP Small & Rural
• Small Hospital: < 1,680 cases per year
• 100% collection of cases across all specialties
• Collection of core variables for QI purposes
– approximately 46 clinical variables
• 1 FTE (or less depending upon case volume)

ACS NSQIP Procedure Targeted
• Larger hospitals targeting high-risk/high volume procedures
• Hospital selects procedures
• Selection may be CPT code-driven
• Minimum of 1,680 cases per year:
- 15 “Core” cases per 8-day cycle
- 25 “Procedure Targeted” cases per 8-day
cycle
• Minimum 1 FTE (or more depending on volume)

ACS NSQIP Procedure Targeted
Nine Subspecialties • General Surgery • Vascular • Gynecologic • Urologic • Plastic & Reconstructive Surgery • Otolaryngology • Orthopedic Surgery • Neurosurgery • Thoracic Surgery

ACS NSQIP Procedure Targeted
30+ Procedures Pancreatectomy▪ Colectomy ▪ Ventral Hernia Repair ▪ Bariatric ▪ Proctectomy ▪ Hepatectomy ▪ Thyroidectomy ▪ Esophagectomy ▪ Appendectomy ▪ Cartoid Endarterectomy ▪ Cartoid Artery Stenting ▪ Open AAA Repair ▪ EVAR ▪ Open Aortoiliac Bypass ▪ Endo Aortoiliac Repair ▪ Lower Extremity Open Bypass ▪ Lower Extremity Repair Endovascular ▪ Hysterectomy ▪ Myomectomy ▪ Reconstructive Procedures ▪ TURP ▪ Bladder Suspension ▪ Radial Prostatectomy ▪ Radical Nephrectomy ▪ Radical Cystectomy ▪ Muscle/Myocutaneous Flap ▪ Reduction Mammoplasty ▪ Breast Reconstruction ▪ Abdominoplasty ▪ Thyroidectomy ▪ Total Hip Arthroplasty ▪ Total Knee Arthroplasty ▪ Spine Surgery ▪ Hip Fracture ▪ Brain Tumor Procedure ▪Spine Procedure ▪ Lung Resection

ACS NSQIP Measures
• 5 High Impact Outcome Measures:
- UTI - Colorectal
- SSI - Lower Extremity Bypass
- Elderly
• Minimal Data Collection = 840 cases annually
• Collection of ~25 clinical variables
• 1/2 FTE

ACS NSQIP Peds
• >100 Clinical Variables
- Demographics
- Surgical Profile
- Pre-Operative Data (risk factors)
- Intra-Operative Data
- Post-Operative Data (outcomes)
• Patients under 18 years of age
• Additional data points for neonates for a minimum of 28 days old

SCR Staffing Requirements

Program Option Pricing

Recognition
Institute of Medicine named ACS NSQIP
“the best in the nation”
for measuring & reporting surgical quality and outcomes.

Thank You:
Questions & Discussion

Additional Program Details

Surgery: 100 Years of Quality Improvement
>80% hospitals
improve, including top
USN&WR
Minimum
Standard for
Hospitals
Joint Commission
1913 1922 1950
1951
1998
2004 2011 2012
TQIP
COMMITTEE ON
TRAUMA
SSR
Improved safety and
survival; 800+ hospitals
Individual surgeon registry: endorsed for
MOC (ABS, ABCRS), PQRS (CMS), OPPE
(JC); 5000+ surgeon users
Trauma center
designations, ATLS,
400+ hospitals 80% of incident
cancers; 1500+
hospitals

Clinical Variables

Participation Options for All Hospitals

Risk Adjustment
Risk adjustment has a profound effect in determining the true performance of a medical center
01
04
08
12
16
20
24
28
32
36
40
44
Rank by
unadjusted
Mortality
01
04
08
12
16
20
24
28
32
36
40
44
Rank by
risk-adjusted
Mortality
B
B
A
A
Changes in Medical Center Rank After Risk Adjustment For 30-Day Mortality

Customer Support
• Outcome Sciences/Quintiles: vendor support
• ACS NSQIP: Clinical support; administrative – Staff of 50+ in ACS NSQIP

Reporting
Pre-Operative Risk Factor Summary

2
System Case Study: Kaiser Permanente Zero Pneumonia Project
• Based on ACS NSQIP data, implemented post-op pneumonia bundle in Kaiser Northern California
• Cross-functional team
• Clinical, cultural and patient education issues identified
• Achieved zero pneumonia and now among top performers for this measure in ACS NSQIP
• Expect to save 200 lives/yr
Fuchshuber, PR, et al. The Power of the National Surgical Quality Improvement Program—Achieving A Zero Pneumonia Rate in General Surgery Patients. The Permanente Journal/ Winter 2012/ Volume 16 No. 1.