Embed Size (px)
Citation preview
PUBLISHED VERSION
Ponte, Giulio; van den Berg, Andrew Leo; Anderson, Robert William Gerard; Linke, Brett Justin Pedestrian protection in vehicle impacts: demystifying pedestrian testing procedures and assessment Australasian College of Road Safety "A Safe System : The Road Safety Discussion", Adelaide, Australia, 6-8 November 2013: 13 p.
Copyright - authors retain copyright of papers presented at the Australasian College of Road Safety Conferences
ACRS Conference Papers http://acrs.org.au/publications/acrs-conference-papers/
http://hdl.handle.net/2440/82804
PERMISSIONS
http://acrs.org.au/publications/acrs-conference-papers/
(Scroll down to the bottom)
In relation to copyright, the authors retain copyright of papers presented at the Australasian College of Road Safety Conferences. We would ask, however, that the conference is referenced wherever the paper is posted, including online, and that there is a link to this page.
12 May 2014
2013 Australasian College of Road Safety Conference – “A Safe System: The Road Safety Discussion” Adelaide !
1
The Pedestrian Protection in Vehicle Impacts: Demystifying Pedestrian Testing Procedures and Assessment Ponte, G.1 van den Berg, A. 1 Anderson R.W.G 1 & Linke, B1 1 Centre for Automotive Safety Research, University of Adelaide
Abstract The Centre for Automotive Safety Research has been carrying out the Australasian New Car Assessment Program's (ANCAP) pedestrian assessment since 2000. The pedestrian assessment procedures used by ANCAP are consistent with the European NCAP pedestrian testing and assessment protocols and have evolved considerably over time. The pedestrian assessment was independent of the ANCAP star rating procedure until 2012. As part of ANCAP's new vehicle safety rating requirements, a minimum pedestrian assessment result is now required for a vehicle to achieve an ANCAP five-star safety rating. This paper will summarise the current pedestrian testing and assessment procedures, as well as present a comparison of the headform score obtained between current and former test procedures when applied to the same vehicle. Additionally, the future of the ANCAP pedestrian testing program and the ANCAP road map will be briefly discussed. Keywords Pedestrian, Vehicle design, Euro NCAP, Crashworthiness, Crash test Introduction The Centre for Automotive Safety Research (CASR) has been involved in the assessment of pedestrian safety of new vehicles for the Australasian New Car Assessment Program (ANCAP) for more than a decade. The assessment involves sub-system testing of new passenger vehicles to assess their safety performance in the event of a collision with a pedestrian. Since ANCAP began testing vehicles for pedestrian safety in early 2000, it has commissioned the testing and published the results of over 100 vehicles. ANCAP pedestrian tests and assessments are consistent with the test protocols written by Euro NCAP. This allows ANCAP to additionally publish Euro NCAP test results for vehicles available in the Australian vehicle market. The relative level of pedestrian safety for a vehicle is assessed using sub-system tests which “… are intended to produce a simplified representation of each phase of a pedestrian accident” (Lawrence, 2005). Child and adult headform impactors are used to assess various defined areas of the bonnet and windscreen surface, and leg impactors are used to assess the front of the vehicle. These sub-systems correspond to the body regions most likely to be injured in car to pedestrian collisions. (Mizuno, 2003). There is evidence demonstrating that cars that perform well in Euro NCAP sub-system tests are less likely to kill or injure pedestrians in real world pedestrian collisions compared to those cars that do not perform well (Strandroth et al., 2011; Pastor, 2013).) The headforms used in the sub-system tests are equipped with sensors designed to measure the resultant deceleration during an impact which is subsequently used to determine the Head Injury Criterion (HIC): a measure of brain injury risk (for example see Lawrence, 2005). To
2013 Australasian College of Road Safety Conference – “A Safe System: The Road Safety Discussion” Adelaide !
2
assess the front of a vehicle, an upper legform impactor is used to measure femur forces and risk of pelvic fracture (bending moments) resulting from impacts to the vehicle’s bonnet leading edge, and a full legform impactor is used to measure the tibia injury risk (acceleration), knee injury risk (bending angle) and knee ligament displacement resulting from impacts with the bumper structure. Ponte et al. (2004) previously documented ANCAP pedestrian testing in Australia. The Euro NCAP pedestrian testing protocol applicable at the time was Version 3.1.1, which has since been superseded. In 2010 ANCAP adopted Euro NCAP Pedestrian Testing Protocol Version 5.0 (Euro NCAP, 2010) which introduced a significant change in the child and adult headform impactors, changes to the accelerometer requirements, accelerometer mounting specifications and changes to the calibration specifications for the headform impactors. Additionally, some changes were also made to the height the full-leg impactor test and the test conditions based on the height of the lower bumper reference line. This version was subsequently revised with various minor changes, with the final version being Version 5.3.1 (Euro NCAP, 2011b). All versions from 5.0 to 5.3.1 will be hereafter referred to as Version 5, unless otherwise indicated. The most significant change was with the child headform impactor: the size increased from 130 mm to 165 mm in diameter and the mass increased from 2.5 kg to 3.5 kg. The adult impactor remained the same size but the mass decreased from 4.8 kg to 4.5 kg. These changes and the changes in calibration requirements are consistent with technical requirements in the (EC) No. 631/2009 (European Union, 2009a), which correspond to the regulation (EC) No. 78/2009 (European Union, 2009b) for “type-approval of motor vehicles with regard to the protection of pedestrians and other vulnerable road users”. New vehicles sold within the European Union must comply with the requirements of the European Commission Regulations mentioned above. Consequently, many vehicle manufacturers were faced with differing design parameters for NCAP tests in addition to regulatory requirements. The head impactor changes simplify the design process for vehicle engineers that may be subject to various international regulatory constraints, by providing a consistent test tool specification. The potential effects caused by the changes to these head forms are examined in Searson and Anderson (2010). In 2012, Euro NCAP published the Pedestrian Testing Protocol Version 6.0 (Euro NCAP, 2012a) which is now superseded by Version 6.2.1 (Euro NCAP, 2013a) and Pedestrian Assessment Protocol – Pedestrian Protection Version 6.0 (Euro NCAP, 2012b). All versions from 6.0 to 6.2.1 will be hereafter referred to as Version 6, unless otherwise indicated. These provided a new method for head test point selection and pedestrian protection assessment, known as the ‘Grid’ method. No changes to leg impact assessment have been made. The new grid method of vehicle mark-up and test point selection aims to remove the inconsistency of test point selection and provide a higher resolution of results for the vehicle tested. More input is required from the manufacturer for this new protocol. Vehicle manufacturers are required to provide data on the expected performance of the head impact tests. The role of a testing facility (in Australia, the CASR Vehicle Testing Laboratory) is to conduct a series of tests to verify the data provided by the vehicle manufacturers and to score the vehicle accordingly. If manufacturers are unable to provide the required information, the test procedure reverts back to using Euro NCAP Pedestrian Testing Protocol Version 5.3.1.

2013 Australasian College of Road Safety Conference – “A Safe System: The Road Safety Discussion” Adelaide !
3
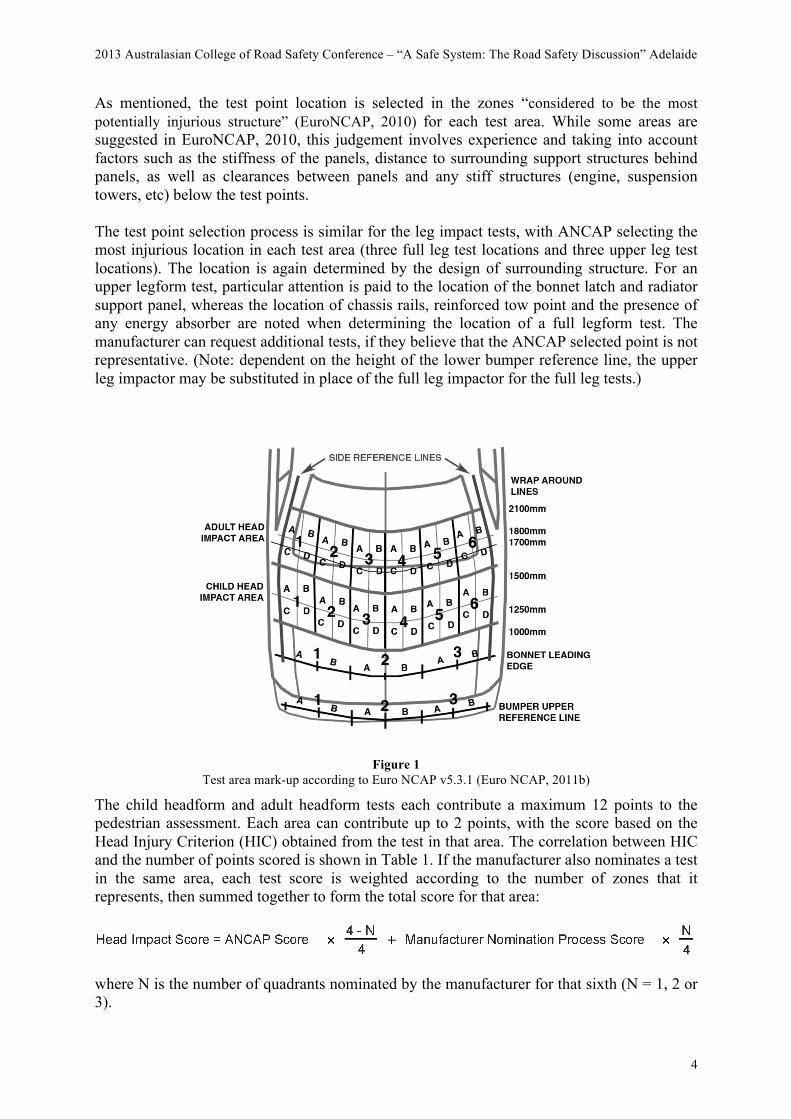
The purpose of this paper is to discuss the current pedestrian protocols so that readers might have a better understanding of the pedestrian test procedures used by ANCAP. Test Methodology There is a defined method for preparing a vehicle for testing by ANCAP. The following sections describe and compare the methods used between Version 5 and Version 6 of the Pedestrian Testing Protocol. Version 5 This is documented in detail in Euro NCAP (2011b) but can be summarized as follows, with the finished schematic result shown in Figure 1. The bonnet top and windscreen is divided into areas bound by the ‘wrap around distance (WAD)’ lines at 1000 mm, 1500 mm, 1700 mm, 2100 mm and the side reference lines1. The wrap around distance is measured with a tape pulled taut from the ground and wrapped in a parallel plane to the centerline of the car to a point on the bonnet or windscreen of a vehicle. Nominally the area between 1000 mm WAD line and 1500 mm WAD line defines the child/small adult head impact area and the area between the 1500 mm WAD line and 2100 mm WAD line defines the adult head impact area. Where the 1700 mm WAD lines fall on the bonnet surface (particularly on larger vehicles) the child/small adult head impactor is used between the 1500 mm and 1700 mm WAD lines (within the adult head impact area). The bonnet top and windscreen is divided again horizontally into six areas. Each of these six areas are further divided once across and once mid-way between wrap lines to form quadrants. This results in 6 x 4 = 24 potential test areas for the child head impact area and 24 potential test areas for the adult head impact area (see Figure 1). For the upper leg tests, the bonnet leading edge2 is divided into three areas. Each area is then sub-divided into halves resulting in six possible testing zones. Likewise for the full-leg test area, the bumper reference lines3 of the vehicle are divided into three areas and again each area is sub-divided into halves resulting in six possible testing zones (see Figure 1). One test location is chosen within each area. In total, six child headform impact tests and six adult headform impact tests are selected by ANCAP “considered to be the most potentially injurious structure” (EuroNCAP, 2010). In addition, up to six child and six adult head impact tests can be requested by the manufacturer when they believe that the test points selected by ANCAP are not considered representative of an entire area. ANCAP then selects the most potentially injurious point within the zone or zones nominated by the manufacturer.
!!!!!!!!!!!!!!!!!!!!!!!!!!!!!!!!!!!!!!!!!!!!!!!!!!!!!!!!1!Defined as the geometric trace of the highest points of contact on the side bonnet surface, made with a straight edge held parallel to the vertical longitudinal plane of the car at a 45° horizontal angle.!2!Defined as the geometric trace of the contact points on the bonnet surface, made with a straight edge held parallel to the vertical longitudinal plane of the car at a 40° horizontal angle.!3!The upper bumper reference line is defined as the geometric trace of the upper most contact points on the bumper surface, made with a straight edge held parallel to the vertical longitudinal plane of the car at a 70° horizontal angle. The lower bumper reference line is defined as the geometric trace of the lower most contact points on the bumper surface, made with a straight edge held parallel to the vertical longitudinal plane of the car at a 65° rearward horizontal angle.!
2013 Australasian College of Road Safety Conference – “A Safe System: The Road Safety Discussion” Adelaide !
4
As mentioned, the test point location is selected in the zones “considered to be the most potentially injurious structure” (EuroNCAP, 2010) for each test area. While some areas are suggested in EuroNCAP, 2010, this judgement involves experience and taking into account factors such as the stiffness of the panels, distance to surrounding support structures behind panels, as well as clearances between panels and any stiff structures (engine, suspension towers, etc) below the test points. The test point selection process is similar for the leg impact tests, with ANCAP selecting the most injurious location in each test area (three full leg test locations and three upper leg test locations). The location is again determined by the design of surrounding structure. For an upper legform test, particular attention is paid to the location of the bonnet latch and radiator support panel, whereas the location of chassis rails, reinforced tow point and the presence of any energy absorber are noted when determining the location of a full legform test. The manufacturer can request additional tests, if they believe that the ANCAP selected point is not representative. (Note: dependent on the height of the lower bumper reference line, the upper leg impactor may be substituted in place of the full leg impactor for the full leg tests.)
Figure 1
Test area mark-up according to Euro NCAP v5.3.1 (Euro NCAP, 2011b) The child headform and adult headform tests each contribute a maximum 12 points to the pedestrian assessment. Each area can contribute up to 2 points, with the score based on the Head Injury Criterion (HIC) obtained from the test in that area. The correlation between HIC and the number of points scored is shown in Table 1. If the manufacturer also nominates a test in the same area, each test score is weighted according to the number of zones that it represents, then summed together to form the total score for that area:
where N is the number of quadrants nominated by the manufacturer for that sixth (N = 1, 2 or 3).
2013 Australasian College of Road Safety Conference – “A Safe System: The Road Safety Discussion” Adelaide !
5
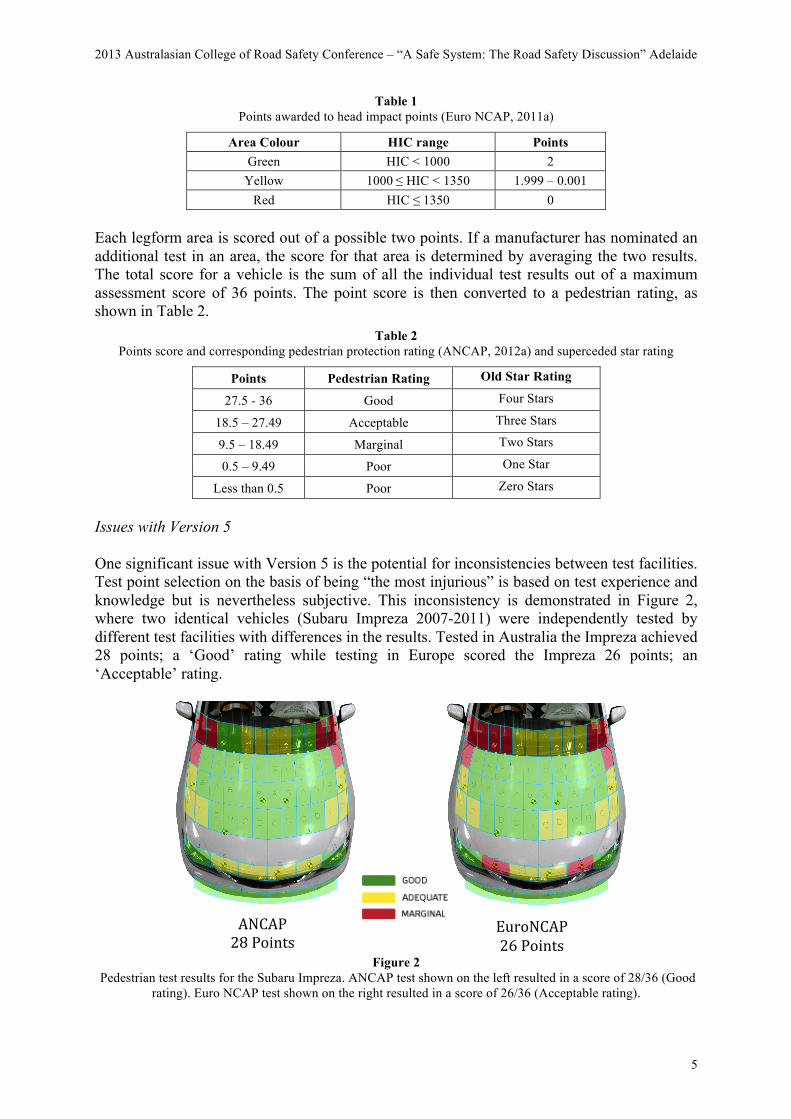
Table 1 Points awarded to head impact points (Euro NCAP, 2011a)
Area Colour HIC range Points Green HIC < 1000 2
Yellow 1000!≤ HIC < 1350 1.999 – 0.001 Red HIC ≤!1350 0
Each legform area is scored out of a possible two points. If a manufacturer has nominated an additional test in an area, the score for that area is determined by averaging the two results. The total score for a vehicle is the sum of all the individual test results out of a maximum assessment score of 36 points. The point score is then converted to a pedestrian rating, as shown in Table 2. !
Table 2 Points score and corresponding pedestrian protection rating (ANCAP, 2012a) and superceded star rating
Points Pedestrian Rating Old Star Rating
27.5 - 36 Good Four Stars
18.5 – 27.49 Acceptable Three Stars
9.5 – 18.49 Marginal Two Stars
0.5 – 9.49 Poor One Star
Less than 0.5 Poor Zero Stars
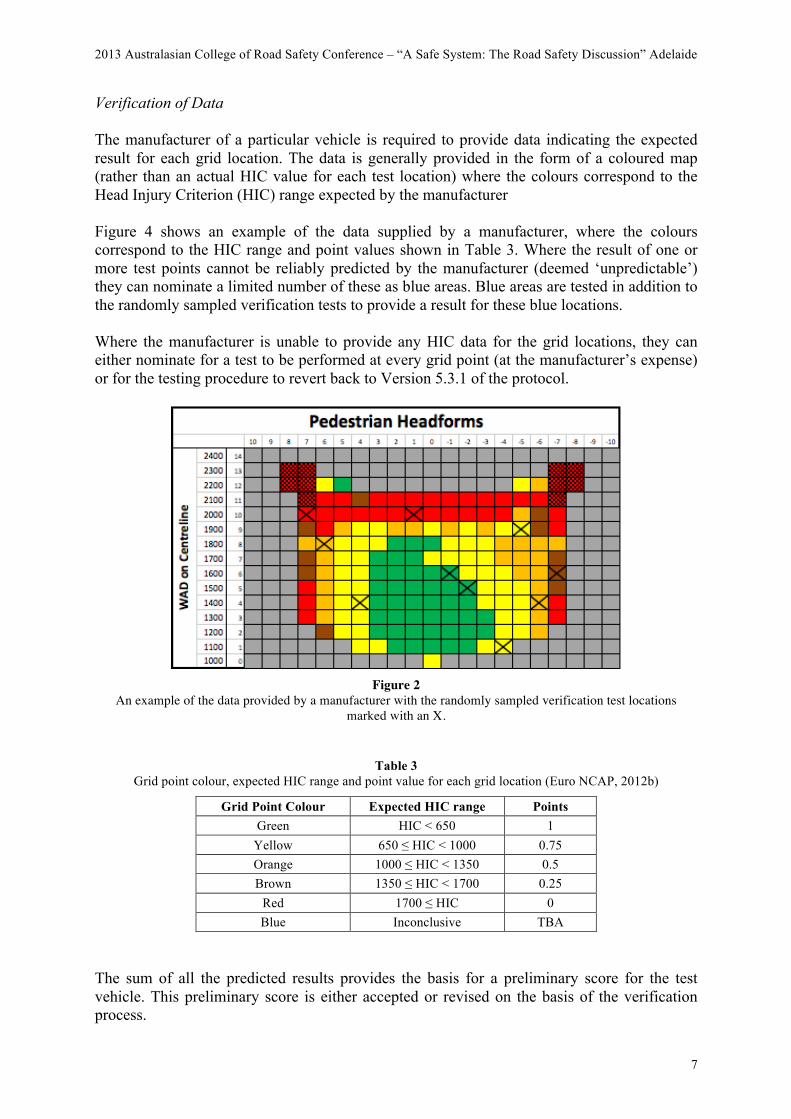
Issues with Version 5 One significant issue with Version 5 is the potential for inconsistencies between test facilities. Test point selection on the basis of being “the most injurious” is based on test experience and knowledge but is nevertheless subjective. This inconsistency is demonstrated in Figure 2, where two identical vehicles (Subaru Impreza 2007-2011) were independently tested by different test facilities with differences in the results. Tested in Australia the Impreza achieved 28 points; a ‘Good’ rating while testing in Europe scored the Impreza 26 points; an ‘Acceptable’ rating.
Figure 2 Pedestrian test results for the Subaru Impreza. ANCAP test shown on the left resulted in a score of 28/36 (Good
rating). Euro NCAP test shown on the right resulted in a score of 26/36 (Acceptable rating).
ANCAP!28!Points!
!
EuroNCAP!26!Points!

2013 Australasian College of Road Safety Conference – “A Safe System: The Road Safety Discussion” Adelaide !
6
This discrepancy is, in theory, overcome with a more recent change to the protocol (Version 6). Version 6 The introduction of the Euro NCAP Version 6.0 Pedestrian Testing Protocol represented a significant shift in the way a vehicle is marked-up for testing, the mechanism by which test point selection occurs, and the roles played by a test facility and vehicle manufacturer. The initial vehicle mark-up procedure is quite similar to Version 5, with a number of fundamental elements being carried over. The child head impact area is bounded by the 1000 mm and 1500 mm wrap lines in the same way and the adult head impact area similarly bounded by the 1500 mm and 2100 mm WADs. The 1700 mm reference line however, is supplemented with a bonnet rear reference line4 (BRRL) which further defines the vehicle geometry specific test areas. The markup procedure includes the marking of points in a 100 mm spaced grid on the vehicle that is bound by the child and adult head impact test areas. The grid datum is located at the intersection of the 1000mm wrap around distance and the vehicle centreline. For the full details and intricacies of the mark-up procedures refer to Euro NCAP (2013a). Figure 3 shows a complete set of grid points for an example vehicle, commonly comprising of more than 150 individual test locations.
Figure 3
The mark-up of a vehicle according to Version 6
!!!!!!!!!!!!!!!!!!!!!!!!!!!!!!!!!!!!!!!!!!!!!!!!!!!!!!!!4!The bonnet rear reference line is defined as the geometric trace of the most rearward point of contact between a 165 mm sphere and the rear of the bonnet, when the sphere is traversed across the rear of the bonnet, while maintaining contact with the windscreen.!
2013 Australasian College of Road Safety Conference – “A Safe System: The Road Safety Discussion” Adelaide !
7
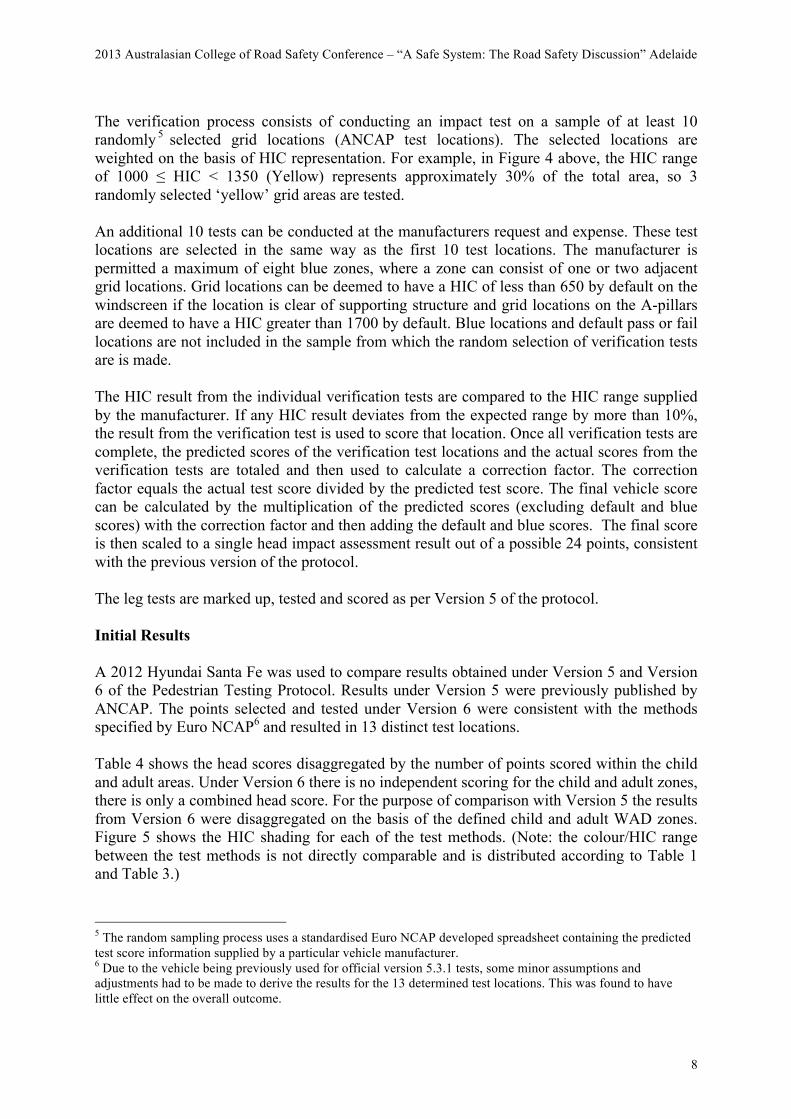
Verification of Data The manufacturer of a particular vehicle is required to provide data indicating the expected result for each grid location. The data is generally provided in the form of a coloured map (rather than an actual HIC value for each test location) where the colours correspond to the Head Injury Criterion (HIC) range expected by the manufacturer Figure 4 shows an example of the data supplied by a manufacturer, where the colours correspond to the HIC range and point values shown in Table 3. Where the result of one or more test points cannot be reliably predicted by the manufacturer (deemed ‘unpredictable’) they can nominate a limited number of these as blue areas. Blue areas are tested in addition to the randomly sampled verification tests to provide a result for these blue locations. Where the manufacturer is unable to provide any HIC data for the grid locations, they can either nominate for a test to be performed at every grid point (at the manufacturer’s expense) or for the testing procedure to revert back to Version 5.3.1 of the protocol.
!Figure 2
An example of the data provided by a manufacturer with the randomly sampled verification test locations marked with an X.
!Table 3
Grid point colour, expected HIC range and point value for each grid location (Euro NCAP, 2012b)
Grid Point Colour Expected HIC range Points Green HIC < 650 1
Yellow 650 ≤ HIC < 1000 0.75 Orange 1000 ≤ HIC < 1350 0.5 Brown 1350 ≤ HIC < 1700 0.25
Red 1700 ≤ HIC 0 Blue Inconclusive TBA
The sum of all the predicted results provides the basis for a preliminary score for the test vehicle. This preliminary score is either accepted or revised on the basis of the verification process.
2013 Australasian College of Road Safety Conference – “A Safe System: The Road Safety Discussion” Adelaide !
8
The verification process consists of conducting an impact test on a sample of at least 10 randomly 5 selected grid locations (ANCAP test locations). The selected locations are weighted on the basis of HIC representation. For example, in Figure 4 above, the HIC range of 1000 ≤ HIC < 1350 (Yellow) represents approximately 30% of the total area, so 3 randomly selected ‘yellow’ grid areas are tested. An additional 10 tests can be conducted at the manufacturers request and expense. These test locations are selected in the same way as the first 10 test locations. The manufacturer is permitted a maximum of eight blue zones, where a zone can consist of one or two adjacent grid locations. Grid locations can be deemed to have a HIC of less than 650 by default on the windscreen if the location is clear of supporting structure and grid locations on the A-pillars are deemed to have a HIC greater than 1700 by default. Blue locations and default pass or fail locations are not included in the sample from which the random selection of verification tests are is made. The HIC result from the individual verification tests are compared to the HIC range supplied by the manufacturer. If any HIC result deviates from the expected range by more than 10%, the result from the verification test is used to score that location. Once all verification tests are complete, the predicted scores of the verification test locations and the actual scores from the verification tests are totaled and then used to calculate a correction factor. The correction factor equals the actual test score divided by the predicted test score. The final vehicle score can be calculated by the multiplication of the predicted scores (excluding default and blue scores) with the correction factor and then adding the default and blue scores. The final score is then scaled to a single head impact assessment result out of a possible 24 points, consistent with the previous version of the protocol. The leg tests are marked up, tested and scored as per Version 5 of the protocol. Initial Results A 2012 Hyundai Santa Fe was used to compare results obtained under Version 5 and Version 6 of the Pedestrian Testing Protocol. Results under Version 5 were previously published by ANCAP. The points selected and tested under Version 6 were consistent with the methods specified by Euro NCAP6 and resulted in 13 distinct test locations. Table 4 shows the head scores disaggregated by the number of points scored within the child and adult areas. Under Version 6 there is no independent scoring for the child and adult zones, there is only a combined head score. For the purpose of comparison with Version 5 the results from Version 6 were disaggregated on the basis of the defined child and adult WAD zones. Figure 5 shows the HIC shading for each of the test methods. (Note: the colour/HIC range between the test methods is not directly comparable and is distributed according to Table 1 and Table 3.)
!!!!!!!!!!!!!!!!!!!!!!!!!!!!!!!!!!!!!!!!!!!!!!!!!!!!!!!!5!The random sampling process uses a standardised Euro NCAP developed spreadsheet containing the predicted test score information supplied by a particular vehicle manufacturer. !6 Due to the vehicle being previously used for official version 5.3.1 tests, some minor assumptions and adjustments had to be made to derive the results for the 13 determined test locations. This was found to have little effect on the overall outcome.

2013 Australasian College of Road Safety Conference – “A Safe System: The Road Safety Discussion” Adelaide !
9
Table 4 Disaggregated child and adult scores for the Hyundai Santa Fe under each test protocol
V5 V6
Adult Zone 3.00/12 6.66/13.58 Child Zone 7.08/12 6.53/10.42 Total 10/24 13/24
Figure 3
The shaded areas depicting HIC colour range according to Euro NCAP Version 5 (left) and Version 6 (right) assessment methods respectively for the same vehicle.
This preliminary testing showed that the over all test score for the Hyundai Santa Fe increased under the new pedestrian testing protocol. It is worth noting that while the adult zone score increased under version 6 the child zone score decreased under version 6, indicating that it is possible for the final score to be higher or lower depending on the test method applied. Incorporation of the pedestrian assessment in the ANCAP five-star rating Since its inception, ANCAP has been committed to assessing the safety of vehicles relevant to all road users. However, until recently the ANCAP five-star safety rating only indicated how safe a vehicle was in protecting its occupants. This has led to a disparity in the number of new vehicles that have high levels of occupant protection but minimal pedestrian protection (Anderson, 2012). Prior to 2011, for a vehicle to achieve a five star ANCAP rating, manufacturers were only required to achieve a score of 32.5 points out of the maximum 37 points7 available, with all points awarded from crash tests related to occupant protection. In 2011, as part of the ANCAP roadmap (ANCAP, 2012b) the ANCAP five-star rating was extended to include mandatory ‘Safety Assist Technologies (SATs)’ including three-point seatbelts in all forward facing seating positions and head-protection technology (HPT, eg. side curtain air bags) in front seating positions. In 2012, ANCAP’s five-star requirements were further extended (ANCAP, 2012b). In addition to all prior requirements extra requirements included for the first time a minimum of 9.5 points corresponding to ‘marginal’ pedestrian rating (over 25% of overall pedestrian
!!!!!!!!!!!!!!!!!!!!!!!!!!!!!!!!!!!!!!!!!!!!!!!!!!!!!!!!7!The minimum 32.5 points are subject to the vehicle achieving not less than 12.5 out of 16 in either the frontal-offset or side impact test, at least one point in the pole impact test, with up to three additional points for seatbelt reminders.!
2013 Australasian College of Road Safety Conference – “A Safe System: The Road Safety Discussion” Adelaide !
10
score), as well as a minimum ‘acceptable’ whiplash test result and a minimum of two additional SATs. In 2013, to receive a five-star rating, the pedestrian and whiplash requirements remain the same, with a extra mandatory requirements of seatbelt reminders in the front seats and emergency brake assist. In 2014, the requirements for an ANCAP five-star rating will be further extended (ANCAP, 2012b) to ensure a higher level of pedestrian protection, with a minimum test result of 18.5 points corresponding to an ‘acceptable’ pedestrian rating (over 50% of overall pedestrian test score), as well as a ‘good’ whiplash test result, a minimum roof strength rating of ‘marginal’, HPT in the second row seats and four additional minimum SAT. For further details of ANCAP’s road map to 2017 refer to ANCAP (2012b).
Future of Pedestrian Testing In 2014, Euro NCAP will introduce a pedestrian testing protocol version 7 (Euro NCAP, 2013b). This version will introduce the Flexible Pedestrian Legform Impactor (FlexPLI) to the protocol. The new protocol will also remove the requirement for the selection of full leg and upper leg test locations. Test locations will be spaced at 100 mm increments from the centre of the bumper and the bonnet leading edge. Testing will occur at 200 mm increments starting at either the centre or 100 mm from the centre with the lowest scores from adjacent locations being applied to those locations not tested, unless the vehicle manufacturer chooses to fund the additional tests. Discussion Currently there are no Australian Design Rules (ADRs) or regulation tests in Australia pertaining to pedestrian protection. Although ADR compliance is required for the sale of vehicles in the Australian market there is no regulated mechanism that allows consumers to distinguish between vehicles that merely comply with the safety components of the ADRs and those that provide additional safety over and above compliance. In Australasia ANCAP and their supporting organisations have led the way in informing vehicle consumers and promoting the importance of choosing safer vehicles, for example through the “stars on cars” programs (Department of Planning Transport and Infrastructure, 2012). As a consequence buyers of vehicles are demanding higher standards of vehicle safety. Increasingly there is a demand for five-star rated vehicles, particularly by fleet purchasers. In South Australia, the Government has mandated ANCAP five-star passenger vehicles for the state Government passenger vehicle fleet (Government of SA, 2011). Additionally, workplaces bound by work health and safety regulations are also requiring the highest levels of vehicle safety. BHP Billiton has documented in their ‘fatal risk controls’ to ‘transition all light vehicles to a 5 Star NCAP safety rating by 01 Jan 2016’ (BHP Billiton, 2012). Consequently, while regulations may dictate the requirements to enable the sale of vehicles in Australia, ANCAP and their supporters appear to be influencing vehicle sales in Australia. In the absence of any pedestrian regulation in Australia, the incorporation of the pedestrian assessment as part of the ANCAP star rating is by far the most important mechanism for compelling manufacturers to think ‘outside the car’ and incorporate pedestrian safety in vehicle design. The Euro NCAP Pedestrian Testing Protocol Version 6 provides a less subjective method for
2013 Australasian College of Road Safety Conference – “A Safe System: The Road Safety Discussion” Adelaide !
11
assessing vehicle pedestrian safety. The testing method validates or invalidates manufacturer expectations and provides a process for scaling the results accordingly. The grid method provides a less biased and more predictable approach to testing, as a representative random sample of locations are tested rather than locations subjectively considered to be the most injurious to pedestrians. There is however, still a potential for discrepancies between test facilities for the same vehicle. This might happen when the random selection of verification test locations results in considerably different test locations being tested. This may lead to differences in the correction factor and scores calculated between facilities. For many manufacturers providing the data required for Version 6 may not be possible, due to cost. In these cases Version 5.3.1 is used. It is also possible that manufacturers will choose the test procedure that gives the best outcome for their vehicle. A difference in outcome can occur largely due to the scoring being based on differing the HIC ranges of 1000-1350 for Version 5 and 650-1700 for Version 6. For example, if a vehicle had a structure that predominately returned a HIC of 900 these areas would receive full points using protocol Version 5 and only 75% of full points using protocol Version 6. CASR is currently investigating alternative methods of assessment that will attempt to produce directly comparable results to Version 6. Methods include using information on the clearance between the underside of the hood and structures beneath, combined with random selection of points. CASR is currently assessing the design of such a scheme to provide statistically reliable results. Acknowledgements The Centre for Automotive Safety Research would like to acknowledge the support of Hyundai Motor Company, R&D in providing the test vehicle, data and parts used in the comparison conducted. The Centre for Automotive Safety Research would also like to acknowledge the continuing support of ANCAP. The Centre for Automotive Safety Research receives core funding from the Motor Accident Commission (South Australia) and the South Australian Department of Transport, Energy and Infrastructure. The views expressed in this report are those of the authors and do not necessarily represent those of the University of Adelaide, ANCAP or CASR’s sponsors.
References ANCAP (2012a). ANCAP Notes on the Assessment Protocol January 2012 (v5.1) retrieved July 2013 from: http://www.ancap.com.au/admin/uploadfiles/ANCAP_assessment_notes_jan12_v2.pdf ANCAP (2012b) ANCAP Rating Road Map 2011-2017 retrieved July 2013 from: http://www.ancap.com.au/admin/uploadfiles/RoadMap2017.pdf Anderson, R. W. G. (2012). The safety attributes of registered passenger vehicles and vehicles involved in serious crashes in South Australia (CASR081). Adelaide: Centre for Automotive Safety Research. BHP Billiton (2012). Fatal Risk Controls retrieved August 2013 from: http://www.bhpbilliton.com/home/aboutus/ourcompany/Documents/2012/Fatal%20Risk%20Controls.pdf
2013 Australasian College of Road Safety Conference – “A Safe System: The Road Safety Discussion” Adelaide !
12
Department of Planning Transport and Infrastructure (2012). Road Safety : Stars on Cars, accessed July 2013 http://www.dpti.sa.gov.au/roadsafety/safer_vehicles/stars_on_cars European New Car Assessment Programme (Euro NCAP). (2002) Pedestrian Testing Protocol Version 3.1.1, Euro NCAP, Brussels. European New Car Assessment Programme (Euro NCAP). (2010) Pedestrian Testing Protocol Version 5.0, Euro NCAP, Brussels. European New Car Assessment Programme (Euro NCAP). (2011a) Pedestrian Assessment Protocol – Pedestrian Protection Version 5.1, Euro NCAP, Brussels. European New Car Assessment Programme (Euro NCAP). (2011b). Pedestrian Testing Protocol Version 5.3.1, Euro NCAP, Brussels. European New Car Assessment Programme (Euro NCAP). (2012a) Pedestrian Testing Protocol Version 6.0, Euro NCAP, Brussels. European New Car Assessment Programme (Euro NCAP). (2012b) Pedestrian Assessment Protocol – Pedestrian Protection Version 6.0, Euro NCAP, Brussels. European New Car Assessment Programme (Euro NCAP). (2013a) Pedestrian Testing Protocol Version 6.2.1, Euro NCAP, Brussels. European New Car Assessment Programme (Euro NCAP). (2013b) Pedestrian Testing Protocol Version 7.0, Euro NCAP, Brussels. European Union (2009a). Commission Regulation (EC) No 631/2009, Official Journal of the European Union, 195. European Union (2009b) Commission Regulation (EC) No 78/2009, Official Journal of the European Union, 35. Government of South Australia (2011). South Australia’s Road Safety Strategy 2020 – Action Plan 2011-2012. Accessed August 2013 http://dpti.sa.gov.au/towardszerotogether/article?item=20 Lawrence, G. J. L. (2005). The next steps for pedestrian protection test methods. The 19th International Technical Conference on the Enhanced Safety of Vehicles (ESV) - Washington D.C. June 6-9, 2005. Mizuno, Y (2003). Summary of IHRA pedestrian safety WG activities (2003) – Proposed test methods to evaluate pedestrian protection offered by passenger cars . The 18th International Technical Conference on the Enhanced Safety of Vehicles (ESV) – Nagoya, Japan. May 19-22, 2003. Ponte, G., van den Berg, A. L., Streeter, L. D., & Anderson, R. W. G. (2004). Pedestrian protection in vehicle impacts: further results from the Australian new car assessment program. Road Safety Research, Policing and Education Conference, Perth, Australia, 14-16 November 2004. Pastor C. (2013). The correlation between pedestrian injury severity in real-life crashes and Euro NCAP pedestrian test results. The 23rd International Technical Conference on the Enhanced Safety of Vehicles (ESV), Seoul, Republic of Korea, May 27-30, 2013.

2013 Australasian College of Road Safety Conference – “A Safe System: The Road Safety Discussion” Adelaide !
13
Searson, D. J., & Anderson, R. W. G. (2010). Implications of easing head impact criteria in pedestrian crash standards (CASR083). Adelaide: Centre for Automotive Safety Research. Strandroth J., Rizzi M., Sternlund S., Lie A., Tingvall C. (2011) The correlation between pedestrian injury severity in real-life crashes and Euro NCAP pedestrian test results. 22nd International Technical Conference on the Enhanced Safety of Vehicles (ESV), Washington D.C., June 13-16, 2011.