Embed Size (px)
Citation preview

ACRN Finance and Risk Perspectives Series
Proceedings in Finance and Risk Perspectives ‘12
Dr. Othmar M. Lehner, Dr. Heimo Losbichler (Editors)
© 2012 ACRN Cambridge Publishing House
Enns, Austria
ISBN 978-3-9503518-0-4 (electronic)
Foreword from the Editors VUCA, an acronym for Volatility, Uncertainty, Complexity and Ambiguity has its origins in military operations. Influential speakers such as Alan Webber, former editor of Harvard Business Magazine and Fast Company, apply VUCA to describe today’s environment after the
several crises that hit the markets during the last decade. Volatility has since risen enormously, traditional planning and forecasting tools proved erroneous, complexity caused fatal and unforeseen impacts, risk once again became uncertainty, and ambiguity invalidated formerly reliable deterministic models on the micro and macro level. In order to cope with this changing environment, business leaders are forced to adopt their planning and decision models. We therefore invited scholars from a multitude of disciplines to contribute and (re)build theory of Finance, Risk and Treasury in times of VUCA. Topics came from a broad variety, from one the following fields:
Corporate Finance Economics and Global Finance
Behavioural Finance Banking, Treasury and Liquidity Financial- and Enterprise Risk Management
Accounting and Reporting
Mathematical & Computational Finance Investments & Portfolio Management
Strategic Management & Entrepreneurship Banking and the Finance Industry Sector
Our Finance and Risk Perspectives series of international academic conferences, invites scholars from many disciplines and backgrounds to gather for a week of intense exchange of current research issues. 2012 the conference was held in Steyr, Austria and saw over 100 contributions. The keynotes were held by Prof. Dr. Wim A. Van der Stede, LSE, London School of Economics and Political Sciences, and Prof. Dr. Matthew Haigh, SOAS, University of London, UK. Inspiring speakers from 40 nations, workshops on publishing and research as well as a great social side program, including our Welcome networking dinner, the KPMG panel on risk reporting; evening excursion to a big vehicle manufacturing plant (BMW), a PDW on Islamic Banking and Finance and a PhD students’ school made this annual conference a very rewarding journey to Austria for many participants. The 2013 Finance and Risk Perspectives Conference will take place in November in Cambridge, UK (http://www.acrn.eu) Dr. Othmar Lehner, Dr. Heimo Losbichler
Responsible Editors Academic Sponsors of the 2012 conference:
University of A. Sciences, Upper Austria – University of Jyväskylä, Finland – ACRN research network, Enns, Cambridge UK – CUNY City University New York – LSE London School of Economics - SOAS, University of London – BIBS International Business School Czech Republic – Routledge Journals London.
ACRN, the academic collaboration and research network – Enns Austria, Cambridge UK, is an extra-university research institution in the field of social and managerial sciences. A social enterprise promoting academic collaboration and research in social and managerial sciences, through partnering with leading universities from all over the world, contributing to the 7th European Union framework on cooperation in further education. All excess profit is used for grants and scholarships.
i
PROCEEDINGS IN FINANCE AND RISK PERSPECTIVES ‘12
(2012), Dr. Othmar Lehner, Dr. Heimo Losbichler (Editors), 650 p., ACRN Cambridge Publishing House: Enns, Austria., ISBN: 978-3-9503518-0-4 (electronic). Available for free at Google bookstore and online. Indexed. More info: http://www.acrn.eu TABLE OF CONTENTS
SECTION 1: Entrepreneurship Perspectives ........................................................................................................... 1
The Role of Leadership in Sustainable Public Sector Performance Outcome Adi Budiarso and Monir Mir ........................................................................................................................................ 2 Cross-border Mergers & Acquisitions by Emerging Market Firms: A Review and Future Direction Min Du and Agyenim Boateng ..................................................................................................................................... 25 The Impact of Business Group Characteristics on Location Choice and Firm Performance in China Sui-Hua Yu ................................................................................................................................................................... 56 Financial Supply Chain Management – Challenges and Obstacles Peter Kristofik, Jenny Kok, Sybren de Vries and Jenny van Sten-van’t Hoff .............................................................. 77 SECTION 2: Finance and Risk Perspectives ........................................................................................................... 89
A Comparison of Different Families of Put-Write Option Strategies Lucia Del Chicca and Gerhard Larcher ........................................................................................................................ 90 Applying Macro Prudence in Financial Standard Setting Diana Festl-Pell ............................................................................................................................................................ 104 The Nexus of Enterprise Risk Management and Value Creation Verena Kraus and Othmar Lehner ................................................................................................................................ 121 Managing Risk in Financial Market in Shipping Industry Vegard Elvenes and Dimas Mukhlas ............................................................................................................................ 193 Firm’s Financing Constraints and Investment-Cash flow Sensitivity: Evidence from country legal institutions Ahmed Marhfor, Bouchra M’Zali and Jean-Claude Cosset .......................................................................................... 211 Fair Value Accounting in Times of Financial Crisis Natascha Jarolim and Carina Öppinger ........................................................................................................................ 228
SECTION 3: Accounting and Risk Perspectives ..................................................................................................... 252
Quality and Determinants of Risk Reporting - Evidence from Germany and Austria Susanne Leitner-Hanetseder ......................................................................................................................................... 253 The Effects of Global Financial Crisis on the Behaviour of European Banks: A Risk and Profitability Analysis Approach Mehmet Hasan Eken, Huseyin Selimler , Suleyman Kale and Veysel Ulusoy ............................................................. 269 Is the Price Kernel Monotone? Giovanni Barone-Adesi, Hakim Dall'O and Volodymyr Vovchak ............................................................................... 295

ii
Measuring the Impact of Intangible Asset Investment toward Company Financial Health and Company Agency Problem Dimas Mukhlas ............................................................................................................................................................. 321 A Dynamic Inflation Hedging Trading Strategy using a CPPI Nicolas Fulli-Lemaire ................................................................................................................................................... 341 Option Market Overreaction to Stock Price Changes Eric Gettleman, Brandon Julio and Elizabeth A. Risik ................................................................................................. 365 SECTION 4: Miscellaneous Perspectives ................................................................................................................. 383
Legal Aspects of Project Finance in International Trade Ali Rezaee ..................................................................................................................................................................... 384 Factors Contributing to Audit Lags of Zakat Institutions in Malaysia Asmah Abdul Aziz, Muslimah Mohd Jamil, Huzaimah Ismail and Nafisiah Abdul Rahman ...................................... 408 A Study of Audit Lags in Northern Malaysia Local Authorities Asmah Abdul Aziz and Amal Hayati Aziz ................................................................................................................... 427 Risk coverage in the top companies in the D/A/CHa countries – Development and future challenges in the external risk reporting in the corporate practice Christian Theuermann .................................................................................................................................................. 438 Investment Decisions under Uncertainty: Example of Russian Companies Andrey Aistov and Ekaterina Kuzmicheva ................................................................................................................... 455 Relation between Market Value Added and Earning Per Share and Price to Earnings Ratio Farzaneh Heidarpoor, Rezvan Hejazi and Hamid Eskandari ........................................................................................ 470 Beyond Stress Testing: Modelling Liquidity and Interest Rate Risks for (real) Corporate Measures Filippo Antonio Dal Prà and Guido Max Mantovani.................................................................................................... 479 The Impact of Adopting IASs on Social, Economic and Political Environment of Iran Rezvan Hejazi ............................................................................................................................................................... 502 Carbon Markets in Times of Economic Uncertainty: A Weak-form Efficiency Investigation of the Phase II EU ETS Scott J. Niblock ............................................................................................................................................................. 515 Turkish Experience in Bank Solution in Last Two Decades; Fraud and Corruption of Shareholders and Managers in Turkish Banking System Ayse Hayali, Selin Sarili and Yusuf Dinc .................................................................................................................... 537 The external auditor’s view on risk disclosure – empirical evidence from Austria Waltraud Öller, Korona Sylvester and Dorothea Greiling ............................................................................................ 562
Financial Inclusion in India: Do microfinance institutions address access barriers? Savita Shankar .............................................................................................................................................................. 586 The Relationship between IFRS, Earnings Losses Threshold and Earnings Management Hui-Sung Kao ............................................................................................................................................................... 612 Mergers and Acquisitions: Revisiting the issue of value creation in the New Member States of European Union Darius Saikevicius ........................................................................................................................................................ 639
Proceedings in Finance and Risk Perspectives`12
ACRN Cambridge Publishing House
ISBN: 978-3-9503518-0-4
1
Beyond Stress Testing: Modelling Liquidity and Interest Rate
Risks for (real) Corporate Measures
Filippo Antonio Dal Prà1, Guido Max Mantovani
2
1 Veneto Banca group
2 Ca’ Foscari University
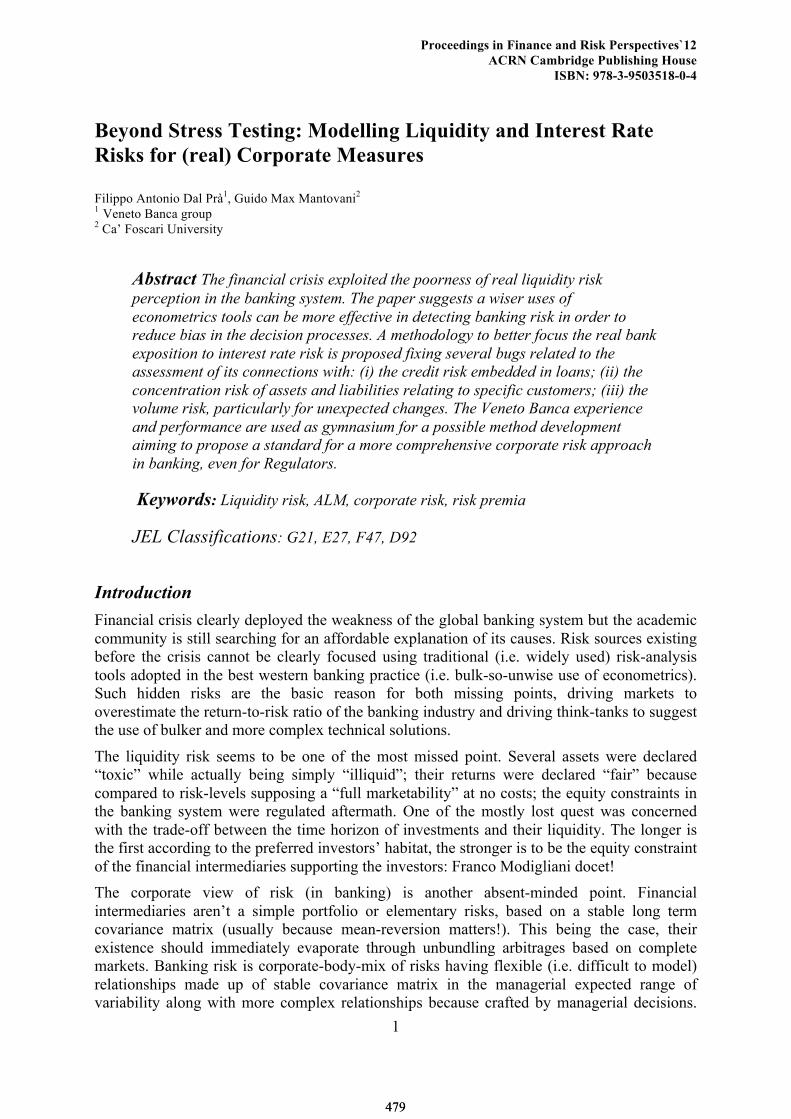
Abstract The financial crisis exploited the poorness of real liquidity risk
perception in the banking system. The paper suggests a wiser uses of
econometrics tools can be more effective in detecting banking risk in order to
reduce bias in the decision processes. A methodology to better focus the real bank
exposition to interest rate risk is proposed fixing several bugs related to the
assessment of its connections with: (i) the credit risk embedded in loans; (ii) the
concentration risk of assets and liabilities relating to specific customers; (iii) the
volume risk, particularly for unexpected changes. The Veneto Banca experience
and performance are used as gymnasium for a possible method development
aiming to propose a standard for a more comprehensive corporate risk approach
in banking, even for Regulators.
Keywords: Liquidity risk, ALM, corporate risk, risk premia
JEL Classifications: G21, E27, F47, D92
Introduction
Financial crisis clearly deployed the weakness of the global banking system but the academic
community is still searching for an affordable explanation of its causes. Risk sources existing
before the crisis cannot be clearly focused using traditional (i.e. widely used) risk-analysis
tools adopted in the best western banking practice (i.e. bulk-so-unwise use of econometrics).
Such hidden risks are the basic reason for both missing points, driving markets to
overestimate the return-to-risk ratio of the banking industry and driving think-tanks to suggest
the use of bulker and more complex technical solutions.
The liquidity risk seems to be one of the most missed point. Several assets were declared
“toxic” while actually being simply “illiquid”; their returns were declared “fair” because
compared to risk-levels supposing a “full marketability” at no costs; the equity constraints in
the banking system were regulated aftermath. One of the mostly lost quest was concerned
with the trade-off between the time horizon of investments and their liquidity. The longer is
the first according to the preferred investors’ habitat, the stronger is to be the equity constraint
of the financial intermediaries supporting the investors: Franco Modigliani docet!
The corporate view of risk (in banking) is another absent-minded point. Financial
intermediaries aren’t a simple portfolio or elementary risks, based on a stable long term
covariance matrix (usually because mean-reversion matters!). This being the case, their
existence should immediately evaporate through unbundling arbitrages based on complete
markets. Banking risk is corporate-body-mix of risks having flexible (i.e. difficult to model)
relationships made up of stable covariance matrix in the managerial expected range of
variability along with more complex relationships because crafted by managerial decisions.
479479

Beyond Stress Testing: Modelling Liquidity and Interest Rate Risks for (real) Corporate
Measures
Thus, corporate reaction to risks matters, reducing the unbundling opportunity. Being driven
by managerial decisions, the corporate reaction requires to be strongly supported by correct
risk perception at corporate level. Bulky econometrics methods can drive unfair estimation of
the corporate risk due to their inability to detect real relationships of specific risks in the
corporate body (i.e. the corporate reaction).
The liquidity risks web into the banking corporate body is a typical example. The economic
impact of changes in market short term interest rates cannot be completely modeled without
considering both their impact over the investors’ attitude to commit to a specific banking
investment and their effect to the premia dimension of other risks, particularly the credit risk
one.
In this paper we suggest a different approach aiming to demonstrate how the actual (i.e.
corporate) use of the models can increase their efficacy more than their bulkiness. The paper
is composed as follows: Section 1 presents the referring theoretical framework for modeling
the liquidity risk in banking economics and its inner methodological quests for corporate
implementation; Section 2 reports the inner results of a pilot project aiming to fit an
affordable methodology for model implementation at corporate level jointly run by Veneto
Banca Group and Ca’ Foscari University inside the “Master in Strategic Innovation”
executive program; Section 3 depicts the resulting figures from model application to the
Veneto Banca’s economics along with some insights to obtain the maximum increase in the
organization reactivity of the bank through the corporate use of the model; Section 4
concludes with suggestions for a wider use of the methodology.
1. Literature review and theoretical models.
Interest rate risk exposure and liquidity constraints inside a bank may be analyzed by defining
the nature of assets and liability items according to a specific standards. The liquidity
constraint is related to assets and liabilities to which the bank is committed to rapidly convert
them into cash. This being the case, such items are usually tracking the interest rate
movements, either because they are formally indexed to market rates, either because their
attitude to rapid cash conversion requires a continuously updated return. The inner liquidity
risk for any financial intermediary is not the exogenous change in market rates but the
mismatch between assets and liability standards: any gap could leverage the corporate margin
changes against to market volatility.
Entrop, Wilkens and Zeisler (2009) strike out the importance of fixing standards to classify
asset and liability nature for liquidity. They start from the idea that the interest rate risk is
systematic and it may directly affect the stability of the financial system, and examine
whether the framework proposed by the Basel Committee for the quantification of interest
rate risk in banks is adequate. If the guidelines were to be too simplistic or inadequate, bank
supervisors could misjudge the interest rate risk of banks and react inappropriately to external
shocks. The Authors show that the estimate of the level of interest rate risk is strongly
influenced by the parameters of Basel Committee which may lead to a misinterpretation of the
level of risk which the bank is exposed if its structure is different from that envisaged by
Basel. For this reason the Authors suggest that banks should use an internal (i.e.
"customized") model to define the exposure to changes in interest rates. Lopez (2004) gets to
a very similar conclusion by examining the standards for interest rate risk definition
embedded in the previous Basel agreement. The principles strongly support the idea that
banks’ internal risk assessments should form the basis for supervisory oversight of their
interest rate risk profiles.
480480
Proceedings in Finance and Risk Perspectives`12
ACRN Cambridge Publishing House
ISBN: 978-3-9503518-0-4
3
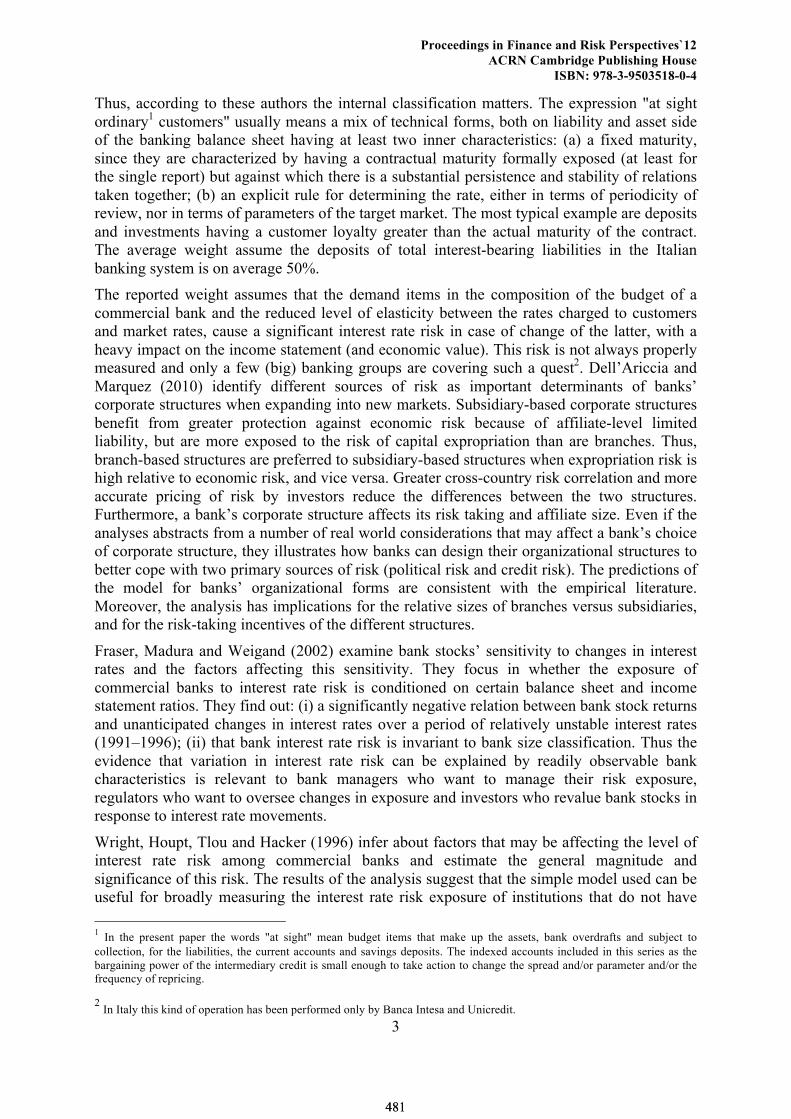
Thus, according to these authors the internal classification matters. The expression "at sight
ordinary1 customers" usually means a mix of technical forms, both on liability and asset side
of the banking balance sheet having at least two inner characteristics: (a) a fixed maturity,
since they are characterized by having a contractual maturity formally exposed (at least for
the single report) but against which there is a substantial persistence and stability of relations
taken together; (b) an explicit rule for determining the rate, either in terms of periodicity of
review, nor in terms of parameters of the target market. The most typical example are deposits
and investments having a customer loyalty greater than the actual maturity of the contract.
The average weight assume the deposits of total interest-bearing liabilities in the Italian
banking system is on average 50%.
The reported weight assumes that the demand items in the composition of the budget of a
commercial bank and the reduced level of elasticity between the rates charged to customers
and market rates, cause a significant interest rate risk in case of change of the latter, with a
heavy impact on the income statement (and economic value). This risk is not always properly
measured and only a few (big) banking groups are covering such a quest2. Dell’Ariccia and
Marquez (2010) identify different sources of risk as important determinants of banks’
corporate structures when expanding into new markets. Subsidiary-based corporate structures
benefit from greater protection against economic risk because of affiliate-level limited
liability, but are more exposed to the risk of capital expropriation than are branches. Thus,
branch-based structures are preferred to subsidiary-based structures when expropriation risk is
high relative to economic risk, and vice versa. Greater cross-country risk correlation and more
accurate pricing of risk by investors reduce the differences between the two structures.
Furthermore, a bank’s corporate structure affects its risk taking and affiliate size. Even if the
analyses abstracts from a number of real world considerations that may affect a bank’s choice
of corporate structure, they illustrates how banks can design their organizational structures to
better cope with two primary sources of risk (political risk and credit risk). The predictions of
the model for banks’ organizational forms are consistent with the empirical literature.
Moreover, the analysis has implications for the relative sizes of branches versus subsidiaries,
and for the risk-taking incentives of the different structures.
Fraser, Madura and Weigand (2002) examine bank stocks’ sensitivity to changes in interest
rates and the factors affecting this sensitivity. They focus in whether the exposure of
commercial banks to interest rate risk is conditioned on certain balance sheet and income
statement ratios. They find out: (i) a significantly negative relation between bank stock returns
and unanticipated changes in interest rates over a period of relatively unstable interest rates
(1991–1996); (ii) that bank interest rate risk is invariant to bank size classification. Thus the
evidence that variation in interest rate risk can be explained by readily observable bank
characteristics is relevant to bank managers who want to manage their risk exposure,
regulators who want to oversee changes in exposure and investors who revalue bank stocks in
response to interest rate movements.
Wright, Houpt, Tlou and Hacker (1996) infer about factors that may be affecting the level of
interest rate risk among commercial banks and estimate the general magnitude and
significance of this risk. The results of the analysis suggest that the simple model used can be
useful for broadly measuring the interest rate risk exposure of institutions that do not have
1 In the present paper the words "at sight" mean budget items that make up the assets, bank overdrafts and subject to
collection, for the liabilities, the current accounts and savings deposits. The indexed accounts included in this series as the
bargaining power of the intermediary credit is small enough to take action to change the spread and/or parameter and/or the frequency of repricing.
2 In Italy this kind of operation has been performed only by Banca Intesa and Unicredit.
481481
Beyond Stress Testing: Modelling Liquidity and Interest Rate Risks for (real) Corporate
Measures
unusual or complex asset characteristics. Interest rate risk does not currently appear to present
a major risk to most commercial banks. Nevertheless, for individual institutions, interest rate
risk must be carefully monitored and managed, especially by institutions with concentrations
in riskier or less predictable positions. According to Duan, Sealey and Yan (1999) banks
manage interest rate risk by choosing asset and liability portfolios in order to monitor changes
in the value of target variables that result from changes in interest rates. The authors present a
comparison of numerical models based on options and conventional ones. The results show
that the two approaches can give very different values for exposure to interest rate risk,
especially during periods with higher than average rate volatility and/or credit risk for banks
with higher than average. Authors pay attention on the fact that it is not possible to say that
one is always best.
Alessandri and Drehmann (2010) try to infer about a corporate view of risks including credit,
market and liquidity risk, in that paper the authors derive an economic capital model which
consistently integrates credit and interest rate risk in the banking book but it doesn’t address
the issue of what is the appropriate level of capital for a bank. They focus instead on the
question of how this level of economic capital is influenced by interactions between credit
and interest rate risk. The main result of the analysis is that simple capital exceeds integrated
capital. In other words: a simple approach to aggregate credit risk and interest rate risk in the
retail loan book doesn’t lead to an underestimation of risk, compared to an approach that takes
into account the interactions between the two sources of risk. The difference between the two
depends on various features of the bank.
Trying to represent accurately in terms of risk and profitability for "non-maturity" items,
econometric modelling should then recognize the two distinctive features: (a) the limited
degree of indexing rates (especially for the collection), so we can process the products
(collection) exposed to similar fixed-rate instruments; (b) the high persistence of aggregate
thereby assimilating items analyzed in liabilities / assets medium to long term. In detail, the
quantification of the impact of a shock to market rates on income and economic value can be
made to articulate the research through the use of two econometric models: (i) those referred
to rates, which describes the dynamics the interest rate on sight, and identifies a product
indexing formula that ties the rate charged to customers at the market rate; (ii) those analysing
the volumes particularly in terms of stock persistence.
The model for interest rate risk measurement requires first to identify a relationship
pricing heuristics, and this is estimated by placing a link between the rates of demand items
with market rates through an error-correcting econometric model ECM which is composed of
two separate reports: long-term relationship (or equilibrium) and short-run relation (or
dynamic).
The long-term relationship provides a measure of how changes in market rates !!"! are
reflected in changes in the rate of demand items and it is represented by the following
formula:
!!! ! ! ! ! !"!
where the parameters are:
!! bank rate long-run equilibrium consistent with the observed
value of !"!
! spread on constant rate
! long-term elasticity of bank rate in comparison with the market
rate
482482
Proceedings in Finance and Risk Perspectives`12
ACRN Cambridge Publishing House
ISBN: 978-3-9503518-0-4
5
!"! market rate reference observed at time t (typically 1 month
Euribor)
It should be noted that the bargaining power of banks ensure that changes in market interest
rates do not reflect immediately and symmetrical changes in interest rates granted to
customers. For this reason, the short-run relation of the model ECM is designed to measure
the phenomenon of stickiness, highlighting the manner and timing of rate adjustment of
demand items at the market rate of reference. It can be represented by the following formula:
!!! ! !! ! !!!!! ! !!!!! !! !!! ! !!"!
!! !!! ! !!"!
!
where:
!!! variation in the rate applied by the bank between t and t-1
! rate of absorption(meanreverting)of bank rates to market
rates
!!!! the rate applied by the bank observed at time t-1
!!!!! long-run equilibrium base rate
!!, !! bank interest rate sensitivity, respectively, to the rise and
descent of the market
!!"!
!, !!"!! respectively: changes in positive (negative) of the market
rate at time t compared to t -1
Taken together the long-term relationships and a formula describing the short index of
“atypical”, where the rate applied to the customer depends on the imbalance between the past
values of the rate of the product and the market rate (! and ! parameters)and changes in
current the market rate (positive or negative, represented by !! and !!).
Combining the two relations are obtained:
!!! ! !! ! !!!!! ! ! ! ! ! !"!!!!! !!!! !!"!
!! !!! ! !!"!
!
Assuming then that before the shock on the market rate is in equilibrium, the instantaneous
response of the rate parameters depends only on the !! and !! parameters. If after the shock,
the market rate does not undergo further changes, the speed of adjustment of the rate depends
on the imbalance that has yet to be absorbed and on the ! parameter.
The model for volumes analysis should represent the maturity of demand items as realistic
as possible, highlighting the high degree of persistence of aggregates. For this purpose we
assume that the volumes do not remain constant on the holding period agreed, but design a
progressive decline in a virtual amortization profile and transform so the amount of demand
items placed in a portfolio at maturity. This profile is the result of a historical analysis of
volumes, suitably smoothed through a filter statistics to grasp the historical trend from which
to draw the décalage. In literature there are numerous treaties smoothing methods, such as the
Hodrick-Prescott filter, Kalman, moving average, cubic spline ... In this work we applied the
first one. In short, given a set of historical data !! that is supposed to be composed of a
historical trend ! and of a cyclical component !! superimposed on the trend, the HP filter
isolates the cyclical component, solving the following minimization problem:
!"#!!!!!!!! !! ! !!
!! ! !!!! ! !! ! !! ! !!!!
!
!!!
!!!
!
!!!
483483
Beyond Stress Testing: Modelling Liquidity and Interest Rate Risks for (real) Corporate
Measures
where the penalty parameter ë is the smoothing parameter that allows to adjust the sensitivity
of the trend to short-term fluctuations.
The analysis is carried out starting from the natural logarithm of unit volumes, as for each t. It
is applied to the HP filter and we calculated the historical volatility of the logarithmic series
around the trend and determinates the most stable component (so-called core deposits). In this
way, from the statistical analysis of the volumes’ persistence we identified two components: a
stable (core) and a highly volatile(non-core). In logarithmic terms, the core component of unit
volumes, !! ! , is defined as follows:
!! ! ! !! ! ! ! !! ! ! !!!
Where :
!! ! trend obtained by applying the volume Hodrick Prescott
filter to the natural logarithm
! !! volatility around the trend
! !!! value of the standard normal distribution at a confidence
level equal to ! (Used the 99 th percentile)
Once the core component is identified, we detected the persistence profile and we determined
a profile of likely minimum volumes (mpa, minimum probable amount). Under a fixed
confidence ! level, the amount statistically certain to be present next month is obtained by the
following equation:
!"# ! ! ! ! !!!! ! !! !! !! !!! ! !
where h is the number of periods is defined on the repayment of virtual items on demand.
Once Mpa is established, the “depreciation charge” (dc) of at sight items in each period h is
given by the following equation3:
!" ! ! ! ! !"# ! ! ! ! ! !!"#!! ! !!
As it is easy to guess, being the model for the analysis of volume data based on logarithmic
data, the evolution of mpa volumes decreases exponentially over time with asymptotic nature
and tends to zero. The remaining debt still exists existing at time T + H is then redistributed
evenly between T and T + H, redefining the mpa profile.
!"!!! ! ! !" !! ! !
!
!! !
!! ! !! !! !! !!! ! !
Mpa* therefore becomes as follows:
!"#! ! ! ! ! !!! !
! !"!
!
!!!
! ! !
In terms of the unit volumes the core component is given by:
!"#$ ! !!! !
while the volatile component is obtained as the difference between the actual volume and the
core component:
!"#"$% ! ! ! ! !"#$
3 In this paper, the number of period (h) is assumed to be 120 (ten years).
484484

Proceedings in Finance and Risk Perspectives`12
ACRN Cambridge Publishing House
ISBN: 978-3-9503518-0-4
7
2. Toward a new approach.
The model currently applied by Veneto Banca Group (a medium size, fast growing Italian
bank) to determinate the parameters of the ECM model and the volumes persistence is
obtained through historical data provided by the Management Control. Customers are divided
into three distinct groups:
• “wholesale” customers, that are classified by the Management Control as directional
• “Intra-group” customers, that are the relations with legal entities of the group;
• other customers, defined for simplicity “retail”.
The first two customer types are not treated with econometric models for two reasons:
1. For “wholesale” customers: the average balance on cash accounts is so substantial that
it is unrealistic to assume their place in a short time if the customer turns his savings to
another bank.
2. Intercompany relations are used for the natural functioning of society and they are
settled by market rate.
So, being conservative, the balance on current accounts with these two types of customers are
actually treated as sight items, both from the point of view of the rate adjustment and from the
point of view of the term presence (it is assumed that rates are overnight). Instead, the
relations with “retail” customers are subjected to the econometric estimations.
This methodology presents some limits. The main regards the “clustering” between
“wholesale” and “retail” that is made by the business segment: this attribute is likely to
change over time because of different trade policies. Each customer, in fact, may be changed
from a segment to a different at any time without its behavior actually changes. The other
limit points out in case of growth by external acquisition of a bank or branches. These two
issues make it difficult to build a deep homogeneous time series over 32 months (32 monthly
observations, which are data available from the Management Control). The historical depth
recommended for the determination of the model is at least five years even if it leads to a
good approximation already with 20 observations.
To overcome these problems and thereby increase the depth of time series and getting a more
steady and objective outcomes, we have grouped the at sight forms of funding and lending
according to the segment of economic activity (SAE). This attribute is stable over the time
because it is not susceptible to commercial clustering. Furthermore, we thought to historicize
the data for individual counterparties, so that, at the time of analysis, it is possible to
reconstruct a consistent time series with the latest situation. In this way, in fact, we enucleated
relations that at the reference date have the distinction of being intercompany even if they
aren’t in the old estimation thus solving the second problem. With the SAE, we decided to
separate the technical forms of funding and lending in two sub-series, through the Basel III
recommendations, assembling in two distinct categories (retail, wholesale). The econometric
estimates conducted and described in the following sections confirm that this subdivision
allows to identify clusters statistically different from each other and at the same homogeneous
within them.
2.1 Analysis of concentration risk
The two main clusters obtained according to the specifications of the previous section are
further analyzed to determine if they meet the model core assumptions of volumes
485485
Beyond Stress Testing: Modelling Liquidity and Interest Rate Risks for (real) Corporate
Measures
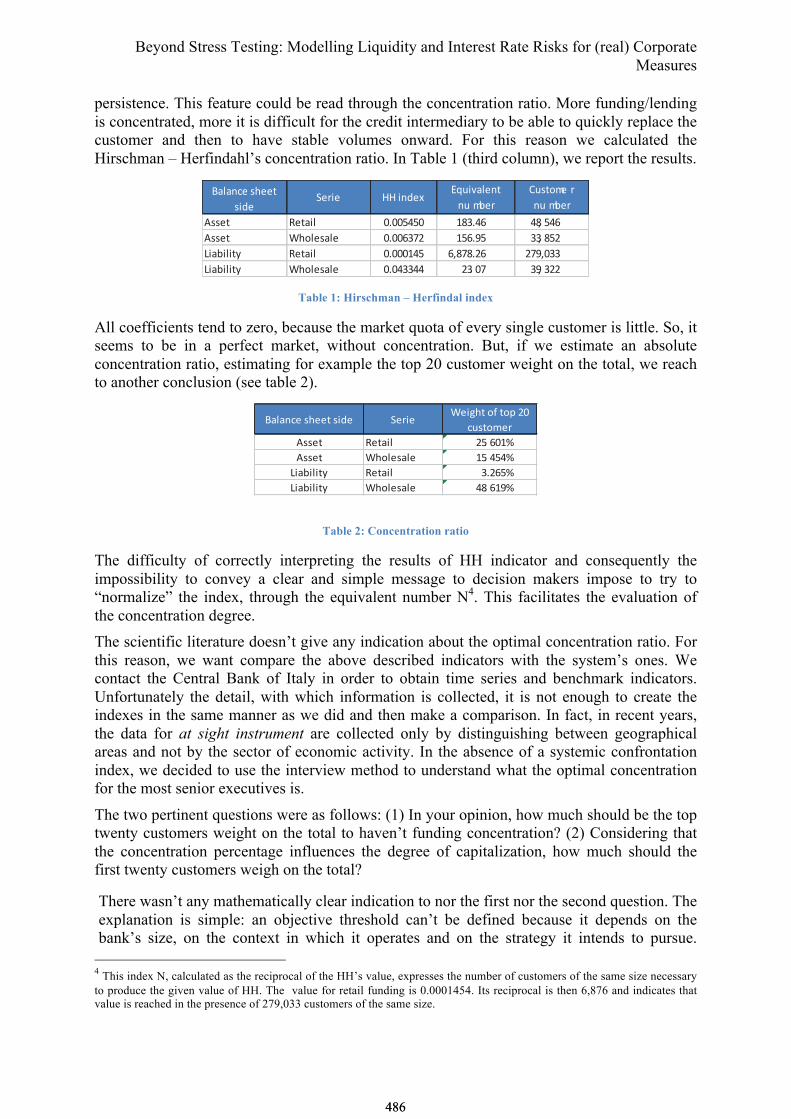
persistence. This feature could be read through the concentration ratio. More funding/lending
is concentrated, more it is difficult for the credit intermediary to be able to quickly replace the
customer and then to have stable volumes onward. For this reason we calculated the
Hirschman – Herfindahl’s concentration ratio. In Table 1 (third column), we report the results.
!"#"$%&'()&&*'
(+,&-&.+& //' +$,&0
123+4"#&$*'
$3 56&.
73(*85& .'
$3 56&.
9((&* :&*"+# ;<;;=>=; ?@A<>B >@C =>B
9((&* D)8#&("#& ;<;;BAEF ?=B<G= AAC @=F
H+"6+#+*I :&*"+# ;<;;;?>= BC@E@<FB FEGC;AA
H+"6+#+*I D)8#&("#& ;<;>AA>> FA< ;E AGC AFF
Table 1: Hirschman – Herfindal index
All coefficients tend to zero, because the market quota of every single customer is little. So, it
seems to be in a perfect market, without concentration. But, if we estimate an absolute
concentration ratio, estimating for example the top 20 customer weight on the total, we reach
to another conclusion (see table 2).
!"#"$%&'()&&*'(+,& -&.+&/&+0)*'12'*13'45'
%6(*17&.
8((&* 9&*"+# 4:; <5=>
8((&* /)1#&("#& =:; ?:?>
@+"A+#+*B 9&*"+# C;4<:>
@+"A+#+*B /)1#&("#& ?D; <=E>
Table 2: Concentration ratio
The difficulty of correctly interpreting the results of HH indicator and consequently the
impossibility to convey a clear and simple message to decision makers impose to try to
“normalize” the index, through the equivalent number N4. This facilitates the evaluation of
the concentration degree.
The scientific literature doesn’t give any indication about the optimal concentration ratio. For
this reason, we want compare the above described indicators with the system’s ones. We
contact the Central Bank of Italy in order to obtain time series and benchmark indicators.
Unfortunately the detail, with which information is collected, it is not enough to create the
indexes in the same manner as we did and then make a comparison. In fact, in recent years,
the data for at sight instrument are collected only by distinguishing between geographical
areas and not by the sector of economic activity. In the absence of a systemic confrontation
index, we decided to use the interview method to understand what the optimal concentration
for the most senior executives is.
The two pertinent questions were as follows: (1) In your opinion, how much should be the top
twenty customers weight on the total to haven’t funding concentration? (2) Considering that
the concentration percentage influences the degree of capitalization, how much should the
first twenty customers weigh on the total?
There wasn’t any mathematically clear indication to nor the first nor the second question. The
explanation is simple: an objective threshold can’t be defined because it depends on the
bank’s size, on the context in which it operates and on the strategy it intends to pursue.
4 This index N, calculated as the reciprocal of the HH’s value, expresses the number of customers of the same size necessary
to produce the given value of HH. The value for retail funding is 0.0001454. Its reciprocal is then 6,876 and indicates that value is reached in the presence of 279,033 customers of the same size.
486486

Proceedings in Finance and Risk Perspectives`12
ACRN Cambridge Publishing House
ISBN: 978-3-9503518-0-4
9
Regarding the first, in theory the concentration degree should decrease when the size of the
financial intermediary increases. In reality, however, as the bank is bigger as it has the ability
to offer services to customers of larger size and then to be chosen as counterpart. Regarding
the second point, approximately 50% of the Italian banking system bearing liabilities consists
of demand deposits. In May 31st, Veneto Banca Group is at 42.5%. The leaders, therefore,
believe that it isn’t worth replacing the funding of most important customers with other
funding forms, usually more expensive.
In conclusion, the degree of current concentration doesn’t arouse any concern to managers.
For our purposes this answer is not useful because if the top-twenty-customer-concentration
level is not perceived as alarming, the demand instruments may treat them as a core
component. But since the first customers have a market share of 48.6%, this conclusion
seems in contrast with the prudence principle. In the absence of a benchmark, the
determination of the threshold (above which the econometric model can’t be applied because
it is in contrast with the immediate-substitution principle) it has been set empirically. We
establish that the weight of the first twenty customers shall not exceed 5% of the total
technical form. The number of customers has been established according to the inquiries of
rating agencies, which regularly require the top ten or twenty customers for their studies5.
The following tables outline for all items the thresholds, the total balance, customer number,
and the top-twenty-customer weight6. Alongside this ratio the Gini coefficient
7 has also been
reported. As a result, with the criterion of the relative weight of the top twenty customers
who at first glance would seem the result of a naif approach, the Gini index is on average less
than or equal 0.003 (see the green rows). This level highlights the customers’ “lack of
concentration”. This approach has been respected for all series analyzed and it has been
tested both on the first point of the series that last one. It betrays a substantial stability over
time of the threshold level at which discriminate against the concentration.
5 This means that our analysis is hardly influenced by this assumption.
6 In the next paper we will illustrate that in Northern Italy the no-concentration threshold is higher than in Center and South.
For example, if we analyze the retail series (liability side) we can demonstrate that in the North the richness is not
concentrated, thanks to an homogeneous distribution of families wealth. Instead, in south regions, there are some concentrated areas. These results should mark that the bank capitalization depends on wealth distribution.
7 We prefer this concentration index because It is the simplest communicable. In fact, it can take a value ranging from 0 to 1
(the case of a single client).
487487

Beyond Stress Testing: Modelling Liquidity and Interest Rate Risks for (real) Corporate
Measures
2.2 The Ecm model
On the basis of the above illustrated methodology, we estimate the ECM model’s parameters
for every single series. We run the regression following the full model (one stadium
approach) and its decomposition in the long/short period relation (two stadium model). In the
next table, we report the regression results (!!). Since models are esteemed with data paucity
(due to the short historical depth), we prefer the two stadium model because it is able to
gather better the variability. Probably, with more observations, it is just sufficient the one
stadium model.
Series Full model Two stadium
model
Asset side – retail 0.5184 0.5462
Asset side – wholesale 0.6132 0.6386
Liability side – retail 0.8476 0.8697
Liability side – wholesale 0.9435 0.9664
Thanks to a careful analysis, we also define a logical work-flow for the model’s application.
First of all, the parameters’ meaningfulness is based on a probability value equal to 5% (p-
value). Under this percentage we reject the null normality hypothesis. Analyzing the long
term relation, it could happen that the parameter α or the β are not acceptable. If it should
happen at first one, we do not discover some theoretical limits, as it represents the intercept
value, or in economic terms, it is equivalent to the mark-up when β is 1. Even if not
B/S side Liability Series Wholesale
UPPER LIMIT
AMOUNT
STOCK
(€/mil.)
CUSTOMERS
(number)
AVERAGE
(€)
Top 20
customer
(stock)
Top 20
customer
(w eight %)
GINI
COEFFICIENT
<=5.2 mil. 1,934.11 40,646 47,584.26 92.98 4.81% 0.26%
<=10 mil. 2,276.97 40,697 55,949.33 164.02 7.20% 0.43%
<=20 mil. 2,803.4 40,735 68,820.42 323.48 11.54% 0.70%
<=40 mil. 3,294.9 40,752 80,852.47 550.13 16.70% 1.21%
none 6,207.01 40,771 152,240.81 2,952.08 47.56% 18.27%
B/S side Liability Series Retail
UPPER LIMIT
AMOUNT
STOCK
(€/mil.)
CUSTOMERS
(number)
AVERAGE
(€)
Top 20
customer
(stock)
Top 20
customer
(w eight %)
GINI
COEFFICIENT
<=0.5 mil. 3,083.45 277,070 11,128.78 9.80 0.32% 0.02%
<=1.5 mil. 3,275.92 277,325 11,812.57 26.14 0.80% 0.05%
none 3,440.78 277,378 12,404.66 106.10 3.08% 0.77%
B/S side Asset Series Wholesale
UPPER LIMIT
AMOUNT
STOCK
(€/mil.)
CUSTOMERS
(number)
AVERAGE
(€)
Top 20
customer
(stock)
Top 20
customer
(w eight %)
GINI
COEFFICIENT
<=12 mil. 3,905.92 34,074 114,630.38 194.91 4.99% 0.30%
none 4,628.18 34,091 135,759.60 756.80 16.35% 7.33%
B/S side Asset Series Retail
UPPER LIMIT
AMOUNT
STOCK
(€/mil.)
CUSTOMERS
(number)
AVERAGE
(€)
Top 20
customer
(stock)
Top 20
customer
(w eight %)
GINI
COEFFICIENT
<=0.85 mil. 319.90 50,238 6,367.69 15.45 4.83% 0.26%
<=0.89 mil. 323.40 50,242 6,436.88 16.11 4.98% 0.27%
none 638.56 50,323 12,689.17 206.51 32.34% 9.98%
488488
Proceedings in Finance and Risk Perspectives`12
ACRN Cambridge Publishing House
ISBN: 978-3-9503518-0-4
11
significant, the α parameter has to be forced to the minimum rate recognized to the customer.
Different reasoning for the β. If it should be negative or not significant the linear
interpolation has no sense8. Only in one of our analysis, we found a case of insignificant β. To
get round this problem, we investigated the events happened in that society. Specifically,
some massive manoeuvres were make to avoid a customer hemorrhage. Calculating the
regression from the last manouvre date, the β became significant.
About the short period relation, we consider that the bank rates’ sensitivity to the market rate
changes must respect the following constrains, due to the bank’s bargaining power:
Item Constrain
Assets item !! ! !!
Liability item !! ! !!
In other words, if we are analyzing the series "assets retail" and the parameter !! turned out
not significant, the dynamic relation would become:
!!! ! !! ! !!!!! ! !!!!! !! !!! ! !!"!
!
On the other hand, if the parameter !! turns out not significant while !! is acceptable, the
used equation become:
!!! ! !! ! !!!!! ! !!!!! !! !!! ! !!"!
!! !!! ! !!"!
! , where !! ! !!
Of course, we should think on the contrary when we analyze the liability series.
The results of the estimation must then be compared between system benchmarks and
between asset and liability parameters. In Italy, the !! on the savings deposits is included
between 0.3 and 0.4 (with an !! index at least to 60%-70%; the volumes core percentage is
between 80% and 85%); in the asset side it should be included between 0.6 and 0.85 (!!
near to 50% and core percentage should be between 75% and 80%.) Other considerations
should be place on the parameters’ values (asset vs. liability instruments) and their impact on
the risk measures. In particular, the parameter ! has big influence on the asset sensitivity
(lower on the liability’s one). The last parameter (!) has importance in the short period and
therefore it has a greater influence on earnings analysis.
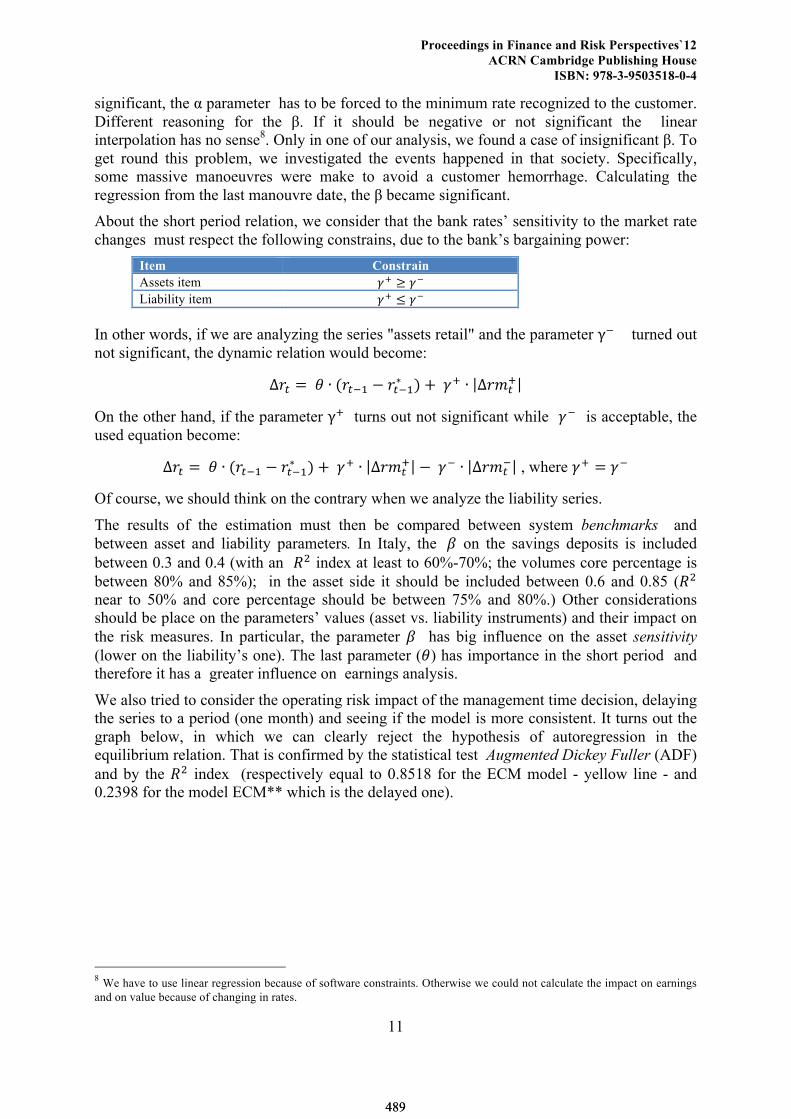
We also tried to consider the operating risk impact of the management time decision, delaying
the series to a period (one month) and seeing if the model is more consistent. It turns out the
graph below, in which we can clearly reject the hypothesis of autoregression in the
equilibrium relation. That is confirmed by the statistical test Augmented Dickey Fuller (ADF)
and by the !! index (respectively equal to 0.8518 for the ECM model - yellow line - and
0.2398 for the model ECM** which is the delayed one).
8 We have to use linear regression because of software constraints. Otherwise we could not calculate the impact on earnings
and on value because of changing in rates.
489489
Beyond Stress Testing: Modelling Liquidity and Interest Rate Risks for (real) Corporate
Measures
Figure 1: ECM model’s consistance – retail asset side series
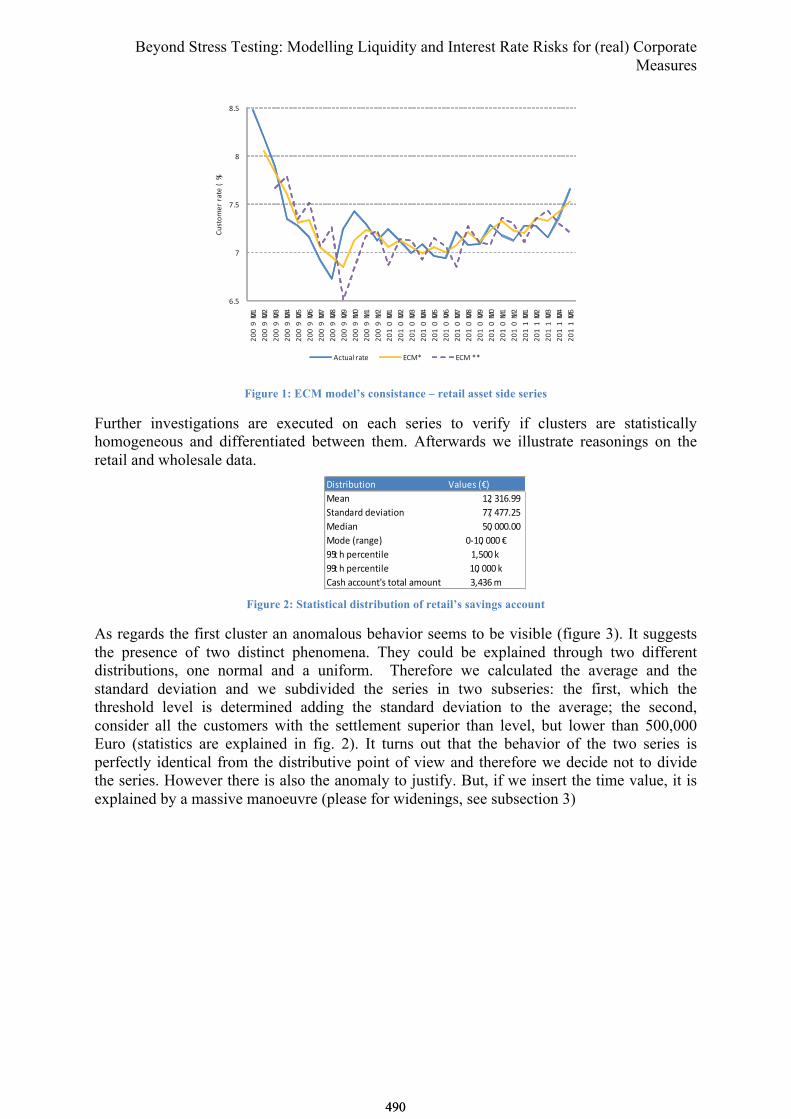
Further investigations are executed on each series to verify if clusters are statistically
homogeneous and differentiated between them. Afterwards we illustrate reasonings on the
retail and wholesale data.
Figure 2: Statistical distribution of retail’s savings account
As regards the first cluster an anomalous behavior seems to be visible (figure 3). It suggests
the presence of two distinct phenomena. They could be explained through two different
distributions, one normal and a uniform. Therefore we calculated the average and the
standard deviation and we subdivided the series in two subseries: the first, which the
threshold level is determined adding the standard deviation to the average; the second,
consider all the customers with the settlement superior than level, but lower than 500,000
Euro (statistics are explained in fig. 2). It turns out that the behavior of the two series is
perfectly identical from the distributive point of view and therefore we decide not to divide
the series. However there is also the anomaly to justify. But, if we insert the time value, it is
explained by a massive manoeuvre (please for widenings, see subsection 3)
!"#
$
$"#
%
%"#
&''()'*
&''()'&
&''()'+
&''()',
&''()'#
&''()'!
&''()'$
&''()'%
&''()'(
&''()*'
&''()**
&''()*&
&'*')'*
&'*')'&
&'*')'+
&'*')',
&'*')'#
&'*')'!
&'*')'$
&'*')'%
&'*')'(
&'*')*'
&'*')**
&'*')*&
&'**)'*
&'**)'&
&'**)'+
&'**)',
&'**)'#
-./01234546035789
:;0.6<54603 =-)> =-)5>>
!"#$%"&'$"()* +,-'.#*/01
2.,) 345 637899****
:$,);,%;*;.<",$"() ==5 >==84?****
2.;",) ?@5 @@@8@@****
2(;.*/%,)A.1 @B3@5 @@@*0
9?$ C*D.%E.)$"-. 35?@@*F*
99$ C*D.%E.)$"-. 3@5 @@@*F
G,#C*,EE(')$H#*$($,-*,I(')$ 65>67*I
490490

Proceedings in Finance and Risk Perspectives`12
ACRN Cambridge Publishing House
ISBN: 978-3-9503518-0-4
13
Figure 3: Correlation between Euribor and Customers’ rate (upper limit: 500,000 €)
Figure 4: Correlation between Euribor and Customers’ rate (upper limit: 90,000 €)
!"!! #
!"$! #
!"%! #
!"&! #
!"'! #
("!! #
("$! #
("%! #
("&! #
!"!! # !")! # ("!! # (")! # $"!! # $")! #
!"#$%&'(#)*(+$'
,"(-.%(
!"!! #
!"$! #
!"%! #
!"&! #
!"'! #
("!! #
("$! #
("%! #
!"!! # !")! # ("!! # (")! # $"!! # $")! #
!"#$%&'(#)*(+$'
,*&%-$ .*/"(01%(
%! #
%! #
491491
Beyond Stress Testing: Modelling Liquidity and Interest Rate Risks for (real) Corporate
Measures
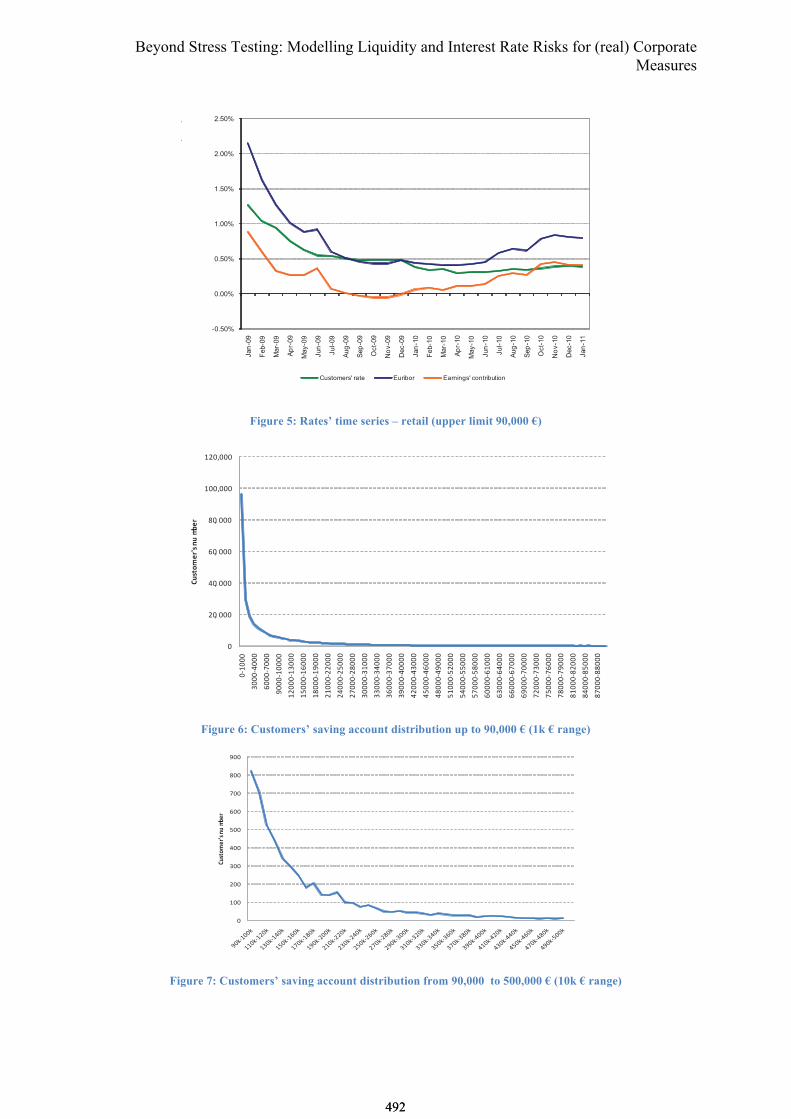
Figure 5: Rates’ time series – retail (upper limit 90,000 €)
Figure 6: Customers’ saving account distribution up to 90,000 € (1k € range)
Figure 7: Customers’ saving account distribution from 90,000 to 500,000 € (10k € range)
-0.50%
0.00%
0.50%
1.00%
1.50%
2.00%
2.50%
Jan
-09
Feb-0
9
Mar-
09
Ap
r-09
May-0
9
Jun
-09
Jul-
09
Aug
-09
Sep
-09
Oct-
09
No
v-0
9
Dec-0
9
Jan
-10
Feb-1
0
Mar-
10
Ap
r-10
May-1
0
Jun
-10
Jul-
10
Aug
-10
Sep
-10
Oct-
10
No
v-1
0
Dec-1
0
Jan
-11
Customers' rate Euribor Earnings' contribution
!
"!# !!!
$!# !!!
%!# !!!
&!# !!!
'!!#!!!
'"!#!!!
!('!!!
)!!!($!!!
%!!!(*!!!
+!!!('!!!!
'"!!!(')!!!
',!!!('%!!!
'&!!!('+!!!
"'!!!(""!!!
"$!!!(",!!!
"*!!!("&!!!
)!!!!()'!!!
))!!!()$!!!
)%!!!()*!!!
)+!!!($!!!!
$"!!!($)!!!
$,!!!($%!!!
$&!!!($+!!!
,'!!!(,"!!!
,$!!!(,,!!!
,*!!!(,&!!!
%!!!!(%'!!!
%)!!!(%$!!!
%%!!!(%*!!!
%+!!!(*!!!!
*"!!!(*)!!!
*,!!!(*%!!!
*&!!!(*+!!!
&'!!!(&"!!!
&$!!!(&,!!!
&*!!!(&&!!!
!"#$%&'()#*+"&,'(
!
"!!
#!!
$!!
%!!
&!!
'!!
(!!
)!!
*!!
!"#$%&'()#*+"&,'(
492492
Proceedings in Finance and Risk Perspectives`12
ACRN Cambridge Publishing House
ISBN: 978-3-9503518-0-4
15
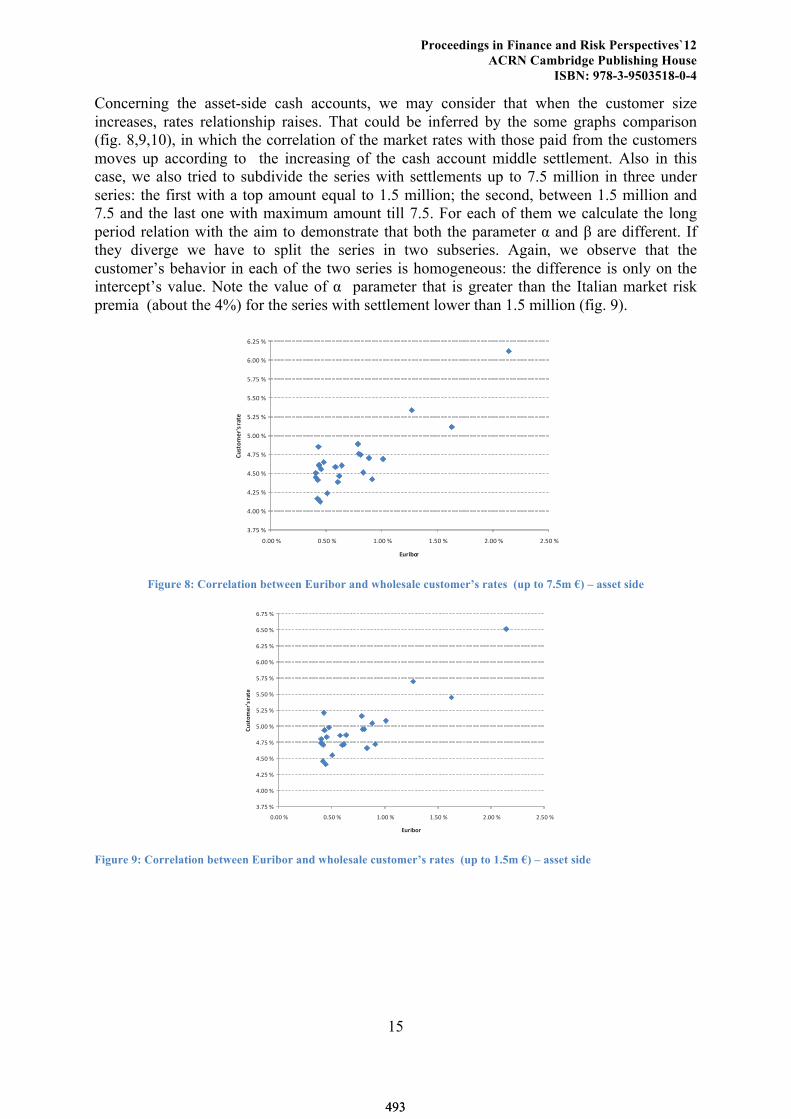
Concerning the asset-side cash accounts, we may consider that when the customer size
increases, rates relationship raises. That could be inferred by the some graphs comparison
(fig. 8,9,10), in which the correlation of the market rates with those paid from the customers
moves up according to the increasing of the cash account middle settlement. Also in this
case, we also tried to subdivide the series with settlements up to 7.5 million in three under
series: the first with a top amount equal to 1.5 million; the second, between 1.5 million and
7.5 and the last one with maximum amount till 7.5. For each of them we calculate the long
period relation with the aim to demonstrate that both the parameter α and β are different. If
they diverge we have to split the series in two subseries. Again, we observe that the
customer’s behavior in each of the two series is homogeneous: the difference is only on the
intercept’s value. Note the value of α parameter that is greater than the Italian market risk
premia (about the 4%) for the series with settlement lower than 1.5 million (fig. 9).
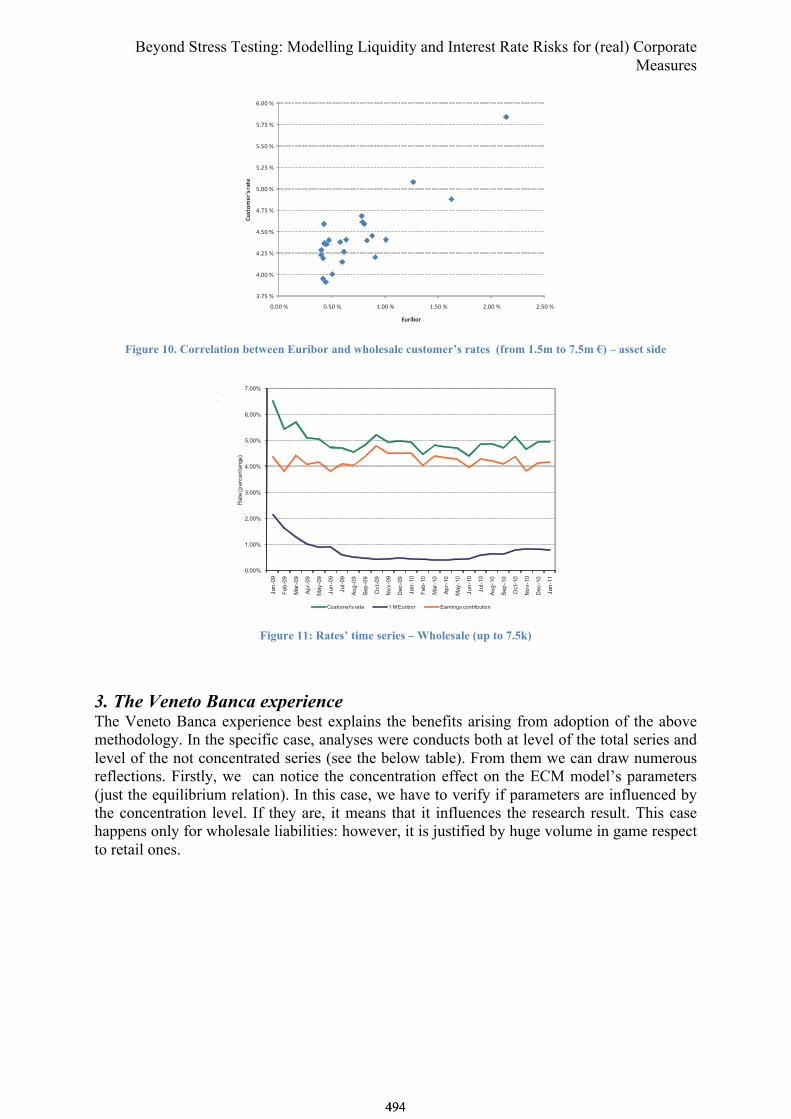
Figure 8: Correlation between Euribor and wholesale customer’s rates (up to 7.5m €) – asset side
Figure 9: Correlation between Euribor and wholesale customer’s rates (up to 1.5m €) – asset side
!"#$ %
&"'' %
&"($ %
&"$' %
&"#$ %
$"'' %
$"($ %
$"$' %
$"#$ %
)"'' %
)"($ %
'"'' % '"$' % *"'' % *"$' % ("'' % ("$' %
!"#$%&'()#*(+$'
,"(-.%(
!"#$ %
&"'' %
&"($ %
&"$' %
&"#$ %
$"'' %
$"($ %
$"$' %
$"#$ %
)"'' %
)"($ %
)"$' %
)"#$ %
'"'' % '"$' % *"'' % *"$' % ("'' % ("$' %
!"#$%&'()#*(+$'
,"(-.%(
493493
Beyond Stress Testing: Modelling Liquidity and Interest Rate Risks for (real) Corporate
Measures
Figure 10. Correlation between Euribor and wholesale customer’s rates (from 1.5m to 7.5m €) – asset side
Figure 11: Rates’ time series – Wholesale (up to 7.5k)
3. The Veneto Banca experience The Veneto Banca experience best explains the benefits arising from adoption of the above
methodology. In the specific case, analyses were conducts both at level of the total series and
level of the not concentrated series (see the below table). From them we can draw numerous
reflections. Firstly, we can notice the concentration effect on the ECM model’s parameters
(just the equilibrium relation). In this case, we have to verify if parameters are influenced by
the concentration level. If they are, it means that it influences the research result. This case
happens only for wholesale liabilities: however, it is justified by huge volume in game respect
to retail ones.
!"#$ %
&"'' %
&"($ %
&"$' %
&"#$ %
$"'' %
$"($ %
$"$' %
$"#$ %
)"'' %
'"'' % '"$' % *"'' % *"$' % ("'' % ("$' %
!"#$%&'()#*(+$'
,"(-.%(
0.00%
1.00%
2.00%
3.00%
4.00%
5.00%
6.00%
7.00%
Jan
-09
Feb-0
9
Mar-
09
Ap
r-09
May-0
9
Jun
-09
Jul-
09
Aug
-09
Sep
-09
Oct-
09
No
v-0
9
Dec-0
9
Jan
-10
Feb-1
0
Mar-
10
Ap
r-10
May-1
0
Jun
-10
Jul-
10
Aug
-10
Sep
-10
Oct-
10
No
v-1
0
Dec-1
0
Jan
-11
Rate
(p
erc
en
tange
)
Customer's rate 1 M Euribor Earnings contribution
494494
Proceedings in Finance and Risk Perspectives`12
ACRN Cambridge Publishing House
ISBN: 978-3-9503518-0-4
17
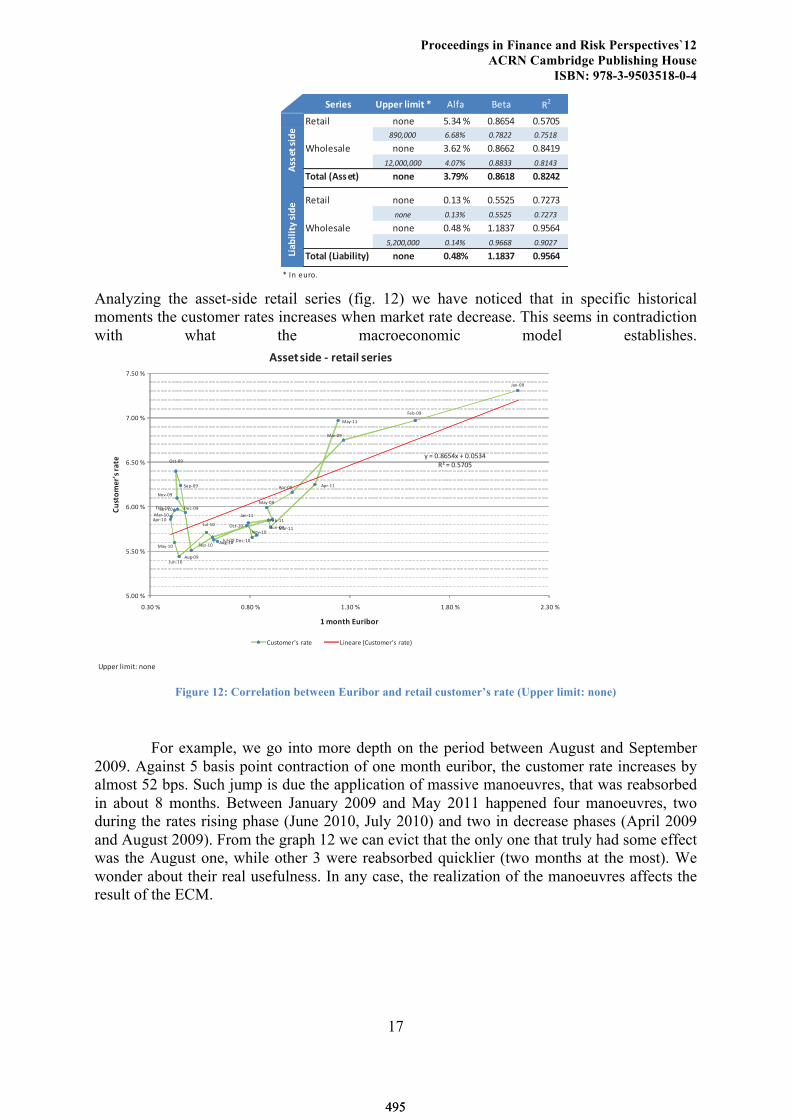
Analyzing the asset-side retail series (fig. 12) we have noticed that in specific historical
moments the customer rates increases when market rate decrease. This seems in contradiction
with what the macroeconomic model establishes.
Figure 12: Correlation between Euribor and retail customer’s rate (Upper limit: none)
For example, we go into more depth on the period between August and September
2009. Against 5 basis point contraction of one month euribor, the customer rate increases by
almost 52 bps. Such jump is due the application of massive manoeuvres, that was reabsorbed
in about 8 months. Between January 2009 and May 2011 happened four manoeuvres, two
during the rates rising phase (June 2010, July 2010) and two in decrease phases (April 2009
and August 2009). From the graph 12 we can evict that the only one that truly had some effect
was the August one, while other 3 were reabsorbed quicklier (two months at the most). We
wonder about their real usefulness. In any case, the realization of the manoeuvres affects the
result of the ECM.
!"#$"% &''"#()$*$+(, !"#$ %&'$ ()
(&'$*" +,+& -./01 2.34-0 2.-52-
!"#$### %&%!' #&(!)) #&(*+!
67,"&8$"& +,+& /.4)1 2.344) 2.309:
+)$###$### ,&#(' #&!!-- #&!+,-
-.+/)(01%%"+2 3.3" 45678 95:;<: 95:=>=
(&'$*" +,+& 2.9/1 2.--)- 2.5)5/
./.0 #&+-' #&**)* #&()(-
67,"&8$"& +,+& 2.031 9.93/5 2.:-40
*$)##$### #&+,' #&"%%! #&"#)(
-.+/)(0?$/@$)$+A2 3.3" 95>:8 <5<:46 957B;>
;<=+<&>?,.
1%%"+(%$C"
?$/@$)$+A(%$C"
!""#$%&'(')*%+,+#
-.+/01
2#3/01
4.$/01
5"$/01
4.6/01
-7+/01
-7&/01
578/01
9#"/01
:;)/01
<,=/01
>#;/01-.+/?02#3/?0
4.$/?05"$/?0
4.6/?0
-7+/?0
-7&/?0
578/?09#"/?0
:;)/?0
<,=/?0
>#;/?0
-.+/??2#3/??
4.$/??
5"$/??
4.6/??
6%@%0ABCDEF%G%0A0DHE
IJ%@%0ADK0D
DA00 L
DAD0 L
CA00 L
CAD0 L
KA00 L
KAD0 L
0AH0 L 0AB0 L ?AH0 L ?AB0 L MAH0 L
!"#$%&'()#*(+$'
,*&%-$.*/"(01%(
2##'$*#03'*4 ('$+05*#'(0'#
N7O),(#$PO%$.)# Q'+#.$#%RN7O),(#$PO%$.)#S
495495
Beyond Stress Testing: Modelling Liquidity and Interest Rate Risks for (real) Corporate
Measures
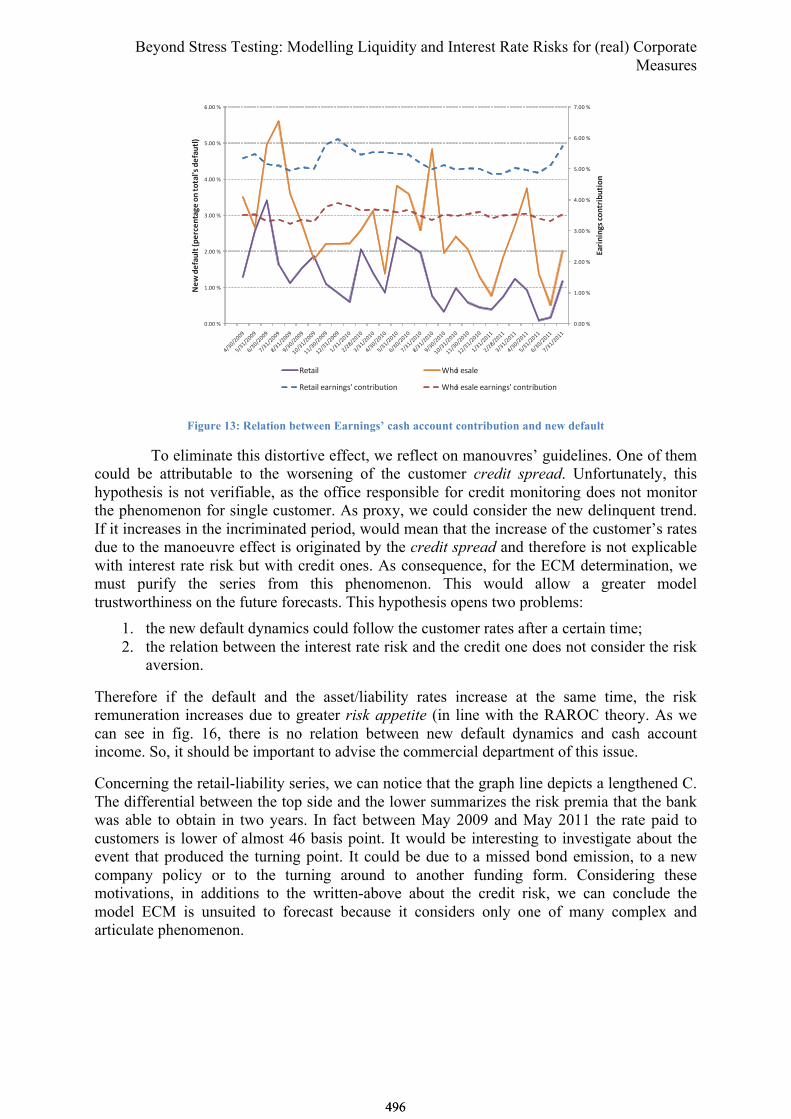
Figure 13: Relation between Earnings’ cash account contribution and new default
To eliminate this distortive effect, we reflect on manouvres’ guidelines. One of them
could be attributable to the worsening of the customer credit spread. Unfortunately, this
hypothesis is not verifiable, as the office responsible for credit monitoring does not monitor
the phenomenon for single customer. As proxy, we could consider the new delinquent trend.
If it increases in the incriminated period, would mean that the increase of the customer’s rates
due to the manoeuvre effect is originated by the credit spread and therefore is not explicable
with interest rate risk but with credit ones. As consequence, for the ECM determination, we
must purify the series from this phenomenon. This would allow a greater model
trustworthiness on the future forecasts. This hypothesis opens two problems:
1. the new default dynamics could follow the customer rates after a certain time;
2. the relation between the interest rate risk and the credit one does not consider the risk
aversion.
Therefore if the default and the asset/liability rates increase at the same time, the risk
remuneration increases due to greater risk appetite (in line with the RAROC theory. As we
can see in fig. 16, there is no relation between new default dynamics and cash account
income. So, it should be important to advise the commercial department of this issue.
Concerning the retail-liability series, we can notice that the graph line depicts a lengthened C.
The differential between the top side and the lower summarizes the risk premia that the bank
was able to obtain in two years. In fact between May 2009 and May 2011 the rate paid to
customers is lower of almost 46 basis point. It would be interesting to investigate about the
event that produced the turning point. It could be due to a missed bond emission, to a new
company policy or to the turning around to another funding form. Considering these
motivations, in additions to the written-above about the credit risk, we can conclude the
model ECM is unsuited to forecast because it considers only one of many complex and
articulate phenomenon.
!"!! #
$"!! #
%"!! #
&"!! #
'"!! #
("!! #
)"!! #
*"!! #
!"!! #
$"!! #
%"!! #
&"!! #
'"!! #
("!! #
)"!! #
!"#$%$%&'()*%+#$,-+$*%
./0(1/2"-3+(45/#)/%+"&/(*%(+*+"36'(1/2"-+37
+,-./0 1230 ,4.0,
+,-./05,.67/78495:37-6/;<-/37 1230 ,4.0,5,.67/78495:37-6/;<-/37
496496

Proceedings in Finance and Risk Perspectives`12
ACRN Cambridge Publishing House
ISBN: 978-3-9503518-0-4
19
Figure 14: Correlation between Euribor and retail customer’s rate (Upper limit: none)
Would be interesting verifying the existence of a positive correlation between the attribute "be
partner” and the rate applied the customer. If confirmed, it means that we have created a
synthetic saving share because the shareholder obtains a greater yield in cash accounts. But, if
we can’t confirm this hypothesis, the liability-side β would be more worrisome, being
superior to the system average. Moreover, due to the considerable concentration level, it
would be opportune to move the liquidity risk on the market, inviting top customers to buy
our bonds on the market or preference shares (with a yield equal to the no-preference-share
plus one little percentage that is littler then cash account rate). This way would protect the
bank both from the liquidity risk and the interest rate one, allowing a greater level and
stability of the financial-margin interest.
Comparing the liability-side β of wholesale customers with the asset-side one we can infer
that this last one finances the liability concentration; covering the extra yield recognized to
bigger customers. Would be useful verifying if these customers are shareholders. If so, the
remuneration (1.18 times the euribor rate) is acceptable and therefore the β value is an
appearance characteristic of the bank’s business model.
!""#$%&'(')*%+,+#
-.+/01
2#3/01
4.$/01
5"$/01
4.6/01
-7+/01-7&/01
578/01
9#"/01:;)/01
<,=/01>#;/01
-.+/?02#3/?0
4.$/?0
5"$/?0
4.6/?0
-7+/?0-7&/?0
578/?0
9#"/?0
:;)/?0
<,=/?0>#;/?0
-.+/??2#3/??
4.$/??
5"$/??
4.6/??
6%@%0ABBCBD%E%0A00?F
GH%@%0AICIF
0A00 J
0AB0 J
?A00 J
?AB0 J
CA00 J
0ACB J 0AB0 J 0AIB J ?A00 J ?ACB J ?AB0 J ?AIB J CA00 J CACB J
!"#$%&'()#*(+$'
,*&%-$.*'"(/0%(
1/+0/2/$3*#/4'*5 ('$+/2*#'(/'#*
K7L),(#$ML%$.)# N'+#.$#%OK7L),(#$ML%$.)#P
497497
Beyond Stress Testing: Modelling Liquidity and Interest Rate Risks for (real) Corporate
Measures
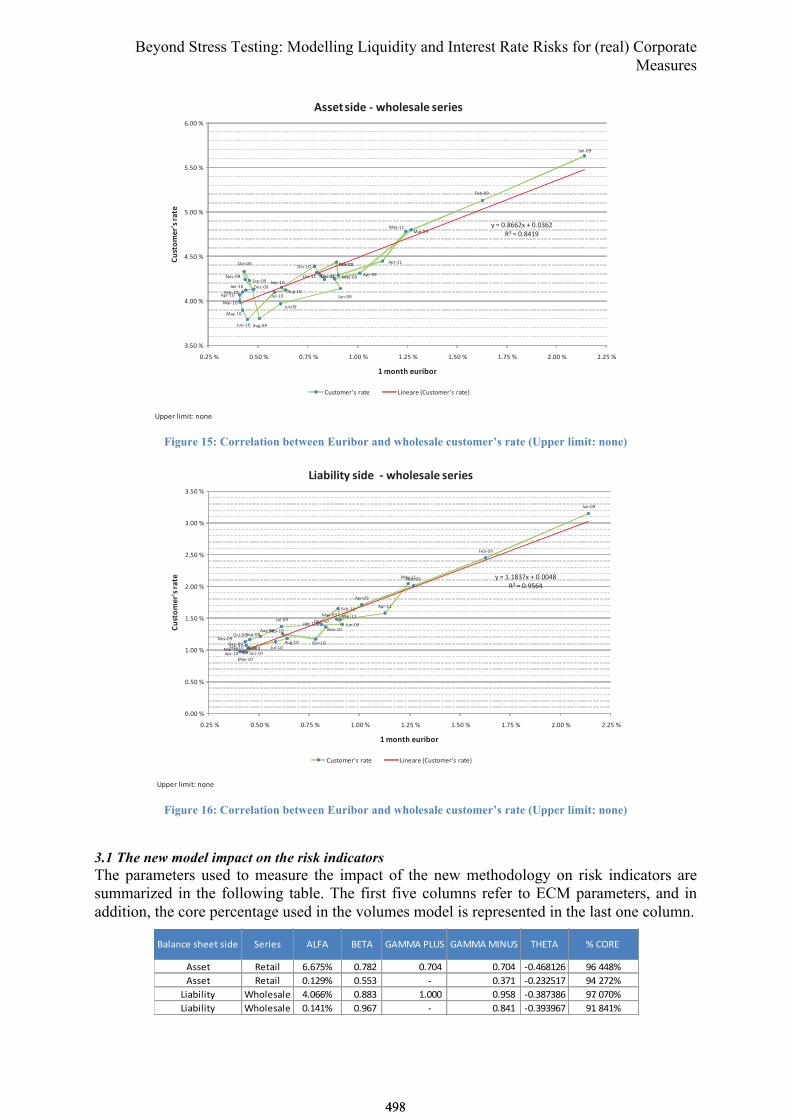
Figure 15: Correlation between Euribor and wholesale customer’s rate (Upper limit: none)
Figure 16: Correlation between Euribor and wholesale customer’s rate (Upper limit: none)
3.1 The new model impact on the risk indicators
The parameters used to measure the impact of the new methodology on risk indicators are
summarized in the following table. The first five columns refer to ECM parameters, and in
addition, the core percentage used in the volumes model is represented in the last one column.
!""#$%&'(')*%+,+#
-.+/01
2#3/01
4.$/01
5"$/014.6/01
-7+/01
-7&/01
578/01
9#"/01
:;)/01
<,=/01
>#;/01-.+/?0
2#3/?0
4.$/?0
5"$/?0
4.6/?0
-7+/?0
-7&/?0578/?0
9#"/?0
:;)/?0
<,=/?0>#;/?0-.+/??
2#3/??4.$/??5"$/??
4.6/?? 6%@%0ABCCDE%F%0A0GCD
HI%@%0ABJ?1
GAK0 L
JA00 L
JAK0 L
KA00 L
KAK0 L
CA00 L
0ADK L 0AK0 L 0AMK L ?A00 L ?ADK L ?AK0 L ?AMK L DA00 L DADK L
!"#$%&'()#*(+$'
,*&%-$.*'"(/0%(
1##'$*#/2'*3 4.%5'#+5'*#'(/'#
N7O),(#$PO%$.)# Q'+#.$#%RN7O),(#$PO%$.)#S
!""#$%&'(')*%+,+#
-.+/01
2#3/01
4.$/01
5"$/01
4.6/01
-7+/01-7&/01
578/019#"/01:;)/01
<,=/01>#;/01
-.+/?02#3/?04.$/?05"$/?0
4.6/?0
-7+/?0
-7&/?0578/?0
9#"/?0
:;)/?0
<,=/?0
>#;/?0-.+/??
2#3/??
4.$/??
5"$/??
4.6/?? 6%@%?A?BCDE%F%0A00GB
HI%@%0A1JKG
0A00 L
0AJ0 L
?A00 L
?AJ0 L
MA00 L
MAJ0 L
CA00 L
CAJ0 L
0AMJ L 0AJ0 L 0ADJ L ?A00 L ?AMJ L ?AJ0 L ?ADJ L MA00 L MAMJ L
!"#$%&'()#*(+$'
,*&%-$.*'"(/0%(
1/+0/2/$3*#/4'**5 6.%2'#+2'*#'(/'#
N7O),(#$PO%$.)# Q'+#.$#%RN7O),(#$PO%$.)#S
!"#"$%&'()&&*'(+,& -&.+&( /01/ !23/ 4/55/'607- 4/55/'5897- 3:23/ ;'<=>2'
/((&* >&*"+# ?@?AB; C@ADE'''' C@ACF'''''''''''''''' C@ACF'''''''''''''''''''' GC@F?DHE? I?@ FFD;
/((&* >&*"+# C@HEI; C@BBJ'''' G'''''''''''''''''''' C@JAH'''''''''''''''''''' GC@EJEBHA IF@ EAE;
0+"K+#+*L M)N#&("#& F@C??; C@DDJ'''' H@CCC'''''''''''''''' C@IBD'''''''''''''''''''' GC@JDAJD? IA@ CAC;
0+"K+#+*L M)N#&("#& C@HFH; C@I?A'''' G'''''''''''''''''''' C@DFH'''''''''''''''''''' GC@JIJI?A IH@ DFH;
498498
Proceedings in Finance and Risk Perspectives`12
ACRN Cambridge Publishing House
ISBN: 978-3-9503518-0-4
21
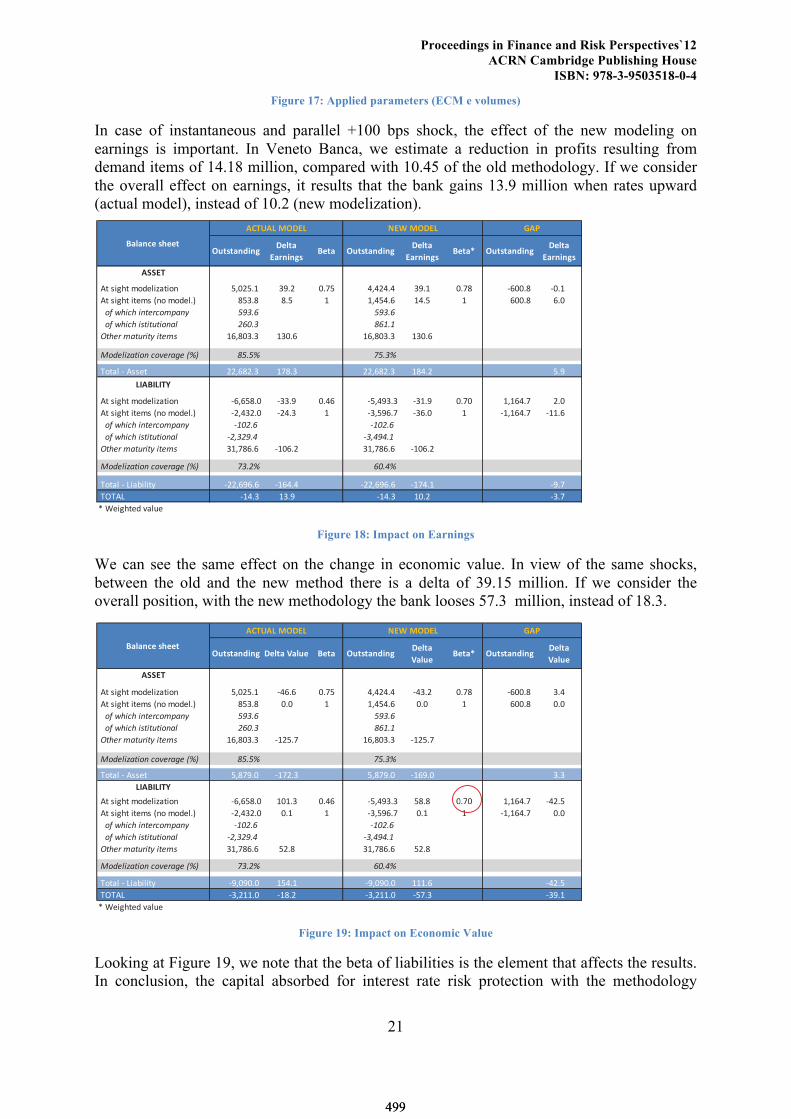
Figure 17: Applied parameters (ECM e volumes)
In case of instantaneous and parallel +100 bps shock, the effect of the new modeling on
earnings is important. In Veneto Banca, we estimate a reduction in profits resulting from
demand items of 14.18 million, compared with 10.45 of the old methodology. If we consider
the overall effect on earnings, it results that the bank gains 13.9 million when rates upward
(actual model), instead of 10.2 (new modelization).
Figure 18: Impact on Earnings
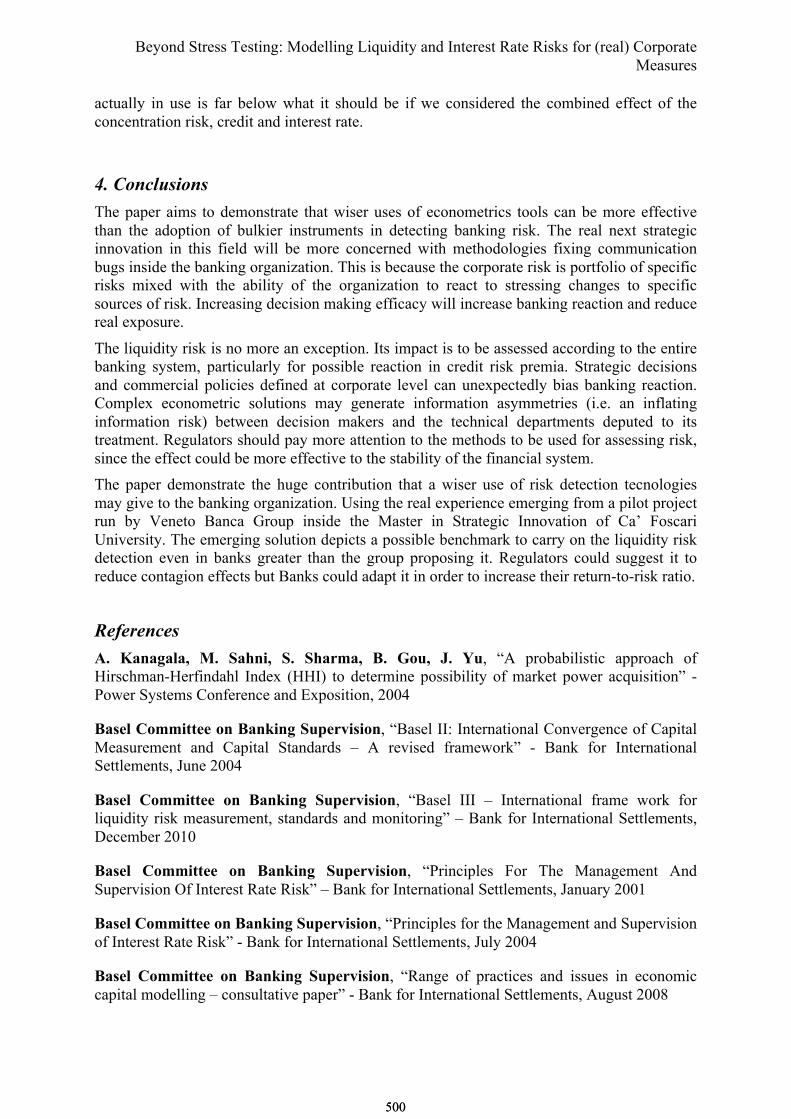
We can see the same effect on the change in economic value. In view of the same shocks,
between the old and the new method there is a delta of 39.15 million. If we consider the
overall position, with the new methodology the bank looses 57.3 million, instead of 18.3.
Figure 19: Impact on Economic Value
Looking at Figure 19, we note that the beta of liabilities is the element that affects the results.
In conclusion, the capital absorbed for interest rate risk protection with the methodology
!"#$#%&'(&)*+,#%-
.%/&(&)$-0+#% !"#$#%&'(&)
*+,#%-
.%/&(&)$-0+#%1 !"#$#%&'(&)
*+,#%-
.%/&(&)$-
233.4
!"#!$%&'#!()*+,%-.#%)/ 0123045!!!!!!!! 6743 2480 9193949!!!!!!!!!! 6745 248: ;<224: ;245
!"#!$%&'#!%#+($!=/)!()*+,4> :064:!!!!!!!!!!! :40 5 519094<!!!!!!!!!! 5940 5 <224: <42
!!!"#!$%&'%!&()*+'",-.(/ 01234!!!!!!!!!!! 01234!!!!!!!!!!!!
!!!"#!$%&'%!&5)&)6)&"(.7 84932!!!!!!!!!!! :4;3;!!!!!!!!!!!!
!<)%*+!,.)6+&)/!&)*,5 5<1:2646!!!!!! 5624< 5<1:2646!!!!!!!! 5624<
!=">*7&?.)&"(!'"@*+.A*!BCD :030C E032C
!?)#.,!;!"$$+# 331<:346!!!!!! 58:46 331<:346!!!!!!!! 5:943 047
562065647
!"#!$%&'#!()*+,%-.#%)/ ;<1<0:42 ;6647 249< ;0197646 ;6547 2482 515<948 342
!"#!$%&'#!%#+($!=/)!()*+,4> ;3196342 ;3946 5 ;6107<48 ;6<42 5 ;515<948 ;554<
!!!"#!$%&'%!&()*+'",-.(/ F;9834! F;9834!
!!!"#!$%&'%!&5)&)6)&"(.7 F8G2813H! F2GH1H3;!
!<)%*+!,.)6+&)/!&)*,5 6518:<4<!!!!!! ;52<43 6518:<4<!!!!!!!! ;52<43
!=">*7&?.)&"(!'"@*+.A*!BCD E238C 493HC
!?)#.,!;!@%.A%,%#B ;331<7<4<! ;5<949 ;331<7<4<! ;58945 ;748
!?C?"@ ;5946! 5647 ;5946! 5243 ;648
D!E+%&'#+*!F.,G+
0%,%&8+-$9++#
2:4;25-<!*.5 =.>-<!*.5 ?2@
!"#$#%&'(&) *+,#%-.%,"+ /+#% !"#$#%&'(&)*+,#%-
.%,"+/+#%0 !"#$#%&'(&)
*+,#%-
.%,"+
12234
!"#!$%&'#!()*+,%-.#%)/ 0123045!!!!!!!! 67848 2490 7173747!!!!!!!!!! 67:43 249; 68224; :47
!"#!$%&'#!%#+($!</)!()*+,4= ;0:4;!!!!!!!!!!! 242 5 5170748!!!!!!!!!! 242 5 8224; 242
!!!"#!$%&'%!&()*+'",-.(/ 01234!!!!!!!!!!! 01234!!!!!!!!!!!!
!!!"#!$%&'%!&5)&)6)&"(.7 84932!!!!!!!!!!! :4;3;!!!!!!!!!!!!
!<)%*+!,.)6+&)/!&)*,5 581;2:4:!!!!!! 653049 581;2:4:!!!!!!!! 653049
!=">*7&?.)&"(!'"@*+.A*!BCD :030C E032C
!>)#.,!6!"$$+# 01;9?42!!!!!!!! 65934: 01;9?42!!!!!!!!!! 658?42 :4:
561/65647
!"#!$%&'#!()*+,%-.#%)/ 68180;42 5254: 2478 6017?:4: 0;4; 2492 5158749 67340
!"#!$%&'#!%#+($!</)!()*+,4= 6317:342 245 5 6:10?849 245 5 65158749 242
!!!"#!$%&'%!&()*+'",-.(/ F;9834! F;9834!
!!!"#!$%&'%!&5)&)6)&"(.7 F8G2813H! F2GH1H3;!
!<)%*+!,.)6+&)/!&)*,5 :519;848!!!!!! 034; :519;848!!!!!!!! 034;
!=">*7&?.)&"(!'"@*+.A*!BCD E238C 493HC
!>)#.,!6!@%.A%,%#B 6?12?242! 50745 6?12?242! 55548 67340
!>C>"@ 6:135542! 65;43 6:135542! 6094: 6:?45
D!E+%&'#+*!F.,G+
184915-:!*35 ;3<-:!*35 =1>
/%,%&?+-$@++#
2492
5
499499
Beyond Stress Testing: Modelling Liquidity and Interest Rate Risks for (real) Corporate
Measures
actually in use is far below what it should be if we considered the combined effect of the
concentration risk, credit and interest rate.
4. Conclusions
The paper aims to demonstrate that wiser uses of econometrics tools can be more effective
than the adoption of bulkier instruments in detecting banking risk. The real next strategic
innovation in this field will be more concerned with methodologies fixing communication
bugs inside the banking organization. This is because the corporate risk is portfolio of specific
risks mixed with the ability of the organization to react to stressing changes to specific
sources of risk. Increasing decision making efficacy will increase banking reaction and reduce
real exposure.
The liquidity risk is no more an exception. Its impact is to be assessed according to the entire
banking system, particularly for possible reaction in credit risk premia. Strategic decisions
and commercial policies defined at corporate level can unexpectedly bias banking reaction.
Complex econometric solutions may generate information asymmetries (i.e. an inflating
information risk) between decision makers and the technical departments deputed to its
treatment. Regulators should pay more attention to the methods to be used for assessing risk,
since the effect could be more effective to the stability of the financial system.
The paper demonstrate the huge contribution that a wiser use of risk detection tecnologies
may give to the banking organization. Using the real experience emerging from a pilot project
run by Veneto Banca Group inside the Master in Strategic Innovation of Ca’ Foscari
University. The emerging solution depicts a possible benchmark to carry on the liquidity risk
detection even in banks greater than the group proposing it. Regulators could suggest it to
reduce contagion effects but Banks could adapt it in order to increase their return-to-risk ratio.
References
A. Kanagala, M. Sahni, S. Sharma, B. Gou, J. Yu, “A probabilistic approach of
Hirschman-Herfindahl Index (HHI) to determine possibility of market power acquisition” -
Power Systems Conference and Exposition, 2004
Basel Committee on Banking Supervision, “Basel II: International Convergence of Capital
Measurement and Capital Standards – A revised framework” - Bank for International
Settlements, June 2004
Basel Committee on Banking Supervision, “Basel III – International frame work for
liquidity risk measurement, standards and monitoring” – Bank for International Settlements,
December 2010
Basel Committee on Banking Supervision, “Principles For The Management And
Supervision Of Interest Rate Risk” – Bank for International Settlements, January 2001
Basel Committee on Banking Supervision, “Principles for the Management and Supervision
of Interest Rate Risk” - Bank for International Settlements, July 2004
Basel Committee on Banking Supervision, “Range of practices and issues in economic
capital modelling – consultative paper” - Bank for International Settlements, August 2008
500500
Proceedings in Finance and Risk Perspectives`12
ACRN Cambridge Publishing House
ISBN: 978-3-9503518-0-4
23
Comptroller’s Handbook, “Interest Rate Risk” – Comptroller of The Currency
Administrator of National Banks, Narrative June 1997 and Procedures March 1998
David M. Wright e James V. Houpt, Leeto Tlou e Jonathan Hacker, “An analysis of
commercial bank exposure to interest rate risk”- Federal Reserve Bulletin, February 1996
Donald R. Fraser, Jeff Madura and Robert A. Weigand, “Sources of Bank Interest rate
risk” - The financial review 37 (2002) 351 – 368
Giovanni dell’Ariccia and Robert Marquez, “Risk and the Corporate Structure of Banks” -
Journal of finance, Vol. LXV, n°3. June 2010
J. Duan, C.W. Sealey e Y. Yan, “Managing banks' duration gaps when interest rates are
stochastic and equity has limited liability” - International Review of Economics and Finance,
n°8, 1999
James H. Stock and Mark W. Watson, “Introduction to econometrics” – Pearson
Education, July 2005
Jeff Madura e Emilio R. Zarruk, “Bank exposure to interest rate risk: a global perspective”
- The Journal of Financial Research, Vol. XVIII n°1, 1995
Jose A. Lopez, “Supervision interest rate risk management” - FRBSF Economic Letter,
n°2004-26, September 17, 2004
Mary E. Barth, Leslie D. Hodder e Stephen R. Stubben, “Fair value accounting for
liabilities and own credit risk” - The Accounting Review, Vol. 83, n°3, 2008
Oliver Entrop, Marco Wilkens e Alexander Zeisler, “Quantify the interest rate risk of
banks” - European Financial Management, Vol. 15, n°5, 2009
Piergiorgio Alessandri and Mathias Drehmann, “An economic capital model integrating
credit and interest rate risk in the banking book” - ECB Working Paper no. 1041, April 2009
Piergiorgio Alessandri e Mathias Drehmann, “An economic capital model integrating
credit and interest rate risk in the banking book” – Bank of England, Summary of working
paper n°388, June 2010
Robert F. Engle and C. W. J. Granger, “Co-Integration and Error Correction:
Representation, Estimation and Testing” – Econometrica, Vol. 55, No. 2, 251 – 276, March
1987
Weitzu Chen, Chi-Chun Liu e Stephen G. Ryan, “Characteristics of securizations that
determine Issuers' retention of the risk of the securitized assets” - The Accounting Review,
Vol. 83 n°5, 2008
501501