Embed Size (px)
Citation preview

Acta Geophysica vol. 64, no. 6, Dec. 2016, pp. 2356-2381
DOI: 10.1515/acgeo-2016-0116
________________________________________________ Ownership: Institute of Geophysics, Polish Academy of Sciences; © 2016 Wawrzyniak-Guz. This is an open access article distributed under the Creative Commons Attribution-NonCommercial-NoDerivs license, http://creativecommons.org/licenses/by-nc-nd/3.0/.
Acoustic Full Waveforms as a Bridge between Seismic Data and Laboratory Results
in Petrophysical Interpretation
Kamila WAWRZYNIAK-GUZ
AGH University of Science and Technology, Faculty of Geology, Geophysics and Environmental Protection, Department of Geophysics,
Kraków, Poland; e-mail: [email protected]
A b s t r a c t
Mutual relationships between geological and geophysical data ob-tained by using methods of different scale are presented for the Miocene sandy-shaly thin-bedded formation and for the Zechstein carbonate for-mation. The common basis of laboratory results, well logging and seis-mic data was a recognition of elastic and reservoir properties of rocks. The common basis of laboratory results, well logging and seismic data were elastic and reservoir properties of rocks. Seismic attributes calcu-lated from acoustic full waveforms were a link between the considered data. Seismic attributes strongly depend on small changes observed in rock formation related to lithology variations, facies changes, structural events and petrophysical properties variability. The observed trends and relationships of high correlation coefficients in the analysed data proved the assumption made at the beginning of research that common physical basis is a platform for data scaling. Proper scaling enables expanding the relationships determined from laboratory and well logging of petrophysi-cal parameters to a seismic scale.
Key words: seismic attributes, acoustic full waveforms, elastic proper-ties of rocks, upscaling.

AWF – A BRIDGE BETWEEN SEISMIC AND LABORATORY DATA
2357
1. INTRODUCTION Successful combination of seismic data and well logging information that includes the results of laboratory experiments is an important way of scaling petrophysical parameters. Since the acoustic log is run in boreholes, seismic sections are correctly converted from time to depth scale with the use of ve-locity models based on well logging measurements. Similarly, seismic inver-sion that provides acoustic pseudoimpedance sections belongs to the methods which combine well logs and seismic data (Veeken and Da Silva 2004, Huuse and Feary 2005). Results of laboratory measurements, in par-ticular velocity and bulk density, can also be included in seismic calibration procedures.
Laboratory data are the results of direct measurements of rock properties that are performed on the core or plug samples, sparsely taken from the borehole. They are precise and accurate but related to very small portion of rocks, and therefore they are considered as point-type data. Well logs are recorded continuously along the borehole and can be regarded as a 1D measurement, while seismic surveys represent 2D or 3D data sets. Different vertical resolution of these methods makes proper joint interpretation diffi-cult. Scale dependence of geophysical data is an important and still current challenge for geophysicists and petrophysicists in precise determination of rock formation properties (Pechnig et al. 1997, Zoback 2010, Bui et al. 2010, Wenlong et al. 2012, Marzec et al. 2014, Krakowska and Puskarczyk 2015).
Measurements of the physical properties of rocks in the boreholes are recorded by many different logs, which is a characteristic feature of well logging. There are a lot of well established processing and interpretation procedures that are implemented in the commercial software and applica-tions. However, vast and diverse information on geological, petrophysical and reservoir properties of rocks encourage scientists to looking for a new method or improving the existing processing and interpretation methods. Well logging data are suitable for statistical approach � there are many pa-pers that propose application of various statistical methods for enhanced in-terpretation (e.g., Szabó 2011, ElGhonimy and Sonneneberg 2015, Puskarczyk et al. 2015, Wawrzyniak-Guz et al. 2016). The other way of up-dating the interpretation process, especially in today’s more complex for-mations, is adapting techniques known from other methods, as presented in this paper. Technique of seismic attributes computation was adapted for raw acoustic waveform data processing. The new acoustic logging algorithm was the key part of the research.
This paper proposes combination of data from laboratory experiments, well logging and seismic surveys by means of full waveform acoustic log.

K. WAWRZYNIAK-GUZ
2358
Elastic properties and elastic wave propagation phenomena considered at each type of data were the common platform for coupling the information acquired at various scales. Acoustic full waveforms (AFW) were processed in commercial software just like seismic traces, and then seismic-origin at-tributes were calculated. Seismic attributes reflect instantaneous characteris-tics related to small changes of rock properties or small-scale tectonic events (Chopra and Marfurt 2005). Similarly, instantaneous characteristics of AFW are the response to small differences in rock formation (Knize 1989, Wawrzyniak-Guz and Jarzyna 2012, Wawrzyniak-Guz and Gruszczyk 2013). Due to distinct differences in seismic and sonic wave frequency and the other scale of inhomogeneity recognized by both methods, AFW attrib-utes are not exact equivalents of seismic attributes. Nonetheless, attributes applied to AFW enable the interpreters to take advantage of the same physi-cal background of sonic logs and seismics and, at the same time, to get clos-er to the scale of laboratory results than if they work with the primarily recorded signals only.
2. GEOLOGICAL FORMATIONS SELECTED FOR METHODOLOGY TESTS
Formations from two different geological units in Poland were selected for investigation: the Miocene (Sarmatian) formations in the Carpathian Fore-deep and the Main Dolomite in the Fore-Sudetic Monocline. Three major conditions were taken into consideration to accept the region for the planned works: (i) good quality 3D seismic survey; (ii) full wave sonic logs (i.e., acoustic full waveforms) recorded in the wells within the area of seismic survey; and (iii) great variety of laboratory results in the cored intervals of wells within the area of seismic survey, in particular P- and S-wave veloci-ties.
The first region of research is located in the area of the Carpathian Foredeep (Fig. 1). The TCZ 3D seismic survey was done in the investigated area where C-2, C-3, C-5K, and M-1 wells were available (Fig. 2a). Re-search was focused on the Miocene part of the deposit in C-2, C-3, and C-5k wells and additional working material was included from M-1 well where acoustic full waveforms were recorded only in the carbonates of the Carbon-iferous basement. Intergranular porosity and high shale volume are typical features of the Sarmatian sandy-shaly thin-bedded formation (Ba�a et al. 2012, Jarzyna et al. 2013). A comprehensive data interpretation coming from various sources (seismics, well logging and laboratory experiments) is very important in thinly-bedded formations like heterolithes in molasse basins in the mountain foredeeps. The Miocene sediments in the Polish part of the Carpathian Foredeep are a good example of such formations (Marzec and Pietsch 2012, Pietsch et al. 2007). Sandy-shaly thin-bedded Miocene succes-

AWF – A BRIDGE BETWEEN SEISMIC AND LABORATORY DATA
2359
Fig. 1. Study areas on the background of main geological units in Poland.
Fig. 2. Study areas: wells location on the background of selected Xline and Inline of TCZ 3D (a) and OR 3D (b) seismic projects.

K. WAWRZYNIAK-GUZ
2360
sions, where pore-space is occupied by gas in sandstone layers (treated as reservoirs) and in mudstone layers (considered as source rocks), are very dif-ficult to resolve because the thickness of both types of layers is very small; it ranges from several to dozens of centimetres. Small gas deposits identified by seismic surveys confirmed by well logs are very frequent in that region. Unfortunately, as often, there are boreholes without gas inflow drilled after seismic interpretation, despite similar stratigraphic and sedimentary posi-tions. Unconventional shale gas deposits are similar to the discussed thin-bedded formations.
The second subject of investigation was the OR 3D seismic project where three wells: O-1, R-3, and R-4k were located in the study area (Figs. 1 and 2b). Full wave sonic logs covered the sequence of the Zechstein evapo-rates and carbonate sediments, including the Main Dolomite horizon. Addi-tional C-1 well from the Polish Lowland (Fig. 1) was also included in research where the AFW were available in the Main Dolomite section. The Main Dolomite (Ca2) is a very important geological formation in hydrocar-bon prospecting in the Polish Lowland and Fore-Sudetic Monocline. Within this dolomitic formation, formed on the carbonate-anhydrite platform, the biggest hydrocarbon deposits in the Polish Lowland were discovered. The Main Dolomite horizon is about 40-90 m thick and in many wells it may be divided into three different parts with regard to porosity and shale content. The upper part of the Main Dolomite horizon is always the most porous, the middle one is hard and of low porosity and low shaliness. The lowest part covers relatively shaly section. The dolomitic horizon reveals intergranular porosity as well as fractures and fissures which are frequently observed.
3. ACOUSTIC FULL WAVEFORM (AFW) ATTRIBUTES Acoustic full waveforms are elastic wavefield recordings that are generated in the borehole by the transmitter in a sonic tool. Monopole source develops both body and surface waves, i.e., P (compressional), S (shear) and Stoneley (surface) waves. Processing of AFW can include some seismic procedures, such as seismic attributes calculation, since sonic logs and seismics are based on the same physical phenomenon � elastic wavefield.
Seismic attributes were previously incorporated into AFW interpretation, however they were mainly considered as a visual enhancement of qualitative approach (Ba�a and Jarzyna 1996). In the presented paper, numerical values of attributes were determined for quantitative interpretation. The results were applied to combine acoustic wavefield (represented by AFW recorded in borehole) with seismic wavefield (recorded on the surface). Seismic attrib-utes were treated as a link between these two representations of elastic wavefields. AFW were also the connection between well logging and labora-

AWF – A BRIDGE BETWEEN SEISMIC AND LABORATORY DATA
2361
Fig. 3. AFW from C-1 well loaded to seismic software. Horizontal axis represents logging depth (MD) in meters (multiplied by factor 100), vertical axis represents re-cording time of AFW in As. Colour lines indicate arrival (_START) and end (_STOP) time of P, S, and Stoneley (St) wave packets. Na2 – Older Halite, A2 – Ba-sal Anhydrite, Ca2 – Main Dolomite, A1G – Upper Anhydrite.
tory results. AFW attributes were related to small changes of physical prop-erties of rock and reflected instantaneous characteristics of formation.
Seismic attributes for P, S, and Stoneley waves were calculated with the use of standard seismic software: Hampson-Russell Suite, version 9. An ex-ample of AFW recorded in the Zechstein formations: salts (Na2), anhydrites (A2 and A1G), and carbonates (Ca2) in the Polish Lowland is presented in Fig. 3. Data were recorded by Full Wave Sonic tool (Halliburton Co.).
4. METHODOLOGY AND EXAMPLES Calculation of attributes from AFW required special preprocessing of full waveform sonic logs that enabled loading AFW signals into the seismic software just like any other seismic section. It included, inter alia, file format conversion and editing the file headers. Once the preprocessing was com-pleted, the attributes could be computed with the use of algorithms available in the seismic program, such as instantaneous or windowed attributes. Scheme of the methodology is presented on the basis of C-1 well in the Pol-ish Lowland; more details can be found in Wawrzyniak-Guz and Jarzyna (2012).
Recording time of AWF was presented on the vertical axis and the log-ging depth was on the horizontal axis (Figs. 3 and 4). Next, using the “pick-ing horizon” tool in the seismic software, the arrival time (_START) and the

K. WAWRZYNIAK-GUZ
2362
Fig. 4. Method of seismic attributes for AFW calculation. All attributes, calculated between the arrival and the end time of P, S, and Stoneley (St) waves, were averaged with arithmetic mean, median and root mean square (RMS). Here, examples of the amplitude of the envelope (Amp Env) for Stoneley (St) from C-1 well are presented.
end time (_STOP) of P, S, and Stoneley waves were pointed at every wave-form (Fig. 4). The end time was chosen arbitrarily; however, the idea was to include the main oscillations of the wave packets. The same phase of the signal was very carefully picked throughout the sections, similar to the phase correlation in picking horizons in seismics. Five seismic attributes for P, S, and Stoneley waves were calculated: Isochron (the time interval between _START and _STOP times) and the complex trace attributes (Taner et al. 1979): Amplitude Envelope, Instantaneous Frequency, Instantaneous Phase, and Cosine of Instantaneous Phase. Attributes were calculated only between _START and _STOP times for individual waves (i.e., between “horizons”), and then averaged using arithmetic mean, median, and root mean square (RMS). As a result, five seismic attributes for each P, S, and Stoneley wave were available for further analyses. Additional processing allowed to present these attributes as the standard well logs, i.e., they showed how the attributes changed with depth (Figs. 5-7). Results for C-1 well are presented in Fig. 5. Significant changes of the attributes versus depth related to fluctuations in mineral composition (admixture of anhydrite is one of the most substantial in

AWF – A BRIDGE BETWEEN SEISMIC AND LABORATORY DATA
2363
Fig. 5. Seismic attributes computed for AFW in C-1 well, Polish Lowland. The scales of the attributes are adjusted for better visualisation and curve separation. Here, only results of RMS averaging of the Amplitude Envelope (Amp Env), Instan-taneous Frequency (Inst Freq), and Cosine of Instantaneous Phase (Cos Inst Ph) are presented.
this case), porosity, and water/hydrocarbon saturation are distinctly visible. For example, anhydrite contribution significantly amplifies amplitudes of Stoneley waves, whereas an increase of porosity lengthens the time span of all waves expressed by the Isochron attribute. Calculated attributes are vul-nerable to unwanted logging effects and errors. For instance, artificial ampli-fication of S wave between 3014-3027 m had a harmful effect on the Amplitude Envelope and the Instantaneous Frequency (S Amp Env and S Inst Freq, respectively) (Fig. 5).
AFW attributes, with the use of the developed methodology, were com-puted for the sandy-shaly thin bedded Miocene formation in C-2 well (Fig. 6) and for carbonates of the Carboniferous basement in M-1 well (Fig. 7). The amplitude Envelope of P, S, and Stoneley waves represent wave amplitudes, and Instantaneous Frequency informs about the frequency of the particular waves.

K. WAWRZYNIAK-GUZ
2364
Fig. 6. Attributes calculated from acoustic waveforms and from seismic data in C-2 well, Carpathian Foredeep. AE � Amplitude Envelope; IF � Instantaneous Frequen-cy; P, S, St � indicate compressional, shear and Stoneley waves, respectively; _1_U suffix means upscaled data; SEIS � seismic trace, QT_Imp, Integrate_Imp, Square_Imp, FreqDom_Seis, Log_Imp are seismic attributes (explanations are in the text); DTM and GR are sonic and gamma ray logs.
Well log vertical resolution is much greater than seismic data, so it was necessary to upscale the attributes calculated from AFW to the seismic wavelength. Running average was applied to each attribute. The averaging window length (L) used in this study was determined on the basis of Backus theory and the method proposed in the paper of Liner and Fei (2006): L = VSV
(min)/N·Fdom, where VSV(min) is the minimum S-wave velocity derived from
sonic log (from the standard interpretation of full wave sonic log), Fdom is the dominant frequency of seismic data, here taken from the seismic attribute FreqDom_Seis (Fig. 6), and N is a positive integer to be chosen; N = 3 gives a reasonable level of accuracy that preserves essential part of the seismic wavefield (Liner and Fei 2007).
Applying the Backus theory was justified here because the Miocene for-mations in the Carpathian Foredeep exhibit thin layering. Similarly, limestones in Carboniferous basement reveal layer-induced seismic anisot-ropy (VTI anisotropy). Hence, the attributes were upscaled to seismic wave-length with 13-m and 28.5-m averaging window in C-2 and in M-1 well, respectively (Figs. 6 and 7).

AWF – A BRIDGE BETWEEN SEISMIC AND LABORATORY DATA
2365
Fig. 7. Attributes calculated from acoustic waveforms and from seismic data in M-1 well, Carpathian Foredeep. Explanations are the same as in Fig. 6.
5. SEISMIC ATTRIBUTES There are plenty of attributes that can be calculated from seismic signals (e.g., Taner et al. 1979, Chopra and Marfurt 2005). Seismic attributes are usually applied to qualitative seismic interpretation, aimed to recognize geo-logical structures, sedimentation environment and water/hydrocarbon satura-tion. Selected sets of seismic attributes can be also used for well log data prediction (Schultz et al. 1994a, b; Ronen et al. 1994). Similar approach was proposed in this research. Two logs � sonic and gamma � ray were chosen as the representatives of elastic properties (DT) and lithology features (GR) of the investigated formations. Several seismic attributes were calculated at well locations on the basis of standard seismic traces, traces after spectral decompositions, and acoustic impedance traces (Wawrzyniak-Guz and Gruszczyk 2013). The set of best-fitted attributes were chosen with the use of multi-linear regression. Calculations were done for wells located in the area of TCZ 3D seismic survey. Though the prediction was made in the sandy-shaly Miocene formation (Fig. 8), the attributes were calculated over the whole time interval of seismic data. The attributes were later converted to depth domain and presented in well logging data manner along with AFW attributes. The complete set of attributes for DT prediction was as follows: Quadrature Trace (from impedance traces), QT_Imp; Dominant Frequency (from seismic traces), FreqDom_Seis; Integrate (from impedance traces), In-tegrate_Imp; and Square (from impedance traces), Square_Imp. For GR pre-diction, the following groups of attributes were chosen: Average Frequency

K. WAWRZYNIAK-GUZ
2366
Fig. 8. Results of acoustic log prediction on the basis of seismic attributes in the Mi-ocene formations, Carpathian Foredeep.
(from spectral decomposition 60Hz traces), AveFreq_Dekomp60; Logarithm (from impedance traces), Log_Imp; and Integrate (from impedance traces). Results are presented in Figs. 6 and 7. These attributes were later combined with attributes from AFW. The same procedures were applied to data from OR 3D seismic project.
6. RELATIONSHIPS BETWEEN SEISMIC DATA, WELL LOGS AND LABORATORY INFORMATION
Dozens of relationships between seismic data, well logging results and labo-ratory parameters were tested to illustrate the mutual dependence of petro-physical properties determined from different methods. The most important ones were these including reservoir properties and elastic parameters since these parameters were considered as the common platform for comparisons. Results of laboratory experiments and well logging data (measurements and interpretation) were inspected by cross-plots and correlations. Similarly, re-lationships between well logs and variety of seismic parameters were sought. Also, the selected seismic attributes were joined with laboratory results. From a great number of relationships that were examined, several distinct examples were selected for illustration of the results.
7. RESULTS OF SEISMIC INVERSION INCLUDING LABORATORY P-WAVE VELOCITY
Fragments of TCZ 3D seismic survey (Carpathian Foredeep) were used for seismic inversion based on geological model. The inversion was computed in the vicinity of M-1, C-2, C-3, and C-5k wells. Input data, which were used for geological model construction, were composed of the P-wave impedance

AWF – A BRIDGE BETWEEN SEISMIC AND LABORATORY DATA
2367
Fig. 9. Velocity models prepared for seismic calibration from time to depth on the basis of well log data only (model I – Track 1) and including laboratory results into well logs (model II – Track 2). Red dots present depth of core samples for laboratory measurements. Explanation of formation tops: C1vi � top of Visean; C1t � top of Tournaisian; D3 � top of Late Devonian; D1 � top of Early Devonian.

K. WAWRZYNIAK-GUZ
2368
Fig. 10. Result of seismic inversion in the pseudoimpedance version using velocity models I and II. Curves inserted into well location are P-Imp_log and P-Imp_lab_log, respectively. Explanation of formation tops: M_a, M_b, M_c � lithostratigraphic horizons within the Miocene formation; C1vi � top of Visean; C1t � top of Tournaisian; D3 � top of Late Devonian; D1 � top of Early Devonian; Pr � top of Precambrian basement.
curve calculated from sonic and density logs, and previously interpreted seismic horizons. For the M-1 well, a set of laboratory measurements of P-wave velocity and bulk density was available. Including laboratory data in the inversion was advisable for proper combining data acquired at different scales.
In the M-1 well, primary velocity model (model I) was built with the use of logs only. Then, it was modified to model II by including P-wave velocity values from laboratory experiments (Fig. 9). Pseudoimpedance sections pre-sented in Fig. 10 were the results of seismic inversion based on models I and II calculated around M-1 well. In the Sarmatian sediments, the inversion based on model II revealed some layers of higher values of pseudo-impedance in comparison to results obtained with model I. More yellow col-

AWF – A BRIDGE BETWEEN SEISMIC AND LABORATORY DATA
2369
oured beds are visible in the upper fragment of the profile, where shaly-sandy sediments are water saturated. In the lower sections of the geological profile (below 1941.5 m), pseudoimpedance from model II is lower than from model I. This interval is composed of Carboniferous and Devonian rocks, including sandstones and carbonates. More blue coloured beds are visible in that section of profile, which means lower impedance. Acoustic impedance from seismic inversion is not simply related only to bed veloci-ties but also depends on reflection coefficients at the seismic boundaries. Thus, the interpretation of results presented in Fig. 10a and b is rather quali-tative than quantitative.
Results of inversion based on model II shows slightly lower values in the depth intervals where lab data were included in comparison to P-impedance calculated from logs only (Fig. 11).
Fig. 11. P-impedance being the result of seismic inversion based on velocity model from logs and laboratory results (model II) versus P-impedance from well logs only.
Fig. 12. Interval transit time versus logarithm of absolute value of integral calculated from acoustic impedance (seismic attribute).

K. WAWRZYNIAK-GUZ
2370
The logarithm of the absolute value of the integral of acoustic impedance from seismic inversion (Log ABS (Integrate_Imp)) revealed a clear correla-tion with transit interval time (DT) from acoustic log (Fig. 12). Such strong relationship proves applying seismic attributes to determination P-wave ve-locity in the area covered by seismic surveys and can enhance the ability to obtain total porosity from seismic inversion.
8. RELATIONSHIPS BETWEEN DIFFERENT SCALE DATA Crossplots and relationships between parameters acquired at different scales: lab-log, log-seis, log-log, and lab-seis, were calculated in this study and sev-eral examples are presented in Figs. 13-22. Found correlations proved the as-sumption made at the beginning that the common physical background of
Fig. 13. S wave velocity versus P wave velocity – comparison of lab and well log (WL) data in R-3, R-4k, and O-1 wells for the Main Dolomite.
Fig. 14. Relationship between bulk density and P-wave velocity in M-1well for Mi-ocene formation.

AWF – A BRIDGE BETWEEN SEISMIC AND LABORATORY DATA
2371
Fig. 15. Amplitude Envelope of P and S wave ratio (from AFW) versus average fre-quency of impedance trace (from seismic inversion) in R-4k well. Data represent the Zechstein formation: the Main Dolomite (Ca2), anhydrites (A1G, A2), and salts (Na2).
Fig. 16. Instantaneous frequency of P and S waves ratio (from AFW) versus average frequency of spectral decomposition 30 Hz trace in R-4k well. Data represent the Zechstein formation: the Main Dolomite (Ca2), anhydrites (A1G, A2), and salts (Na2).
wave velocity measured in laboratory, by acoustic logs, and in seismics, i.e., elastic properties of rocks and elastic wavefield, could be successfully ap-plied to join and combine petrophysical information acquired at different scales.
Firstly, P and S wave velocities measured in the laboratory on rock sam-ples were compared with the velocities from acoustic full waveform logs (Fig. 13). Presented log data were chosen from the same depths as core and rock samples. The comparison reveals that the velocities cover the same

K. WAWRZYNIAK-GUZ
2372
Fig. 17. Poisson’s ratio (from well logging) versus instantaneous frequency of seis-mic trace in R-4k well. Data represent the Zechstein formation: the Main Dolomite (Ca2), anhydrites (A1G, A2).
Fig. 18. Poisson’s ratio (from well logging) versus instantaneous frequency of P and S wave ratio (from AFW) in R-4k well. Data represent the Zechstein formation: the Main Dolomite (Ca2), anhydrites (A1G, A2).
range of values and lie along the same trend; however, the lab velocities are a bit higher than those from the logs. This is the result of higher frequency of elastic waves induced by transducers in laboratory tests (order of MHz) than the wave frequency used in well logging (order of kHz). Correlation proves the consistency of elastic properties of rocks at different scales and justifies further analyses.
Relationship between bulk density and P-wave velocity in M-1 well (Fig. 14) shows two separate groups of data. Laboratory data have lower values than well logging results, but the general trend is similar. This is caused by both geological and technical reasons. The geological reason of

AWF – A BRIDGE BETWEEN SEISMIC AND LABORATORY DATA
2373
Fig. 19. Permeability of the Main Dolomite calculated from well logs with Zawisza formula (Zawisza 1993) versus amplitude envelope of Stoneley wave from AFW in R-3 well.
Fig. 20. Permeability of the Main Dolomite calculated from well logs with Zawisza formula (Zawisza 1993) versus product of Stoneley wave velocity and bulk density (from well logs) in R-4k well.
such results is related to thinly-bedded formation, consisted of sandstones characterized by higher values of velocity and bulk density, and shales that have lower values of these parameters. The technical reason is related to the limited vertical resolution of logs in comparison to point laboratory results.
Relationships between well log parameters and the results of laboratory measurements confirmed that tested formations were non-homogeneous (Figs. 13 and 14). Poor depth matching due to the defined vertical resolution of well logging devices is only partially responsible for the observed scatter-ing the data. The main role is played by complicated geological structure of the investigated formations which influenced all the presented results and

K. WAWRZYNIAK-GUZ
2374
Fig. 21. Spectral decomposition 10 Hz component versus ratio of permeability and total porosity from laboratory for the Miocene formation, M-1 well.
Fig. 22. Logarithm of absolute value of integrated impedance (seismic attribute) ver-sus total porosity from NMR laboratory experiment for the Miocene formation, M-1 well.
significantly lowered the correlation coefficients. Despite the geological rea-son, relationships between determined parameters were established and can be used in further interpretation.
Relationships between log data represented by AFW attributes and seis-mic attributes are presented in Figs. 15 and 16. Satisfactory trends are ob-served between the instantaneous frequency from AFW (InstFreq P/ InstFreq S) and seismic frequency represented by attributes such as an aver-age frequency of impedance (AveFreq_Imp) and average frequency of SD30 component (AveFreq_SD30), where 30 Hz component was taken from the spectral decomposition of the seismic trace. Though coefficients of determi-

AWF – A BRIDGE BETWEEN SEISMIC AND LABORATORY DATA
2375
nation (R2) are not high due to the scattered points (different rock types and non-homogeneity of Ca2 itself), the correlations are unquestionable. Simi-lar situations can be observed in Figs. 17 and 18 where the Poisson’s ratio is correlated with the instantaneous frequency obtained directly from seismic traces (InstFreq_Seis), and ratio of instantaneous frequencies of P and S waves from AFW (InstFreq P/InstFreq S). However, more detailed analyses show that the relation changes with facies. Figure 19 shows the diversity of the Main Dolomite Ca2 facies.
Stoneley wave sensitivity to permeability (K) is illustrated in Figs. 19 and 20. Increase of K generally reduces the amplitude of the Stoneley wave (here expressed as an Amplitude Envelope – one of the instantaneous attrib-utes from AFW). An interesting relationship was obtained for velocity of Stoneley wave multiplied by the bulk density of the formation. R2 coeffi-cient is high (0.7); thus, the relation is promising for permeability predic-tion. Stoneley wave identified from AFW in combination with the logarithm of permeability (Fig. 20) showed the ability to discriminate between water saturated and hydrocarbon saturated parts of the Main Dolomite. Relation-ships between the parameter related to hydraulic properties of the Sarmatian sandy-shaly reservoir (M-1 well), here expressed as a square root of permea-bility to porosity ratio, Sqrt (K/C), and component of spectral decomposition SD10 of seismic trace (SD10) were a very interesting example of the combi-nation between seismic attribute and laboratory results (Fig. 21). A strong re-lationship was also observed between the logarithm of the absolute value of integrated impedance as seismic attribute (Log ABS (Integrate_Imp)) and to-tal porosity from an NMR laboratory experiment (Fig. 22). The goal of these considerations was to check whether it was possible to determine the perme-ability from the seismic data.
The presented relationships between petrophysical parameters from la-boratory measurements, attributes from acoustic full waveforms and seismic attributes are a step further in dealing with scaling problem. Results of vari-ous geophysical measurements are different, even when based on the same rock parameters, such as elastic and reservoir properties. The found relation-ships show connection between parameters of a different scale: from lab to log scale, from log to seismic scale, and even from lab to seismic scale. Re-lationships indicate that it is possible to extrapolate laboratory data, very de-tailed but measured on small samples cut from cores, to a larger amount of rock formation considered by well logs and seismics. Including acoustic full waveforms in such a research, particularly AFW attributes, substantially im-proves combining the parameters acquired at different scales. On the one hand, the AWF attributes, which represent log scale, can be related to lab and other log data; on the other hand, they are a natural link between log and

K. WAWRZYNIAK-GUZ
2376
seismic data thanks to the same physical background (i.e., elastic wave field). Additionally, seismic attributes that were incorporated instead of raw seismic data increased sensitivity for local and tiny changes of rock for-mation, which are usually averaged in seismic surveys. These results proved the key role of well logs in combination of different types of data; however, the links are usually not obvious. Applying seismic and AFW attributes along with ratio of different rock properties can be helpful (Wawrzyniak-Guz and Jarzyna 2014).
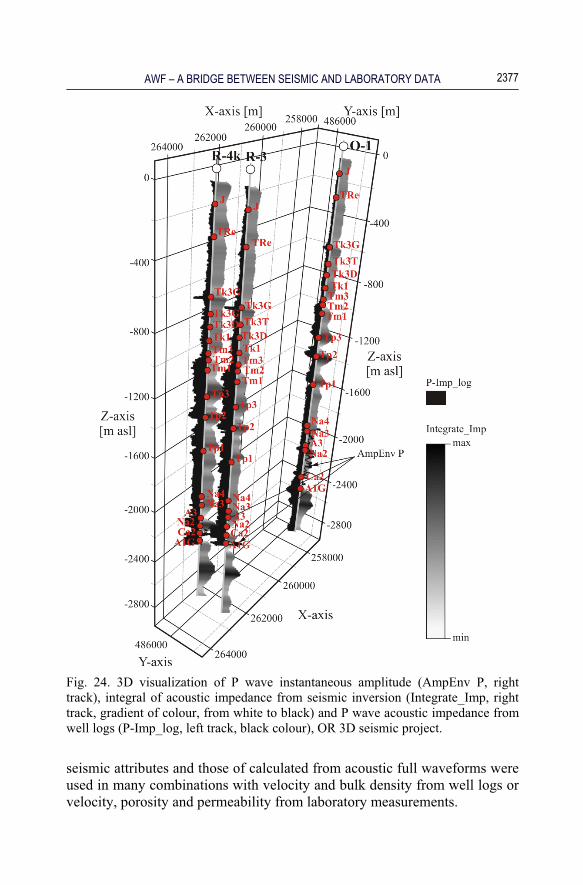
9. THREE DIMENSIONAL RESULTS VISUALIZATION 3D images of seismic sections were constructed to the show position of wells, depth of wells and horizons important in the lithostratigraphic correla-tion. The variability of seismic attributes along the borehole axis is well visi-ble on the background of seismic sections. Two examples illustrate relationships between seismic results, well logs and laboratory experiments outcomes (Figs. 23 and 24).
The presented 3D visualizations enable to show similarity of parameters determined from various methods. Such presentation distinctly shows scale differences. Visualization of the petrophysical results on the background of seismic section, reflecting the variability of lithology and stratigraphy, deliv-ers additional global scale information.
Fig. 23. 3D visualization of instantaneous frequency calculated from the standard seismic processing (InstFreq_Seis) on the background of acoustic impedance seis-mic sections, TCZ 3D seismic project.
10. CONCLUSION The main concept of establishing relationships between various parameters obtained in the processing and interpretation of seismic data and well logs, including also the results of laboratory experiments, was successfully real-ized. Pseudoimpedance sections from seismic inversion along with various
AWF – A BRIDGE BETWEEN SEISMIC AND LABORATORY DATA
2377
Fig. 24. 3D visualization of P wave instantaneous amplitude (AmpEnv P, right track), integral of acoustic impedance from seismic inversion (Integrate_Imp, right track, gradient of colour, from white to black) and P wave acoustic impedance from well logs (P-Imp_log, left track, black colour), OR 3D seismic project.
seismic attributes and those of calculated from acoustic full waveforms were used in many combinations with velocity and bulk density from well logs or velocity, porosity and permeability from laboratory measurements.
K. WAWRZYNIAK-GUZ
2378
In two different geological formations (sandy-shaly thin-bedded Sarmatian formation and the Main Dolomite carbonate horizon), relation-ships of high correlation coefficients between seismic attributes, well logs, and laboratory origin values of porosity and permeability were determined. Seismic attributes and AFW attributes as parameters depending on small characteristic features of rock formation revealed good correlation with la-boratory results. The combination of these parameters was considered as a type of scaling data that were acquired from methods of different vertical resolution.
Non-homogeneity of the formations was pointed out as a factor lowering the presented relationships.
Acknowledgmen t s . Research were done in the frame of the scientific project No. NN 307 294439 (2010-2013) financed by Ministry of Science and Higher Education, Poland, and was also financially supported by statu-tory funds No. 11.11.140.769 at AGH University of Science and Technol-ogy, Faculty of Geology, Geophysics and Environmental Protection, Kraków, Poland. Authors thank for the data to PO&GC, Warsaw, Poland. Seismic survey and interpretation, and well logs measurements and interpre-tation were done by Geofizyka Kraków, Poland. Analyses were done in Techlog software (Schlumberger) and Hampson-Russell software (CGGVeritas) thanks to Academic Grants funded by these companies to the AGH University of Science and Technology, Kraków, Poland. Thanks are also directed to Magdalena Niepsuj, M.Sc. Eng., Ph.D. student at the AGH University of Science and Technology, Kraków, Poland, for the seismic in-version results, to Micha� Gruszczyk, M.Sc. Eng., from Geofizyka Kraków, Poland for seismic attributes calculations, and to Teresa Staszowska for help in preparation of the figures.
R e f e r e n c e s
Ba�a, M., and J. Jarzyna (1996), Application of acoustic full wavetrains for the de-termination of lithology, reservoir and mechanical parameters of formation, Geophys. Prospect. 44, 5, 761-787, DOI: 10.1111/j.1365-2478.1996. tb00173.x.
Ba�a, M., J. Jarzyna, and Z. Mortimer (2012), Statistical analysis of petrophysical parameters of Middle Miocene rocks from the Polish Carpathian Foredeep, Geol. Q. 56, 4, 665-680, DOI: 10.7306/gq.1048.
Bui, H., P. Ng, D. Becker, J. Durrani, and M. Smith (2010), Well-seismic Tie in the Green Canyon, deep-water area in the Gulf of Mexico – A valuable indica-

AWF – A BRIDGE BETWEEN SEISMIC AND LABORATORY DATA
2379
tor of anisotropy. In: Ext. Abstr. 72nd EAGE Conf. & Exhib. Incorporating SPE EUROPEC, 14-17 June 2010, Barcelona, Spain, P251, DOI: 10.3997/2214-4609.201401154.
Chopra, S., and K.J. Marfurt (2005), Seismic attributes – A historical perspective, Geophysics 70, 5, 3SO-28SO, DOI: 10.1190/1.2098670.
ElGhonimy, R.S., and S. Sonnenberg (2015), Statistical methods of predicting source rock organic richness from open-hole logs, Niobrara Formation, Denver Basin, CO. In: Unconventional Resources Technology Conf., 20-22 July 2015, San Antonio, Texas, USA, SPE-178487-MS, DOI: 10.2118/ 178487-MS.
Huuse, M., and D.A. Feary (2005), Seismic inversion for acoustic impedance and porosity of Cenozoic cool-water carbonates on the upper continental slope of the Great Australian Bight, Mar. Geol. 215, 3-4, 123-134, DOI: 10.1016/ j.margeo.2004.12.005.
Jarzyna, J., M. Ba�a, Z. Mortimer, and E. Puskarczyk (2013), Reservoir parameter classification of a Miocene formation using a fractal approach to well log-ging, porosimetry and nuclear magnetic resonance, Geophys. Prospect. 61, 5, 1006-1021, DOI: 10.1111/j.1365-2478.2012.01102.x.
Knize, S. (1989), Evaluation of full waveform sonic data by analysis of instantane-ous characteristics and colograms. In: Trans. 12th Int. Logging Symposium of SAID, 24-27 October, Paris, France, SAID-004.
Krakowska, I.P., and E. Puskarczyk (2015), Tight reservoir properties derived by nuclear magnetic resonance, mercury porosimetry and computed microtomography laboratory techniques. Case study of palaeozoic clastic rocks, Acta Geophys. 63, 3, 789-814, DOI: 10.1515/acgeo-2015-0013.
Liner, C.L., and T.W. Fei (2006), Layer-induced seismic anisotropy from full-wave acoustic sonic logs: Theory, application, and validation, Geophysics 71, 6, D183-D190, DOI: 10.1190/1.2356997.
Liner, C.L., and T.W. Fei (2007), The Backus number, The Leading Edge 26, 4, 420-426, DOI: 10.1190/1.2723204.
Marzec, P., and K. Pietsch (2012), Thin-bedded strata and tuning effect as causes of seismic data anomalies in the top part of the Cenomanian sandstone in the Grobla-Rajsko-Rylowa area (Carpathian foreland, Poland), Geol. Q. 56, 4, 691-710, DOI: 10.7306/gq.1050.
Marzec, P., M. Niepsuj, M. Ba�a, and K. Pietsch (2014), The application of well logging and seismic modelling to assess the degree of gas saturation in mi-ocene strata (Carpathian Foredeep, Poland), Acta Geophys. 62, 1, 83-115, DOI: 10.2478/s11600-013-0177-2.
Pechnig, R., S. Haverkamp, J. Wohlenberg, G. Zimmermann, and H. Burkhardt (1997), Integrated log interpretation of the German Continental Deep Drill-ing Program: Lithology, porosity and fracture zones, J. Geophys. Res. 102, B8, 18363-18390, DOI: 10.1029/96JB03802.

K. WAWRZYNIAK-GUZ
2380
Pietsch, K., P. Marzec, M. Kobylarski, T. Danek, A. Le�niak, A. Tatarata, and E. Gruszczyk (2007), Identification of seismic anomalies caused by gas saturation on the basis of theoretical P and PS wavefield in the Carpathian Foredeep, SE Poland, Acta Geophys. 55, 2, 191-208, DOI: 10.2478/s11600-007-0002-x.
Puskarczyk, E., J. Jarzyna, and S. J. Por�bski (2015), Application of multivariate statistical methods for characterizing heterolithic reservoirs based on wireline logs – example from the Carpathian Foredeep Basin (Middle Mio-cene, SE Poland), Geol. Q. 59, 1, 157-168, DOI: 10.7306/gq.1202.
Ronen, S., P.S. Schultz, M. Hattori, and C. Corbett (1994), Seismic-guided estima-tion of log properties (Part 2. Using artificial neural networks for nonlinear attribute calibration), The Leading Edge 13, 6, 674-678, DOI: 10.1190/ 1.1437027.
Schultz, P.S., S. Ronen, M. Hattori, and C. Corbett (1994a), Seismic-guided estima-tion of log properties (Part 1. A data-driven interpretation methodology), The Leading Edge 13, 5, 305-310, DOI: 10.1190/1.1437020.
Schultz, P.S., S. Ronen, M. Hattori, M. Mantran, and C. Corbett (1994b), Seismic-guided estimation of log properties (Part 3. A controlled study), The Lead-ing Edge 13, 7, 770-776, DOI: 10.1190/1.1437036.
Szabó, N.P. (2011), Shale volume estimation based on the factor analysis of well-logging data, Acta Geophys, 59, 5, 935-953, DOI: 10.2478/s11600-011-0034-0.
Taner, M.T., F. Koehler, and R.E. Sheriff (1979), Complex seismic trace analysis, Geophysics 44, 6, 1041-1063, DOI: 10.1190/1.1440994.
Veeken, P.C.H., and M. Da Silva (2004), Seismic inversion methods and some of their constraints, First Break 22, 6, 47-70, DOI: 10.3997/1365-2397. 2004011.
Wawrzyniak-Guz, K., and M. Gruszczyk (2013), Combination of seismic and well log data with the use of attributes and acoustic full waveforms. In: Ext. Abstr. 75th EAGE Conf. & Exhib. Incorporating SPE EUROPEC 2013, 10-13 June 2013, London, United Kingdom, We P15 03, DOI: 10.3997/2214-4609.20131047.
Wawrzyniak-Guz, K., and J. Jarzyna (2012), Seismic attributes for acoustic full waveforms. In: Ext. Abstr. 74th EAGE Conf. & Exhib. Incorporating EUROPEC, 4-7 June 2012, Copenhagen, Denmark, P072, DOI: 10.3997/2214-4609.20148475.
Wawrzyniak-Guz, K., and J. Jarzyna (2014), Combination of rock formation proper-ties derived from lab, log and seismic measurements scale. In: Ext. Abstr. 76th EAGE Conf. & Exhib., 16-19 June 2014, Amsterdam, Netherlands, We G104 02, DOI: 10.3997/2214-4609.20141168.
Wawrzyniak-Guz, K., E. Puskarczyk, P.I. Krakowska, and J.A. Jarzyna (2016), Classification of Polish shale gas formations from Baltic Basin, Poland based on well logging data by statistical methods. In: Conf. Proc. SGEM

AWF – A BRIDGE BETWEEN SEISMIC AND LABORATORY DATA
2381
2016 16th Int. Multidisciplinary Scientific Geoconf.: Science and Technol-ogies in Geology, Exploration and Mining, 30 June – 6 July 2016, Albena, Bulgaria, Vol. 3, 761-768.
Wenlong, D., L. Chao, L. Chunyan, X. Chungchun, J. Kai, Z. Weite, and W. Liming (2012), Fracture development in shale and its relationship to gas accumula-tion, Geosci. Front. 3, 1, 97-105, DOI: 10.1016/j.gsf.2011.10.001.
Zawisza, L. (1993), Simplified method of absolute permeability estimation of porous beds, Arch. Min. Sci. 38, 4, 343-352.
Zoback, M.D. (2010), Reservoir Geomechanics, Cambridge University Press, Cam-bridge, DOI: 10.1017/CBO9780511586477.
Received 30 July 2016 Received in revised form 14 October 2016
Accepted 3 November 2016