Embed Size (px)
Citation preview

PROCEEDINGS of the 23rd International Congress on Acoustics 9 to 13 September 2019 in Aachen, Germany
Acoustic Comfort in Multi-group Conversation Space: a Field Experiment in an Actual Café with Different BGM Levels
Naoya MARUYAMA1; Yasuhiro HIRAGURI2; Keiji KAWAI3, Mari UEDA4 1, 3 Kumamoto University, Japan
2 Kindai University, Japan 4 Kanagawa Institute of Technology, Japan
ABSTRACT We refer to “Multi-group conversation space (MGCS)” as a space where more than one groups share a
space and make conversations within the groups, such as restaurant or café. In this study, we investigated acoustic comfort in MGCS considering speech intelligibility and speech privacy as major factors by conducting acoustic measurements and a questionnaire survey to the customers for four days in an actual café. The volume of background music (BGM) during operating hours was changed each day at three levels of low, middle and high and no BGM. The indoor noise levels were measured at six representative points with six sound level meters hung from the ceiling. The questionnaire consisted of eight items including ease of making conversation, comfort, and atmosphere (lively/relaxed). The customers were asked to answer questions at their table after having their meal or drink and, at the same time, the occupancy of neighboring table and the number of customers in the café were recorded. Results show that the ease of conversation tended to be evaluated better when the volume setting of the BGM was middle level than other settings. Also the impression evaluation varied by gender, age, or seat position and occupancy. Keywords: BGM, acoustic comfort, café, ease of talking
1. INTRODUCTION There are rooms, such as restaurant or café, where more than one groups share a space and make
conversations within the groups and we refer to such spaces as “multi-group conversation space (MGCS).” It would be not easy to make conversation when a MGCS had little sound absorption because of a poor speech intelligibility caused by much reverberation, but it would also be not easy when a MGCS had much sound absorption because the conversation, particularly a business talk or a talk of private matters, could be clearly heard between groups. Thus it should be assumed some optimal range of acoustic condition for a comfortable conversation in which both speech intelligibility and speech privacy are adequately balanced and the purpose of this study is to investigate such a range of the acoustic condition regarding background sound and reverberation. Rindel (1) proposed a simple prediction model for the noise level in restaurant due to many people speaking in a room considering the Lombard effect and provided the recommended minimum absorption area, such as 17 m2 for “good” verbal communication. Also Rindel (2) proposed a simple evaluation index of “Acoustical capacity” for the speech intelligibility in eating establishments. Astolfi et al. (3) made an attempt to investigate the acoustical quality in restaurants regarding speech privacy and intelligibility by conducting a survey in four pizzeria-restaurants in which seat density and sound absorption were discussed with subjective evaluations. Nahid et al. (4) performed a simulation subjecting actual eating establishments to find a balanced condition of good speech intelligibility within a table and good speech privacy between tables and the result indicated that tall and absorptive barriers, which might not be suitable 1 [email protected] 2 [email protected] 3 [email protected] 4 [email protected]
4178

in eating establishments in terms of space and interior design, are effective. As well as architectural aspects, background music (BGM) is an important element of acoustic design in MGCS and this has been studied considerably such as Novak (5). As a whole, studies are still few on the acoustic quality in MGCS and more investigation for comfortable acoustic condition in terms of speech intelligibility and privacy with factors of background sounds and noises and sound absorption should be needed. Thus, in the present study, a field experiment with questionnaire and acoustic measurement was conducted in an actual café, varying the level of BGM.
2. SPACE OF FIELD EXPERIMENT
2.1 Overview The experiment was carried out on four days in December 2018 at a café in Kinosaki town, Japan.
The building originally was an old fire station with RC structure and converted into a café with a small art gallery in September 2018 (Fig. 1). The floor plan, dimensions and interior surface materials are presented in Fig. 2 and Tables 1 and 2. Although sound absorptive material (wood wool cement board) was used on the ceiling, the space had a long reverberation time due to the high ceiling and other reflective surfaces, as described later. The café had ten tables to which IDs from A to I were assigned as target tables and ID X was assigned as the experimenter table. Six sound level meters (NL-42; Rion Co. Ltd.) were hung 1 m from the ceiling as receiving points for noise measurements. The noise levels at each of the tables (A-I in Fig. 2) was assumed as the level of the nearest receiving point or the mean value of the nearest two receiving point if the distances to the two point was similar.
Table 1 Room dimensions
Floor 92.3 m2
Volume 285.2 m3
Surface 319.1 m2
Height 3.3 m (3.0, 3.6 m) Seats 43
Table 2 Interior surface materials
ceiling Wood wool cement board
wall Beton brut + emulsion paint finish
floor Beton brut and carpet
Fig. 1 Inside picture of café U. Fig. 2 Floor plan.
4179
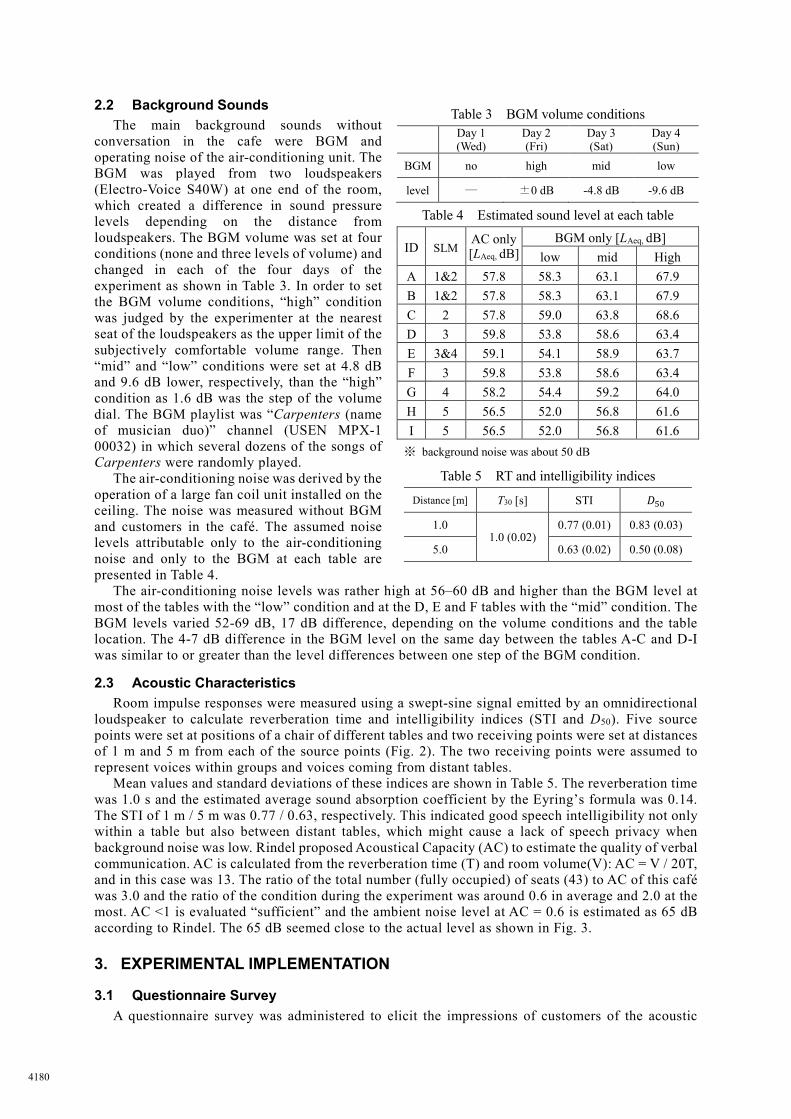
2.2 Background Sounds The main background sounds without
conversation in the cafe were BGM and operating noise of the air-conditioning unit. The BGM was played from two loudspeakers (Electro-Voice S40W) at one end of the room, which created a difference in sound pressure levels depending on the distance from loudspeakers. The BGM volume was set at four conditions (none and three levels of volume) and changed in each of the four days of the experiment as shown in Table 3. In order to set the BGM volume conditions, “high” condition was judged by the experimenter at the nearest seat of the loudspeakers as the upper limit of the subjectively comfortable volume range. Then “mid” and “low” conditions were set at 4.8 dB and 9.6 dB lower, respectively, than the “high” condition as 1.6 dB was the step of the volume dial. The BGM playlist was “Carpenters (name of musician duo)” channel (USEN MPX-1 00032) in which several dozens of the songs of Carpenters were randomly played.
The air-conditioning noise was derived by the operation of a large fan coil unit installed on the ceiling. The noise was measured without BGM and customers in the café. The assumed noise levels attributable only to the air-conditioning noise and only to the BGM at each table are presented in Table 4.
The air-conditioning noise levels was rather high at 56–60 dB and higher than the BGM level at most of the tables with the “low” condition and at the D, E and F tables with the “mid” condition. The BGM levels varied 52-69 dB, 17 dB difference, depending on the volume conditions and the table location. The 4-7 dB difference in the BGM level on the same day between the tables A-C and D-I was similar to or greater than the level differences between one step of the BGM condition.
2.3 Acoustic Characteristics Room impulse responses were measured using a swept-sine signal emitted by an omnidirectional
loudspeaker to calculate reverberation time and intelligibility indices (STI and D50). Five source points were set at positions of a chair of different tables and two receiving points were set at distances of 1 m and 5 m from each of the source points (Fig. 2). The two receiving points were assumed to represent voices within groups and voices coming from distant tables.
Mean values and standard deviations of these indices are shown in Table 5. The reverberation time was 1.0 s and the estimated average sound absorption coefficient by the Eyring’s formula was 0.14. The STI of 1 m / 5 m was 0.77 / 0.63, respectively. This indicated good speech intelligibility not only within a table but also between distant tables, which might cause a lack of speech privacy when background noise was low. Rindel proposed Acoustical Capacity (AC) to estimate the quality of verbal communication. AC is calculated from the reverberation time (T) and room volume(V): AC = V / 20T, and in this case was 13. The ratio of the total number (fully occupied) of seats (43) to AC of this café was 3.0 and the ratio of the condition during the experiment was around 0.6 in average and 2.0 at the most. AC <1 is evaluated “sufficient” and the ambient noise level at AC = 0.6 is estimated as 65 dB according to Rindel. The 65 dB seemed close to the actual level as shown in Fig. 3.
3. EXPERIMENTAL IMPLEMENTATION
3.1 Questionnaire Survey A questionnaire survey was administered to elicit the impressions of customers of the acoustic
Table 3 BGM volume conditions
Day 1 (Wed)
Day 2 (Fri)
Day 3 (Sat)
Day 4 (Sun)
BGM no high mid low
level ― ±0 dB -4.8 dB -9.6 dB
Table 4 Estimated sound level at each table
ID SLM AC only [LAeq, dB]
BGM only [LAeq, dB] low mid High
A 1&2 57.8 58.3 63.1 67.9 B 1&2 57.8 58.3 63.1 67.9 C 2 57.8 59.0 63.8 68.6 D 3 59.8 53.8 58.6 63.4 E 3&4 59.1 54.1 58.9 63.7 F 3 59.8 53.8 58.6 63.4 G 4 58.2 54.4 59.2 64.0 H 5 56.5 52.0 56.8 61.6 I 5 56.5 52.0 56.8 61.6 ※ background noise was about 50 dB
Table 5 RT and intelligibility indices
Distance [m] T30 [s] STI 𝐷𝐷50
1.0 1.0 (0.02)
0.77 (0.01) 0.83 (0.03)
5.0 0.63 (0.02) 0.50 (0.08)
4180
environment and the relation between impressions and acoustic properties. The questionnaire consisted of 13 items: (i) eight items about impressions of the acoustic environment with four or five step evaluation scales (Table 6), (ii) individual attributes, (iii) purposes of use, and (iv) an open question for free comment. As for a question about reverberation, the actual question sentence was "To what level dose sound carry in this café?" considering that respondents might not know or notice reverberation. The questionnaire sheet was also prepared in English and Chinese version for foreign visitors.
The questionnaire was carried out during the whole opening hours (8 AM–6 PM). The experimenter (2 people) stayed at table X (Fig. 2) all the time and handed customers the questionnaire sheet after a certain time they made conversation in the café, such as when they had finished eating or drinking. They were not given explanation about the questions and wrote down the answers by themselves. At the same time, they were answering the questions, we recorded the number of all the customers in the café and their seating tables every 10 min. In total, 265 customers (109 male and 156 female) responded (Table 7) and, among them, there were 12 foreign respondents from China (6 people), Hong Kong (2 people), Thailand (2 people), Taiwan (2 people), and Malaysia (2 people), respectively.
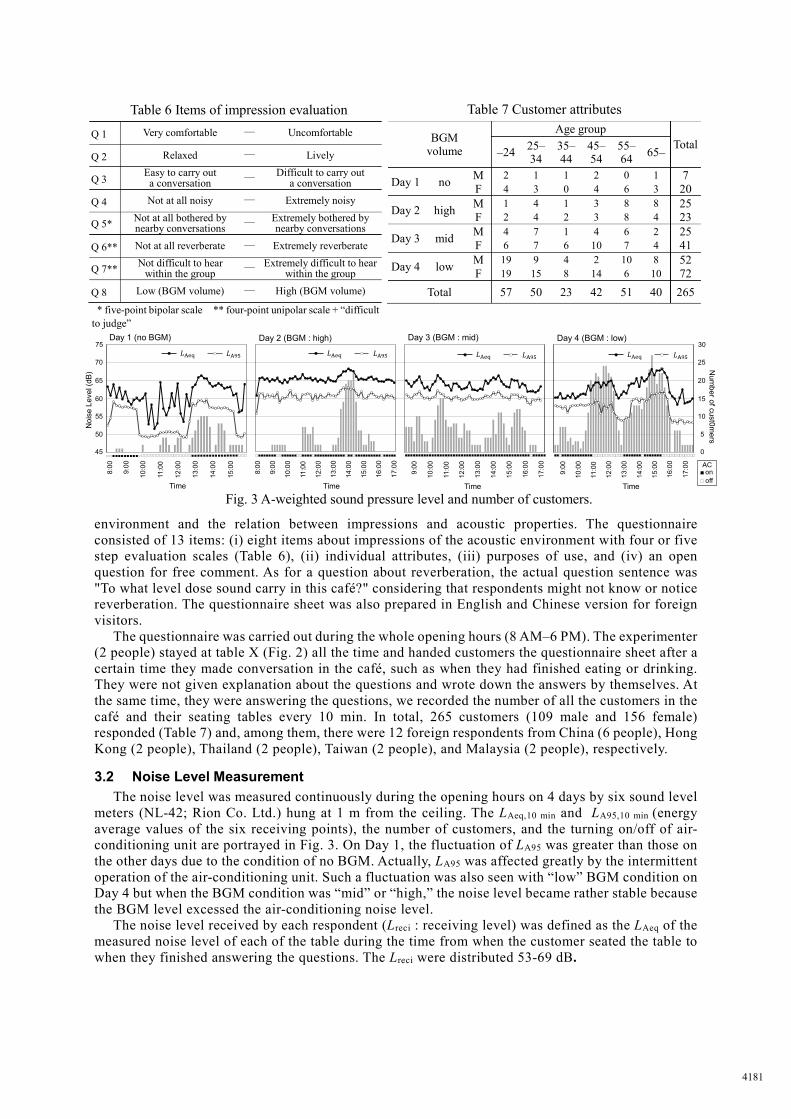
3.2 Noise Level Measurement The noise level was measured continuously during the opening hours on 4 days by six sound level
meters (NL-42; Rion Co. Ltd.) hung at 1 m from the ceiling. The LAeq,10 min and LA95,10 min (energy average values of the six receiving points), the number of customers, and the turning on/off of air-conditioning unit are portrayed in Fig. 3. On Day 1, the fluctuation of LA95 was greater than those on the other days due to the condition of no BGM. Actually, LA95 was affected greatly by the intermittent operation of the air-conditioning unit. Such a fluctuation was also seen with “low” BGM condition on Day 4 but when the BGM condition was “mid” or “high,” the noise level became rather stable because the BGM level excessed the air-conditioning noise level.
The noise level received by each respondent (Lreci : receiving level) was defined as the LAeq of the measured noise level of each of the table during the time from when the customer seated the table to when they finished answering the questions. The Lreci were distributed 53-69 dB.
Table 6 Items of impression evaluation
Q 1 Very comfortable ― Uncomfortable
Q 2 Relaxed ― Lively
Q 3 Easy to carry out a conversation ― Difficult to carry out
a conversation
Q 4 Not at all noisy ― Extremely noisy
Q 5* Not at all bothered by nearby conversations ― Extremely bothered by
nearby conversations
Q 6** Not at all reverberate ― Extremely reverberate
Q 7** Not difficult to hear within the group ― Extremely difficult to hear
within the group
Q 8 Low (BGM volume) ― High (BGM volume)
* five-point bipolar scale ** four-point unipolar scale + “difficult to judge”
Table 7 Customer attributes
BGM volume
Age group Total –24 25–
34 35– 44
45– 54
55– 64 65–
Day 1 no M 2 1 1 2 0 1 7 F 4 3 0 4 6 3 20
Day 2 high M 1 4 1 3 8 8 25 F 2 4 2 3 8 4 23
Day 3 mid M 4 7 1 4 6 2 25 F 6 7 6 10 7 4 41
Day 4 low M 19 9 4 2 10 8 52 F 19 15 8 14 6 10 72
Total 57 50 23 42 51 40 265
Fig. 3 A-weighted sound pressure level and number of customers.
0
5
10
15
20
25
30
45
50
55
60
65
70
75
0
5
10
15
20
25
30
45
50
55
60
65
70
75
0
5
10
15
20
25
30
45
50
55
60
65
70
75
0
5
10
15
20
25
30
45
50
55
60
65
70
75
Day 1 (no BGM) Day 2 (BGM : high) Day 3 (BGM : mid) Day 4 (BGM : low)
70
65
60
55
50
45
75
Noi
se L
evel
(dB)
25
20
15
10
5
0
30
Num
ber of cust0mers
8:00
15:0
0
12:0
0
10:0
0
14:0
0
Time
9:00
11:0
0
13:0
0
8:00
15:0
0
12:0
0
10:0
0
14:0
0
Time
9:00
11:0
0
13:0
0
16:0
0
17:0
0
15:0
0
12:0
0
10:0
0
14:0
0Time
9:00
11:0
0
13:0
0
16:0
0
17:0
0
15:0
0
12:0
0
10:0
0
14:0
0
9:00
11:0
0
13:0
0
16:0
0
17:0
0
Time
AC
offon
4181

4. RESULT
4.1 Impression Evaluation Results for the eight impression questions by the BGM conditions are shown in Fig. 4. The number
of respondents in each BGM condition varied as shown in table.7. In general, negative responses were rare as the field was a comfortable café. Some negative answers were found in Q4, Q7 or Q8 when the BGM was “high.” In Q8, the answer greatly changed with BGM conditions but not evaluated uncomfortable in Q1, which indicated the BGM volume conditions were adequate.
Regarding the questions related to conversation, the negative answer to Q3, related to conversation comfort, was fewer with “low” and “mid” BGM than with “no” or “high” BGM. The negative answer to Q5, related to speech privacy, was the fewest with “mid” BGM and increased in “high”, “low” and “no” in this order. As for Q7, related to speech intelligibility, there was no negative answer with “no” BGM and the negative answer increased along with the volume of the BGM. As a whole, these result implied that the comfortable condition for conversation could have both aspects of speech intelligibility and privacy.
4.2 Effects of Neighboring Table Occupancy on Impression Evaluation The result of Q3: “ease of conversation” indicated that the evaluation was better with “low” and
“mid” BGM than with “no” or “high,” as shown in Fig. 4. Here this tendency will be further discussed with regard to the occupancy of neighboring tables. Figs. 7 and 8 show the ratio of negative answers to Q3, namely, “difficult” and “slightly difficult” by the occupancy of the neighboring table of the respondent for either BGM conditions or Lreci, respectively. Fig. 7 shows the mean plot of the answers to Q5: “bothered by nearby conversation” and Q7: “difficulty to hear within the group” also by the occupancy of the neighboring tables and BGM conditions. The occupancy of the table was observed
Fig. 4 Results of evaluation.
93
73
74
46
37
49
52
42
4 2
0% 100%20% 40% 60% 80%
7
20
18
8
5 2
4
Not difficult
Moderately difficult Extremely difficult
Difficult to judge
Slightly difficult
1
0% 100%20% 40% 60% 80%
67
62
33
59
19 528
2 33
52
5 1
3
15
Low Slightly low
Moderate Slightly high
High
44
35
44
35
37
49
52
52
7 2
Not at all
Moderately Very
Extremely
0% 100%20% 40% 60% 80%
19
15
4
13
Slightly
Non-response
0% 100%20% 40% 60% 80%
44
27
21
8
33
55
59
52
12
3
19
5
14
1327
4
3
2
Not at all
Moderately Extremely
Difficult to judge
Slightly
70
51
68
46
11
31
20
23
4
12
9
12
11
19
4
6
3
Easy Slightly easy
Neither Slightly difficult
Difficult Non-response
0% 100%20% 40% 60% 80%
0% 100%20% 40% 60% 80%
44 41
22 39
33 24
23 19
36
30
24
15
6
14 1
27 1
Not at all noisy Not so noisy
Neither Slightly noisy
Extremely noisy Non-response
81
51
79
52
19
40
20
29
7
15
2
1
Very comfortable Rather comfortable
Neither Slightly uncomfortable
Uncomfortable
0% 100%20% 40% 60% 80%
high
mid
low
no
4
0% 100%20% 40% 60% 80%
81 11
41 42
64 23
35 31
8
13
6
4
6
10 1
21
Relaxed Slightly relaxed
An appropriate mixture of both Slightly lively
Lively
4
high
mid
low
no
high
mid
low
no
high
mid
low
no
high
mid
low
no
high
mid
low
no
high
mid
low
no
high
mid
low
(1)Comfortable (2)Relaxed/Lively (3)Ease of conversation
(4)Noisiness (5)Bothered by nearby conversation
(6)Room reverberation
(7)Difficulty of hearing within the group
(8)Volume of BGM
Non-response
4182

throughout the experiment by the experimenter positioned at the table X in Fig.2 and “occupied” was defined as the situation that any of the surrounding neighbor tables of a respondent was seated by any other customer(s).
As seen in Fig.5, the ratio was the lowest with “mid” BGM and followed by “low,” “no,” and “high” in this order. Regarding the occupancy of the neighboring tables, the ratio in occupied situation was higher than in unoccupied situation with “mid” and “high” BGM while the ratios were similar with “no” and “low” BGM. Particularly, the ratio was high with “high” BGM at 25 % when occupied, 2.5 times more than when unoccupied. The result with Lreci was similar but the ratio in unoccupied situation was rather higher than that in occupied situation when the Lreci was less than 63 dB (Fig. 6). The situation where the neighboring table was occupied and Lreci was low could be assumed that the customers of the neighboring table were quiet and this result might come from this kind of situation.
Presumably BGM would mask surrounding sounds and the conversation from other tables might become less bothering. However, the result of Q5 in Fig.7 was opposite such that the evaluation relatively became more bothered with “mid” and “high” BGM when the neighboring table occupied. Also in Q7, the evaluation became the more difficult to hear with the higher level of BGM when the neighboring table was occupied.
5. THE CUSTOMER CLUSTERING A correlation matrix for items of impression evaluations is shown in Table 8. Seven items other
than Q8: “feeling about BGM volume” were correlated at r = 0.3–0.5. To classify the items, a factor analysis was performed for seven items other than Q8, which can naturally be regarded as an independent item that is simply affected by the BGM level. Factors were extracted with eigenvalues of 3.41, 0.81, 0.70, etc. Therefore, we made a varimax rotation for the top two factors. The resultant factor loadings are presented in Table 8. The first factor was interpreted as related to comfortableness or sound level nearby the respondent, which highly correlated with the Q2: “room atmosphere (lively/
Fig. 7 Evaluation by BGM level and occupancy of neighboring table.
Fig. 5 Difficulty of conversation by BGM volume and neighboring table occupancy.
Fig. 6 Difficulty of conversation by noise level and neighboring table occupancy
4183

Table 8 Correlation matrix of questionnaire items and factor loadings
Item (1) (2) (3) (4) (5) (6) (7) (8) Item F1 F2 (1) comfort (2) relaxed 0.83 0.16
(2) relaxed / lively 0.52 (4) noisiness 0.76 0.24
(3) easiness of carrying out a conversation 0.41 0.52 (1) comfort 0.71 0.24
(4) noisiness 0.44 0.59 0.40 (5) bothered 0.65 0.25
(5) bothered by nearby conversations -0.41 -0.39 -0.40 -0.49 (7) difficulty 0.13 0.86
(6) room reverberant -0.36 -0.35 -0.37 -0.39 0.34 (6) reverberant 0.28 0.66
(7) difficulty to hear within the group -0.33 -0.30 -0.45 -0.36 0.31 0.34 (3) easiness 0.51 0.54
(8) volume of BGM -0.08 -0.13 -0.11 -0.16 0.00 0.30 0.19 Contribution 36% 24%
Table 9 Number of respondents in each cluster
Cluster Gender Location of table BGM volume
Total Male Female A–C D–G H–I no low mid High
C1 43 42 36 36 13 5 51 14 15 85 C2 27 30 35 17 5 2 20 19
16 57
C3 38 82 35 68 17 19 52 33 16 120 Total 108 154 106 121 35 26 123 66 47 262
Fig. 8 Variation of impression evaluations of each BGM volume and classification of respondents.
4184

relaxed),” Q1: “comfort,” and Q5: “bothered by the nearby conversations.” The second factor was interpreted as related to speech intelligibility, showing high correlation with Q7: “difficulty of hearing within the group” and “room reverberant.”
We sought some patterns of respondents’ evaluation tendencies. A k-means cluster analysis (k=3) was applied using the two factor scores of each respondent as Euclidean distance. Fig. 8 shows the mean values of items of Q1: “comfort”, Q2: “room atmosphere (lively/relaxed),” Q3: “ease of conversation” and Q7: “difficulty of hearing within the group” by three clusters (C1, C2, and C3). The cluster profile is shown in Table 9. Typically, C1 had many respondents in a “low” BGM; C2 had many respondents close to the loudspeakers with high BGM. C3 consisted of many women and many respondents far from the loudspeakers.
Regarding the evaluation patterns, C3 evaluated positively overall. The relative changes of evaluation to the four items along with the BGM volume were similar between C1 and C2, while C2 evaluated more positively than C1 for the three items other than Q3: “ease of conversation.” Regarding the item of “ease of conversation,” C2 evaluated negatively in the no BGM while C1 and C2 showed similar evaluation when the BGM was played. Although this result was not significant because of a limited sample size, this result implied that some customers might not prefer a quiet situation when making conversation.
6. CONCLUSIONS In this study, a field experiment was conducted in an actual cafe with varying BGM volume
conditions and evaluations of customers for items particularly addressing conversations in multi-group conversation space (MGCS) were investigated along with the acoustic conditions and customers’ location.
The results are summarized as follows. 1) Evaluation of Q3: “ease of conversation” tended to be a little negative when the BGM volume or
the received noise level was either high or low. This result suggests that an adequate background sound levels might exist for comfortable conversation.
2) Occupancy of nearby tables tended to affect the comfortableness of conversation with regard to speech privacy and intelligibility.
3) Results through a cluster analysis indicated that there were some customers who did not prefer a quiet situation. This study is among the first trials of a field experiment in an actual MGCS and the results are not
decisive nor conclusive. The results suggested some optimum conditions for easy and comfortable conversations in MGCS and further investigations should be accumulated.
ACKNOWLEDGEMENTS We thank “Café Utsuroi Tsuchiya Annex” for the cooperation with this field experiment.
REFERENCES 1. Rindel J.H., Verbal communication and noise in eating establishments. Applied Acoustics 71(2010), 1156-
161. 2. Rindel J.H., Acoustical capacity as a means of noise control in eating establishments. Proceedings of
BNAM 2012, Odense, Denmark, 2012. 3. Astolfi A. and Filippi M. Good Acoustical Quality in Restaurants: A Compromise between Speech
Intelligibility and Privacy. Proc. of ICA2004, 2004. 4. Nahid M. and Hodgson M. Prediction of optimal conditions for verbal-communication quality in eating
establishments. Journal of Acoustical Society of America 2011; 129(4): 2005–2014. 5. Novak CC, Lopa JL and Novak RE. Effects of Sound Pressure Levels and Sensitivity to Noise on Mood
and Behavioral Intent in a Controlled Fine Dining Restaurant Environment. Journal of Culinary Science & Technology 2010; 8: 191–218.
4185