Embed Size (px)
Citation preview

A Computable General Equilibrium Model of
International Sanctions
M. Reza Gharibnavaz and Robert Waschik
April 2015
Abstract
We detail recent international sanctions against the Iranian economy and itsgovernment imposed by a subset of developed countries. The effects of these sanc-tions on the Iranian economy in general and upon upper- and lower-income ruraland urban Iranian households, as well as the Iranian government, are modelledusing a Computable General Equilibrium (CGE) model which uses endogenoustrade taxes to simulate the effects of sanctions on Iranian oil exports and Iranianimports of petroleum products. The model is calibrated to simulate the effects ofinternational sanctions as closely as possible. Results suggest that sanctions onIranian oil exports had a serious negative effect on the Iranian government bud-get but much more limited effects on the well-being of Iranian rural and urbanhouseholds.
J.E.L. Classification Codes: F51, Q34, C68
Keywords: sanctions, oil, Iran, CGE model
This is work in progress and should not be quoted without prior approval of the authors.
Correspondence should be directed via email to Robert Waschik at [email protected].
1 Introduction
International sanctions have become an important tool of developed market economies
for use against a target country to pursue various foreign policy goals. According to
Hufbauer et al. (2007), economic sanctions “mean the deliberate, government-inspired
withdrawal, or threat of withdrawal, of customary trade or financial relations”. In-
ternational economic sanctions are known as a less expensive alternative to military
intervention (Kaempfer and Lowenberg, 2007). According to data from the Institute
for International Economics (2002), there were only five countries affected by economic
sanctions in 1950s. This number increased to 47 in 1990s. Advocates of sanctions believe
that economic pressures can be effective in altering the target country’s policies without
military intervention (Baldwin, 1985). However, others argue that sanctions on a target
country have not resulted in anticipated outcomes while imposing considerable costs on
citizens who have little influence on the behaviour of their governments (Drezner, 1999;
Elliott, 1998; Hufbauer et al., 1990; Pape, 1997).
While the main goal of economic sanctions is to interrupt a target country’s eco-
nomic and diplomatic relations in order to alter its political and military behaviour,
these measures are increasingly being employed against weaker and more dependent
nations without full consideration of their impact on the welfare of citizens in these
countries, particularly vulnerable groups of households. In the literature of sanctions,
the unintended economic impacts of sanctions on citizens of sanctioned countries have
always been a major source of concern. Scholars argue that broad economic sanctions
unintentionally damage the well-being of citizens in targeted countries, by deteriorating
the quality and access to education and public health care services and worsening their
economic conditions (Cortright et al., 2001; Drury and Li, 2006; Galtung, 1967; Lopez
and Cortright, 1997; Weiss, 1999; Weiss et al., 1997). As a dramatic example, Pape
(1998) argues that comprehensive UN sanctions imposed on Iraq in the 1990s had dev-
astating humanitarian consequences, causing the deaths of over 560000 Iraqi children
from hunger while significantly reducing Iraq’s GDP.
There is considerable evidence that economic sanctions aimed at imposing hardships
on the economy of a target country can severely disrupt economic activities in sanctioned
sectors and consequently restrict economic growth in the sanctioned country (Andreas,
2005; Crawford and Klotz, 1999; Dizaji and van Bergeijk, 2013; Heine-Ellison, 2001;
Hufbauer et al., 2007; Jacobson, 2008; Neumeier and Neuenkirch, 2014; Nossal, 1989).
Kaempfer and Lowenberg (2007) note that there is “no doubt that embargoes or restric-
1

tions on flows of goods and capital impose welfare costs on the target economy”. While
there have been some studies which have estimated the aggregate effects of sanctions on
target countries, few have employed economic models to estimate the welfare losses im-
posed by economic sanctions on different economic agents and households in sanctioned
countries.
Over the past three decades, an enormous amount of effort has been expended by the
United States (arguably the most prominent actor on the sanctions scene) to induce the
international community to develop a sanctions policy against Iran due to concern over
attempts by Iran to develop weapons of mass destruction and humanitarian concerns. In
recent years, severe economic sanctions have been imposed by the US and the European
Union (EU) on Iran’s economy in an attempt to discourage the government of Iran from
continuing to engage in the development of a nuclear weapons capability (Abrams et al.,
2012; O’Sullivan, 2010; Schott, 2012). This article seeks to analyse the welfare impact of
comprehensive economic sanctions on Iran’s economy in general, on the government of
Iran and on households of different socio-economic backgrounds, especially those from
the lower and middle classes of society.
This study makes a number of contributions to the literature on models which eval-
uate the effects of international economic sanctions imposed by developed economies on
an oil exporting country in general, and on welfare impacts of these sanctions on each
economic agent and on different income groups of Iranian rural and urban households
in particular. We use a Computable General Equilibrium (CGE) model with data on
production, consumption and trade from the Global Trade Analysis Project (GTAP),
a popular CGE model used extensively in such exercises. The model uses endogenous
trade taxes to simulate the effects of sanctions on Iranian oil exports and Iranian im-
ports of petroleum products. We augment the GTAP8 dataset with information from
the Statistical Centre of Iran (SCI) to produce a microconsistent CGE model with 20
urban and rural households disaggregated by income level. This allows us to provide
a more accurate representation of the ownership of factors of production by different
households and the government of Iran. The model is calibrated to simulate the effects
of international sanctions as closely as possible.
The paper proceeds as follows. Section 2 gives a summary of international sanctions
against Iran, including a description of the sectors of the Iranian economy which have
been most strongly affected. The dataset, production technology and utility functions
which comprise the CGE model of Iran are described in Section 3. This includes a
description of the aggregation of the GTAP8 data base, as well as detailed descriptions
2

of the necessary modifications to the GTAP8 data base, including the disaggregation
of private demand to ten urban and ten rural consumer groups, using information from
the Statistical Centre of Iran. Section 4 reports and interprets quantitative estimates of
the effects of economic sanctions on the Iranian government budget and the well-being
of Iranian rural and urban households. Simulations demonstrating the sensitivity of
results to exogenously specified parameters in the CGE model including domestic/import
(Armington) substitution elasticities and the intersectoral mobility of capital used to
produce oil in Iran are presented in Section 5, while Section 6 concludes.
2 International Sanctions and the Iranian Economy
The Iranian economy has been exposed to ongoing political and economic sanctions
by the United States, including trade and financial sanctions since Iran’s 1979 Islamic
revolution. But the goals of U.S. sanctions policy against Iran have changed over time.
According to Katzman (2013), U.S. economic sanctions in the mid-1980s were aimed at
limiting Iran’s strategic power in the Middle East in general, and forcing Iran to stop
supporting terrorism in particular. Since the mid-1990s, U.S. sanctions have targeted
Iran’s petroleum sectors and nuclear program with the objective of weakening Iran’s
economy. In the meantime, European nations refused to follow U.S. policy to impose
economic sanctions against Iran (Pollack and Takeyh, 2005). In 1996, the U.S. Senate
approved the “Iran and Libya Sanctions Act” (ILSA), prohibiting foreign investment in
any oil and gas development projects in Iran of over $40 million during any 12-month
period (Hufbauer et al., 2012). In spite of ongoing sanctions imposed by the U.S. on
economic sectors in Iran that contributed to the proliferation of sensitive nuclear and
missile programs, and despite international opposition, Iran has nonetheless developed
its missile and nuclear programs with major assistance from the Russian government
(Ataev, 2013).
The ILSA ran for five years and was twice renewed by the U.S. Senate, in 2001
and 2006. Over those fifteen years, the ILSA combined with other problems in the
Iranian economy including economic mismanagement to produce a considerable drop in
the growth of Iranian oil production (Schott, 2012). The European Union (EU) joined
the U.S. in imposing economic sanctions against Iran from 2006 as a result of Iran’s
contentious nuclear program. Since 2010, the EU sanctions have mainly targeted the oil
and gas, transportation and financial and insurance sectors in the Iranian economy (Pat-
terson, 2013). In 2010, the Iran Sanctions Act of 1996 was substantially amended and
3

expanded into the Comprehensive Iran Sanctions Accountability and Divestment Act
(CISADA), limiting the sale of gasoline, other petroleum products as well as refinery-
related equipment to Iran (Hufbauer et al., 2012; Katzman, 2014). Many other countries
including Australia, Canada, Japan, South Korea and Switzerland have adopted eco-
nomic sanctions against Iran due to its nuclear ambitions from 2010.
The U.S. and the EU launched a new series of tough energy sanctions against Iran in
late 2011 and early 2012. The main objective of these sanctions was to discourage Iran
from developing its nuclear program by reducing Iran’s oil-export revenues. Both politi-
cians and oil-market experts initially believed that the new U.S. and EU sanctions which
targeted Iranian exports of petroleum, natural gas, oil and chemicals would not force
Iran to slow down the progress of its nuclear program since they would not significantly
shrink Iran’s oil exports (Van de Graaf, 2013). However, reports by the International
Energy Agency in early 2013 (IEA, 2013) and Iran’s oil minister revealed that Iran’s oil
exports fell by 40 percent from 2011 levels, and Iran’s oil-export revenues dropped by
over $40 billion in 2012 because of new sanctions. Table 1 highlights the effectiveness of
these expanded international sanctions against the Iranian oil sector.
Oil exports by destination
Asia and Oil Petrol GasYear World Europe Pacific Africa Prod’n Prod’n Prod’n
2007 2639 847 1469 148 4030.7 1498.0 1119002008 2574 749 1542 147 4055.7 1587.0 1163002009 2406 568 1538 127 3557.1 1726.1 1757422010 2583 878 1571 134 3544.0 1743.3 1873572011 2537 741 1392 127 3576.0 1748.7 1887532012 2102 162 1839 101 3739.8 1811.9 2024312013 1215 128 1085 2 3575.3 1918.4 199293
Source: OPEC “Annual Statistical Bulletin”, various years
Table 1: Iran – Oil Exports and Energy Production (1000b/d, except Gas,1000000 cu m)
In early 2012, the U.S. enacted a new generation of financial sanctions against Iran’s
Central Bank, restricting Iran’s ability to use the international financial system. The
new financial sanctions produced a serious problem for the Iranian government for both
non-oil transactions as well as oil-related transactions between the Central Bank of
Iran and any foreign financial institutions (Farzanegan, 2011). These new financial
sanctions successfully forced Iran to agree to receive payment for oil in either the national
4
currencies of oil importing countries or gold (Katzman, 2012).
In July 2012, the EU imposed an embargo on the import, purchase and transport
of Iranian crude oil (Katzman, 2013). As a result, EU oil imports from Iran which had
accounted for more than a quarter of Iran’s oil exports (see Table 1) fell dramatically.
This EU ban started a new phase of sanctions against Iran. The EU also decided to ban
European insurance companies for shipping oil and petrochemical products from Iran.
The EU financial sanctions came into force in October 2012, banning the provision of
financial communication services with the Central Bank of Iran, except for humanitarian
transactions with Iranian banks (Farzanegan, 2011).
2.1 Impacts of International Sanctions on Iran’s economy
Before describing the general equilibrium model used to study the effects of international
sanctions on Iran’s economy in general, and on the government budget and the welfare
of different income groups of households in particular, it is important to evaluate Iran’s
economic structure and its development planning. Therefore, this Section provides a
brief background on certain macro-economic variables and key economic sectors of Iran’s
economy, and the impacts of international sanctions on these sectors.
Iran has a population of more than 77 million (increased from 75 million in 2013), the
second largest in the Middle East and North African region after Egypt (World Bank,
2014). Urban areas are heavily populated, accounting for 70 percent of the Iranian pop-
ulation (United Nations, 2013). Since 1979, Iran has endured almost two decades of
revolution, war and reform as well as international pressures which brought about con-
siderable socio-economic disruption, heavy military and civilian casualties, and a drop
in the production and export of energy commodities. Over the past three decades, the
burden of the eight-year war, a drop in domestic production in the 1980s and massive
shortages in fuels, medicines and necessities, high inflation as well as increasing spec-
ulation and a growing black market all combined to produce strong grounds for direct
government intervention in Iran’s economy (Esfahani and Pesaran, 2009). Energy com-
modities and other sizable industries and enterprises are under the control of the state,
while the private sector has a negligible authority to run small businesses (Esfahani et
al., 2013).
From the beginning of 2002, the Iranian government committed itself to implementing
trade reforms, exchange rate unification, ratification of the law on foreign investment, the
licensing of three private banks and tax reform, intended to adjust distortions and struc-
tural imbalances. The government in Iran has since launched several market-oriented
5

reforms aimed at reversing the recent downward economic spiral. However, international
sanctions combined with years of government mismanagement and widespread corrup-
tion have left the economy vulnerable to very high inflation and negative growth rates
(Hufbauer and Schott, 2006; Katzman, 2013; Plaut, 2013; IMF, 2014). For instance,
the Statistical Centre of Iran (SCI) reported that the inflation rate in Iran reached 35
percent in December 2013, and the economy faced an unemployment rate of around 13
percent. Both international sanctions and the elimination of food and energy subsidies
in recent years have been the likely cause of high inflation in Iran. Devarajan and Mot-
taghi (2014) note that the economy of Iran has experienced negative growth rates of
-3.0 and -2.1 percent for 2012 and 2013 respectively. Since the tightening of energy and
financial sanctions against Iran in 2012, the Iranian currency (Rial) lost more than 80%
of its exchange value (Monshipouri and Dorraj, 2013).
2.2 Iran’s Energy Sector under International Sanctions
According to CBI (2010), the oil and gas sector dominated the economy of Iran, ac-
counting for an estimated 90 percent of foreign exchange revenues and providing 60
percent of government earnings in fiscal year 2008-2009. Iran possesses the world’s sec-
ond largest natural gas reserves and the fourth largest proven oil reserves (IEA, 2012).
Even though Iran boasts vast gas resources, the country has been incapable of becoming
a leading global gas exporter because natural gas produced by the underdeveloped sector
is mostly used to meet domestic demand. In 2010, 59 percent of Iran’s total domestic
energy consumption came from natural gas (U.S. Energy Information Administration,
2013).
In recent years, the undermining of Iran’s sources of government revenue has been the
main goal of the international sanctions imposed on Iran’s economy so as to discourage
the development of its nuclear program. Iran’s oil and gas sectors, which make up the
major share of government revenue, have been a major target of the latest international
economic sanctions against Iran. According to U.S. Energy Information Administration
(2013), the toughening of sanctions against Iran in 2012 resulted in a 40 percent decrease
in Iran’s oil exports, though Iran was still producing 3.5 million bpd over the period of
2012-2013, with the unsold crude oil being stockpiled in onshore and floating storage
(International Energy Agency, 2012, 2013). Prior to 2010, Iran had stockpiled crude oil in
floating storage in order to increase profits from the world energy market. However, since
2010 there has been a correlation between Iran’s floating oil storage and the toughening
of sanctions against Iran’s energy sector (Lee, 2004; Mann, 2013; EIA, 2011). According
6

to IEA (2013), estimates of Iran’s crude oil stockpile in floating storage in 2013 were
around 20-25 million barrels. Estimates also show that Iran has a total onshore storage
capacity of 25 million barrels, and that most of this capacity is filled (IEA, 2013).
According to Hufbauer et al. (2012), the average welfare loss caused by the U.S.
sanctions on Iran was around $80 million over the period 1984-2005, less than one
percent of the Iranian GDP in the same period. Over the period of 2006-2012, the
international sanctions against Iran produced an average welfare loss of $5.7 billion,
equivalent to about 1 to 3 percent of Iranian GDP (Hufbauer et al., 2012). While
few studies have employed economic models to evaluate the socio-economic impacts of
international sanctions on Iran, to our knowledge, no studies have analysed the economic
impacts of these sanctions on separate economic agents in general, and on different
income groups of rural and urban households in particular. To our knowledge no other
studies have used a CGE model to take account of the general equilibrium effects of
international sanctions on all inter-related sectors of the Iranian economy. Since the
impact of the U.S., EU and UN trade and financial sanctions against Iran on needy and
vulnerable households in Iran is a source of concern, this study specifically attempts to
evaluate the welfare impacts of international sanctions on 20 Iranian household types
in rural and urban areas, grouped according to income, along with their effect on the
Iranian government.
3 Data and CGE Model
We begin with a brief description of the relevant data which characterize multilateral
sanctions applied to trade with Iran, and detail how these sanctions are reflected in the
general equilibirum dataset. We then describe the Computable General Equilibrium
(CGE) model which is used to generate the counterfactual results for different levels of
multilateral sanctions on trade with Iran.
3.1 Data
We begin with version 8 of the GTAP dataset which depicts a global general equilibrium
of production, consumption, and trade for 129 countries/regions and 57 commodities
produced using 5 primary factors of production and intermediate inputs for the year
2007, described in Narayanan et al (2012). We aggregate GTAP regions into three
separate regions: Iran, a single aggregate of all countries/regions which apply sanctions
on trade with Iran (‘SAN’), and an aggregate rest-of-world (‘ROW’) of all remaining
7
regions. Given the description of international sanctions on trade with Iran in Section 2,
the aggregate region ‘SAN’ of countries applying sanctions on trade with Iran includes:
Canada, the United States, Mexico, Central America, Australia, New Zealand,
Japan, Republic of Korea, China, Hong Kong, Taiwan, Malaysia, Singapore,
India, Sri Lanka, the 28 EU countries, South Africa
The commodity aggregation is presented in Table 2 and is constructed to allow us
to reflect multilateral sanctions as accurately as possible, and to accommodate disaggre-
gation of private consumption using information from the Urban and Rural Household
Income and Expenditure Survey from the Statistical Center of Iran (SCI) (Statistical
Centre of Iran, 2005). Commodities in Table 2 with an x-superscript (oil, petroleum
products, metals) are those where sanctions are applied on Iranian exports to ‘SAN’
countries, while commodities with an m-superscript (petroleum products, metals, motor
vehicles) are those where sanctions are applied on Iranian imports from ‘SAN’ countries.
To highlight how the economies of Iran and the two aggregated regions differ, Table
3 shows output value shares using the commodity aggregation detailed in Table 2. Eco-
nomic activity in Iran has long been dominated by the oil sector, and before their recent
reform in 2010, large state fuel subsidies resulted in a petrol sector which is considerably
larger (as a share of the value of output) than that in other regions (see Gharibnavaz and
Waschik (2014)). As a result, the share of output accounted for by the manufacturing
and service sectors is notably smaller in Iran.
3.2 CGE Model
Since international sanctions on trade with Iran focus on oil and petrochemical products,
we adopt a specification of the demand side of the CGE model which follows that in
other studies which focus on energy markets like the GTAP-E model (see Burnieaux and
Truong, (2002), Rutherford and Paltsev (2000) and Fischer and Fox (2007)). For each
region private and public demand derives from the maximization of a CES function of
an aggregate ‘energy’ good and an aggregate ‘non-energy’ good, with a CES substitution
elasticity σ = 0.5. The ‘energy’ aggregate is a Cobb-Douglas function of energy goods
(coal, oil, gas, petrol, electricity, gas distribution), while the ‘non-energy’ aggregate is
a Cobb-Douglas function of the remaining commodities. For the aggregated regions of
sanction countries ‘SAN’ and the rest of the world ‘ROW’, real aggregate public demand
is fixed. A single representative agent owns all primary factors of production, and all
tax revenue is assumed to be costlessly collected and redistributed to this representative
8

Sector GTAP8 Sectors (sector code)
Wheat Wheat (wht), Cereal Grains (gro), Plant-based Fibers (pbf)
Milk Milk (rmk)
Meat Cattle, Sheep, Goats, Horses (ctl), Fishing (fsh), Cattle, Sheep,Goats, Horse (cmt), Meat Products (omt)
Vegetable oil Oil Seed (osd), Vegetable Oils and Fats (vol)
Dairy products Animal Products (oap), Dairy Products (mil)
Sugar Sugar (sgr)
Primary agriculturalproducts
Paddy Rice (pdr), Vegetables, Fruits and Nuts (v f), Sugar caneand Sugar beet (c b), Crops (ocr), Wool, Silk-worm Cocoons(wol)
Processed agriculturalproducts
Processed Rice (pcr), Food Products (ofd), Beverages and To-bacco Products (b t)
Coal Coal (coa)
Oilx Oil (oil)
Gas Gas (gas), Gas manufacture, distribution (gdt)
Electricity Electricity (ely)
Petroleum productsx,m Petroleum and Coal Products (p c)
Metalsx,m Chemical, rubber, plastic prods (crp), Mineral products n.e.c.(nmm), Ferrous metals (i s), Metals n.e.c. (nfm), Metal products(fmp)
Motor Vehiclesm Motor vehicles and parts (mvh)
Manufactures Forestry (frs), Minerals n.e.c. (omn), Textiles (tex), Wearingapparel (wap), Leather products (lea), Wood products (lum),Paper products, Publishing (ppp), Transport equipment n.e.c.(otn), Electronic equipment (ele), Machinery and equipmentn.e.c. (ome), Manufactures n.e.c. (omf)
Transport services Transport n.e.c. (otp), Sea Transport (wtp), Air Transport (atp)
Services Water (wtr), Construction (cns), Trade (trd), Communication(cmn), Financial services n.e.c. (ofi), Insurance (isr), Businessservices n.e.c. (obs), Recreation and other services (ros), Pub-Admin/Defence/Health/Educat (osg), Dwellings (dwe)
Table 2: Sectors in Aggregated GTAP8 Data Base
9

Sanction Rest ofSector Iran Countries World
Wheat and Cereal Grains 1.5 0.3 0.9Raw Milk 1.1 0.2 0.6Meat 1.0 0.9 2.1Vegetable Oil 0.4 0.3 0.8Dairy 2.1 1.0 1.4Sugar 0.1 0.1 0.3Other Primary Agriculture 2.2 0.9 2.5Other Processed Agriculture 2.7 2.7 3.7Coal 0.0 0.2 0.3Oil 21.1 0.4 6.5Gas 2.7 0.3 1.7Electricity 3.5 1.8 2.7Petrol 9.3 2.5 3.6Metal Products 6.5 10.1 9.2Motor Vehicles 2.5 3.1 1.8Manufactures 4.4 15.1 11.6Transport 4.9 4.9 5.9Services 34.0 55.3 44.5
Table 3: Output Value Shares from GTAP8 Dataset (2007)
consumer.
But many features of the international sanctions applied to trade with Iran and of the
Iranian economy in general make it inappropriate to adopt such a structure for private
and public demand in Iran. The stated objective of sanctions is to affect the behaviour
of the government in Iran, so we cannot exogenize real aggregate public demand in Iran.
We also need to model the distribution of the ownership of factors of production in Iran
so that it reflects the reality of factor ownership in Iran. We assume that the government
owns all Natural Resources, and earns all rents generated by capital employed in the
energy sectors in Iran. Private consumers earn all income generated from the use of Land
and Labour, and also earn all income from capital usage, except for capital used in the
energy sectors. This reflects the reality in Iran where the government earns all income
from value added except labour in energy sectors. In Iran, all tax revenue accrues to
the government. Government revenue is used to fund (exogenous) investment and to
purchase services, primarily education, health care and defense. Since the government
in Iran earns such a large share of its revenue from rents accruing to the oil sector and
since international sanctions have effectively targeted Iranian oil exports, government
revenue (and hence government expenditure and ‘welfare’) will respond endogenously to
the imposition of international sanctions.
10

We are also interested in the distributional consequences of the application of inter-
national sanctions in Iran, since it is often argued that sanctions impose a significant
burden on private consumers and can disproportionately affect low-income or disadvan-
taged consumers. As such, it is necessary to disaggregate private consumption in Iran.
To capture the disparate effects of international sanctions on low and high income con-
sumers, and to reflect the fact that sanctions could have different effects on urban versus
rural consumers, we disaggregate private consumption in Iran into ten rural and ten
urban consumption groups. This requires us to disaggregate both private income and
expenditure for Iran in the GTAP8 dataset. To disaggregate private expenditure, we use
the Income and Expenditure Survey published by the Statistical Centre of Iran (SCI)
(2005) to calculate expenditure shares θi,h,n at different income deciles n ∈ (1, 2, . . . , 10)
of households h ∈ (urban, rural) which are consistent with the 17 aggregated commodi-
ties i in Table 2. These are reported in Tables A1 and A2 of Gharibnavaz and Waschik
(2014). We also use the SCI Income and Expenditure Survey to disaggregate income
by household. The Survey includes information on all wages and salaries obtained from
self-employment in agricultural and non-agricultural activities, private and public sec-
tor employment, and other income during the reference period. In the GTAP8 dataset,
income earned by factor of production f is reported in vector vfm(f, i), for factors of
production f ∈ {labour, capital, land, natural resources}. As noted earlier, all natu-
ral resource rents accrue to the government in Iran, as does income earned by capital
employed in energy sectors. Remaining income is allocated to disaggregated urban and
rural households using shares reported in Table A3 of Gharibnavaz and Waschik (2014),
where income categories in the SCI Income and Expenditure Survey are matched to
GTAP8 factors as follows:
Land: includes household income as employer or own account worker in agri-
cultural sector after deduction of job on-costs, where on-costs include
paid wage and salary, primary material charges, non-durable appliances,
amortization, other production charges and job taxes.
Labour: includes all wage and salary income earned in public, cooperative and
private sectors after deduction of tax and retirement allowances.
Capital: includes household income other than employment income, including
that derived from the sale of home-made manufactures, retirement pen-
sions, rental of movable and immovable assets, dividends, and charity
and social security organization aids.
11

After disaggregating household income by source and household expenditure by com-
modity, the income equals expenditure constraint for each household will no longer be
satisfied, because the accounting disaggregation does not take account of savings. Data
on savings by households is not available from the Iranian Statistical Centre. To rebal-
ance household accounts, we assign that share of aggregate savings to each household so
that their income equals expenditure constraint is satisfied. Since the initial dataset is
balanced, assigning the remaining savings to the government will then balance the gov-
ernment account. Private and government savings is assumed to be exogenous through-
out. Allocating savings between households and the government in this way leaves the
government in Iran with an 80% share of aggregate savings in the benchmark equilib-
rium.
For each of the 17 production sectors, production technology is represented with a
series of nested CES production functions, as shown in Figure 1. For example, beginning
at the bottom-most nest of Figure 1, the input ‘liquid fuels’ for any industry i is produced
as a CES aggregate of ‘petrol’ and ‘gas’ according to the CES production function:
Qliquidfuel,i = γiliquidfuel
αpetrol,i ·Q
σlqd−1
σlqd
petrol,i + (1− αpetrol,i) ·Q
σlqd−1
σlqd
gas,i
σlqd
σlqd−1
(1)
where αpetrol,i is the value share of ‘petrol’ used in production of ‘liquid fuel’ in sector i.
As shown in Figure 1, the aggregate ‘liquid fuel’ is then combined with ‘coal’ to produce
an aggregate which includes all non-electric energy inputs, with a CES substitution
elasticity σnel = 0.5. This structure for production and the central case values for
the substitution elasticities in Figure 1 are similar to those used in other CGE models
with disaggregated energy sectors (for example, see Rutherford and Paltsev (2000) and
Fischer and Fox (2007), among others). Note that oil enters into production under the
top-most nest with a substitution elasticity of zero: Virtually all oil is used in fixed
coefficients in production of petrol.
To give a more intuitive idea of the implications of this method of specifying and
calibrating consumption and production, note that the CES substitution elasticities in
Figure 1 and the share parameters implied by the GTAP8 equilibrium dataset will imply
demand elasticities for all commodities. For example, industry i’s own-price elasticity
of demand for ‘petrol’ ηipetrol will be given by:
ηipetrol = −σlqd − (1− σlqd) · αpetrol,i + αpetrol,i · (1 + ηinon−electric) (2)
where ηinon−electric is industry i’s demand elasticity for aggregate ‘non-electric’ energy
inputs, itself a function of the ‘non-electric’ substitution elasticity σnel and shares in the
12

energy/value added
energy
σ = 0
σva
capital
value added
non-energy inputs oil
labour specific factors
σvae = 0.5
σe = 0.1
electricity
production of i
non-electric
σlqd = 2coal liquid fuel
petrol
σnel = 0.5
gas
Figure 1: Structure of Production
nests above ‘liquid fuel’ in Figure 1. Similar expressions can be solved for the demand
elasticities for all commodities in all nests in Figure 1 for all firms, and for public and
private demand. The demand elasticities in each region will then be a share-weighted
aggregate of these public, private and firm-level demand elasticities. Table 4 reports the
demand elasticities for Iran and for the aggregate regions of sanction countries ‘SAN’
and the rest of the world ‘ROW’ for all aggregated commodities.1
In all regions, each agent’s endowment of primary factors of production is assumed
1These demand elasticities are often approximated by the value of the substitution elasticity in thelowest nest (ie: ηpetrol ≈ −σlqd), a valid practice when shares like αpetrol,i are small and substitutionelasticities in the higher nests like σnel are close to Cobb-Douglas.
13

Sanction Rest ofSector Iran Countries World
Wheat and Cereal Grains −0.567 −0.155 −0.335Raw Milk −0.005 −0.254 −0.498Meat −0.513 −0.521 −0.545Vegetable Oil −0.525 −0.264 −0.398Dairy −0.683 −0.438 −0.571Sugar −0.292 −0.482 −0.568Other Primary Agriculture −0.616 −0.403 −0.487Other Processed Agriculture −0.691 −0.583 −0.606Coal −0.494 −0.431 −0.482Oil −0.001 0.000 0.000Gas −1.191 −1.281 −1.123Electricity −0.413 −0.416 −0.424Petrol −0.522 −0.457 −0.649Metal Products −0.088 −0.087 −0.136Motor Vehicles −0.230 −0.301 −0.326Manufactures −0.175 −0.165 −0.208Transport −0.391 −0.248 −0.382Services −0.181 −0.123 −0.174
Table 4: Demand Elasticities
to be fixed. These factors are ultimately all supplied to the production sectors in each
region, and factors are assumed always to be fully employed. We adopt the GTAP
primary factor substitution elasticities, available from Chapter 14 in Narayanan et al
(2012), reflected on the right side of Figure 1 as σva. There are a number of distortions
in the GTAP8 dataset reflected by ad valorem taxes on private and public consumption,
usage of intermediate inputs by firms, production of outputs and trade.
Following Armington (1969), imports are incorporated into the model by treating do-
mestic and imported varieties of the same good as differentiated products by domestic
users of those goods. This is reflected by assuming that intermediate inputs in produc-
tion and inputs into private and public consumption are CES aggregates of domestically
produced goods and their imported counterparts, where the CES substitution elastic-
ity σidm reflects the extent to which imported goods are substitutable for the domestic
variety. As σidm → ∞, goods become homogeneous or perfect substitutes. We adopt
the Armington substitution elasticities σidm from the GTAP8 dataset, available from
Narayanan et al (2012). So the price of one unit of the Armington aggregate of good i
in region r will be given by equation (3):
PAi,r =[
βi,r · PD1−σi
dm
i,r + (1− βi,r) · PM1−σi
dm
i,r
]1
1−σidm (3)
14

PMi,r =
[
∑
s
δi,s · [PDi,s · (1 + τi,s,r)]1−σi
mm
]1
1−σimm
(4)
where βi is the share of domestically-produced i in a country/region’s use of i. The price
of one unit of the aggregate import of good i into region r PMi,r will be given by equation
(4), where τi,s,r reflects trade and transport margins associated with imports of good i
from region s into region r, and σimm = 2 · σi
dm is the substitution elasticity between
imports of good i from different regions. The CGE model is solved using MPSGE in
GAMS.
4 Counterfactual Results
The effects of international sanctions on trade with Iran are simulated using the CGE
data and model described in Section 3 by generating a counterfactual general equilibrium
in which trade between sanction countries in the aggregated region ‘SAN’ and Iran is
reduced consistent with the description of international sanctions in Section 2. The
desired reductions in sanction country imports from Iran are achieved by introducing
an endogenous tax on sanction country imports of oil, petroleum products and metals
from Iran. We also introduce an endogenous tax on ‘SAN’ exports to Iran of sanctioned
commodities, to reflect sanctions on exports of petroleum products and metals from
‘SAN’ to Iran. These endogenous taxes adjust until ‘SAN’ trade with Iran of sanctioned
commodities falls to 1−k of its level in the initial benchmark equilibrium. This allows us
to model successive tightening of sanctions on ‘SAN’ exports to Iran and ‘SAN’ imports
from Iran by increasing k ∈ (0, 1).
The effects of sanctions imposed by ‘SAN’ on trade with Iran are reported in Table
5 for successive tightening of sanctions from k = 0.25 of benchmark trade in sanctioned
commodities to k = 0.75. The data on Iranian oil exports reported in Table 1 suggest
that sanctions resulted in a reduction in Iranian oil exports of 54.0% from 2007 to 2013.
While most countries/regions in the aggregate ‘SAN’ region reduced oil imports from
Iran dramatically by the end of 2013, this was not the case for China, which accounted for
over 21% of benchmark Iranian oil exports.2 Katzman (2014:38) suggests that from 2011-
2013, Chinese oil imports from Iran fell by 20-25%. In the counterfactual equilibrium for
k = 0.75 (so that ‘SAN’ exports to Iran and imports from Iran of sanctioned commodities
fall by 75%), total Iranian oil exports by volume fall by 54.8%, so we choose k = 0.75
2Benchmark country/region trade shares for the disaggregated GTAP8 dataset for all sanctionedIranian exports and imports are reported in the Appendix in Table A-1 for countries/regions with tradeshares greater than 1.0%. Countries which are members of the ‘SAN’ region are preceded with an s
superscript.
15
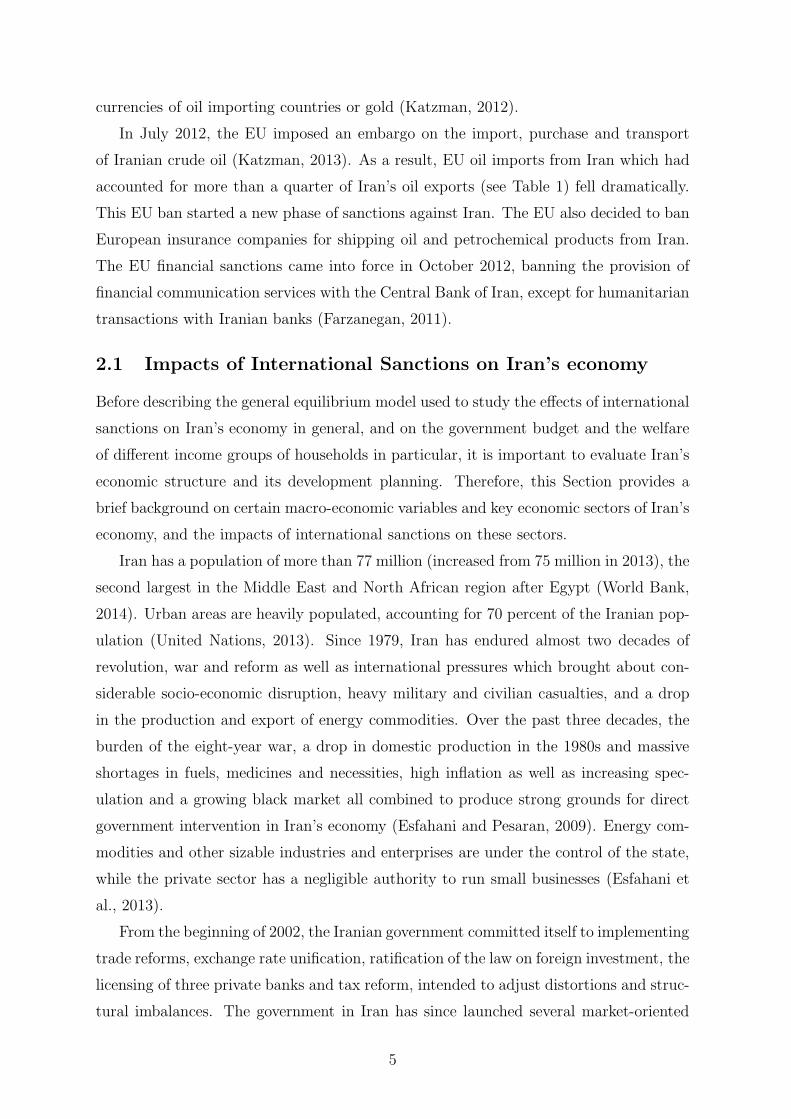
Welfare k=0.25 k=0.50 k=0.75urban1 −2.47 −4.00 −5.34urban2 −0.99 −1.51 −2.02urban3 −0.71 −1.04 −1.39urban4 −0.43 −0.57 −0.79urban5 −0.13 −0.06 −0.11urban6 −0.19 −0.18 −0.28urban7 0.12 0.34 0.41urban8 −0.05 0.05 0.02urban9 0.07 0.24 0.25urban10 −0.09 −0.04 −0.12
rural1 −4.42 −7.21 −9.63rural2 −1.91 −2.98 −4.04rural3 −0.86 −1.25 −1.76rural4 −0.10 0.06 −0.01rural5 0.25 0.65 0.78rural6 0.54 1.14 1.44rural7 1.13 2.13 2.74rural8 1.20 2.25 2.91rural9 1.38 2.53 3.27rural10 1.42 2.52 3.23
govt −21.93 −34.11 −41.85
Iran −4.39 −6.71 −8.27San −0.01 −0.06 −0.15RoW 0.15 0.31 0.49
Table 5: Welfare Effects of International Sanctions (%∆)
as representative of the level of sanctions that simulates changes in Iranian oil exports
which are broadly consistent with those actually observed.3
Table 5 shows that the sanctions had only a very small negative effect on welfare in
region ‘SAN’ which imposes sanctions. While ‘SAN’ welfare falls by 0.15%, the ‘RoW’
region which does not impose sanctions sees a welfare improvement of 0.49% of bench-
mark welfare, as they increase imports of sanctioned Iranian commodities, and increase
exports of sanctioned commodities (especially metal products and motor vehicles) to
Iran.4 But aggregate welfare in Iran falls by over 8%. The largest share of this change
3The default GTAP8 Armington elasticity which governs the substitutability between domestic andimported oil is 5.2. When we adopt this value, the ‘RoW’ region responds to international sanctionsof 75% of benchmark trade between Iran and ‘SAN’ with such a large increase in imports of Iranianoil that total Iranian oil exports fall by only 39.8%. This response in ‘RoW’ imports of Iranian oilseems inconsistent with that observed and reported in Table 1. To generate oil trade and productionchanges which are more consistent with those observed and reported in Table 1, we adopt an Armingtonelasticity for oil of 3.5. Specifically, we set σoil
dm = 3.5 and σoilmm = 7.0.
4Welfare effects are the percentage change in Hicksian equivalent variations, except for the govern-ment sector in Iran where they are changes in real aggregate government spending, and for Iran where
16

in welfare is accounted for by changes in government activity in Iran, which sees real
spending fall by almost 42%. This is due primarily to a decrease in rents earned from
government-owned factors employed in oil production. For example, rents earned by
natural resources in Iran (almost all of which are derived from ownership of natural
resources specific to the oil sector) fall by just over 69%.
While the government in Iran bears the largest share of the effects of international
sanctions, the lowest-income rural and urban households also fare poorly, with the lowest-
income rural and urban households experiencing a 9.3% and 5.3% welfare loss, respec-
tively. But sanctions cause resources to move out of oil production and into production
of agricultural commodities, so the real return to land increases. Since land is mostly
owned by rural households and since higher income rural households own more land,
the higher income rural households actually see an increase in welfare after the impo-
sition of international sanctions. Finally, international sanctions are focused on highly
capital-intensive energy and metals sectors, so the real return to capital in Iran falls
while the real return to labour rises, and the wage-rent ratio increases by almost 11%.
Since rural households derive relatively more income from the ownership of labour than
urban households who earn relatively more income from capital ownership, international
sanctions cause larger welfare losses on urban households than rural households for all
but the three lowest-income deciles.
In the counterfactual where the level of international sanctions is set at 75%, the trade
results are roughly consistent with those reported in Table 1. But in this counterfactual,
the production of oil in Iran falls by 19.5%, while the production data reported in Table
1 suggest that Iranian oil production fell by only 11.3% over the period 2007-2013.
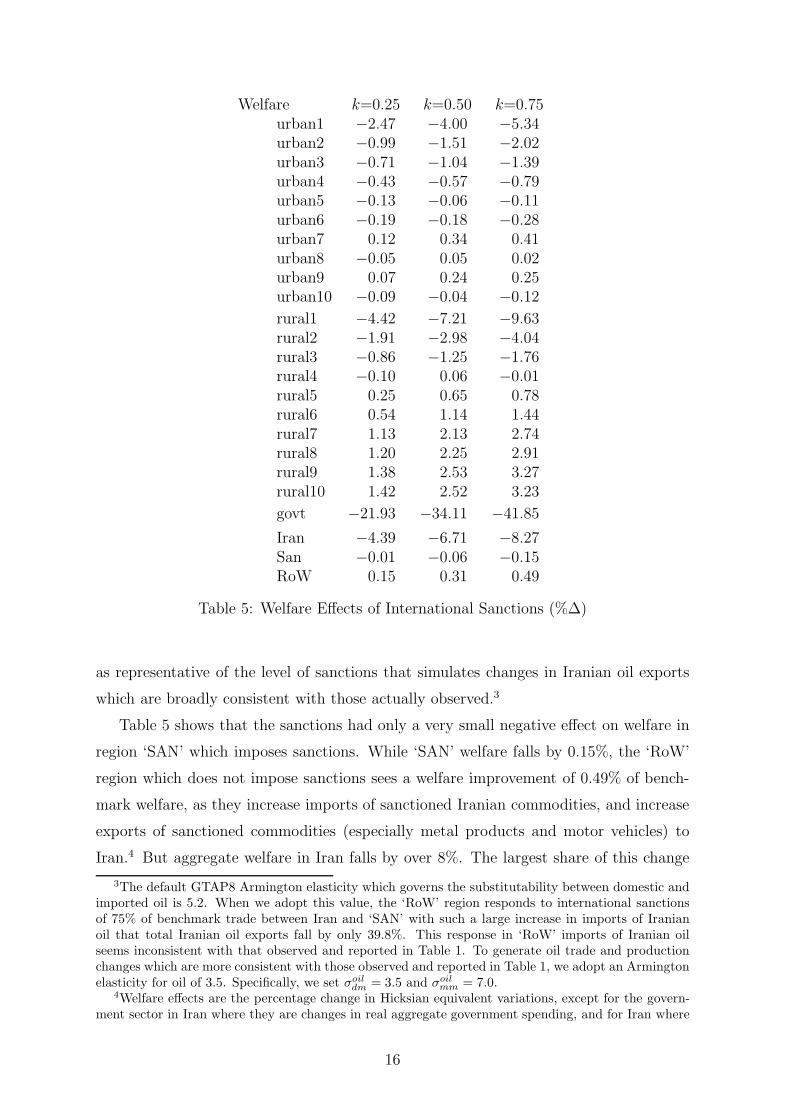
As noted in Section 2, there is evidence that the Iranian government purchased and
stockpiled oil from Iranian production facilities in response to international sanctions
on exports of Iranian oil. Results in Table 5 presume that no oil was stockpiled by
the Iranian government. To show the effects of this stockpiling behaviour, we re-run
the counterfactual simulations with the level of sanctions k = 0.75, assuming that the
Iranian government stockpiles a share s of the oil which would otherwise have been
purchased by sanction countries. Since it is difficult to find evidence on the volume
of oil stockpiled by the Iranian government, we run simulations for s = 0, 0.10, 0.20
and 0.30. That is, we assume that the Iranian government stockpiles s · k of the oil
which was purchased by sanction countries in the initial benchmark equilibrium. We
include an endogenous subsidy on government oil purchases which adjusts to the point
they are a weighted average of welfare changes for households and real aggregate government spending.
17
s=0.0 s=0.10 s=0.20 s=0.30urban1 −5.34 −5.58 −5.86 −6.16urban2 −2.02 −2.28 −2.57 −2.88urban3 −1.39 −1.68 −2.00 −2.34urban4 −0.79 −1.12 −1.47 −1.85urban5 −0.11 −0.45 −0.81 −1.20urban6 −0.28 −0.61 −0.96 −1.34urban7 0.41 0.06 −0.31 −0.72urban8 0.02 −0.31 −0.67 −1.05urban9 0.25 −0.05 −0.38 −0.74urban10 −0.12 −0.37 −0.65 −0.95
rural1 −9.63 −10.02 −10.44 −10.90rural2 −4.04 −4.59 −5.17 −5.80rural3 −1.76 −2.30 −2.88 −3.50rural4 −0.01 −0.61 −1.25 −1.93rural5 0.78 0.15 −0.53 −1.25rural6 1.44 0.81 0.14 −0.58rural7 2.74 2.08 1.38 0.63rural8 2.91 2.26 1.59 0.86rural9 3.27 2.65 1.99 1.29rural10 3.23 2.75 2.25 1.70
govt −41.85 −45.22 −48.64 −52.07
Iran −8.27 −9.23 −10.21 −11.23San −0.15 −0.15 −0.16 −0.17RoW 0.49 0.50 0.51 0.52
Table 6: Welfare Changes with Iranian Government Oil Stockpiling
where the government purchases s · k of the initial oil imports by ‘SAN’ countries. More
stockpiling requires larger government purchases of oil, which require larger values for
the endogenous subsidy. Since all tax revenue accrues to the government in Iran, this
endogenous subsidy is a direct cost to the government for stockpiling oil.
The welfare effects of stockpiling of oil by the Iranian government are reported in
Table 6, where the first column (s = 0) corresponds to the lats column in table 5. As
we would expect, oil stockpiling by the Iranian government has only the smallest effect
on regions ‘SAN’ and ‘RoW’. But as oil stockpiling increases from 0-30% of benchmark
oil imports by sanction countries, the decrease in aggregate welfare in Iran worsens from
almost 8.3% to over 11.2%. All households in Iran see larger welfare losses or smaller
welfare gains as the government stockpiles oil in response to international sanctions.
But again, the largest share of Iran’s welfare loss due to stockpiling is borne by the
government in Iran, as the decrease in real government spending in Iran worsens from
just under 42% with no stockpiling (s = 0) to over 52% with s = 0.30. Since the
18

Iranian government is effectively protecting its oil sector by subsidizing oil consumption
to stockpile oil, the price of oil in Iran does not fall by as much as when there is no
stockpiling, and real rents earned from natural resources in oil production do not fall
as far as they do without stockpiling. But this gain to government revenue (relative to
the counterfactual where there is no stockpiling) is much more than offset by the cost
of the subsidy to pay for the stockpiling of oil. For example, with s = 0.20, real natural
resource rents fall by $US18.5 billion compared to their level in the benchmark, while
they drop by almost $US20.9 billion with no stockpiling. But the cost of the subsidy to
stockpile oil is just over $US7.4 billion when s = 0.20, so real government spending falls
by considerably more when the Iranian government stockpiles oil.
5 Sensitivity Analysis
Since international sanctions are focussed directly on Iranian exports and imports, the
effects of international sanctions will be strongly affected by the way the central case
values for the Armington elasticity are set. To illustrate, we focus on the counterfactual
where the level of international sanctions is set at k = 0.75 and the level of Iranian
government stockpiling of oil is set at s = 0.20. We reset the value of the Armington
elasticity to 0.75 · σgtap8dm and 1.5 · σgtap8
dm , where σgtap8dm is the central case value for the
Armington elasticity adopted from the GTAP8 dataset. In each case, after resetting the
Armington elasticity, we reset the substitution elasticity between imports from different
regions to σmm = 2 · σdm.
Table 7 shows that changes to the specification of the Armington elasticity have very
little effect on welfare in the ‘SAN’ and ‘RoW’ regions. But increasing (decreasing)
the Armington elasticity improves (worsens) the welfare for all economic agents in Iran.
Changes in the Armington elasticity will have little effect on trade between Iran and
‘SAN’ countries since so much of this trade is controlled by sanctions. But cet. par.,
higher Armington elasticities will increase trade flows between Iran and the ‘RoW’ re-
gion. As a result, damage to the Iranian economy due to the strong negative effect of
international sanctions on Iran’s trade balance will be mitigated when the Armington
elasticity is increased.
The final example we use to illustrate sensitivity of welfare results considers the
mobility of capital in oil production. Oil production costs in Iran are due almost entirely
to capital costs and rents accruing to natural resources. Intermediate inputs and labour
account for slightly less than 3% and 1%, respectively, of the cost of producing of oil in
19

k = 0.75 s = 0.20
0.75 · σgtap8dm σ
gtap8dm 1.5 · σgtap8
dm
urban1 −10.38 −5.86 −2.35urban2 −5.51 −2.57 −0.37urban3 −4.84 −2.00 0.07urban4 −4.29 −1.47 0.55urban5 −3.37 −0.81 0.97urban6 −3.57 −0.96 0.88urban7 −2.74 −0.31 1.34urban8 −3.18 −0.67 1.08urban9 −2.62 −0.38 1.18urban10 −2.71 −0.65 0.82
rural1 −18.31 −10.44 −4.41rural2 −11.48 −5.17 −0.60rural3 −8.05 −2.88 0.80rural4 −5.95 −1.25 1.98rural5 −5.08 −0.53 2.53rural6 −4.05 0.14 2.91rural7 −2.39 1.38 3.80rural8 −1.94 1.59 3.82rural9 −1.21 1.99 4.00rural10 0.02 2.25 3.66
govt −51.76 −48.64 −45.27
Iran −13.02 −10.21 −8.02San −0.16 −0.16 −0.16RoW 0.55 0.51 0.48
Table 7: Sensitivity of Welfare Changes to Armington Elasticity σdm
Iran in the benchmark. Capital costs account for just over two-thirds of oil production
costs, while the remaining 28% of production costs accrue to natural resources. As
noted earlier, capital and natural resources in oil production in Iran are all owned by
the government, but while natural resources are modelled as a specific factor, capital is
treated as perfectly mobile. As a result of international sanctions, there is a large drop
in rents earned by natural resources. But since capital is modelled as being perfectly
mobile, large amounts of capital leave the oil sector. As a result, the decrease in the real
return to capital (-3.0% when k = 0.75 and s = 0.20) is much smaller than the decrease
in the real return to natural resources (-61.7%).
But it is arguable that at least some of the capital used in oil production is more
appropriately modelled as a specific factor, since it will have little or no productive
value in other sectors. Since such a large share of value-added in oil production (and of
government revenue in Iran) is accounted for by capital in oil production, it is important
20

to illustrate how results depend upon the treatment of capital in the oil sector. For
example, if we treat 20% of the capital which is initially used in oil production in Iran
as a specific factor, then this capital will not be able to flee the oil sector when the
introduction of international sanctions causes a large decrease in oil production in Iran.
The ensuing drop in the real return to mobile capital should be much smaller, and more
of the costs of the international sanctions will be borne by the immobile and specific
capital in the oil sector. More importantly, since such a large share of government
revenue depends upon rents from capital used in oil production, the share of the burden
of international sanctions borne by the government in Iran will increase, and that borne
by households in Iran will fall.
s=0.0 s=0.20all 20% all 20%
mobile specific mobile specificcapital capital capital capital
urban1 −5.34 −2.16 −5.86 −3.22urban2 −2.02 0.22 −2.57 −0.70urban3 −1.39 0.72 −2.00 −0.22urban4 −0.79 1.39 −1.47 0.37urban5 −0.11 1.87 −0.81 0.86urban6 −0.28 1.82 −0.96 0.81urban7 0.41 2.38 −0.31 1.36urban8 0.02 2.08 −0.67 1.08urban9 0.25 2.28 −0.38 1.33urban10 −0.12 1.88 −0.65 1.04
rural1 −9.63 −5.38 −10.44 −6.90rural2 −4.04 −0.97 −5.17 −2.58rural3 −1.76 0.94 −2.88 −0.59rural4 −0.01 2.15 −1.25 0.60rural5 0.78 2.80 −0.53 1.22rural6 1.44 3.27 0.14 1.73rural7 2.74 4.31 1.38 2.76rural8 2.91 4.37 1.59 2.88rural9 3.27 4.76 1.99 3.31rural10 3.23 4.82 2.25 3.63
govt −41.85 −48.09 −48.64 −53.78
Iran −8.27 −7.88 −10.21 −9.86San −0.15 −0.14 −0.16 −0.15RoW 0.49 0.47 0.51 0.50
Table 8: Welfare Changes with Specific Capital in Oil Production (%∆)
To demonstrate these concerns over the modelling of capital used in oil production
21

in Iran, we re-run the counterfactual where sanctions are set at k = 0.75 for central case
values of all other exogenously specified parameters (including Armington elasticities)
after assuming that 20% of the capital used in oil production in Iran is a specific factor.
Table 8 shows how welfare changes are affected by specification of capital mobility in the
oil sector in Iran. When some capital in oil production is modelled as a specific factor, all
households are better off, the government in Iran is worse off, and overall welfare in Iran
improves, compared to the case where all capital is perfectly mobile. With less capital
leaving the oil sector due to the imposition of international sanctions, the decrease in
the real return to capital is smaller. For example, with k = 0.75 and s = 0.20, the real
return to capital falls by only 0.5% when 20% of capital in oil production is specific,
while it falls by 3.0% when all capital is perfectly mobile. While the increase in the real
return to labour is also smaller when some capital in oil production is specific (5.0% with
some specific capital versus 5.7% with all mobile capital), the gain in the real return to
capital is much larger than the loss in the real return to labour, so households are all
much better off when 20% of the capital initially used in oil production is modelled as
being a specific factor.
With more specific factors in oil production, the elasticity of supply of oil is smaller,
so for a given level of international sanctions and government stockpiling of oil, the drop
in Iranian oil production is smaller. With k = 0.75 and s = 0.20, oil production and
exports fall by 15.6% and 59.3%, respectively, when all capital is perfectly mobile, while
they fall by 10.7% and 54.7% when some capital in oil production is specific. (The
corresponding values for the drop in Iranian oil production from 2007-2013 in Table 1
are 11.3% and 54.0%, respectively). The real return to the factors which are specific
to oil production (natural resources and 20% of the capital used to produce oil in the
benchmark) falls by less (55.5% when k = 0.75 and s = 0.20) than when all capital
is perfectly mobile (61.7% when k = 0.75 and s = 0.20). But total real government
revenue from 20% of the capital used in oil production is so much lower when this
capital is specific than when it is mobile that real government spending in Iran falls by
much more when some capital used in oil production is modelled as a specific factor.
6 Conclusion
In recent years, severe economic sanctions have been imposed by the US, the European
Union (EU) and other countries on Iran’s economy in an attempt to discourage the
government of Iran from continuing to engage in the development of a nuclear weapons
22

capability. This article analysed the welfare impact of comprehensive economic sanctions
on Iran’s economy in general and upon upper- and lower-income rural and urban Iranian
households, as well as the Iranian government. We used a Computable General Equi-
librium (CGE) model with data on production, consumption and trade from the Global
Trade Analysis Project (GTAP). The model used endogenous trade taxes to simulate
the effects of sanctions on Iranian oil exports and Iranian imports of petroleum products.
We augmented the GTAP8 dataset with information from the Statistical Centre of Iran
(SCI) to produce a microconsistent CGE model with 20 urban and rural households
disaggregated by income level.
Results suggest that the government in Iran bears the largest share of the effects of
international sanctions due to a decrease in rents earned from government-owned fac-
tors employed in oil production. The lowest-income rural and urban households also
fare poorly, while the sanctions had much more limited effects on the welfare of middle-
and upper-income rural and urban households. Tighter sanctions have a progressively
more negative effect on welfare in Iran, but particularly on the government. Results
also suggest that as oil stockpiling by the Iranian government increases in response to
international sanctions, the decrease in aggregate welfare in Iran worsens. However, the
sanctions had only a very small negative effect on welfare in region imposing sanctions,
while the remaining region which does not impose sanctions experiences a welfare im-
provement. Results also show that higher Armington elasticities make trade volumes
more responsive to a given level of international sanctions, dampening the negative ef-
fect on Iran’s trade balance. Furthermore, modelling some of the capital used in oil
production in Iran as a specific factor increases the burden of international sanctions
which is borne by the government in Iran, and improves the welfare of households and
of the overall economy relative to the case where all capital is perfectly mobile.
23

References
Abrams, E., R.D. Blackwill, R.M. Danin, R.A. Falkenrath, M. Kroenig, M.L. O’Sullivan
and R. Takeyh (2012), “Iran: the nuclear challenge”, Council on Foreign Relations.
Armington, P. (1969), “A Theory of Demand for Products Distinguished by Place of
Production”, IMF Staff Papers, 159–77.
Ataev, N. (2013), “Economic Sanctions and Nuclear Proliferation: The Case of Iran”,
Doctoral dissertation, Central European University.
Baldwin, D.A. (1985), Economic Statecraft, Princeton University Press.
Burnieaux, J-M. and T. Truong (2002), “GTAP-E: An Energy-Environmental Version
of the GTAP Model”, GTAP Technical Paper No.16.
Central Bank of Iran (2004), “Household Budget Survey In Urban Areas in Iran”,
Economic Statistics Department.
Central Bank of Iran (2010), Annual National Accounts of Iran, available from:
http://www.cbi.ir/section/1372.aspx. (May 11 2011).
Cortright, D., A. Millar, G.A. Lopez and L. Gerber (2001), Smart Sanctions: Restruc-
turing UN Policy in Iraq, Joan B. Kroc Institute.
Devarajan, S. and L. Mottaghi (2014), Middle East and North Africa Quarterly Eco-
nomic Brief - Growth Slowdown Heightens the Need for Reforms, World Bank Pub-
lications.
Drezner, D.W. (1999), The Sanctions Paradox: Economic Statecraft and International
Relations, Cambridge University Press.
Drury, A. and Y. Li (2006), “US Economic Sanction Threats Against China: Failing to
Leverage Better Human Rights”, Foreign Policy Analysis 2, 307-324.
Elliott, K.A. (1998), “The Sanctions Glass: Half Full or Completely Empty?” Interna-
tional Security 23, 50-65.
Esfahani, H.S., K. Mohaddes and M.H. Pesaran (2013), “Oil Exports and the Iranian
Economy”, Quarterly Review of Economics and Finance 53, 221-237.
Esfahani, H.S. and M.H. Pesaran (2009), “The Iranian economy in the twentieth century:
A global perspective”, Iranian Studies 42(2), 177-211.
Farzanegan, M. R. (2011), “Oil Revenue Shocks and Government Spending Behavior in
Iran”, Energy Economics, 33(6), 1055-1069.
Galtung, J. (1967), “On the Effects of International Economic Sanctions”, World Politics
19, 378-416.
Gharibnavaz, M.R. and R. Waschik (2014), “A General Equilibrium Analysis of Alterna-
24

tive Scenarios for Food and Energy Subsidy Reforms in Iran”, La Trobe University
Working Paper 4-14.
Hufbauer, G.C. and J.J. Schott (2006), Can Sanctions Stop the Iranian Bomb? ,
Washington, DC: Peterson Institute for International Economics, available from
www.iie.com/publications/papers/paper.cfm.
Hufbauer, G.C., J.J. Schott and K.A. Elliott (1990), Economic Sanctions Reconsidered:
History and Current Policy, Washington, DC: Peterson Institute.
Hufbauer, G.C., J.J. Schott, K.A. Elliott, J. Muir and M. Cosic (2012), “Case 2006-1
UN, US [EU] v. Iran (2006 Proliferation)”, Case Studies in Economic Sanctions and
Terrorism, Washington, DC.
Hufbauer, G.C., J.J. Schott, K.A. Elliott and B. Oegg (2007), Economic Sanctions
Reconsidered, Institute for International Economics, Washington DC.
International Energy Agency (2012), “World Energy Outlook”.
International Energy Agency (2013), “Monthly Oil Market Report”.
International Monetary Fund (2014), “World Economic Outlook Database”.
Institute for International Economics (2002), Chronological Summary of Economic
Sanctions for Foreign Policy Goals, available from: http://www.iie.com/research/
topics/sanctions/sanctions-summary.htm (Ed.).
Katzman, K. (various years), Iran Sanctions, CRS Report for Congress.
Lee, TaeSoo (2004), “The Dynamics of the Oil Tanker Industry”, Massachusetts Institute
of Thechnology, 1-23, available from http://hdl.handle.net/1721.1/17807.
Lopez, G.A. and D. Cortright (1997), “Economic Sanctions and Human Rights: Part of
the Problem or Part of the Solution?”, International Journal of Human Rights 1,
1-25.
Mann, J. (2013), “Floating Oil Storage: A Means to Increase Profits or Evidence of the
Effectiveness of the Embargo on Iran?”, Journal of Maritime Research 10(1), 13-8.
Monshipouri, M. and M. Dorraj (2013), “Iran’s Foreign Policy: A Shifting Strategic
Landscape”, Middle East Policy 20, 133-147.
Narayanan, G., Badri, Angel Aguiar and Robert McDougall (eds) (2012), Global Trade,
Assistance, and Production: The GTAP 8 Data Base, Center for Global Trade
Analysis, Purdue University.
O’Sullivan, M.L. (2010),“Iran and the great sanctions debate”, The Washington Quar-
terly 33, 7-21.
OPEC, “Annual Statistical Bulletin”, various years.
Pape, R.A. (1997), “Why economic sanctions do not work”, International Security 22,
25
90-136.
Pape, R.A. (1998), “Why economic sanctions still do not work”, International Security
23, 66-77.
Patterson, R. (2013), “EU sanctions on Iran: the European political context”, Middle
East Policy 20(1), 135-146.
Plaut, S. (2013), “The Collapse of Iran’s Rial”, Gatestone Institute, International Policy
Council.
Pollack, K. and R. Takeyh (2005), “Taking on Tehran”, Foreign Affairs 84, 20.
Schott, J.J. (2012), “Economic Sanctions Against Iran: Is the Third Decade a Charm?”,
Business Economics 47, 190-192.
Statistical Centre of Iran (2005), “Urban and Rural Household Income and Expenditure
Survey - 2004”, Tehran: Statistical Centre of Iran.
U.S. Energy Information Administration (2013), “Country Analysis Briefs: Iran”, Wash-
ington, DC, available from: http://www.eia.gov/countries/analysisbriefs/Iran/iran.pdf.
United Nations (2013), Statistical Yearbook for Asia and the Pacific. The Economic
and Social Commission for Asia and the Pacific (ESCAP), available from: http:
//www.unescap.org/stat/data/syb2013/escap-syb2013.pdf.
United Nations Development Program (2011), “Human Development Report-2003”,
UNDP ***.
Van de Graaf, T. (2013), “The ‘Oil Weapon’ Reversed? Sanctions Against Iran and
US-EU Structural Power”, Middle East Policy 20, 145-163.
Weiss, T.G. (1999), “Sanctions as a Foreign Policy Tool: Weighing Humanitarian
Impulses”, Journal of Peace Research 36, 499-509.
Weiss, T.G., D. Cortright, G.A. Lopez and L. Minear (1997), Political Gain and Civilian
Pain, Lanham, Rowman & Littkefield.
World Bank (2014), Islamic Republic of Iran, Country at a Glance, available from:
http://www.worldbank.org/en/country/iran.
26

Appendix
Iran Exports to Iran Imports fromoil p c met p c met mvh
sChina 21.33 41.14 9.94 4.71 16.80 22.45sJapan 25.99 9.77 2.18 2.12 7.35sKorea Republic of 9.06 2.49 7.75 13.71sTaiwan 20.56 3.19 3.33 1.63sMalaysia 1.20sSingapore 1.05 6.80 2.71Thailand 1.23sIndia 7.12 8.96 24.41 3.10 1.01Pakistan 2.61Rest of South Asia 2.89sUnited States of America 1.02Argentina 1.13Brazil 1.57sBelgium 2.47 1.43sFrance 9.91 2.07 3.66 19.25sGermany 1.71 8.50 8.82sItaly 12.12 7.07 3.54 3.23sNetherlands 1.73sSpain 2.50 1.29 2.99sSweden 1.12sUnited Kingdom 2.17 1.24sSwitzerland 2.41sRomania 1.61Russian Federation 12.65Ukraine 1.72Kazakhstan 2.78 4.67Rest of Former Soviet Union 1.98 3.57Armenia 1.40 1.38Azerbaijan 1.34 12.42Kuwait 3.47Qatar 1.24Saudi Arabia 6.29 1.63sTurkey 1.33 5.49 3.29 2.62United Arab Emirates 3.64 9.17 40.75 9.83 5.23Rest of Western Asia 1.44 9.47Egypt 1.16Ethiopia 1.63sSouth Africa 5.19
Table A-1: Benchmark GTAP8 Country/Region Trade Shares with Iran
27