Embed Size (px)
Citation preview
X Capital Partners
Alex Glisan | Corey Roach | Josh Restauri | Quinn Cunningham16 March 2016

Welcome

3
Meet Our Team
Alex GlisanInvestment Analyst
Undergraduate Student, SMIP, Energy Sector Analyst
Josh RestauriInvestment Analyst
Undergraduate Student, SMIP, Energy Sector Lead
Quinn CunninghamInvestment Analyst
Undergraduate Student, SMIP, Energy Sector Analyst
Corey RoachInvestment Analyst
Undergraduate Student, SMIP, Technology Sector Lead

4
Table of Contents
Agenda Page 5
Investment Recommendation Page 6
IT Services Overview Page 13
SSIT Overview Page 14
Integrate Overview Page 15
ITGroup Deal Structure Page 17
Integrate Deal Structure Page 18
Exit Strategies Page 19
Other Strategies Page 22
Risk Management Page 30
Deal Summary Page 32
Appendices Page 35

5
Agenda
1 Investment Recommendation
Company Overview
Appendices
Exit Strategies
Deal Structures
2
7
6
5
4
3
Risk Management
8
Deal Summary
Other Strategies

Investment Recommendation

7
Combine Strategy 1 and 2
Buy IT Group for $1090 using $562.33 in equity
Buy Integrate for $550 using %320 in equity
Sell IT Services at an EBITDA multiple of 11.5x
Sell Integrate and SSIT at an EBITDA multiple of 10x
Generate an IRR of 31.46%
Generate cash of $2,350

8
Our ChoiceThe Best Strategy for Us
1 Buy IT Group
Year end 2015

9
2Buy Integrate
Year End 2015
Combine Integrate
and SSITSplit IT Group
IT ServicesSSIT

10
3
Enhance Value
Realize synergies from combination
Pay-down debt with excess cash-sweep
Explore additional growth opportunities

11
4Exit Investment: Sell
Split businesses

Company Overview

13
IT Services
IT consulting and related services
Project management
Cloud services
Network security
Comprises of 80% of ITGroups revenue
Total sales of $537,800,000 in 2015

14
SSIT
Manufacturer of semiconductors and accessories
Integrated circuits
Memory chips
Microprocessors
Total sales of $86,900,000 in 2015

15
Integrate Co.
Value add manufacturing company
Transforms semiconductor into final product
Product use includes consumer and commercial electronics
New investment in “Project X”
Total sales of $182,100,000 in 2015

Deal Structures

416.4
111.120
562.33
Sources
Senior Debt
Mezzanine Debt
Revolver
Sponsor Equity
1090
19.83
Uses
Purchase of Equity
TransactionExpenses, Total
Transaction Value
$1,110,000,000
Deal Structure: IT Group

223.2
7
327.2
Sources
Senior Debt
Revolver
Sponsor Equity
550
5.5 4.6
Uses
Uses
Purchase of Equity
Transaction expense@ 1%
Financing Expense @2%
Transaction Value
$560,000,000
Deal Structure: Integrate

Exit Strategies

20
IT Service + SSIT IntegrateEntrance: YE2015 - Exit: YE2020
547230 330 330 330
562
320
2275 2350 2424
10 10 EXIT @ 11.0 / 10.0
11.5 /10.0 12.0 /10.0
IT Group: $1090
Integrate: $550
Offer Price
EBITDA Multiples
IRR 30.51% 31.469% 32.38%
IT Group
Integrate
ENTER @

21
Our Strategy
1
2
Cons
Growth could flatten or decrease
Large amount of capital
Pros
1
2
3
Attractive IRR
Large amount of cash generated
Less risk due to lower leverage

Other Strategies

23
Strategies PresentedDifferent Strategies Models
Exploring Strategies
Option 1
Option 3
Option 2
Strategy 1
Buy IT Group
Strategy 3
Provide Mezzanine debt in Purchase of IT Group.
Strategy 2
Buy SSIT and combine with Integrate Co.

24
Strategy 1Entrance: YE2015 - Exit: YE2020
547241 241
5621328 1406
10X EXIT @ 10X 10.5X
$1090
Offer Price
EBITDA Multiples
IRR 18.75% 20.12%
ENTER @

25
Strategy 1
1
2
3
Cons
Least cost synergies
Little growth for SSIT
Pros
1
2
3
4 More field locations
Attractive return
Increased national presence
Most conservative strategy
Flattened or decreased sales growth
Buy IT group as a whole.

26
Strategy 2Entrance: YE2015 - Exit: YE2020
23013 13
364885 930
10X 10X 10.5 X
Integrate: $550 SSIT: $44.1
Offer Price
EBITDA Multiples
IRR 26.24% 27.50%
Integrate and SSIT
ENTER @

27
Strategy 2
1
2
Cons
Revenue growth expected to decrease
Possible management uncertainty
Pros
1
2
3
4 Both can close at the same time
Integrate makes SSIT more effective
Large cash flow potential (Project X)
Most cost synergies
Buy SSIT Services and combine with Integrate Co.

28
Strategy 3Entrance: YE2015 - Exit: YE2018, YE2019, YE2020
$87
Cash Used
IRR 32.41%
2018
26.85%
20202019
24.12%
EXIT 2018
-87 11.31 137.55
EXIT 2019
-87 11.31 11.31 145.023
EXIT 2020
-87 11.31 11.31 11.31 153.3955

29
Strategy 3
1
2
Cons
Highest amount of risk
High interest rate
Pros
1
2 Attractive return
Highest IRR of the options
Provide Mezzanine Debt with the purchase of IT Group
3 Chance of bankruptcy with high leverage ratio

Risk Management

31
Possible Risks
Revenue growth could flatten or decline in the industry.
Expected multiples could decrease.
Would have to exit early upon the downturn in the industry.
Exit contingent on expectation of exit multiples.
Mitigation of Risks

Deal Summary
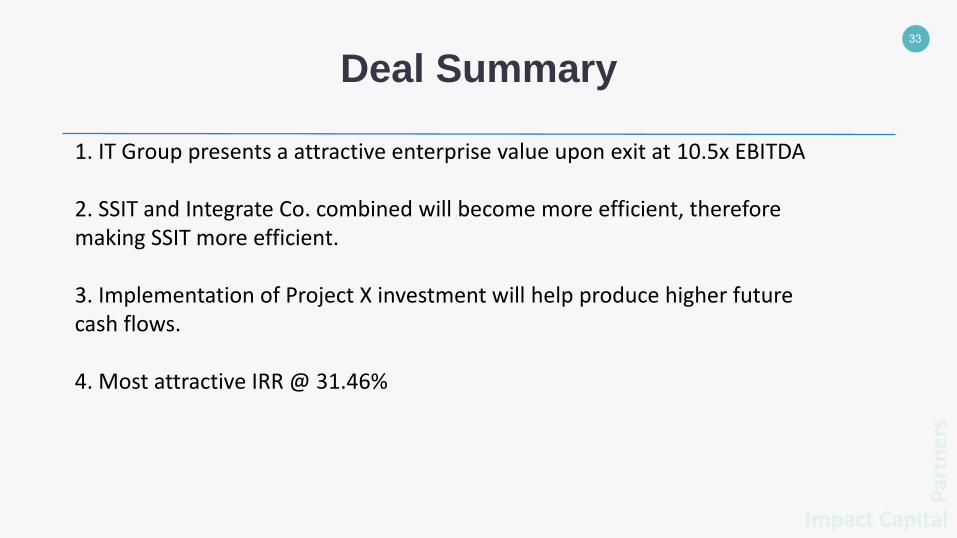
33
Deal Summary
1. IT Group presents a attractive enterprise value upon exit at 10.5x EBITDA
2. SSIT and Integrate Co. combined will become more efficient, therefore making SSIT more efficient.
3. Implementation of Project X investment will help produce higher future cash flows.
4. Most attractive IRR @ 31.46%
Impact Capital
Par
tne
rs

We appreciate your time
Contact Us:
Thank you for this Opportunity

AppendicesSupporting Material

36
Appendices Contents
ITGroup Cash Flow Page 37
ITGroup Debt Schedule Page 38
IT Services Cash Flow Page 39
IT Services Debt Schedule Page 40
IT Services + Integrate Cash Flow Page 41
IT Services + Integrate Debt Schedule Page 42

37
ITGroup Cash Flow
2016P 2017P 2018P 2019P 2020PSales $687.8 $762.8 $808.6 $857.1 $908.5
$0.0 $0.0 $0.0Cost of Goods Sold 556.5 610.3 $646.9 $685.7 $726.9
$0.0 $0.0 $0.0Gross Profit $131.38 $152.56 $161.7 $171.4 $181.7Total Operating Expenses $21.0 $21.8 $23.1 $24.5 $26.0Operating Income $110.4 $130.7 $138.5 $146.9 $155.7Interest Expense, Net 2.5 2.5 $2.7 $2.8 $3.0Other (Income) / Expenses 1.5 1.5 $1.6 $1.7 $1.8EBT $106.5 $126.8 $134.4 $142.5 $151.0Income Taxes (1) 42.6 50.7 $53.7 $57.0 $60.4Net Income Available to Common $63.9 $76.1 $80.7 $85.5 $90.6
$0.0 $0.0 $0.0Plus: Taxes $42.6 $50.7 $53.7 $57.0 $60.4Plus: Interest Expense 2.5 2.5 $2.7 $2.8 $3.0Plus: Depreciation & Amortization 2.2 2.4 $2.5 $2.7 $2.9Adjusted EBITDA $111.1 $131.7 $139.6 $148.0 $156.9Adjusted EBITDA Margin 16.2% 17.3% $0.2 $0.2 $0.2
$0.0 $0.0 $0.0Capital Expenditures $6.4 $7.0 $7.4 $7.9 $8.3(1) Assuming 40% tax rate.
Net Income Available to Common 63.9 76.1 80.666 85.50596 90.63632
Plus: Depreciation & Amortization 2.2 2.4 $2.5 $2.7 $2.9
Capital Expenditures 6.4 7 7.42 7.8652 8.337112Unlevered Cash Flow 59.7 71.5 75.79 80.3374 85.15764
Interest Expense 42.7767 38.58383 33.55029 27.96055804 21.77248After-Tax Interest 25.66602 23.1503 20.13017 16.77633483 13.06349
Levered Free Cash 42.58932 56.06647 62.36988 69.15317678 76.44865

38
ITGroup Debt Schedule
2016P 2017P 2018P 2019P 2020P
Levered Free Cash 42.58932 56.06647 62.36988 69.15317678 76.44865
Beginning Balance 416.625 384.683 342.6332 295.8557476 243.9909
Mandatory cash Sweep @ 75% 31.94199 42.04985 46.77741 51.86488259 57.33649
End Balance 384.683 342.6332 295.8557 243.990865 186.6544
Average Balance 400.654 363.6581 319.2445 269.9233063 215.3226
Interest Expense @7% 28.04578 25.45607 22.34711 18.89463144 15.07258
Beginning Balance 111.1 100.4527 86.43605 70.84358252 53.55529
Optional Cash Sweep 10.64733 14.01662 15.59247 17.2882942 19.11216
End Balance 100.4527 86.43605 70.84358 53.55528833 34.44313
Average Balance 105.7763 93.44436 78.63982 62.19943542 43.99921
End Balance 13.75092 12.14777 10.22318 8.085926605 5.719897
Beginning Balance 20 20 20 20 20
End Balance 20 20 20 20 20
Interest Expense @7% 0.98 0.98 0.98 0.98 0.98

39
IT Services Cash Flow
2016P 2017P 2018P 2019P 2020P
Sales 596.6 667 707.02 749.4412 794.4077
Cost of Goods Sold 479.3 530 561.8 595.508 631.2385
Gross Profit 117.38 137.06 145.2836 154.0006 163.2407
Total Operating Expenses 12.2 12.2 12.932 13.70792 14.5304
Operating Income 105.1 124.8 132.288 140.2253 148.6388
Interest Expense, Net 1.3 1.4 1.484 1.57304 1.667422
Other (Income) / Expenses 1.5 1.5 1.59 1.6854 1.786524
EBT 102.5 122 129.32 137.0792 145.304
Income Taxes (1) 41 48.8 51.728 54.83168 58.12158
Net Income Available to Common 61.5 73.2 77.592 82.24752 87.18237
Plus: Taxes 41 48.8 51.728 54.83168 58.12158
Plus: Interest Expense 1.3 1.4 1.484 1.57304 1.667422
Plus: Depreciation & Amortization 1.2 1.3 1.378 1.46068 1.548321
Adjusted EBITDA 104.8 124.7 132.182 140.1129 148.5197
Adjusted EBITDA Margin 0.093 0.1 0.106 0.11236 0.119102
Capital Expenditures 3.4 3.3 3.498 3.70788 3.930353
Net Income Available to Common 61.5 73.2 77.592 82.24752 87.18237
Plus: Depreciation & Amortization $1.200 $1.300 $1.378 $1.461 $1.548
Capital Expenditures 3.4 3.3 3.498 3.70788 3.930353
Unlevered Cash Flow 59.3 71.2 75.472 80.00032 84.80034
Interest Expense 42.794 38.63199 33.62683 28.06807 21.91373
After-Tax Interest 25.6764 23.17919 20.1761 16.84084 13.14824
Levered Free Cash 42.1824 55.7472 62.02127 68.77309 76.03485

40
IT Services Debt Schedule
2016P 2017P 2018P 2019P 2020P
Levered Free Cash 42.1824 55.7472 62.02127 68.77309 76.03485
Beginning Balance 416.625 384.9882 343.1778 296.6618 245.082
Mandatory cash Sweep @ 75% 31.6368 41.8104 46.51595 51.57982 57.02613
End Balance 384.9882 343.1778 296.6618 245.082 188.0559
Average Balance 400.8066 364.083 319.9198 270.8719 216.569
Interest Expense @7% 28.05646 25.48581 22.39439 18.96104 15.15983
Beginning Balance 111.1 100.5544 86.6176 71.11228 53.91901
Optional Cash Sweep 10.5456 13.9368 15.50532 17.19327 19.00871
End Balance 100.5544 86.6176 71.11228 53.91901 34.9103
Average Balance 105.8272 93.586 78.86494 62.51565 44.41465
Interest Expense @7% 13.75754 12.16618 10.25244 8.127034 5.773905
Beginning Balance 20 20 20 20 20
End Balance 20 20 20 20 20
Interest Expense @7% 0.98 0.98 0.98 0.98 0.98

41
SSIT + Integrate Cash Flow
2016P 2017P 2018P 2019P 2020PSales 292.80 315.30 334.22 354.27 375.53Cost of Goods Sold 192.10 205.60 217.94 231.01 244.87Synergies -1.90 -2.10 -2.23 -2.36 -2.50Gross Profit 100.7 109.70 116.28 123.26 130.65
102.6 111.8 118.51 125.62 133.16Total Operating Expenses 32.20 34.40 36.46 38.65 40.97Synergies 0.60 0.60 0.64 0.67 0.71Operating Income 71.00 78.00 82.68 87.64 92.90Interest Expense, Net 2.20 2.10 2.23 2.36 2.50Other (Income) / Expenses 1.30 1.30 1.38 1.46 1.55EBT 67.50 74.60 79.08 83.82 88.85Income Taxes (1) 26.00 28.70 30.42 32.25 34.18Net Income Available to Common 41.50 45.90 48.65 51.57 54.67Project X $10.00 11 12.1 13.31New Net Income 41.50 55.90 59.65 63.67 67.98Plus: Taxes 26.00 28.70 30.14 31.64 33.22Plus: Interest Expense 2.20 2.10 2.21 2.32 2.43Plus: Depreciation & Amortization 3.30 3.60 3.78 3.97 4.17Adjusted EBITDA 70.60 77.50 81.38 85.44 89.72Capital Expenditures 5.50 6.40 6.72 7.06 7.41(1) Assuming 40% tax rate.New Net Income 41.50 55.90 59.65 63.67 67.98Plus: Depreciation & Amortization 3.30 3.60 3.78 3.97 4.17Capital Expenditures 5.5 6.4 6.72 7.056 7.4088
Unlevered Cash Flow 39.30 53.10 56.71 60.59 64.74
Interest Expense 14.97604 12.55476 9.550847 6.249185 2.62646After-Tax Interest 8.985624 7.532854 5.730508 3.749511 1.575876Levered Free Cash 33.31 48.08 52.89 58.09 63.69

42
SSIT + Integrate Debt Schedule
2016P 2017P 2018P 2019P 2020P
Levered Free Cash 33.31 48.08 52.89 58.09 63.69
Beginning Balance 223.2 194.8869 154.0205 109.0609 59.68728
Mandatory cash Sweep @ 75% 28.31 40.87 44.96 49.37 54.13
End Balance 194.8869 154.0205 109.0609 59.68728 5.554432
Average Balance 209.0434 174.4537 131.5407 84.37407 32.62085
Interest Expense @7% 14.63304 12.21176 9.207847 5.906185 2.28346
Beginning Balance 7 7 7 7 7
Ending Balance 7 7 7 7 7
Interest Expense 0.343 0.343 0.343 0.343 0.343