Embed Size (px)
Citation preview

Accurate, Fine-Grained Classification of P2P-TVApplications by Simply Counting Packets
Silvio Valenti1, Dario Rossi1, Michela Meo2, Marco Mellia2, and Paola Bermolen1
1 TELECOM ParisTech, [email protected]
2 Politecnico di Torino, [email protected]
Abstract. We present a novel methodology to accurately classify the traffic gen-erated by P2P-TV applications, relying only on the count of packets they ex-change with other peers during small time-windows. The rationale is that even araw count of exchanged packets conveys a wealth of useful information concern-ing several implementation aspects of a P2P-TV application – such as networkdiscovery and signaling activities, video content distribution and chunk size, etc.By validating our framework, which makes use of Support Vector Machines, on alarge set of P2P-TV testbed traces, we show that it is actually possible to reliablydiscriminate among different applications by simply counting packets.
1 Introduction
The Internet proved to have an amazing capability of adapting to new services, migrat-ing from the initial pure datagram paradigm to a real multi-service infrastructure. Oneof the most recent steps of this evolution is constituted by P2P-TV, i.e., large-scale real-time video-streaming services which exploit the peer-to-peer communication paradigm,and already count millions of users worldwide.
As such, the identification of P2P-TV applications is a topic of undoubted interest,which has not been addressed yet, despite the valuable effort already devoted to the taskof traffic classification [1,2,3,4,5,6,7,8,9]. In this field behavioral classification [1,2]is a novel approach which aims at identifying the traffic generated by network hosts orend-points by the sole examination of their traffic patterns (e.g. number of hosts con-tacted, transport layer protocol employed, number of different ports used, etc.). Thisapproach is very light-weight, as it requires neither the inspection of packet payloadas in [3, 4], nor operations on a per-packet basis as in [7, 8]. However, so far, behav-ioral classification has been able only to discriminate broad application classes (e.g.,interactive, P2P, Web, etc.) rather than different applications within the same class.
This work is the first to propose a fine-grained classification engine which only ex-ploits behavioral characteristics – namely, the count of packets exchanged by peersduring small time-windows. Our framework, which is tailored for P2P-TV applicationssuch as PPLive, SopCast, TVAnts and Joost1, makes use of the Support Vector Ma-chines. We validate the engine by means of a large and diverse set of traces collected
1 Since October 2008 Joost is no more using P2P to deliver video content.
M. Papadopouli, P. Owezarski, and A. Pras (Eds.): TMA 2009, LNCS 5537, pp. 84–92, 2009.c© Springer-Verlag Berlin Heidelberg 2009
Accurate, Fine-Grained Classification of P2P-TV Applications 85
over a pan-European testbed: experimental results show that it is possible to discrimi-nate among different P2P-TV applications by simply counting packets – as true positiveclassification accounts to more than 81% of packets, bytes and peers in the worst case.
2 Classification Framework
The RationaleOur aim is to classify P2P-TV end-points, identified by a network address and transportlayer port pair (IP, port). Typically, a P2P-TV application running on a given IP hostmultiplexes signaling and video traffic exchanged with other peers on a single port.We assume our engine to be situated at the edge of the network, where all the trafficexchanged by a given end-point transits. Furthermore, we restrict our attention to UDPtraffic only, as it is the transport layer protocol preferred by P2P-TV applications.
Since UDP is a connectionless transport protocol, we cannot exploit any kind offlow semantic to perform the classification. As such, we rely solely on the count ofpackets a P2P-TV application exchanges with other peers during small time-windows.Indeed, we advocate that application signatures based on the raw packet count conveya wealth of useful information, tied to several design aspects of an application (i.e.,overlay discovery and signaling activities, video diffusion policy, etc.).
A human analogy may help in clarifying this intuition. Let us compare peers in thenetwork to people in a party room: human beings have rather different attitudes andbehaviors, just as peers do. For instance, somebody prefers lengthy talks with a fewfriends: similarly, some application tends to keep exchanging data with the same peersas long as possible. Somebody else, on the contrary, may prefer to briefly chat with alot of people, just like applications with an intense network discovery activity and adynamic diffusion of the video content would do.
Furthermore P2P-TV applications exchange the video stream in chunks, i.e., mini-mum units of data with a fixed length, that are thus transferred with the same numberof packets: since each application independently selects its own chunk size, differencesin this choice will be reflected by the raw packet count.
Finally, in the following we consider only the downlink traffic direction. Indeed, wepoint out that P2P-TV applications need a rather steady downlink throughput to ensurea smooth playback: in fact, it has been observed that while peers consume equally, theydo not contribute equally [11] to the video diffusion. Therefore, we expect the downlinktraffic direction alone to convey all the needed information for a correct classification.
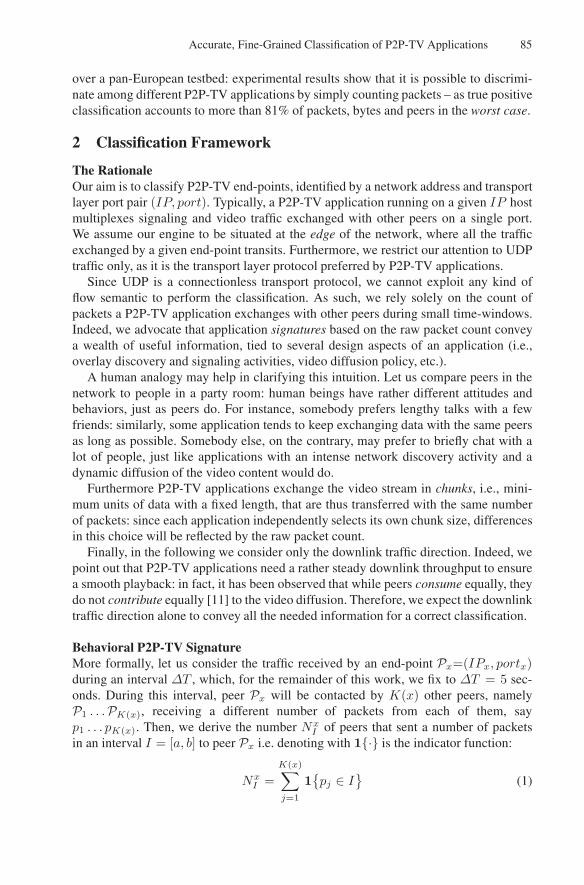
Behavioral P2P-TV SignatureMore formally, let us consider the traffic received by an end-point Px=(IPx, portx)during an interval ΔT , which, for the remainder of this work, we fix to ΔT = 5 sec-onds. During this interval, peer Px will be contacted by K(x) other peers, namelyP1 . . .PK(x), receiving a different number of packets from each of them, sayp1 . . . pK(x). Then, we derive the number Nx
I of peers that sent a number of packetsin an interval I = [a, b] to peer Px i.e. denoting with 1{·} is the indicator function:
NxI =
K(x)∑
j=1
1{pj ∈ I
}(1)

86 S. Valenti et al.
0
0.2
0.4
0.6
0.8
1A
bacu
s si
gnat
ure
com
pone
nt
nx i(t
)
Experiment Time [ΔT steps]
Joost
n6
SopCast
n4
TVants
n1
PPlive
n0
(a)
0 0.1 0.2 0.3
0 1 2 3 4 5 6 7 8
of m
ean
abac
us s
igna
ture
− n i
Bin identifier
PPLive 0
0.1 0.2 0.3 TVAnts
0 0.1 0.2 0.3 SopCast
0 0.1 0.2 0.3
1 2 4 8 16 32 64 128 ∞Maximum number of packets
Joost
(b)
Fig. 1. Abacus signatures of P2P-TV application: (a) temporal evolution and (b) mean value
In particular we use B + 1 intervals of exponential width {I0, . . . , Ii, . . . , IB} suchthat I0 = (0, 1], Ii = (2i−1, 2i], and IB = (2B,∞]. In other words, Nx
i = NxIi
willcount the number of peers sending to Px a number of packets in the interval (2i−1, 2i],while Nx
B = NxIB
will count all peers sending at least 2B packets to Px. As previouslyexplained, we expect that if the application performs network discovery by means ofsingle packet probes and uses C = 16 packet long chunks, there will be a large numberof peers falling into the Nx
0 and Nx4 bins. For each time interval ΔT , we then build a
behavioral signature nx = (nx0 , . . . , nx
B) ∈ RB+1, by normalizing Nx
i over the totalnumber K(x) of peers that contacted Px during that interval:
nxi =
Nxi∑B
b=0 Nxb
=Nx
i
K(x), and |nx| =
B∑
i=0
nxi = 1 (2)
Since signature nx has been derived from a pure count of the number of exchangedpackets, we name it abacus (shorthand for “automated behavioral application classifi-cation using signatures”). An example of the temporal evolution of abacus signaturesnx(t) is given in Fig. 1-(a). considering the behavior of an arbitrary peer Px during1-hour long experiment for the four different applications. Time of the experiment runson the x-axis in multiples of ΔT , whereas y-axis reports the cumulative abacus signa-ture, using different fading colors for different bins. Bins are ordered from bottom totop, so that bin number 0 (which is the darkest one), starts at the bottom of the y-axisscale and extends until nx
0 . Subsequent bins are then incrementally staggered (with pro-gressively lighter colors), so that the k-th bin starts at
∑k−1i=0 nx
i and the last bin extendsuntil |nx| = 1.
Already at a first glance, we notice that for any given application one bin (which islabeled in the picture) is remarkably wider than the others. Moreover, while the widestbin differs across applications, it keeps roughly the same for any given application, dur-ing most of the experiment duration, despite its actual width changes over time. Thiscan be more easily gathered by comparing the mean per-application signature, aver-aged over all time intervals, reported in Fig. 1-(b). for instance, during a 5-secondsinterval, Joost peers tend to exchange either a single or several (33–64) packets to anygiven peer, whereas SopCast performs less probing sending also fewer (9–16) packets.
Accurate, Fine-Grained Classification of P2P-TV Applications 87
TVants prefers instead lower order bins (2–4 packets), and PPLive makes a significantuse of single packet exchanges, possibly to discover the network, while the rest of itsactivity is more spread out over the other bins.
Support Vector MachinesOur classification framework makes use of Support Vector Machines (SVMs) [10],which are well known among the supervised learning methods for their discriminativepower. In SVM, entities to be classified are represented by means of some distinctive“features”, i.e., the abacus signatures in our case. SVM classification is a two-phaseprocess. First, SVM needs to be trained with supervised input (i.e., abacus signaturesof known traffic and the corresponding application label). The output of this phase isa model, which can then be applied in a second phase to classify previously unseensignatures.
Given a geometric representation of features in a multi-dimensional space, the train-ing phase partitions the feature space into a set of classes, using a few representativesamples of each class. Then, during the classification phase, any new point is assignedto the most likely class, depending on the zone the point falls into. Defining the delim-iting surfaces is complex, since training points can be spread out on the feature space:the key idea of SVM is to remap the original space into a higher dimensional one, sothat different classes can be separated by the simplest surfaces, i.e., hyper-planes. Toassess the classification results, signatures are computed over known validation traffic(different from the one used in the training phase), and are then fed to SVM model:finally, classification results are compared with the real label.
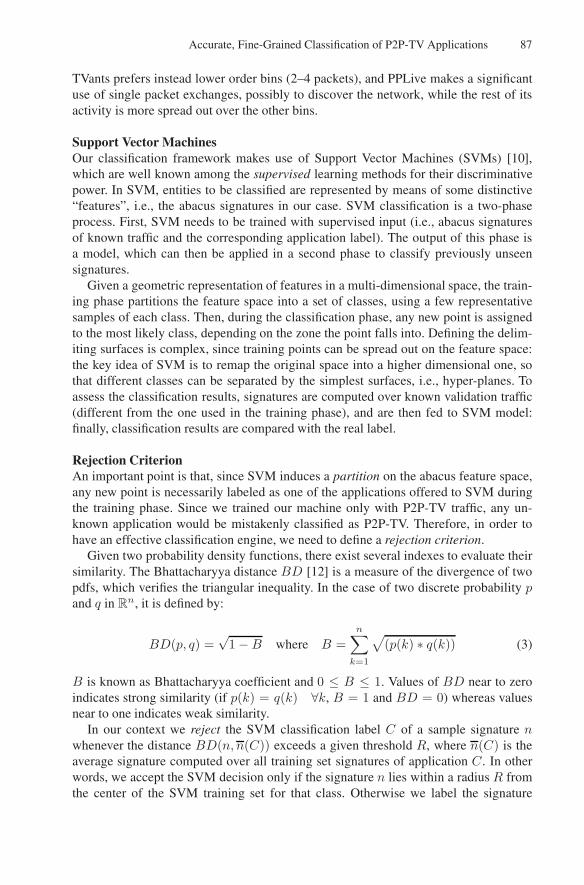
Rejection CriterionAn important point is that, since SVM induces a partition on the abacus feature space,any new point is necessarily labeled as one of the applications offered to SVM duringthe training phase. Since we trained our machine only with P2P-TV traffic, any un-known application would be mistakenly classified as P2P-TV. Therefore, in order tohave an effective classification engine, we need to define a rejection criterion.
Given two probability density functions, there exist several indexes to evaluate theirsimilarity. The Bhattacharyya distance BD [12] is a measure of the divergence of twopdfs, which verifies the triangular inequality. In the case of two discrete probability pand q in R
n, it is defined by:
BD(p, q) =√
1 − B where B =n∑
k=1
√(p(k) ∗ q(k)) (3)
B is known as Bhattacharyya coefficient and 0 ≤ B ≤ 1. Values of BD near to zeroindicates strong similarity (if p(k) = q(k) ∀k, B = 1 and BD = 0) whereas valuesnear to one indicates weak similarity.
In our context we reject the SVM classification label C of a sample signature nwhenever the distance BD(n, n(C)) exceeds a given threshold R, where n(C) is theaverage signature computed over all training set signatures of application C. In otherwords, we accept the SVM decision only if the signature n lies within a radius R fromthe center of the SVM training set for that class. Otherwise we label the signature

88 S. Valenti et al.
sample as “unknown”. For the time being we set R = 0.5 and discuss the impact ofthis choice, as well as its motivation, later on.
3 Experimental Results
Testbed setupAssessing traffic classification performance is known not to be a trivial task due tothe difficulty to devise a reliable “oracle” to known the “ground truth”, i.e., what wasthe actual application that generated the traffic [4]. Testing the classification engine bymeans of artificial traffic (e.g., by generating traffic in a testbed) solves the problem ofknowing the ground truth (i.e., you are the oracle), but care must be taken in order toensure testbed traces to be representative of real world traffic.
Therefore, to overcome this issue, we setup a large testbed in the context of NAPA-WINE, a 7th Framework Programme project funded by the EU [13], whose main fea-tures are summarized in Tab. 1. Partners took part in the experiments by running P2P-TV clients on PCs connected either to the institution LAN, or to home networks havingcable/DSL access. In more detail, the setup involved a total of 44 peers, including 37PCs from 7 different industrial/academic sites, and 7 home PCs. Probes are distributedover four countries, and connected to 6 different Autonomous Systems, while homePCs are connected to 7 other ASs and ISPs. Moreover, different experiments and peersconfigurations (hardware, OS version, channel popularity, etc.) further ensure that thetestbed is representative of a wide range of scenarios. We considered four differentapplications, namely PPLive, SopCast, TVAnts and Joost and we performed several 1-hour long experiments during April 2008, where partners watched the same channel atthe same time and collected packet-level traces. In all cases, the nominal stream ratewas 384kbps. Overall, the testbed dataset amounts to about 5.5 days worth of videostreaming, 100 · 103 signatures samples, 48 · 106 packets, 26 GBytes of data.
In order to asses the ability of our system to correctly label as unknown the trafficgenerated by non P2P-TV applications, we also collected packet level traces from ourcampus network. Particularly we isolated the traffic generated by two widely adoptedP2P applications, i.e. Skype and eDonkey as examples of respectively P2P voice andfile-sharing applications. To identify eDonkey we employed a DPI classifier based on[14], while for Skype we resorted to [9]. The final dataset amounts to about 2.2GBytesand 1,4GBytes of data for Skype and eDonkey respectively, which correspond to 500 ·103 and 300 · 103 signatures.
Discriminating P2P-TV applicationsWe use the signatures extracted from the testbed traffic to assess the ability of the engineto reveal P2P-TV traffic and to distinguish the different applications. Numerical resultsreported in the following are obtained by training the SVM with 20% of the testbed sig-natures selected at random, and using the remaining 80% for validation. Experimentsare then repeated 10 times, randomizing the training set each time, so to gather robustresults. Performance are expressed in terms of the amount of True Positive (TP, i.e.classifying label X correctly as X), and False Negative (FN, i.e. labelling a X sam-ple as Y ) classifications, and by measuring the TP-Rate (TPR) or recall, defined asTPR=TP/(TP+FN).
Accurate, Fine-Grained Classification of P2P-TV Applications 89
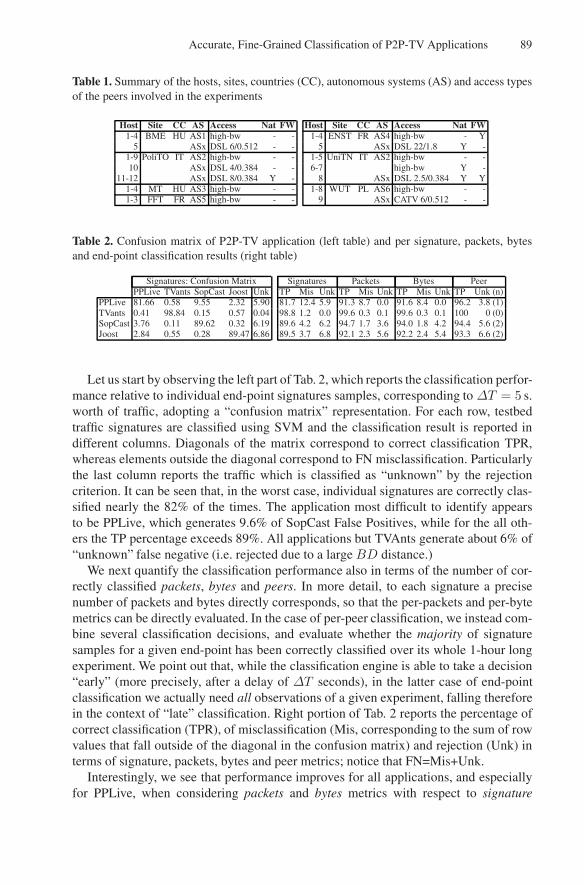
Table 1. Summary of the hosts, sites, countries (CC), autonomous systems (AS) and access typesof the peers involved in the experiments
Host Site CC AS Access Nat FW Host Site CC AS Access Nat FW1-4 BME HU AS1 high-bw - - 1-4 ENST FR AS4 high-bw - Y
5 ASx DSL 6/0.512 - - 5 ASx DSL 22/1.8 Y -1-9 PoliTO IT AS2 high-bw - - 1-5 UniTN IT AS2 high-bw - -10 ASx DSL 4/0.384 - - 6-7 high-bw Y -
11-12 ASx DSL 8/0.384 Y - 8 ASx DSL 2.5/0.384 Y Y1-4 MT HU AS3 high-bw - - 1-8 WUT PL AS6 high-bw - -1-3 FFT FR AS5 high-bw - - 9 ASx CATV 6/0.512 - -
Table 2. Confusion matrix of P2P-TV application (left table) and per signature, packets, bytesand end-point classification results (right table)
Signatures: Confusion Matrix Signatures Packets Bytes PeerPPLive TVants SopCast Joost Unk TP Mis Unk TP Mis Unk TP Mis Unk TP Unk (n)
PPLive 81.66 0.58 9.55 2.32 5.90 81.7 12.4 5.9 91.3 8.7 0.0 91.6 8.4 0.0 96.2 3.8 (1)TVants 0.41 98.84 0.15 0.57 0.04 98.8 1.2 0.0 99.6 0.3 0.1 99.6 0.3 0.1 100 0 (0)SopCast 3.76 0.11 89.62 0.32 6.19 89.6 4.2 6.2 94.7 1.7 3.6 94.0 1.8 4.2 94.4 5.6 (2)Joost 2.84 0.55 0.28 89.47 6.86 89.5 3.7 6.8 92.1 2.3 5.6 92.2 2.4 5.4 93.3 6.6 (2)
Let us start by observing the left part of Tab. 2, which reports the classification perfor-mance relative to individual end-point signatures samples, corresponding to ΔT = 5 s.worth of traffic, adopting a “confusion matrix” representation. For each row, testbedtraffic signatures are classified using SVM and the classification result is reported indifferent columns. Diagonals of the matrix correspond to correct classification TPR,whereas elements outside the diagonal correspond to FN misclassification. Particularlythe last column reports the traffic which is classified as “unknown” by the rejectioncriterion. It can be seen that, in the worst case, individual signatures are correctly clas-sified nearly the 82% of the times. The application most difficult to identify appearsto be PPLive, which generates 9.6% of SopCast False Positives, while for the all oth-ers the TP percentage exceeds 89%. All applications but TVAnts generate about 6% of“unknown” false negative (i.e. rejected due to a large BD distance.)
We next quantify the classification performance also in terms of the number of cor-rectly classified packets, bytes and peers. In more detail, to each signature a precisenumber of packets and bytes directly corresponds, so that the per-packets and per-bytemetrics can be directly evaluated. In the case of per-peer classification, we instead com-bine several classification decisions, and evaluate whether the majority of signaturesamples for a given end-point has been correctly classified over its whole 1-hour longexperiment. We point out that, while the classification engine is able to take a decision“early” (more precisely, after a delay of ΔT seconds), in the latter case of end-pointclassification we actually need all observations of a given experiment, falling thereforein the context of “late” classification. Right portion of Tab. 2 reports the percentage ofcorrect classification (TPR), of misclassification (Mis, corresponding to the sum of rowvalues that fall outside of the diagonal in the confusion matrix) and rejection (Unk) interms of signature, packets, bytes and peer metrics; notice that FN=Mis+Unk.
Interestingly, we see that performance improves for all applications, and especiallyfor PPLive, when considering packets and bytes metrics with respect to signature

90 S. Valenti et al.
0
0.2
0.4
0.6
0.8
1
0 0.2 0.4 0.6 0.8 1
TPR
(R)
of P
2P-T
V T
estb
ed T
raff
ic
Rejection Threshold R
PPliveJoostSopCastTVAnts
(a)
0
0.2
0.4
0.6
0.8
1
0 0.2 0.4 0.6 0.8 1
FPR
(R)
of n
on-P
2P-T
V R
eal T
raff
ic
Rejection Threshold R
eDonkeySkype
(b)
Fig. 2. TPR of P2P-TV (a) and FPR of non-P2P-TV (b) as a function of the rejection threshold R
samples: this means that misclassification happens when fewer packets/bytes are re-ceived (i.e., when the application is possibly mal-functioning). In case of end-pointclassification, reliability slightly increases, as the recall for all applications is greaterthan 93%. While results are more than satisfactory, yet we observe that identificationof some peer fails even in the case of late classification, with a total of 5 tests classifiedas unknown, as highlighted in the last column of the table. Digging further we actuallyfound that mainly 3 hosts are responsible for the misclassification, and moreover all ofthem actually showed abnormal functioning during the experiments.
Classifying the UnknownIf the rejection criterion generates about 5% of additional false negatives for the clas-sification of P2P-TV applications, it reveals to be very effective in correctly handlingunknown applications. In fact for both Skype and eDonkey traces our engine raises only0.1% of false alarms: in other words, only 0.1% of the signature samples are not labelas “unknown” as they should, but are rather labeled as one of the P2P-TV applications.
Results early shown highly depend on the rejection threshold R, whose choice de-pends on the following tradeoff. Intuitively, R should be as large as possible, to avoidclassifying P2P-TV as Unknown (i.e., maximize the TPR) but, at the same time, Rshould be as small as possible to avoid classifying irrelevant traffic as P2P-TV (i.e.,minimize the false positive rate, FPR). To validate the choice of R = 0.5 we proceededas follows. Using testbed traces, we empirically evaluate the TPR as a function of therejection threshold R, which is depicted in Fig. 2-(a). It can be seen that TPR quicklysaturates, meaning that no P2P-TV signature is rejected when R ≥ 0.5. We then usethe non-P2P-TV traffic from our campus network to instead evaluate the FPR as a func-tion of R, shown in Fig. 2-(b). In this case, due to the partitioning approach of SVM,eDonkey and Skype signatures are forcibly labeled by SVM as one of the P2P-TV ap-plications: however, the BD distance of the labeled signature from the center of thecluster is likely higher than that of a true P2P-TV application. This clearly emergesfrom Fig. 2-(b), which show that for low values of R ≤ 0.5, practically no false alarmis raised.
We specify that these are preliminary results, and that we plan to test the effectivenessof the rejection criterion on a wider range of non P2P-TV protocols as a future work.Yet, we showed that our rejection mechanism can correctly handle two widely used

Accurate, Fine-Grained Classification of P2P-TV Applications 91
applications, representative of two different families of P2P protocols, by successfullyidentify them as unknown.
4 Conclusions
This work proposed a novel technique for the classification of P2P-TV applications,which relies on the count of packets exchanged amongst peers during small time-windows, and makes use of Support Vector Machines.
Through measurement collected in a large testbed, we show that our classificationengine, is able to correctly classify more than 81% of signatures in the worst case. Ifperformance is evaluated considering packets, bytes or peers metrics, correct classifica-tions amount to 91% in the worst case. Moreover the rejection criterion we designed isable to correctly handle unknown applications, raising only 0.1% of false alarms.
We believe this work to be a first step toward accurate, fine-grained, behavioral clas-sification: several aspects remains indeed uncovered (e.g., byte-wise vs packet-wisesignatures, more P2P applications, TCP traffic, training set selection etc.), which weplan to address in the future.
Acknowledgements
This work was funded by EU under the FP7 Collaborative Project “Network-AwareP2P-TV Applications over Wise-Networks” (NAPAWINE).
References
1. Karagiannis, T., Papagiannaki, K., Faloutsos, M.: BLINC: multilevel traffic classification inthe dark. ACM Communication Review 35(4) (2005)
2. Xu, K., Zhang, Z., Bhattacharyya, S.: Profiling internet backbone traffic: behavior modelsand applications. In: ACM SIGCOMM 2005, Philadelphia, PA, August 2005, pp. 169–180(2005)
3. Sen, S., Spatscheck, O., Wang, D.: Accurate, scalable in-network identification of p2p trafficusing application signatures. In: WWW 2004, NY (May 2004)
4. Moore, A.W., Papagiannaki, K.: Toward the Accurate Identification of Network Applica-tions. In: Dovrolis, C. (ed.) PAM 2005. LNCS, vol. 3431, pp. 41–54. Springer, Heidelberg(2005)
5. Roughan, M., Sen, S., Spatscheck, O., Duffield, N.: Class-of-service mapping for QoS:a statistical signature-based approach to IP traffic classification. In: ACM IMC 2004 (Oc-tober 2004)
6. Moore, A.W., Zuev, D.: Internet traffic classification using bayesian analysis techniques.In: ACM SIGMETRICS 2005 (2005)
7. Bernaille, L., Teixeira, R., Salamatian, K.: Early Application Identification. In: Conferenceon Future Networking Technologies (CoNEXT 2006), Lisboa, PT (December 2006)
8. Crotti, M., Dusi, M., Gringoli, F., Salgarelli, L.: Traffic Classification through Simple Statis-tical Fingerprinting. ACM Computer Communication Review 37(1) (January 2007)
9. Bonfiglio, D., Mellia, M., Meo, M., Rossi, D., Tofanelli, P.: Revealing Skype Traffic: whenRandomness Plays with You. In: ACM SIGCOMM, Kyoto, Japan (August 2007)

92 S. Valenti et al.
10. Cristianini, N., Shawe-Taylor, J.: An introduction to support Vector Machines and otherkernel-based learning methods. Cambridge University Press, New York (1999)
11. Hei, X., Liang, C., Liang, J., Liu, Y., Ross, K.W.: A Measurement Study of a Large-ScaleP2P IPTV System. In: IEEE Transactions on Multimedia (December 2007)
12. Bhattacharyya, A.: On a measure of divergence between two statistical populations definedby probability distributions. Bull. Calcutta Math. Soc. 35, 99–109 (1943)
13. NAPA-WINE, http://www.napa-wine.eu14. Kulbak, Y., Bickson, D.: The eMule protocol specification. Tech. Rep. Leibniz Center TR-
2005-03 (2005)


![MaMPF: Encrypted Traffic Classification Based on Multi ...iwqos2018.ieee-iwqos.org/files/2018/05/MaMPF.pdflevel signatures to classify P2P application traffic [19] while M. Roughan](https://img.dokumen.tips/doc/110x75/5f2e3e2852134b235b576cac/mampf-encrypted-trafic-classiication-based-on-multi-level-signatures-to.jpg)


![Meta-Reinforced Synthetic Data for One-Shot Fine-Grained ...papers.nips.cc/paper/8570-meta-reinforced... · Few-shot Meta-learning. Few shot classification [4] is a sub-field of](https://img.dokumen.tips/doc/110x75/5f98681eb7e98621b82e1436/meta-reinforced-synthetic-data-for-one-shot-fine-grained-few-shot-meta-learning.jpg)