Embed Size (px)
Citation preview
Submitted to the SUNY Charter Schools Institute on:
September 10, 2015
By Kevin Brennan, Ed.D.
3740 Baychester Ave. – AnnexBronx, NY 10466
718-655-6660www.bronxbetterlearning.org
BRONX CHARTER SCHOOL FOR BETTER LEARNER
2014-15 ACCOUNTABILITY PLAN PROGRESS REPORT

Dr. Kevin Brennan, Executive Director, and Dr. Theodore Swartz, Director of Professional Development, with the assistance of consultant Simeon Stolzberg, prepared this 2014-15 Accountability Progress Report on behalf of the school’s board of trustees:
Trustee’s Name Board PositionKimberly Kelly Board Chairperson, Complaint Review Committee, Teacher
Employment Committee, Strategic Planning CommitteeMarvin Waldman Vice-Chairperson, Fundraising/Development Committee,
Policy/Governance Committee, Strategic Planning CommitteeMarilyn Maye Treasurer, Finance/Audit Committee, Strategic Planning Committee,
Education CommitteeWilliam Bernhardt Secretary, Teacher Employment Committee, Policy/Governance
Committee, Strategic Planning Committee, Education CommitteeJefferyson Barnes Fundraising/Development CommitteeRobert Bata Fundraising/Development Committee, Policy/Governance Committee,
Strategic Planning CommitteeAndrew Waldman Finance/Audit Committee, Complaint Review Committee,
Fundraising/Development CommitteeSheryl Jackson Parent Representative, Complaint Review Committee, Teacher
Employment Committee, Governance/Policy Committee, Education Committee
Woody Swain Finance/Audit Committee, Education CommitteeGregg Swain Teacher Employment Committee, Fundraising/Development
Committee
Dr. Kevin B. Brennan has served as the Executive Director since June 2010.
Bronx Charter School for Better Learning 2014-15 Accountability Plan Progress Report Page 1

INTRODUCTION
The Board of Trustees of the State University of New York approved the application for the Bronx Charter School for Better Learning (Bronx Better Learning) on February 23, 2003; it was subsequently approved by the Board of Regents on March 25, 2003. Bronx Better Learning opened in the fall of 2003 with an enrollment of 50 students in Grade 1, added one grade each year thereafter, and enrolled 285 students in Grades 1 – 5 in the fall of 2007, the final year of its original charter term. On January 15, 2008, the State University Trustees granted Bronx Better Learning a full-term charter renewal for 5 years, authorizing the school to provide instruction in Grades K – 5 through the 2012-13 school year. Bronx Better Learning added a Kindergarten program in the fall of 2008 and served 345 students in grades K – 5. In 2010-11 the school enrolled 386 students in those same grades. On March 4, 2013, the State University Trustees granted another full five year renewal of the charter for Bronx Charter School for Better Learning. Additionally, on June 4, 2014, the State University Trustees approved a five year charter for the replication of Bronx Better Learning and, in turn, the opening of Bronx Better Learning 2 for September 2015. As part of the approval to replicate Bronx Better Learning 1, the SUNY Trustees approved Bronx Better Learning 1’s adding an additional five classrooms over the next three years. Beginning in September 2015, the Bronx Charter School for Better Learning Educational Corporation (Board of Trustees) will govern both charters, i.e., Bronx Better Learning 1 and Bronx Better Learning 2.
Bronx Better Learning originally located in a facility leased from the Bronx Bethany Church of the Nazarene at 971 East 227th Street in the Bronx. Following the first year of operation, BBL reached a shared space agreement with the New York City Department of Education, through which Bronx Better Learning received permission to locate in the annex portion of P.S. 111 (Seton Falls Elementary School) at 3740 Baychester Avenue in the Bronx. The school used 3 classrooms and an office in the main building of P.S. 111 for the first time in 2008-09 to accommodate its growth in enrollment. Its new Kindergarten classes were situated there in 2008-09, replaced by 5th grade in 2009-10. Beginning September 2014, Bronx Better Learning occupied three additional classrooms in the main building and is scheduled to add another two classrooms for the 2015-16 school year. Bronx Better Learning 2 requested and was granted to co-locate at M.S. 144 (Michelangelo Middle School) at 2545 Gunther Avenue in the Bronx. Bronx Better Learning 2 is located in CSD 11 approximately two miles from Bronx Better Learning 1.
The mission of the Bronx Charter School for Better Learning is as follows:
The Bronx Charter School for Better Learning provides its students with a solid foundation for academic success, through achievement that exceeds citywide averages and meets or exceeds New York State standards and national norms in all curriculum areas tested, especially in mathematics and language arts. Our teaching constantly adjusts to the needs of our students, leading to independence, autonomy, responsibility and a sustained love of learning, all of which contribute directly to high academic achievement.
To fulfill its mission, the school’s teachers endeavor to practice the subordination of teaching to learning, an instructional approach that does not dominate learning, but rather is guided by it. Implementing the approach involves: getting students actively and mentally engaged in lessons;
Bronx Charter School for Better Learning 2014-15 Accountability Plan Progress Report Page 2

assisting students to go beyond rote memorization, wherever the subject matter allows, and to develop criteria for understanding; recognizing every child’s high intellectual capacity and, thereby, welcoming errors in students’ work as guides to help them harness that capacity; promoting students’ use of what they know to master new content; and encouraging student initiative and self-sufficiency.
Recently, Bronx Better Learning was recognized by Commissioner Elia and the Board of Regents as a 2014-15 High Progress Reward School” The award celebrates Bronx Better Learning’s success in supporting educational excellence.
Bronx Better Learning: is not test-prep driven; as noted, the instructional approach is constructivist: we know
children "construct" their knowledge, understanding and skills, so our teaching is guided by their learning and does not dominate it;
does not have extended school days; does not incorporate an extended school year; backfills at all grade levels; and serves all students, including those eligible for free and reduced lunch, eligible for special
education services and/or eligible for support as English Language Learners (ELL).
School Enrollment by Grade Level and School Year
School Year K 1 2 3 4 5 6 7 8 9 10 11 12 Total
2011-12 69 69 69 66 61 52 386
2012-13 72 72 70 63 62 56 395
2013-14 89 72 72 72 57 58 420
2014-15 108 93 72 72 72 57 474
Bronx Charter School for Better Learning 2014-15 Accountability Plan Progress Report Page 3
ENGLISH LANGUAGE ARTS
Goal 1: English Language ArtsStudents will become proficient readers and writers of the English Language.
Background
The Bronx Charter School for Better Learning (BBL) continues its focus on four priorities: 1) Instructional Rigor, to ensure that every student receives an instructional program that is rigorous and enriching; 2) Data Based Decision Making, to ensure that all instructional decisions are based on student performance; 3) Meeting Individual Student Needs, to ensure that the instructional program regularly adapts to meet the needs of each student; 4) Student Empowerment, to ensure that through an instructional program that emphasizes engagement, effort and efficacy all students sustain a personal sense of their own innate abilities.
During the 2014-15 school year, BBL maintained its strong commitment to ensuring a quality ELA program for all of its students, through the delivery of a comprehensive and challenging instructional program that is aligned with the New York State Common Core Standards by:
Continuing to emphasize the consistent application of Bronx Better Learning’s pedagogical approach, the subordination of teaching to learning;
Continuing to refine the curriculum to ensure its alignment with the State’s Common Core Standards;
Continuing to incorporate as part of its reading foundation the use Reader’s Workshop and Writer’s Workshop throughout the school;
Continuing to foster a joy for reading through the Growing Great Readers program; Continuing to support the increased reading proficiency through the Accelerated Readers
program; Continuing to foster the expansion of the students’ vocabulary through the use of the Word
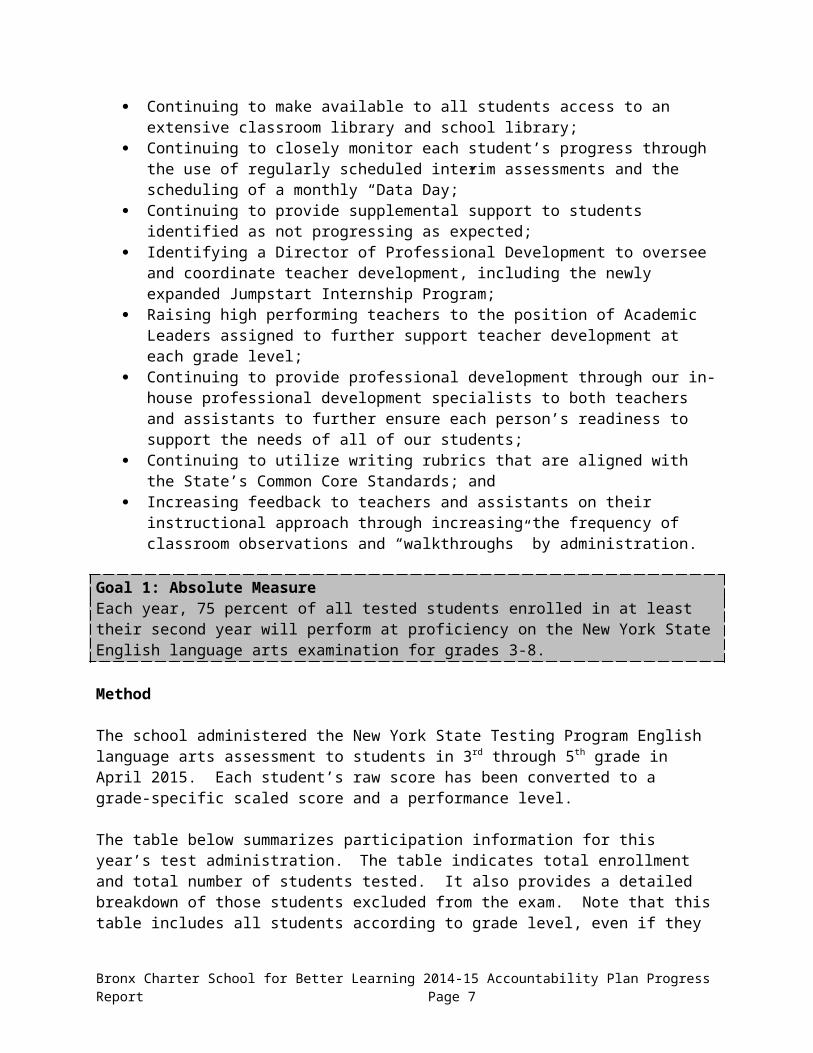
of the Day during the school’s morning broadcast; Continuing to make available to all students access to an extensive classroom library and
school library; Continuing to closely monitor each student’s progress through the use of regularly
scheduled interim assessments and the scheduling of a monthly “Data Day;” Continuing to provide supplemental support to students identified as not progressing as
expected; Identifying a Director of Professional Development to oversee and coordinate teacher
development, including the newly expanded Jumpstart Internship Program; Raising high performing teachers to the position of Academic Leaders assigned to further
support teacher development at each grade level; Continuing to provide professional development through our in-house professional
development specialists to both teachers and assistants to further ensure each person’s readiness to support the needs of all of our students;
Continuing to utilize writing rubrics that are aligned with the State’s Common Core Standards; and
Bronx Charter School for Better Learning 2014-15 Accountability Plan Progress Report Page 4

Increasing feedback to teachers and assistants on their instructional approach through increasing the frequency of classroom observations and “walkthroughs” by administration.
Goal 1: Absolute MeasureEach year, 75 percent of all tested students enrolled in at least their second year will perform at proficiency on the New York State English language arts examination for grades 3-8.
Method
The school administered the New York State Testing Program English language arts assessment to students in 3rd through 5th grade in April 2015. Each student’s raw score has been converted to a grade-specific scaled score and a performance level.
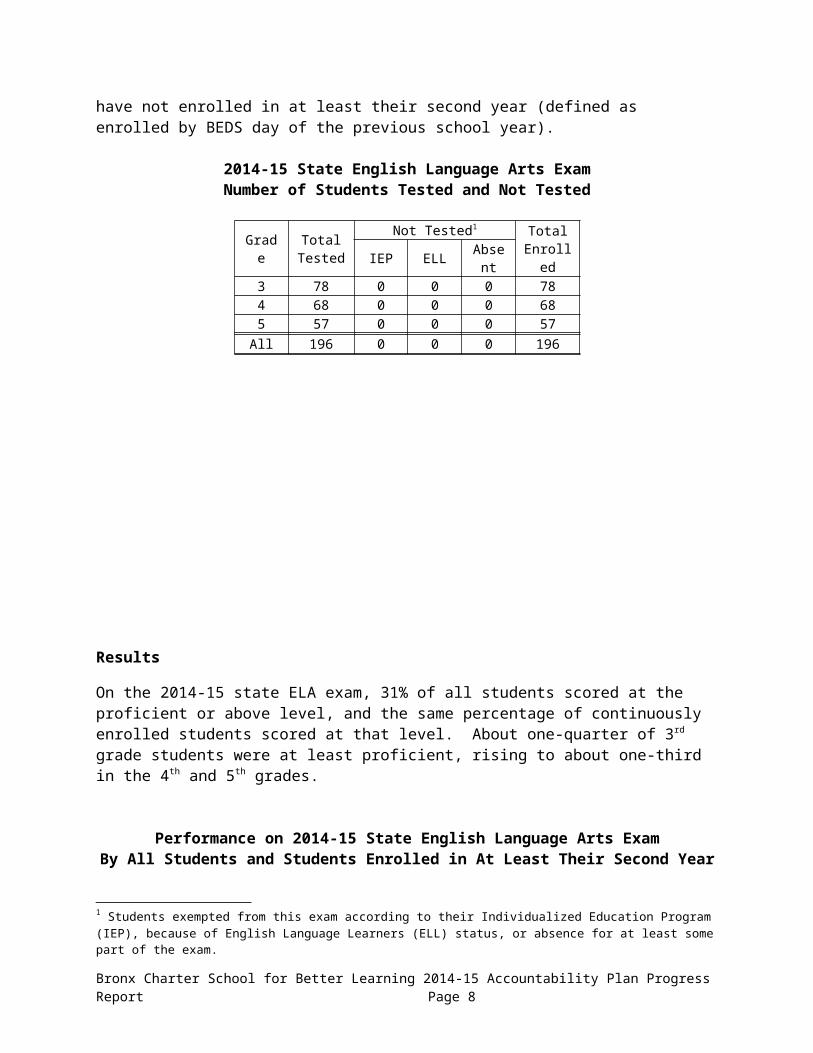
The table below summarizes participation information for this year’s test administration. The table indicates total enrollment and total number of students tested. It also provides a detailed breakdown of those students excluded from the exam. Note that this table includes all students according to grade level, even if they have not enrolled in at least their second year (defined as enrolled by BEDS day of the previous school year).
2014-15 State English Language Arts ExamNumber of Students Tested and Not Tested
Grade Total Tested
Not Tested1 Total EnrolledIEP ELL Absent
3 78 0 0 0 784 68 0 0 0 685 57 0 0 0 57
All 196 0 0 0 196
Results
1 Students exempted from this exam according to their Individualized Education Program (IEP), because of English Language Learners (ELL) status, or absence for at least some part of the exam.
Bronx Charter School for Better Learning 2014-15 Accountability Plan Progress Report Page 5

On the 2014-15 state ELA exam, 31% of all students scored at the proficient or above level, and the same percentage of continuously enrolled students scored at that level. About one-quarter of 3rd grade students were at least proficient, rising to about one-third in the 4th and 5th grades.
Performance on 2014-15 State English Language Arts ExamBy All Students and Students Enrolled in At Least Their Second Year
GradesAll Students Enrolled in at least their
Second Year
Percent Proficient
NumberTested
Percent Proficient
NumberTested
3 26.8 71 24.2 664 33.8 68 34.8 665 33.3 57 33.3 57
All 31.1 196 30.7 189
Evaluation
The school did not meet this measure. Overall it fell about 45 percentage points below the 75% proficient target. That said, 4th and 5th grade students had higher rates of proficiency, suggesting that students who remain in the school increasingly benefit from the school’s program.
Additional Evidence
The absolute performance this year was lower than the previous year and about the same as two years ago. Our initial analysis of the student test data, coupled with a thorough review of potentially contributing variables, points to several factors that most likely contributed significantly to the drop in scores, including:
The grouping of students for testing resulted in larger than usual testing groups, creating a less than optimal testing environment;
Maternity leave reduced targeted academic support for at-risk students, particularly in third grade;
The shifting of several of our most effective, experienced teachers from regular classroom duties to instructional leadership roles, while anticipated to have a long range positive effect on student performance, reduced the overall quality of ELA instruction in all three testing grades; and
The interim assessment tool used to monitor student performance during the school year, while effective in the past, was not sufficiently reflective of the structure and rigor of the NYS ELA assessment.
As reflected in our ELA Action Plan, below, we are aggressively addressing and correcting all of the four identified factors.
English Language Arts Performance by Grade Level and School Year
Bronx Charter School for Better Learning 2014-15 Accountability Plan Progress Report Page 6
Grade
Percent of Students Enrolled in At Least Their Second Year Achieving Proficiency
2012-13 2013-14 2014-15
Percent Number Tested Percent Number
Tested Percent Number Tested
3 30.6 62 43.5 69 24.2 664 36.1 61 49.1 53 34.8 665 33.9 56 44.8 58 33.3 57
All 33.5 179 45.6 180 30.7 189
Goal 1: Absolute MeasureEach year, the school’s aggregate Performance Level Index (“PLI”) on the State English language arts exam will meet the Annual Measurable Objective (“AMO”) set forth in the state’s NCLB accountability system.
Method
The federal No Child Left Behind law holds schools accountable for making annual yearly progress towards enabling all students to be proficient. As a result, the state sets an AMO each year to determine if schools are making satisfactory progress toward the goal of proficiency in the state’s learning standards in English language arts. To achieve this measure, all tested students must have a Performance Level Index (“PLI”) value that equals or exceeds the 2014-15 English language arts AMO of 97. The PLI is calculated by adding the sum of the percent of all tested students at Levels 2 through 4 with the sum of the percent of all tested students at Levels 3 and 4. Thus, the highest possible PLI is 200.2
Results
The school’s Performance Index was 107, which exceeds the AMO of 97.
English Language Arts 2014-15 Performance Level Index (PLI)
Number in Cohort
Percent of Students at Each Performance LevelLevel 1 Level 2 Level 3 Level 424.0% 44.9% 28.1% 3.1%
PI = 44.9 + 28.1 + 3.1 = 76.028.1 + 3.1 = 31.1
PLI = 107.1
Evaluation
The school met the measure. It continued to exceed the AMO, this year by 10 points.
2 In contrast to SED’s Performance Index, the PLI does not account for year-to-year growth toward proficiency.
Bronx Charter School for Better Learning 2014-15 Accountability Plan Progress Report Page 7
Goal 1: Comparative MeasureEach year, the percent of all tested students who are enrolled in at least their second year and performing at proficiency on the state English language arts exam will be greater than that of all students in the same tested grades in the local school district.
Method
A school compares tested students enrolled in at least their second year to all tested students in the surrounding public school district. Comparisons are between the results for each grade in which the school had tested students in at least their second year at the school and the total result for all students at the corresponding grades in the school district.3
ResultsWith 31% of students scoring at the proficient or above level, the school exceeded the district’s performance of 22% proficient or above.
2014-15 State English Language Arts Exam Charter School and District Performance by Grade Level
Grade
Percent of Students at ProficiencyCharter School Students
In At Least 2nd Year All District Students
Percent Number Tested Percent Number
Tested3 24.2 66 21.8 31764 34.8 66 22.5 32395 33.3 57 20.4 3051
All 30.7 189 21.6 9466
Evaluation
The school met this measure. It exceeded the district’s performance by nine percentage points.
Additional Evidence3 Schools can acquire these data when the New York State Education Department releases its Access database containing grade level ELA and math test results for all schools and districts statewide. The NYSED announces the release of the data on its News Release webpage.
Bronx Charter School for Better Learning 2014-15 Accountability Plan Progress Report Page 8

The school has consistently outperformed the district’s percent at or above proficiency.
English Language Arts Performance of Charter School and Local Districtby Grade Level and School Year
Grade
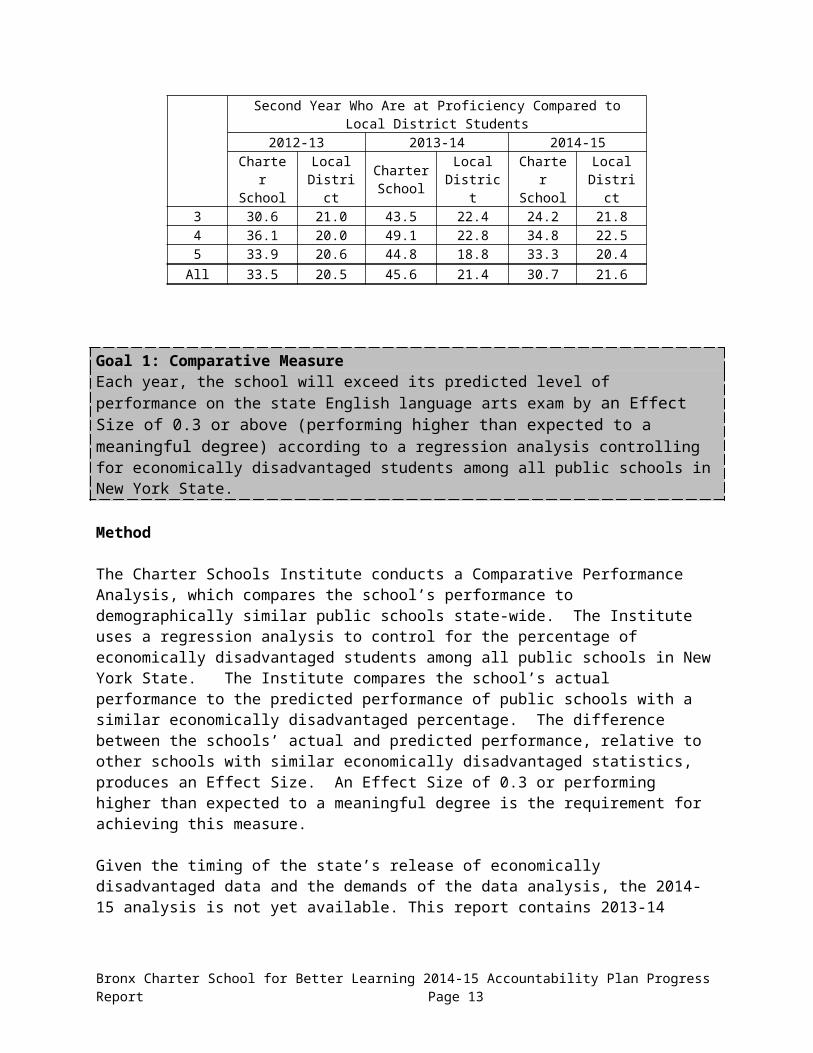
Percent of Students Enrolled in at Least their Second Year Who Are at Proficiency Compared to Local District Students
2012-13 2013-14 2014-15Charter School
LocalDistrict
Charter School
LocalDistrict
Charter School
LocalDistrict
3 30.6 21.0 43.5 22.4 24.2 21.84 36.1 20.0 49.1 22.8 34.8 22.55 33.9 20.6 44.8 18.8 33.3 20.4
All 33.5 20.5 45.6 21.4 30.7 21.6
Goal 1: Comparative MeasureEach year, the school will exceed its predicted level of performance on the state English language arts exam by an Effect Size of 0.3 or above (performing higher than expected to a meaningful degree) according to a regression analysis controlling for economically disadvantaged students among all public schools in New York State.
Method
The Charter Schools Institute conducts a Comparative Performance Analysis, which compares the school’s performance to demographically similar public schools state-wide. The Institute uses a regression analysis to control for the percentage of economically disadvantaged students among all public schools in New York State. The Institute compares the school’s actual performance to the predicted performance of public schools with a similar economically disadvantaged percentage. The difference between the schools’ actual and predicted performance, relative to other schools with similar economically disadvantaged statistics, produces an Effect Size. An Effect Size of 0.3 or performing higher than expected to a meaningful degree is the requirement for achieving this measure.
Given the timing of the state’s release of economically disadvantaged data and the demands of the data analysis, the 2014-15 analysis is not yet available. This report contains 2013-14 results, the most recent Comparative Performance Analysis available.
Results
The school had an overall effect size of 1.7 in 2013-14, which was higher than expected to a large degree.
Bronx Charter School for Better Learning 2014-15 Accountability Plan Progress Report Page 9

2013-14 English Language Arts Comparative Performance by Grade Level
GradePercent
EconomicallyDisadvantaged
Number Tested
Percent of Studentsat Levels 3&4
Difference between Actual and Predicted
Effect Size
Actual Predicted345
All 80.0 45.5 22.5 23.0 1.7
School’s Overall Comparative Performance:Higher than Expected to a Large Degree
Evaluation
The school met this measure.
Additional Evidence
The school has consistently generated a large, positive effect size for the past three years, growing each year to 1.7 in 2013-14.
English Language Arts Comparative Performance by School Year
SchoolYear Grades
Percent Eligible for
Free Lunch/ Economically
Disadvantaged
NumberTested Actual Predicted Effect
Size
2011-12 3 - 5 64.0 178 57.9 48.7 0.612012-13 3 - 5 76.9 181 33.7 22.2 0.872013-14 3 - 5 80.0 187 45.5 22.5 1.7
Goal 1: Growth Measure4 Each year, under the state’s Growth Model, the school’s mean unadjusted growth percentile in English language arts for all tested students in grades 4-8 will be above the state’s unadjusted median growth percentile.
4 See Guidelines for Creating a SUNY Accountability Plan for an explanation.
Bronx Charter School for Better Learning 2014-15 Accountability Plan Progress Report Page 10

Method
This measure examines the change in performance of the same group of students from one year to the next and the progress they are making in comparison to other students with the same score in the previous year. The analysis only includes students who took the state exam in 2013-14 and also have a state exam score from 2012-13 including students who were retained in the same grade. Students with the same 2012-13 score are ranked by their 2013-14 score and assigned a percentile based on their relative growth in performance (student growth percentile). Students’ growth percentiles are aggregated school-wide to yield a school’s mean growth percentile. In order for a school to perform above the statewide median, it must have a mean growth percentile greater than 50.
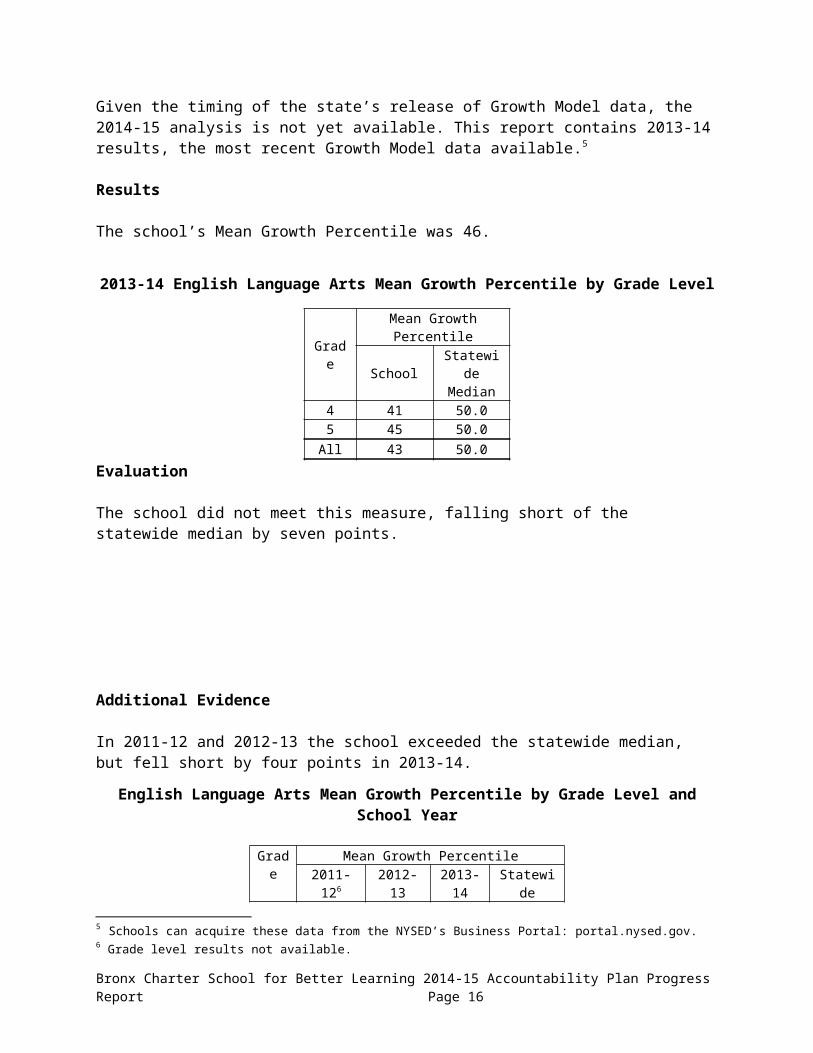
Given the timing of the state’s release of Growth Model data, the 2014-15 analysis is not yet available. This report contains 2013-14 results, the most recent Growth Model data available.5
Results
The school’s Mean Growth Percentile was 46.
2013-14 English Language Arts Mean Growth Percentile by Grade Level
GradeMean Growth Percentile
School Statewide Median
4 41 50.05 45 50.0
All 43 50.0Evaluation
The school did not meet this measure, falling short of the statewide median by seven points.
Additional Evidence
In 2011-12 and 2012-13 the school exceeded the statewide median, but fell short by four points in 2013-14.
English Language Arts Mean Growth Percentile by Grade Level and School Year
Grade
Mean Growth Percentile2011-126 2012-13 2013-14 Statewide
5 Schools can acquire these data from the NYSED’s Business Portal: portal.nysed.gov.
Bronx Charter School for Better Learning 2014-15 Accountability Plan Progress Report Page 11

Median4 50 46 50.05 55 46 50.0
All 61 53 46 50.0
Summary of the English Language Arts Goal
The school met three out of five of the measures in this goal. Given the state’s realignment of the state tests to Common Core standards, the school was unlikely to achieve the target of 75% proficient, but exceeded the state’s annual measurable objective and the district’s performance, and well has achieving a significant effect size in comparison to similar schools statewide. In terms of growth, the school was close to, but did not achieve, the state median.
Type Measure Outcome
AbsoluteEach year, 75 percent of all tested students who are enrolled in at least their second year will perform at proficiency on the New York State English language arts exam for grades 3-8.
Did Not Achieve
AbsoluteEach year, the school’s aggregate Performance Level Index (PLI) on the state English language arts exam will meet that year’s Annual Measurable Objective (AMO) set forth in the state’s NCLB accountability system.
Achieved
Comparative
Each year, the percent of all tested students who are enrolled in at least their second year and performing at proficiency on the state English language arts exam will be greater than that of students in the same tested grades in the local school district.
Achieved
Comparative
Each year, the school will exceed its predicted level of performance on the state English language arts exam by an Effect Size of 0.3 or above (performing higher than expected to a small degree) according to a regression analysis controlling for economically disadvantaged students among all public schools in New York State (using 2013-14 school district results.)
Achieved
GrowthEach year, under the state’s Growth Model the school’s mean unadjusted growth percentile in English language arts for all tested students in grades 4-8 will be above the state’s unadjusted median growth percentile.
Did Not Achieve
Action Plan
After three years of steady improvement in student performance on the NYS ELA assessment, this year’s student performance data represents a drop in our overall performance of 14%. While student performance in ELA continues to exceed the overall results from CSD 11, the Bronx and the city as a whole, as well as being on par with overall state results, clearly this year’s results require our full attention and the development of an action plan that will return the scores to the very high levels previously demonstrated by BBL students.
6 Grade level results not available.
Bronx Charter School for Better Learning 2014-15 Accountability Plan Progress Report Page 12
In response to the challenge, the BBL Board of Trustees affirms its commitment to ensure the improvement of student performance in ELA, including working with the Executive Director to provide all needed resources.
While the ongoing analysis of individual student test results and an item analysis of the NYS ELA assessment will likely lead to additional adjustments in the ELA program as the school year begins, the following targeted steps are already planned:
1. Curriculum Review: The ELA curriculum will be further reviewed to ensure its alignment with the NYS Common Core Standards and the NYS ELA assessment. Additionally, curriculum maps will be reviewed to ensure appropriate sequence and pacing of the ELA instructional program.
2. Lesson Planning Review: Lesson planning will be closely supervised to ensure that sufficient attention and time are provided for both reading and writing.
3. Alignment of Academic Leaders: While Academic Leaders have been provided for each grade, two full-time Academic Leaders with specific expertise in ELA will be assigned to grades three, four and five to further support the delivery of a rigorous and effective ELA program.
4. Review of Interim Assessments: Both the schedule and method for monitoring student progress throughout the school year will be reviewed to ensure the accurate alignment with the curriculum and that the assessment criteria are sufficiently rigorous.
5. Student Support: The scheduling of academic support will be reviewed and expanded as needed to better meet the needs of underperforming students.
6. Administrative Supervision: While the frequency of teacher evaluation was increased last year, the use of “classroom walkthroughs” with written feedback to teachers will be increased. “Classroom walkthroughs” will focus on classroom organization and student engagement.
Additionally, and specifically to address the factors we have identified as mostly likely to have contributed significantly to the drop in ELA test performance:
7. We will fully utilize additional instructional space secured this school year to replicate, during the testing sessions, the more natural, uncrowded classroom conditions typical of our instructional program.
8. We will “overstaff” ELA support, anticipating pending maternity leave.9. We will re-assign our most senior, effective ELA teachers during the school year, balancing
their leadership responsibilities, which are crucial to our long-term success and viability, with daily instructional responsibilities to targeted groups of students in our testing grades.
10. We will institute a series of interim assessments in ELA that more accurately reflect the anticipated rigor and length of the NYS ELA assessments.
Bronx Charter School for Better Learning 2014-15 Accountability Plan Progress Report Page 13

Bronx Charter School for Better Learning 2014-15 Accountability Plan Progress Report Page 14

MATHEMATICS
Goal 2: MathematicsStudents will demonstrate competency in the understanding and application of mathematical computation and problem solving.
Background
Bronx Better Learning continues its focus on four priorities: 1) Instructional Rigor, to ensure that every student receives an instructional program that is rigorous and enriching; 2) Data Based Decision Making, to ensure that all instructional decisions are based on student performance; 3) Meeting Individual Student Needs, to ensure that the instructional program regularly adapts to meet the needs of each student; 4) Student Empowerment, to ensure that through an instructional program that emphasizes engagement, effort and efficacy all students sustain a personal sense of their own innate abilities.
The Bronx Charter School for Better Learning continues to demonstrate a strong commitment to those school-wide priorities and, in turn, to ensuring the delivery of a challenging and meaningful instructional program in mathematics for all of its students by:
Continuing to review the mathematics curriculum to ensure that the pacing of the instructional program effectively supports student learning of the full scope of the Common Core Standards;
Continuing to maintain a strong commitment to the Bronx Better Learning’s pedagogical approach, the subordination of teaching to learning;
Continuing to consistently apply the use of manipulatives, primarily Cuisenaire rods, to ensure, even in the earliest stages, that students develop models for thinking mathematically;
Continuing to provide supplemental support to students identified as not progressing as expected;
Continuing to provide professional development, through our in-house professional development specialists, to both teachers and assistants to further ensure each person’s readiness to support the needs of all of our students;
Increasing feedback to teachers and assistants on their instructional approach through increasing the frequency of classroom observations by administration;
Continuing to emphasize the development of two essential skills, i.e., becoming swift and accurate in their computation skills and increasing the student’s ability to effectively focus on problem solving activities that involve practice and real world application of those skills; and
Continuing to ensure that instructional decisions are made based on specific student performance data. As with ELA, teachers utilize both formative and summative assessments, along with real-time moment-to-moment analysis of how students are responding to instruction, throughout the school year, to gather and analyze student performance data to ensure that each student’s individual needs are being addressed.
Bronx Charter School for Better Learning 2014-15 Accountability Plan Progress Report Page 15
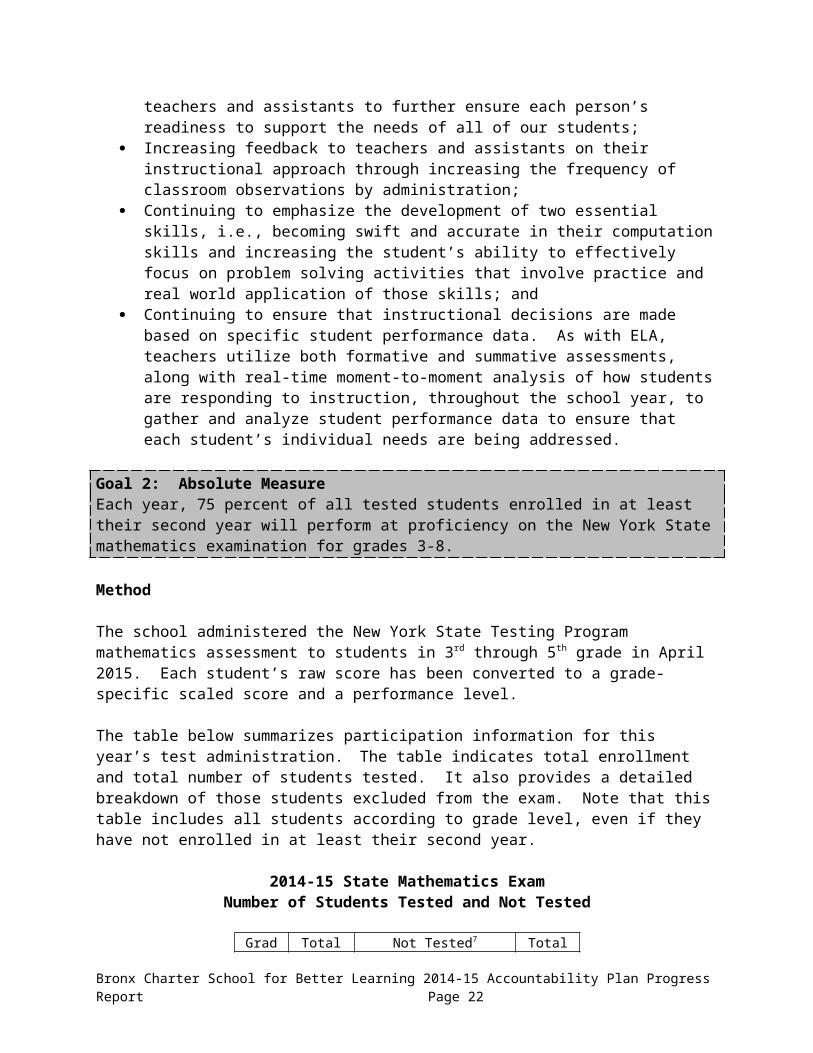
Goal 2: Absolute MeasureEach year, 75 percent of all tested students enrolled in at least their second year will perform at proficiency on the New York State mathematics examination for grades 3-8.
Method
The school administered the New York State Testing Program mathematics assessment to students in 3rd through 5th grade in April 2015. Each student’s raw score has been converted to a grade-specific scaled score and a performance level.
The table below summarizes participation information for this year’s test administration. The table indicates total enrollment and total number of students tested. It also provides a detailed breakdown of those students excluded from the exam. Note that this table includes all students according to grade level, even if they have not enrolled in at least their second year.
2014-15 State Mathematics ExamNumber of Students Tested and Not Tested
Grade Total Tested
Not Tested7 Total EnrolledIEP ELL Absent
3 71 0 0 0 714 68 0 0 0 685 57 0 0 0 57
All 196 0 0 0 196
Results
The percentage of continuously enrolled students who scored at the proficient or above level was 67%. In the 3rd grade, 59% scored at this level while more than 70% of 4th and 5th grade students did so.
Performance on 2014-15 State Mathematics ExamBy All Students and Students Enrolled in At Least Their Second Year
GradesAll Students Enrolled in at least their
Second Year
PercentProficient
NumberTested
PercentProficient
NumberTested
3 59.2 71 59.1 664 72.1 68 72.7 665 70.2 57 70.2 57
All 66.8 196 67.2 189
7 Students exempted from this exam according to their Individualized Education Program (IEP), because of English Language Learners (ELL) status, or absence for at least some part of the exam.
Bronx Charter School for Better Learning 2014-15 Accountability Plan Progress Report Page 16

Evaluation
The school did not meet this measure. Overall, it was eight percentage points below the target of 75%. However, the 4th and 5th grades came very close to 75%.
Additional Evidence
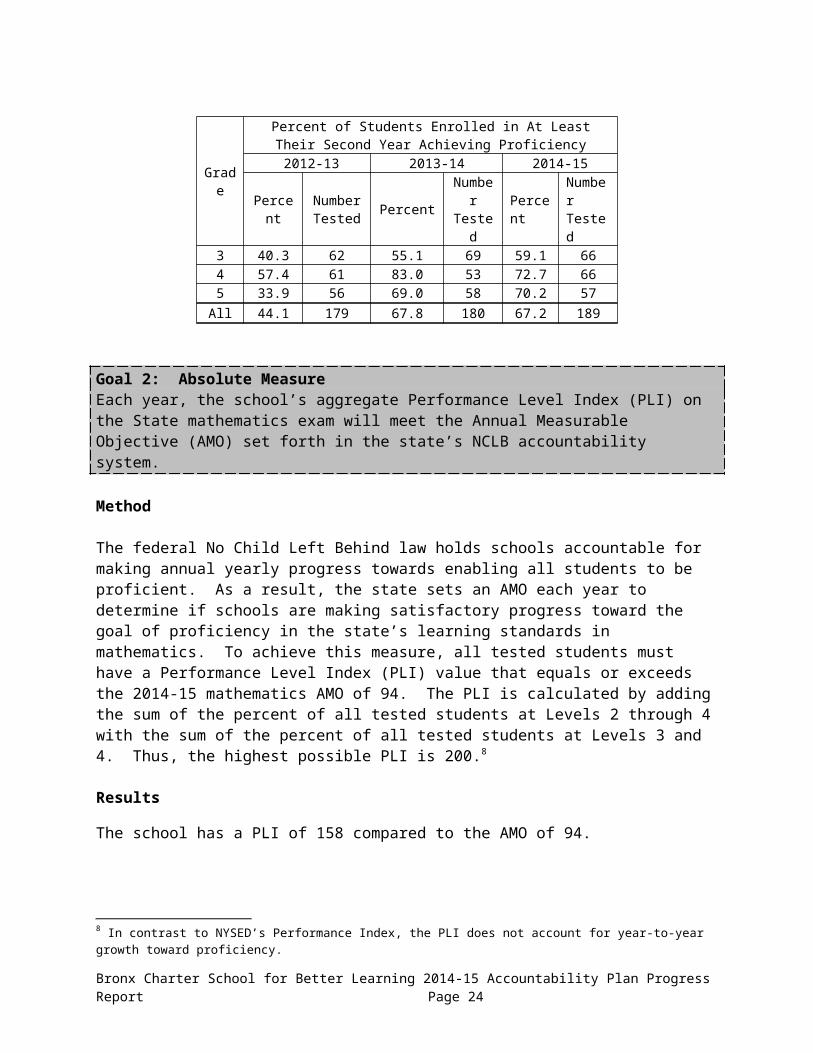
The school maintained the significant gains from 2012-13, when 44% were at least proficient. About the same percentage were at least proficient, with 68% in 2013-14 and 67% in 2014-15.
Mathematics Performance by Grade Level and School Year
Grade
Percent of Students Enrolled in At Least Their Second Year Achieving Proficiency
2012-13 2013-14 2014-15
Percent Number Tested Percent Number
Tested Percent Number Tested
3 40.3 62 55.1 69 59.1 664 57.4 61 83.0 53 72.7 665 33.9 56 69.0 58 70.2 57
All 44.1 179 67.8 180 67.2 189
Goal 2: Absolute MeasureEach year, the school’s aggregate Performance Level Index (PLI) on the State mathematics exam will meet the Annual Measurable Objective (AMO) set forth in the state’s NCLB accountability system.
Method
The federal No Child Left Behind law holds schools accountable for making annual yearly progress towards enabling all students to be proficient. As a result, the state sets an AMO each year to determine if schools are making satisfactory progress toward the goal of proficiency in the state’s learning standards in mathematics. To achieve this measure, all tested students must have a Performance Level Index (PLI) value that equals or exceeds the 2014-15 mathematics AMO of 94. The PLI is calculated by adding the sum of the percent of all tested students at Levels 2 through 4 with the sum of the percent of all tested students at Levels 3 and 4. Thus, the highest possible PLI is 200.8
Results
The school has a PLI of 158 compared to the AMO of 94.
Mathematics 2014-15 Performance Level Index (PLI)
8 In contrast to NYSED’s Performance Index, the PLI does not account for year-to-year growth toward proficiency.
Bronx Charter School for Better Learning 2014-15 Accountability Plan Progress Report Page 17

Number in Cohort
Percent of Students at Each Performance LevelLevel 1 Level 2 Level 3 Level 48.7% 24.5% 36.7% 30.1%
PI = 24.5 + 36.7 + 30.1 = 91.336.7 + 30.1 = 66.8
PLI = 158.2
Evaluation
The school met this measure. Its PLI of 158 exceeded the AMO by 64 points.
Goal 2: Comparative MeasureEach year, the percent of all tested students who are enrolled in at least their second year and performing at proficiency on the state mathematics exam will be greater than that of all students in the same tested grades in the local school district.
Method
A school compares the performance of tested students enrolled in at least their second year to that of all tested students in the surrounding public school district. Comparisons are between the results for each grade in which the school had tested students in at least their second year at the school and the total result for all students at the corresponding grades in the school district.9
Results
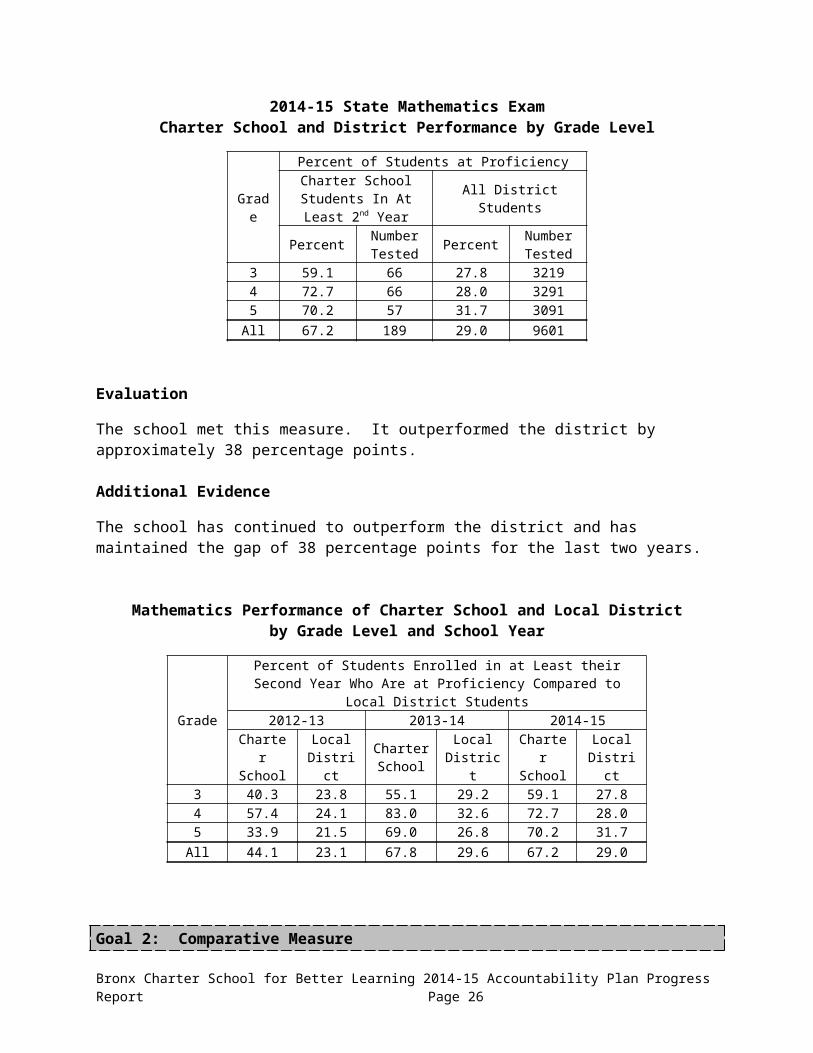
Overall 67% of students scored at or above the proficient level, compared to 29% of district students in the same grades.
2014-15 State Mathematics Exam Charter School and District Performance by Grade Level
Grade
Percent of Students at ProficiencyCharter School Students
In At Least 2nd Year All District Students
Percent Number Tested Percent Number
Tested3 59.1 66 27.8 32194 72.7 66 28.0 32915 70.2 57 31.7 3091
All 67.2 189 29.0 9601
Evaluation
9 Schools can acquire these data when the New York State Education Department releases its database containing grade level ELA and math test results for all schools and districts statewide. The NYSED announces the release of the data on its News Release webpage.
Bronx Charter School for Better Learning 2014-15 Accountability Plan Progress Report Page 18

The school met this measure. It outperformed the district by approximately 38 percentage points.
Additional Evidence
The school has continued to outperform the district and has maintained the gap of 38 percentage points for the last two years.
Mathematics Performance of Charter School and Local Districtby Grade Level and School Year
Grade
Percent of Students Enrolled in at Least their Second Year Who Are at Proficiency Compared to Local District Students
2012-13 2013-14 2014-15Charter School
LocalDistrict
Charter School
LocalDistrict
Charter School
LocalDistrict
3 40.3 23.8 55.1 29.2 59.1 27.84 57.4 24.1 83.0 32.6 72.7 28.05 33.9 21.5 69.0 26.8 70.2 31.7
All 44.1 23.1 67.8 29.6 67.2 29.0
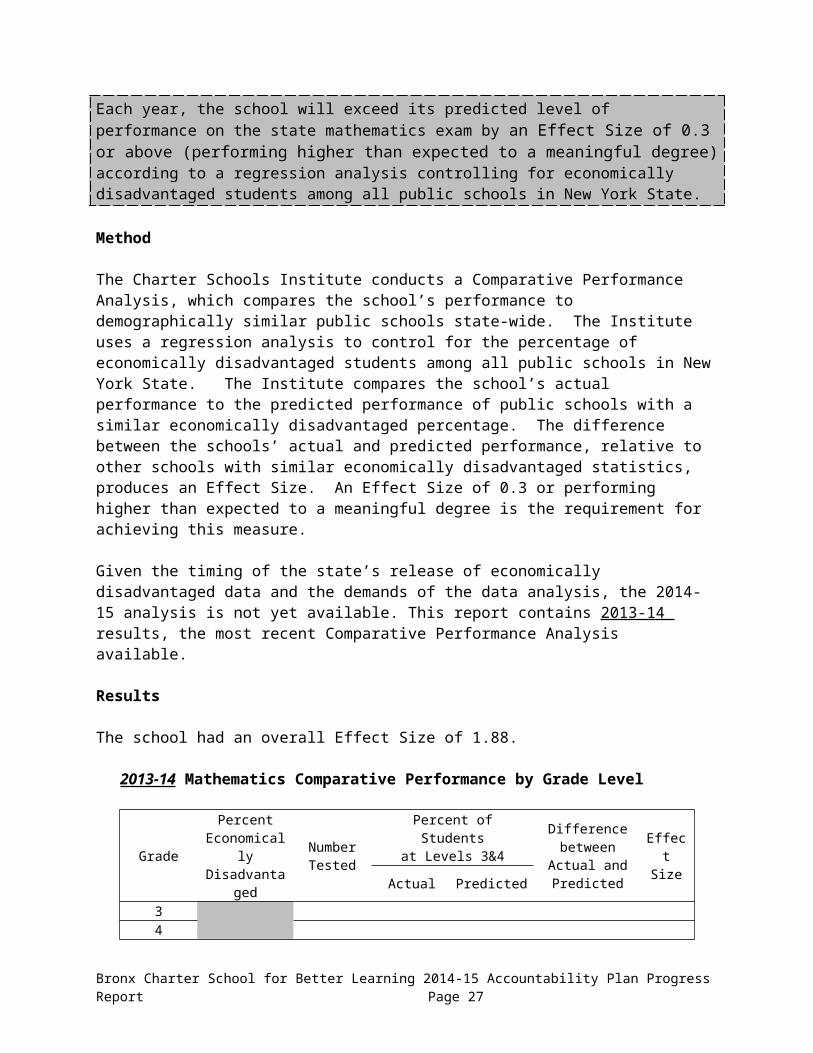
Goal 2: Comparative MeasureEach year, the school will exceed its predicted level of performance on the state mathematics exam by an Effect Size of 0.3 or above (performing higher than expected to a meaningful degree) according to a regression analysis controlling for economically disadvantaged students among all public schools in New York State.
Method
The Charter Schools Institute conducts a Comparative Performance Analysis, which compares the school’s performance to demographically similar public schools state-wide. The Institute uses a regression analysis to control for the percentage of economically disadvantaged students among all public schools in New York State. The Institute compares the school’s actual performance to the predicted performance of public schools with a similar economically disadvantaged percentage. The difference between the schools’ actual and predicted performance, relative to other schools with similar economically disadvantaged statistics, produces an Effect Size. An Effect Size of 0.3 or performing higher than expected to a meaningful degree is the requirement for achieving this measure.
Given the timing of the state’s release of economically disadvantaged data and the demands of the data analysis, the 2014-15 analysis is not yet available. This report contains 2013-14 results, the most recent Comparative Performance Analysis available.
Results
Bronx Charter School for Better Learning 2014-15 Accountability Plan Progress Report Page 19

The school had an overall Effect Size of 1.88.
2013-14 Mathematics Comparative Performance by Grade Level
GradePercent
EconomicallyDisadvantaged
Number Tested
Percent of Studentsat Levels 3&4
Difference between Actual and Predicted
Effect Size
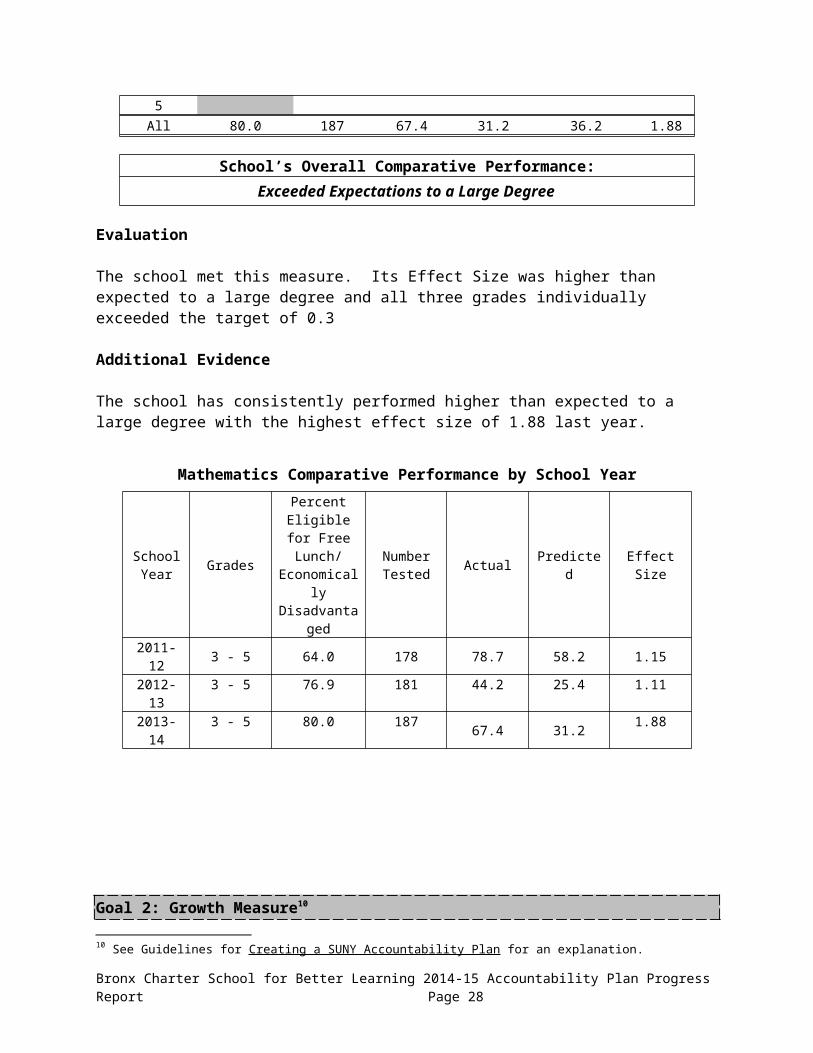
Actual Predicted345
All 80.0 187 67.4 31.2 36.2 1.88
School’s Overall Comparative Performance:Exceeded Expectations to a Large Degree
Evaluation
The school met this measure. Its Effect Size was higher than expected to a large degree and all three grades individually exceeded the target of 0.3
Additional Evidence
The school has consistently performed higher than expected to a large degree with the highest effect size of 1.88 last year.
Mathematics Comparative Performance by School Year
SchoolYear Grades
Percent Eligible for
Free Lunch/ Economically
Disadvantaged
NumberTested Actual Predicted Effect
Size
2011-12 3 - 5 64.0 178 78.7 58.2 1.152012-13 3 - 5 76.9 181 44.2 25.4 1.112013-14 3 - 5 80.0 187 67.4 31.2 1.88
Goal 2: Growth Measure10
10 See Guidelines for Creating a SUNY Accountability Plan for an explanation.
Bronx Charter School for Better Learning 2014-15 Accountability Plan Progress Report Page 20
Each year, under the state’s Growth Model, the school’s mean unadjusted growth percentile in mathematics for all tested students in grades 4-8 will be above the state’s unadjusted median growth percentile.
Method
This measure examines the change in performance of the same group of students from one year to the next and the progress they are making in comparison to other students with the same score in the previous year. The analysis only includes students who took the state exam in 2013-14 and also have a state exam score in 2012-13 including students who were retained in the same grade. Students with the same 2012-13 scores are ranked by their 2013-14 scores and assigned a percentile based on their relative growth in performance (student growth percentile). Students’ growth percentiles are aggregated school-wide to yield a school’s mean growth percentile. In order for a school to perform above the statewide median, it must have a mean growth percentile greater than 50.
Given the timing of the state’s release of Growth Model data, the 2014-15 analysis is not yet available. This report contains 2013-14 results, the most recent Growth Model data available.11
Results
In 2013-14 the school’s overall mean growth percentile was 62.
2013-14 Mathematics Mean Growth Percentile by Grade Level
GradeMean Growth Percentile
School Statewide Median
4 66 50.05 46 50.0
All 56 50.0
Evaluation
The school met this target. It exceeded the statewide median of 50 by 6 points, overall. Fifth grade fell below by 4 points, while fourth exceeded the median by 16 points.
Additional Evidence
The school has continued to exceed the statewide median for the third year in a row.
Mathematics Mean Growth Percentile by Grade Level and School Year
11 Schools can acquire these data from the NYSED’s business portal: portal.nysed.gov.
Bronx Charter School for Better Learning 2014-15 Accountability Plan Progress Report Page 21
GradeMean Growth Percentile
2011-1212 2012-13 2013-14 Statewide Median
4 49 61 69 50.05 67 55 54 50.0
All 58 58 56 50.0
Summary of the Mathematics Goal
The school met all but one of the measures in this goal. It came close to meeting the absolute measure of 75% proficient. It far exceeded the performance of the local district and similar schools statewide. Finally, it has demonstrated strong growth compared to the state.
Type Measure Outcome
AbsoluteEach year, 75 percent of all tested students who are enrolled in at least their second year will perform at proficiency on the New York State mathematics exam for grades 3-8.
Did Not Achieve
AbsoluteEach year, the school’s aggregate Performance Level Index (PLI) on the state mathematics exam will meet that year’s Annual Measurable Objective (AMO) set forth in the state’s NCLB accountability system.
Achieved
Comparative
Each year, the percent of all tested students who are enrolled in at least their second year and performing at proficiency on the state mathematics exam will be greater than that of students in the same tested grades in the local school district.
Achieved
Comparative
Each year, the school will exceed its predicted level of performance on the state mathematics exam by an Effect Size of 0.3 or above (performing higher than expected to a small degree) according to a regression analysis controlling for economically disadvantaged students among all public schools in New York State. (Using 2013-14 school district results.)
Achieved
GrowthEach year, under the state’s Growth Model the school’s mean unadjusted growth percentile in mathematics for all tested students in grades 4-8 will be above the state’s unadjusted median growth percentile.
Achieved
Action Plan
Bronx Better Learning students continue to demonstrate noteworthy achievement throughout the testing grades; still, there is room for improvement. As such, BBL continues its commitment to ensuring that all of its students perform excellently in mathematics. To facilitate the continued growth of our students, the following actions will be taken:
1. Instructional Rigor: The mathematics program will continue to focus on facilitating the development of effective computational skills for all students through:
a. Academic Leaders: Academic Leaders in grades kindergarten through second continue to be placed at each grade level to ensure consistent delivery of a rigorous and meaningful instructional program, including facilitating the ongoing process of collaborative planning, the review of weekly lesson plans and aligning of the overall
12 Grade level results not available.
Bronx Charter School for Better Learning 2014-15 Accountability Plan Progress Report Page 22

instructional program with the high expectations articulated through the common core standards. In the upper grades, third through fifth, which are departmentalized, Academic Leaders are assigned by subject, i.e., beginning this coming school year, there will be an Academic Leader specifically for mathematics.
b. Data Driven Decision Making: Frequently scheduled interim assessments will help monitor student progress and to identify where the instructional program requires modification to better support student learning. In order to ensure the meaningfulness of the assessment data, the interim assessment tool has been changed from Test Wiz to Achievement Network.
2. Focus on At-Risk Students: The Mathematics program will continue its support for students identified as being at-risk and with special needs through:
a. Experienced Teachers: The Academic Leaders, who represent some of BBL’s most experienced and effective teachers, will serve as the support teachers for the at-risk students, with the in-house professional development specialists working directly with them and their students to ensure the precision of each student’s instructional program.
b. Special Education Instructional Options: Students identified in need of special education support services will continue to have access to a variety of services, including cooperative teaching intervention (CTI) classes, SETSS provided as either push-in or pull-out services, and related services, e.g., speech, occupational therapy and counseling.
c. English Language Learner (ELL) Program/Support: The ELL Coordinator’s schedule continues to ensure the effective delivery of needed support for students identified eligible for ELL support services.
3. Professional Development: The mathematics program will ensure that all teachers are effectively prepared to provide students with the highest quality of instruction through:
a. Daily Institutes: The in-house Professional Development Specialists and the Mathematics Academic Leader have arranged a weekly institutes schedule that will focus on the continued application of the school’s pedagogy throughout the school.
b. In-Class Support: Professional development will continue to push-in to the classrooms to provide teachers and assistants with direct feedback on instructional practices and to provide examples that illustrate in “real situations” the effectiveness of the school’s approach.
Bronx Charter School for Better Learning 2014-15 Accountability Plan Progress Report Page 23
SCIENCE
Goal 3: ScienceStudents will demonstrate competency in the understanding and application of scientific reasoning.
Background
Bronx Better Learning continues its focus on four priorities: 1) Instructional Rigor, to ensure that every student receives an instructional program that is rigorous and enriching; 2) Data Based Decision Making, to ensure that all instructional decisions are based on student performance; 3) Meeting Individual Student Needs, to ensure that the instructional program regularly adapts to meet the needs of each student; 4) Student Empowerment, to ensure that through an instructional program that emphasizes engagement, effort and efficacy all students sustain a personal sense of their own innate abilities.
The Bronx Charter School for Better Learning continues to strongly promote effective student mastery of the State’s Common Core Curriculum in science by:
Continuing to implement the Bronx Better Learning’s pedagogical approach, the subordination of teaching to learning, incorporating techniques and materials that foster students’ active participation in lessons;
Continuing to implement lessons that emphasize hands-on experimentation and make use of BOCES prepared science kits (Science 21 Program) that complement the school’s core pedagogy;
Continuing to incorporate a problem solving approach that presents students with “real life” problems and working in groups, which analyze data/information to come up with solutions to the problems, all of which leads students to a deeper appreciation of cause and effect relationships; and
Continuing to provide supplemental support to students who are not progressing as expected.
Goal 3: Absolute MeasureEach year, 75 percent of all tested students enrolled in at least their second year will perform at proficiency on the New York State science examination.
Method
The school administered the New York State Testing Program science assessment to students in 4th and 8th grade in spring 2015. The school converted each student’s raw score to a performance level and a grade-specific scaled score. The criterion for success on this measure requires students enrolled in at least their second year to score at proficiency.
Results
96% of the school’s fourth grade students achieved a level 3 or 4 on the NYS Science assessment.
Bronx Charter School for Better Learning 2014-15 Accountability Plan Progress Report Page 24

Charter School Performance on 2014-15 State Science ExamBy All Students and Students Enrolled in At Least Their Second Year
Grade
Percent of Students at ProficiencyCharter School Students
In At Least 2nd Year All District Students
Percent Proficient
Number Tested
Percent Proficient
Number Tested
4 96 66 N/A N/A
Evaluation
The school met this measure. It far exceeded the target of 75% proficient.
Additional Evidence
The school has consistently met this measure, with no less than 96% proficient in any of the last three years.
Also, additional evidence may include other valid and reliable assessment results that demonstrate the effectiveness of the science program.
Science Performance by Grade Level and School Year
Grade
Percent of Students Enrolled in At Least Their Second Year at Proficiency
2012-13 2013-14 2014-15Percent
ProficientNumber Tested Percent Number
TestedPercent
ProficientNumber Tested
4 98 61 100 57 96 66All 98 61 100 57 96 66
Goal 3: Comparative MeasureEach year, the percent of all tested students enrolled in at least their second year and performing at proficiency on the state science exam will be greater than that of all students in the same tested grades in the local school district.
Method
The school compares tested students enrolled in at least their second year to all tested students in the surrounding public school district. Comparisons are between the results for each grade in which the school had tested students in at least their second year and the results for the respective grades in the local school district.
Bronx Charter School for Better Learning 2014-15 Accountability Plan Progress Report Page 25
Results
District Science results are not available.
2014-15 State Science Exam Charter School and District Performance by Grade Level
Grade
Percent of Students at ProficiencyCharter School Students
In At Least 2nd Year All District Students
Percent Proficient
Number Tested
Percent Proficient
Number Tested
4 96 66 N/A N/AEvaluation
This measure cannot be determined because district Science results are not available.
Additional Evidence
District results are not available, making it impossible to evaluate trends over time.
Science Performance of Charter School and Local Districtby Grade Level and School Year
Grade
Percent of Charter School Students at Proficiency and Enrolled in At Least their Second Year Compared to Local District Students
2012-13 2013-14 2014-15Charter School
LocalDistrict
Charter School
LocalDistrict
Charter School
LocalDistrict
4 98 N/A 100 N/A 96 N/AAll 98 N/A 100 N/A 96 N/A
Summary of the Science Goal
With 96% of students proficient in Science, the school has met this goal.
Type Measure Outcome
AbsoluteEach year, 75 percent of all tested students enrolled in at least their second year will perform at proficiency on the New York State examination.
Achieved
Comparative
Each year, the percent of all tested students enrolled in at least their second year and performing at proficiency on the state exam will be greater than that of all students in the same tested grades in the local school district.
N/A
Bronx Charter School for Better Learning 2014-15 Accountability Plan Progress Report Page 26
Action Plan
The students continue to perform exceptionally well on the NYS Science assessment – achieving 96% passing for the 2014-2015 school year. While student performance in Science continues to be laudable, Bronx Better Learning will refine and improve its program through:
1. Instructional Rigor: The science program will continue to focus on facilitating the development of effective analytical skills for all students through:
a. Academic Leaders have been placed at each grade level to ensure consistent delivery of a rigorous and meaningful instructional program, including facilitating the ongoing process of collaborative planning, the review of weekly lesson plans and aligning of the overall instructional program with the high expectations articulated through the common core standards.
b. Science Curriculum Coordinator: A Science Curriculum Coordinator has been appointed to facilitate instructional planning and curriculum refinement.
c. Data Driven Decision Making: Frequently scheduled interim assessments will help monitor student progress and to identify where the instructional program requires modification to better support student learning.
2. Focus on At-Risk Students: The science program continues to support for students identified as being at-risk and with special needs through:
a. Experienced Teachers: The Academic Leaders, who represent some of BBL’s most experienced and effective teachers, will serve as the support teachers for the at-risk students, with the in-house professional development specialists working directly with them and their students to ensure the precision of each student’s instructional program.
b. Special Education Instructional Options: Students identified in need of special education support services will continue to have access to a variety of services, including cooperative teaching intervention (CTI) classes, SETSS provided as either push-in or pull-out services, and related services, e.g., speech, occupational therapy and counseling.
c. English Language Learner (ELL) Program/Support: The ELL Coordinator’s schedule ensures the effective delivery of needed support for students identified as ELL.
3. Professional Development: The science program will ensure that all teachers are effectively prepared to provide students with the highest quality of instruction through:
a. Daily Institutes: The in-house Professional Development Specialists and the Academic Leaders have arranged a weekly Institute schedule that will focus on the continued application of the school’s pedagogy throughout the school.
b. In-Class Support: Professional development will continue to push-in to the classrooms to provide teachers and assistants with direct feedback on instructional practices and to provide examples that illustrate in “real situations” the effectiveness of the school’s approach.
Bronx Charter School for Better Learning 2014-15 Accountability Plan Progress Report Page 27
NCLB
Goal 4: NCLBThe school will make Adequate Yearly Progress.
Goal 4: Absolute MeasureUnder the state’s NCLB accountability system, the school’s Accountability Status is in good standing: the state has not identified the school as a Focus School nor determined that it has met the criteria to be identified as school requiring a local assistance plan.
Method
Because all students are expected to meet the state's learning standards, the federal No Child Left Behind legislation stipulates that various sub-populations and demographic categories of students among all tested students must meet state proficiency standards. New York, like all states, established a system for making these determinations for its public schools. Each year the state issues School Report Cards. The report cards indicate each school’s status under the state’s No Child Left Behind (NCLB) accountability system. Results
Bronx Better Learning is in good standing.
Evaluation
The school has met this measure and achieved the goal.
Additional Evidence
The school has consistently been in good standing .
NCLB Status by Year
Year Status2012-13 Good Standing2013-14 Good Standing2014-15 Good Standing
Bronx Charter School for Better Learning 2014-15 Accountability Plan Progress Report Page 28