Embed Size (px)
Citation preview

Accelerating the transition to ZEVs in shared and autonomous fleets
December 4, 2018

Accelerating the Transition to ZEVs in Shared and Autonomous Fleets 2
Table of contents
Executive summary 5 1 Introduction 8 2 Background 10 Electromobility 10 Shared passenger mobility models 11 Shared electric passenger fleets 11 Vehicular automation 12 Barriers to adoption 13 3 Review of implications for low-carbon transportation 15 ZEVs 15 Shared 16 Autonomous 18 ZEV + shared 19 ZEV + autonomous 20 Shared + autonomous 20 ZEV + shared + autonomous 20 4 Electromobility in shared mobility fleets 22 Vehicle type 22
Profiles of users and riders of shared use mobility 22 Profiles of users and riders of shared use ZEVs & opportunities for acceleration 23 Challenges 23 Reasons for adopting BEVs in shared mobility 25 Logistics, operations of BEVs within shared use mobility 26 Trip distance 26 Daily vehicle kilometers traveled and parking time 27 BEV range and charging needs 28
5 Practicality and business case for BEVs in shared use mobility 30
Cost of ownership and BEV value proposition in car sharing 30 Cost of ownership and BEV value proposition in ride hailing 31
6 Shared electromobility deployment conclusions 35 Key success factors 35
Lessons learned 35 Policies that support electromobility in shared use fleets 36
Concluding remarks 38 Appendices
A. Growth of shared mobility services 40 B. List of ZEV shared mobility services 41 C. Impacts of ride hailing 44 D. Example of BEV car sharing education tools 45 E. Uber ZEV-related communications 46 F. BEV in ride hailing payback, Montréal and London 48

Accelerating the Transition to ZEVs in Shared and Autonomous Fleets 3
List of figures and tables
List of figures
Figure 1. The convergence of mobility business models and technologies 8 Figure 2. VMT in US – Forecast scenarios 2015-2050 13 Figure 3. Environmental comparison: ZEV vs ICE in multiple jurisdictions 16 Figure 4. Impacts of electromobility, sharing and automation 21 Figure 5. Ride hailing and car sharing user demographics 22 Figure 6. Vehicle type preference by trip distance (in kilometers), Montréal 27 Figure 7. Vehicle kilometers (and miles) traveled by mobility model 28 Figure 8. BEV free-floating car sharing revenues, costs and expenses as a percent of ICE vehicle 30
Figure 9. Growth of shared mobility services 40 List of tables
Table 1. Comparison of BEVs, PHEVs and FCEVs 9 Table 2. Environmental and Other Impacts of Car Sharing 17 Table 3. Impacts of AVs 19 Table 4. Current challenges associated with using BEVs in shared use mobility 24 Table 5. Cost of ownership of BEV and ICE in ride hailing – Montréal 31 Table 6. Cost of ownership of BEV and ICE in ride hailing – London 32 Table 7. BEV in ride hailing payback, Montréal and London 33 Table 8. Key success factors 35 Table 9. Potential policies, programs, measures to increase use of shared electromobility 37 Table 10. Selected list of shared mobility programs of various types around the world 41

Accelerating the Transition to ZEVs in Shared and Autonomous Fleets 4
ACKNOWLEDGEMENTS This work is conducted for the International Zero-Emission Vehicle Alliance and is supported by its members (Baden-Württemberg, British Columbia, California, Connecticut, Germany, Maryland, Massachusetts, the Netherlands, New York, Norway, Oregon, Québec, Rhode Island, the United Kingdom, Vermont, and Washington). We thank members of the International Zero-Emission Vehicle Alliance who provided input and critical reviews on an earlier version of the report. Their review does not imply an endorsement, and any errors are the authors’ own.

Accelerating the Transition to ZEVs in Shared and Autonomous Fleets 5
Executive summary
Shared on-demand mobility models have increased in popularity over the last decade. Thanks to smartphone technologies, connectivity and vehicle automation, as well as the growing lack of interest among urbanites towards vehicle ownership, these shared use models are likely to represent an increasingly important share of urban mobility. If rebound and induced traffic effects as well as modal shift impacts are tackled, several potential benefits are associated with these models, including improved transportation system efficiencies, reduced pollution and improved quality of life. The objective of this paper is to explore ways to accelerate the transition to zero-emission vehicles (ZEVs)1 among shared use passenger car fleets used within new mobility models for the movement of people. This paper includes an assessment of electromobility at SAE Levels 4 and 5 of automation, as at these levels, the vehicle is able to drive itself, drastically impacting the mobility of people and goods and resulting in new business models. Shared mobility business models involve services that provide mobility on demand, specifically taxi services, car sharing and ride hailing2. These shared mobility services, particularly ride hailing, are experiencing and are expected to continue to experience significant growth. Electromobility, on its own, provides significant environmental benefits. The combination of electromobility and shared mobility can amplify environmental benefits. Given that the vehicle kilometres traveled (VKT) by the average shared vehicle is significantly greater than that of the non-shared vehicle, it is understandable that replacing a shared internal combustion engine (ICE) vehicle with a shared ZEV results in greater greenhouse gas (GHG) emissions reductions. Primary research undertaken in the context of this study revealed that when plug-in hybrid electric vehicles (PHEVs) are used in the context of shared mobility, in some models, more than 85 percent of the VKT are powered by the internal combustion engine3. Given this reality and the significantly greater obstacles associated with the use of fuel cell electric vehicles (FCEVs) (purchase price, limited models and lack of fueling infrastructure) compared to BEVs, this paper focuses on the use of battery electric vehicles (BEVs) in shared mobility. The anticipated advances in battery technology, range improvements, and new BEV models at declining purchase prices supports a focus on BEVs. The triple-trend combination of electromobility, sharing and automation holds even more promise for more efficient use of valuable urban space, reducing traffic congestion as well as improving energy efficiency and cutting harmful emissions. Despite the difficulty to predict the outcomes of the interaction of these technologies and trends, the UC Davis study, Three Revolutions in Urban Transportation4, concludes that these three trends have the potential to cut global energy use from urban passenger transportation by more than 70 percent, to reduce CO2 emissions by more than 80 percent and to lower the measured costs of vehicles, infrastructure, and transportation system operation by more than 40 percent. In order to realize these advantages, however, integrated transport concepts are crucial to prevent that shared, autonomous, electric motor vehicle mobility at very low costs simply increases transport volumes and possibly even outweighs the promises and improvements hoped for. Integrated concepts are likely to include pricing mechanisms for the use of resources such as urban space. Electromobility in shared mobility fleets research Interviews undertaken with representatives of 25 shared use fleets were complemented by secondary research. The interviews were distributed as illustrated to the right:
1 ZEVs include Battery Electric Vehicles (BEVs), Plug-In Hybrid Vehicles (PHEVs) and Fuel Cell Electric Vehicles (FCEVs) 2 Ride hailing: Sourcing of rides from a ‘for-fare’ driver pool accessible through an app-based platform. Other commonly-used names include
Transportation Network Companies (TNCs), ride-hauling, ride-booking, on-demand-rides, app-based rides. Ride hailing should not be confused with ride sharing.
3 The electric-share of privately-owned PHEV varies by electric-range but tends to approximately follow the utilitization factors as outlined in SAE J2841. For example, PHEVs with 100-kilometer range tend to cover over 70% of daily miles on electricity. https://www.sae.org/standards/content/j2841_200903/
4 Fulton, Lewis, Jacob Mason, Dominique Meroux (2017) Three Revolutions in Urban Transportation. Institute of Transportation Studies, University of California, Davis, Research Report UCD-ITS-RR-17-03
Taxi Car sharing Ride hailingEurope 3 5 2North America 3 4 3Asia 1 2 2

Accelerating the Transition to ZEVs in Shared and Autonomous Fleets 6
Key research findings:
• Respondents estimate that the large majority of VKT by PHEVs are undertaken using the internal combustion engine. Consequently, the GHG emissions reduction benefits associated with ZEVs in shared use mode are significantly diminished when using PHEVs. Few fleets currently use FCEVs and those who do consider that this technology presents significantly more challenges than BEVs (higher vehicle purchase price, lack of refueling infrastructure, limited models). Please see Table 1.
• Public education is one of the challenges to ZEV adoption by the general public. Each BEV used in shared use fleets is an education opportunity as it brings members of the general public in contact with these vehicles. The vehicle drivers play the role of objective ZEV ambassadors. Positive experiences with ZEVs in shared use modes will encourage riders to consider the purchase of a ZEV when they are seeking to purchase a vehicle.
• There are both operational and financial viability challenges associated with using BEVs in shared use mobility models that stem from the vehicle characteristics, pricing and supply as well as from charging access, location and affordability. Table 4 details these challenges.
Research reveals that the economic viability of using a BEV for private hire is impacted by the vehicle range, the insufficient number of chargers as well as the distribution of the charging infrastructure. In fact, these factors can result in lowering the revenue generation time (and revenues) by 20 percent. The combination of longer-range BEVs and access to strategically-located direct current (DC) fast charging stations in urban settings, where much of the ride hailing and taxi activity takes place would minimize the time wasted to, from and at the charging location. This would increase the financial viability of using a BEV in the context of taxi and ride hailing services. If the DC fast chargers were also located in close proximity to such amenities as washrooms and retail establishments serving food and beverages, the time waiting for the vehicle to charge can be used by the driver more effectively, maximizing revenue generation time. Tables 5, 6 and 7 present detailed comparisons of BEV and ICE vehicle ride hailing in Montréal and London. The calculations indicate that the availability of sufficient strategically-located and accessible DC fast charging in urban areas where the vehicles pick up and drop off riders can greatly impact the BEV payback period: from 37.7 years to 4.7 years in Montréal and from 2.8 years to 1.6 years in London.
• The socio-economic demographics of taxi and ride-hailing drivers differ from those of the current average BEV and PHEV owner. These socio-economic differences will need to be addressed in the programs, policies and measures that will be designed to increase deployment of ZEVs within shared mobility fleets.
• The availability of strategically-positioned charging infrastructure in urban settings will be key to the operational viability of BEVs within shared use mobility fleets.
Today’s charging infrastructure has generally been deployed to meet the needs of personal-use vehicles. The charging behaviours, patterns and needs of shared mobility vehicles are different from those of private owners. The growth of these shared use mobility models necessitates modifications to charging infrastructure deployment strategies (type of charging stations and location). To minimize the risk of stranded assets, these strategies should take into consideration the anticipated increased range of BEV models as well as the arrival of autonomous vehicles (AVs) (including associated changes in mobility patterns and behaviours).
• The deployment of strategically-located charging infrastructure will require public-private collaborations, including data sharing, that must take urban planning into consideration.
Role of policy Existing electromobility-related programs and policies tend to target the average consumer yet shared use mobility fleets are the low-hanging fruit with respect to impacting GHG emissions reductions. Given the important anticipated growth of shared mobility fleets (see Appendix A) and the greater number of VKT of each shared vehicle compared with the average personal passenger vehicle, governments should prioritize the development of policies, regulations and programs that target higher-use vehicles. New mobility models are not likely to result in environmental benefits without policy action. Given that the shared mobility fleets operate within municipal / regional / state / provincial regulatory frameworks, many of the policies

Accelerating the Transition to ZEVs in Shared and Autonomous Fleets 7
and regulations that will impact the accelerated adoption of ZEVs in shared fleets will be developed and implemented by these governments. Policies to support ZEVs in shared fleets are also essential for environmental benefits in the case that shared fleets lead to – other than hoped for – increased traffic volumes. Policies, programs, incentives and charging deployment strategies will need to be designed specifically for shared mobility and take the following into consideration:
• The difference in environmental impact of BEVs versus PHEVs in the context of shared mobility • The socio-demographic profiles of shared mobility providers (taxi and ride hailing drivers), including a lack
of access to home charging • The purchase criteria differences between those who currently purchase/lease/rent a vehicle for personal
reasons and those who do so for revenue-generation purposes (financial considerations are paramount as the vehicle is a revenue generation tool)
• The expected improvements of battery performance as well as the announced release of multiple affordably-priced BEV models
• The arrival of AVs and the likely increase in VKT associated with the use of AVs, unless policy encourages a shift towards shared ZEV AVs within Mobility as a Service (MaaS)5 transportation systems that support active mobility and encourage the use of pooled rides as connectors to public transit services
• The value of public-private multi-stakeholder collaboration, including the sharing of relevant data • The importance of integrating ZEV shared mobility objectives within urban sustainable mobility planning
Improving the economic viability of ZEVs is a key to increasing their penetration in shared use mobility fleets. The use of policies or programs that lower the initial purchase price or lower the cost of operating these vehicles can increase the adoption of ZEVs in shared mobility. The availability of strategically-located DC fast charging, being of great importance to the operational and financial viability of ZEV shared use fleets, is an opportunity for mobility operators to work with public and private stakeholders to ensure the most impactful placement of the right type of charging technology to maximize use by fleets. In the longer-term, the collaboration will set the stage for the most effective transition to and sustainable implementation of shared ZEV AVs within a MaaS system. In addition to the deployment of strategically-located urban charging infrastructure, the use of low- or zero-emission zones or road pricing schemes can increase the financial viability of ZEVs within shared mobility fleets. The average shared use vehicle undertakes significantly more annual mileage (and contributes to higher GHG emissions) than the average personally owned vehicle. However, not all shared vehicles undertake the same mileage. Consequently, policies should be designed to shift fossil fuel kilometres to electric kilometres. Where financial incentives are used, they should be based on VKT instead of on a vehicle basis. In this way, shared use vehicles that are used on a part-time basis, for example part-time ride hailing partner-drivers, would not benefit from inordinate incentives. Further, the implementation of a short-term all-inclusive price rental program, such as Maven Gig or Lyft Express Drive offered in the United States, would be useful. These programs provide ride hailing partner-drivers access to BEVs through weekly all-inclusive prices and are recognized for improving the financial gains of partner-drivers. Governments have the opportunity to set ambitious targets that can be achieved through multi-stakeholder collaborations. Achieving greater penetration of ZEVs in shared mobility will require exchanges, including data sharing, to ensure that such key activities as infrastructure deployment meet the needs of shared use mobility fleets. This will require vision, multi-departmental planning and public-private efforts to bring all-electric, autonomous MaaS systems to life. Through policies, regulations and taxation, future AV ride hailing must be encouraged to prioritize pooled rides over single/zero-occupant travel. Policies, incentives and disincentives will also be required to ensure AV ride hailing providers work with public transport, maximizing use of the public transit services. The objective is to have an autonomous electric MaaS where shared, pooled AVs connect passengers with public transport and where active mobility is encouraged.
5 MaaS is the integration of various forms of transport services into a single mobility service accessible on demand. The objective of MaaS is to
provide an alternative to the use of the private car that may be as convenient, more sustainable, help to reduce congestion and constraints in transport capacity, and can be even cheaper. Source: MaaS Alliance (http://maas-alliance.eu)
Accelerating the Transition to ZEVs in Shared and Autonomous Fleets 8
1 Introduction
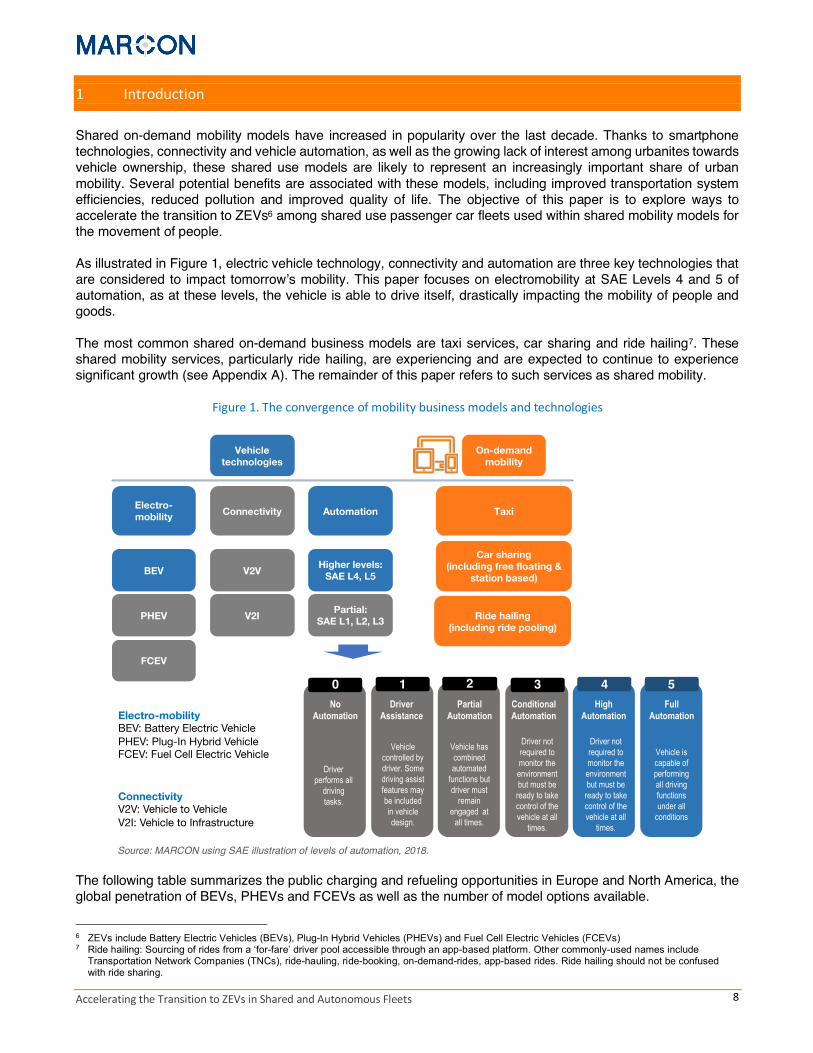
Shared on-demand mobility models have increased in popularity over the last decade. Thanks to smartphone technologies, connectivity and vehicle automation, as well as the growing lack of interest among urbanites towards vehicle ownership, these shared use models are likely to represent an increasingly important share of urban mobility. Several potential benefits are associated with these models, including improved transportation system efficiencies, reduced pollution and improved quality of life. The objective of this paper is to explore ways to accelerate the transition to ZEVs6 among shared use passenger car fleets used within shared mobility models for the movement of people. As illustrated in Figure 1, electric vehicle technology, connectivity and automation are three key technologies that are considered to impact tomorrow’s mobility. This paper focuses on electromobility at SAE Levels 4 and 5 of automation, as at these levels, the vehicle is able to drive itself, drastically impacting the mobility of people and goods. The most common shared on-demand business models are taxi services, car sharing and ride hailing7. These shared mobility services, particularly ride hailing, are experiencing and are expected to continue to experience significant growth (see Appendix A). The remainder of this paper refers to such services as shared mobility.
Figure 1. The convergence of mobility business models and technologies
Source: MARCON using SAE illustration of levels of automation, 2018.
The following table summarizes the public charging and refueling opportunities in Europe and North America, the global penetration of BEVs, PHEVs and FCEVs as well as the number of model options available.
6 ZEVs include Battery Electric Vehicles (BEVs), Plug-In Hybrid Vehicles (PHEVs) and Fuel Cell Electric Vehicles (FCEVs) 7 Ride hailing: Sourcing of rides from a ‘for-fare’ driver pool accessible through an app-based platform. Other commonly-used names include
Transportation Network Companies (TNCs), ride-hauling, ride-booking, on-demand-rides, app-based rides. Ride hailing should not be confused with ride sharing.
Vehicle technologies
Electro-mobility Connectivity Automation
BEV
PHEV
FCEV
V2V
V2I
Higher levels: SAE L4, L5
Partial: SAE L1, L2, L3
On-demand mobility
Taxi
Car sharing (including free floating &
station based)
Ride hailing (including ride pooling)
Electro-mobilityBEV: Battery Electric VehiclePHEV: Plug-In Hybrid VehicleFCEV: Fuel Cell Electric Vehicle
ConnectivityV2V: Vehicle to VehicleV2I: Vehicle to Infrastructure
0 1 2 3 4 5No
AutomationDriver
AssistancePartial
AutomationConditional Automation
High Automation
Full Automation
Driver performs all
driving tasks.
Vehicle controlled by driver. Some driving assist features may be included in vehicle design.
Vehicle has combined automated
functions but driver must
remain engaged at
all times.
Driver not required to monitor the environment but must be ready to take control of the vehicle at all
times.
Driver not required to monitor the environment but must be ready to take control of the vehicle at all
times.
Vehicle is capable of performing all driving functions under all
conditions

Accelerating the Transition to ZEVs in Shared and Autonomous Fleets 9
Table 1. Comparison of BEVs, PHEVs and FCEVs
BEV PHEV FCEV
Charging / refueling opportunities
Public charging / refueling positions - Europe (a) 154,790 subset of 154,790 82 Public charging / refueling stations - North America (b) 23,257 (Level 2 + DCFC) 18,348 Level 2 35
Penetration: number of vehicles on road globally 4 million (c ) <10,000 (d) Variety: number of model options available globally 148 + 114 planned for 2019 & 2020 (e ) >40 (f) 6 (g)
(a) European Alternative Fuels Observatory, 2018. http://www.eafo.eu/vehicle-statistics/m1 and http://www.eafo.eu/vehicle-statistics/fcev (b) Alternative Fuels Data Center, October 2018. https://afdc.energy.gov/stations/#/find/nearest?fuel=ELEC and https://afdc.energy.gov/stations/#/find/nearest?fuel=HY (c) ZEV Alliance, 2018. Spotlight on ZEVs at the Global Climate Action Summit. http://www.zevalliance.org/spotlight-on-zev-gcas/ (d) Based on Aaron Isenstadt and Nic Lutsey, 2017. Developing hydrogen fueling infrastructure for fuel cell vehicles: A status update. http://www.zevalliance.org/hydrogen-infrastructure-status/ (e) Statista, 2018. https://www.statista.com/statistics/871061/battery-electric-vehicle-model-launches-worldwide/ (f) IHS data, courtesy of Electric Mobility Canada (g) Toyota Mirai, Hyundai ix35, Hyundai Nexo, Honda Clarity, Honda Clarity FCEV, Renault Kangoo FCEV
Important challenges associated with ZEV adoption within shared mobility fleets include access to sufficient and strategically-located charging or refueling infrastructure, vehicle range and higher vehicle purchase price. Each of the ZEV technologies is making strides to overcome the prevailing barriers.
• Charging / refueling: The refueling opportunities of FCEVs are extremely limited and expansion of hydrogen refueling is challenged by the high price of setting up hydrogen refueling stations. In comparison, in Europe and North America alone, there are almost 200,000 public charging stations and this figure does not include the private charging stations that have been installed by those who have purchased BEVs and PHEVs.
• Range: While FCEVs and PHEVs present ranges equivalent to ICE vehicles, the range of a BEV varies by model. Increasingly, however, even more affordably-priced BEV models are accompanied with higher range. For example, the Chevy Bolt EV has a range of almost 400 km.
• Purchase price: All ZEVs are associated with purchase prices higher than the more affordably-priced ICE vehicles. FCEVs being in their infancy, their prices are higher than more affordable BEVs. For example, in California, the Toyota Mirai retails for approximately USD $60,000 (before purchase incentives) while the Chevy Bolt EV retails for approximately USD $35,000 (before purchase incentives).
In addition to the above, the limited number of FCEV model options and vehicle supply translates into additional limitations. In fact, it is estimated that there are fewer than 10,000 FCEVs globally. A vehicle that is used in shared use is a revenue generator that requires rapid turnaround on parts and service when an accident occurs or a part fails. With FCEVs being a limited niche, access to parts and service represents additional delays and potential revenue generation opportunities lost. The challenges associated with adopting FCEVs within shared mobility fleets are significantly greater than those associated with BEVs. As one respondent with experience using all ZEV technologies stated in the context of the research undertaken for this paper, “the challenges of using FCEVs are BEV challenges on steroids”. As will be discussed in greater detail in this report, primary research undertaken also revealed that the large majority of VKT undertaken by PHEVs in shared mobility is completed using the internal combustion engine. Consequently, their GHG emissions reduction opportunity is significantly limited. Given the greater challenges associated with using FCEVs and the limited environmental benefits associated with PHEVs in shared use fleets, this paper focuses on BEVs within such fleets. As presented in Appendix A, of the three shared use models analyzed (taxi, car sharing and ride hailing), it is anticipated that ride hailing demand will experience significantly more growth than car sharing while taxi service demand will decline. Consequently, while this paper analyzes all three shared use models, given the current size and important growth of ride hailing, this shared mode represents a focal part of the analysis.

Accelerating the Transition to ZEVs in Shared and Autonomous Fleets 10
2 Background
Numerous mobility stakeholders project that future sustainable mobility will consist of shared, electric and autonomous vehicles. Daimler, for example, uses the acronym CASE (Connected-Autonomous-Shared-Electric)8 to describe tomorrow’s mobility. BMW uses the acronym ACES (Autonomous-Connected-Electric-Shared). The SEAMless Mobility™ model was developed by MARCON’s professionals. The acronym SEAM represents Shared, Electric, Autonomous, Multimodal Mobility. MARCON considers that future sustainable mobility will be composed of electric vehicles across multiple shared autonomous modes of transportation that are seamlessly connected through technology to allow for users to meet their travel needs easily and effortlessly. While electric vehicles and vehicle sharing each contribute to sustainable mobility, the combination of both trends amplifies the environmental benefits provided by each individually. The success and growth of sustainable mobility will depend in large part on appropriate government planning, policies and regulations. Electromobility In response to government efforts to reduce GHG emissions, auto manufacturers have announced significant investments in electric vehicle technology. At the beginning of 2018, auto manufacturer-announced investments in electrification9 would exceed USD $90 billion10. While electric vehicles currently represent less than 1 percent of the vehicles sold globally annually, the growing list of governments announcing a phasing-out of fossil fuel vehicles and the increasing number of cities introducing low- or zero-emission zones, has spurred investments in electromobility. In the short term, however, ZEVs face a number of challenges including:
• Lack of consumer awareness and education
• Higher purchase price compared to ICE counterparts
• Limited access to charging and refueling infrastructure
• Range anxiety due to limited battery range
• Limited vehicle options and supply ZEV demand is expected to increase significantly as a result of several converging factors. Public and private stakeholders’ investments in ZEV-related education will lead to an increase in consumer demand; a larger share of the automotive manufacturing capacity is being allocated to ZEVs thereby yielding economies of scale and lower vehicle purchase prices; sustained improvements in battery performance allow for greater vehicle range; and additional charging and refueling infrastructure is being deployed.
8 https://www.daimler.com/case/en/ 9 Major automaker announcements regarding investments in electrifying their vehicle models include investments in BEVs, PHEVs, FCEVs as well
as hybrid vehicles. There is therefore an important distinction between electrified and electric. 10 https://www.reuters.com/article/us-autoshow-detroit-electric/global-carmakers-to-invest-at-least-90-billion-in-electric-vehicles-idUSKBN1F42NW

Accelerating the Transition to ZEVs in Shared and Autonomous Fleets 11
Shared passenger mobility models Traditional shared passenger mobility models include transit, car rental and taxi services. In the last decade, new passenger mobility models have been introduced, including car sharing11, ride hailing and microtransit. These models have gained popularity due in part to urbanites’ mounting frustrations with congestion, parking and the cost of personal vehicle ownership. Thanks to a growing number of shared mobility options and offerings supported by mobile applications, GPS and RFID technologies, the shared mobility market is expected to experience significant growth. According to McKinsey12
“In three core regions—China, Europe, and the United States—the shared-mobility market was nearly $54 billion in 2016, and it should continue to experience impressive annual growth rates in the future. Under the most positive scenario, which involves strong customer demand for self-driving taxis or shuttles (so-called robo-taxis or shuttles), in low-density locations and in cities that take steps to enable them, the market could see 28 percent annual growth from 2015 to 2030. Even the least aggressive scenario points to steady growth based on convenience and economics; it projects 15 percent annual expansion, even if customers do not readily adopt robo-taxis and cities do not support them.”
Municipal governments may support the adoption of shared forms of mobility through policies and regulations aimed at helping urbanites transition from personal vehicle ownership to use of shared vehicles, including pedestrian-only zones and parking for ridesharing and ride hailing vehicles. According to the World Health Organization, by 2050, 70 percent of the world’s population will live in cities and towns (from approximately 50 percent today)13. This rapid urbanization is placing pressure on urban road infrastructure and worsening air quality, which in turn may promote the expansion of shared mobility. Having recognized the possibility of a pronounced shift towards shared mobility, auto manufacturers are launching or investing in shared mobility services. Examples:
Auto manufacturer Shared mobility company Shared mobility model Relationship BMW ReachNow Car sharing & ride hailing Ownership BMW DriveNow Car sharing Ownership Daimler Car2Go Car sharing Ownership Ford Lyft Ride hailing Investment Ford Chariot Microtransit Ownership General Motors Maven Car sharing Ownership General Motors Lyft Ride hailing Investment Honda Grab Ride hailing Investment PSA Communauto Car sharing Investment Toyota Uber Ride hailing Investment Toyota Grab Ride hailing Investment Volkswagen MOIA Microtransit Ownership
Shared electric passenger fleets The number of shared fleets using electric vehicles is increasing, with frequent announcements of new shared electric mobility services or the introduction of electric vehicles within existing shared fleets. A list of shared mobility fleets (taxi, car sharing and ride hailing) using electric vehicles is provided in Appendix B. Growth of such shared mobility services have been introduced in both developed and emerging economies. Fewer electric car share and taxi services have been launched and some have failed. One such failed project was launched in Bogota, Colombia14.
11 Multiple car sharing models exist: round-trip (including peer to peer), station-based and free-floating car sharing 12 https://www.mckinsey.com/industries/automotive-and-assembly/our-insights/how-shared-mobility-will-change-the-automotive-industry 13 http://www.who.int/bulletin/volumes/88/4/10-010410/en/ 14 https://insideevs.com/thanks-to-byd-e6-columbia-now-has-the-largest-electric-taxi-fleet-in-south-america/
https://www.elespectador.com/noticias/bogota/taxis-electricos-se-quedan-sin-energia-y-sin-respaldo-articulo-682709

Accelerating the Transition to ZEVs in Shared and Autonomous Fleets 12
Increased vehicle range, technology, the increased deployment of charging infrastructure and incentives that improve the business case of using electric vehicles are helping fleets overcome the challenges associated with EV adoption:
• Increased vehicle range in more affordably-priced BEVs is facilitating their integration in shared fleets. The popularity of the Chevy Bolt EV on the Maven Gig platform in multiple U.S. locations is an example of how longer-range BEVs are being integrated in ride hailing.
• Technology is helping car sharing operators track the state of charge. Technology is also helping Uber notify partner-drivers who drive electric vehicles regarding longer journeys enabling drivers to make judicious ride decisions based on their state of charge.
• The strategic availability of public charging infrastructure is key to helping shared use fleets deploy electric vehicles in their fleets. For example, car2go deployed an all-electric fleet in Amsterdam thanks to the availability of public infrastructure supporting the BEV business case. In contrast, car2go withdrew its all-electric fleet from San Diego due to a lack of charging infrastructure.
• Incentives, including purchase incentives to lower the price of the vehicle, have contributed to decisions by companies like TÉO taxi to launch a BEV taxi operation in Montréal. These purchase incentives are also contributing to other taxi drivers in Québec purchasing BEVs. Incentives in the form of parking privileges offered by municipalities to electric vehicles operating within car sharing services are also contributing to companies like Communauto (Montréal) improve the electric vehicle business case.
Vehicle automation Auto manufacturers are also heavily investing in vehicle automation. In fact, it is estimated that in the three-year period covering August 2014 to July 2017, automakers and technology companies spent more than USD $80 billion to develop SAE Level 4 vehicle automation15. While many manufacturers have made announcements regarding the advancement of automated vehicle technology in recent years, Waymo’s launch of its commercial driverless ride hailing service16 in the Phoenix, Arizona, area was an important milestone as it is considered the first driverless shared mobility service. Automated driving systems require substantial technology in order to automate the driving task, including both software and hardware, such as sensors, cameras, radar, and LiDAR, resulting in vehicles that are currently very expensive. In fact, “the systems that currently drive robot cars cost upward of $100,000 per vehicle – not counting the cost of the car itself”.17 Cost is not the only challenge to the introduction of autonomous vehicles. Additional challenges include determining how to test the technology, development of regulations permitting vehicle use on public roads, and public acceptance. Vehicle automation is expected to improve mobility among segments of the population whose mobility is currently limited and encourage changes in the way people travel, potentially resulting in an increase in VKT (or VMT18). An analysis by KPMG19 and illustrated in Figure 2 forecasts that the increase in VMT due to vehicle automation may be significant in the United States. The graph lines show change in VMT between 2015 and 2050 under different occupancy assumptions; the number in the square at the end of each line indicates average vehicle occupancy.
15 http://thehill.com/policy/transportation/355696-driverless-car-investments-top-80-billion 16 https://www.bloomberg.com/news/articles/2018-02-16/waymo-gets-o-k-for-commercial-driverless-ride-hailing-service 17 http://www.latimes.com/business/la-fi-hy-ouster-lidar-20171211-htmlstory.html 18 Vehicle miles traveled 19 KPMG report, The Clockspeed Dilemma, 2015

Accelerating the Transition to ZEVs in Shared and Autonomous Fleets 13
Figure 2. VMT in US – Forecast scenarios based on average vehicle occupancy 2015-2050
Source: MARCON graph based on KPMG analysis of US BTS data, NHTS data, US Census data
If current occupancy rates are maintained, then we might expect to see an over one-trillion-mile surge in VMT by 2050. But, if occupancy rates were to decrease—for example, if younger and older age groups use self-driving vehicles to take more trips independently—then we could see twice as much demand. And if we moved into a scenario where there are more cars than people on the road and occupancy rates fall below one person per car—(for example, self-driving cars without passengers), then the increase could be as large as three to four trillion additional miles. As presented in the diagram above, the current level of travel demand can only be maintained through the widespread use of increased occupancy through pooling. A further requirement for this scenario is that if shared mobility reduces mobility costs, rebound and induced traffic effects are addressed through adequate pricing mechanisms. It would therefore be reasonable to expect that municipal governments, in an effort to limit congestion, may introduce policies and regulations that will encourage the use of shared autonomous fleet services. It would also be reasonable to expect that each of these shared autonomous vehicles will travel a longer distance than the average individual passenger vehicle. Given the different possible VKT scenarios, only ensuring that these fleets of shared autonomous vehicles are ZEVs will reliably help limit emissions and support jurisdictions’ climate change and air quality mitigation objectives. Barriers to adoption Several barriers exist to the adoption of ZEVs, shared mobility and autonomous vehicle services. The barriers to adoption of ZEVs include the lack of public awareness, the higher vehicle purchase price, limited range of many BEV models, and the general lack of availability and accessibility of public charging infrastructure (particularly for those who do not have access to home charging) and the limited vehicle range on some BEV models. The barriers to adoption of shared mobility differ for shared mobility providers and the public. For the latter, migrating from the personally-owned vehicle to shared mobility necessitates a change of travel behaviour and often a need to use numerous mobility services, including active transportation and a variety of shared modes. Shared mobility modes are more prevalent in urban areas as population density improves the business case for such services. It also requires a change in mentality related to the vehicle as an extension of one’s personal space. Given that AVs may amplify this perception, this change in how the individual perceives the vehicle is essential. For the shared mobility provider, deploying and operating a fleet of vehicles involves mobile app development and maintenance, the use of communications technology, including RFID and GPS locating capabilities, consumer education and acceptance, as well as ongoing government engagement, to improve the economic and operational viability of these shared mobility business models.
2015 2050
1.0
2.0
3.0
4.0
5.0
6.0
Trilli
ons
of m
iles
0.95
1.2
1.67
2.0
More cars on the road than people
Car can drive parents and take kids to practice
Car can drive parents and take kids to practice
Carpooling and ride hailing take off
Average vehicle
occupancy

Accelerating the Transition to ZEVs in Shared and Autonomous Fleets 14
Autonomous vehicle adoption faces human, technological, regulatory and insurance-related challenges. If AVs are to reach scale deployment, the technology will need to win the public trust by demonstrating that it can safely navigate on public streets. From a technology perspective, the sensors, cameras, LIDAR and other hardware used to ensure the functioning of the vehicle must attain levels of reliability and cost-effectiveness that allow for commercial deployment. The software needs to be perfected, taking into consideration a multitude of use cases, scenarios and environments. The regulatory environment will need to evolve to ensure these vehicles can navigate on public roads. Insurance regulators and carriers will need to ensure that the risk associated with automated vehicle technology can be underwritten and that the public is treated fairly and expediently in case of an accident.

Accelerating the Transition to ZEVs in Shared and Autonomous Fleets 15
3 Review of implications for low-carbon transportation
In developed countries, transportation accounts for approximately one-third of GHG emissions. Each of the three mobility trends (ZEV, shared and autonomous) has environmental implications. This section of the paper reviews the literature regarding the environmental impacts of each of the trends as well as the following combinations:
• ZEV + shared • ZEV + autonomous • Shared + autonomous • ZEV + shared + autonomous
If supported by well-designed policies, combinations of mobility trends have the potential to provide significant energy savings and emissions reductions. For example, “Many experts believe that a fleet of right-sized, shared, fully autonomous, electric-drive vehicles integrated into the transportation network could be a key to reaching transportation decarbonization goals”20. The environmental impacts of these mobility trends are summarized in a 2017 white paper by the ICCT entitled New Mobility: Today’s Technology and Policy Landscape21. ZEVs The most comprehensive way to measure the environmental impact of any vehicle is to consider its entire life cycle well-to-wheel emissions. This entails the evaluation of emissions during the life of the ZEV resulting from:
• The manufacturing facilities and the production of all vehicle components • The production and transportation of the electricity or hydrogen that will power the vehicle • The quantity of electricity or hydrogen used by the vehicle • The disposal of the vehicle at the end of its useful life.
For the purposes of this paper, the environmental impact assessment is limited to BEVs as it is reasonable to expect that in the next ten years, this will be the dominant ZEV technology22. A detailed environmental impact analysis of ZEVs is beyond the scope of this paper, particularly given the fact that the energy source used to charge the battery can differ widely from one jurisdiction to the next. Figure 3 originates from a 2017 ICCT report where the projected GHG emissions for a representative 2016 electric vehicle in multiple jurisdictions are compared to the emissions of average conventional U.S., average conventional European, and the most-efficient gasoline (non-plug-in) hybrid model on the market. According to the results presented in Figure 3, new electric vehicles in 2016 produced:
• Between 15 percent and 97 percent less grams of CO2 / km than the most efficient hybrid. • Between 62 percent (with the U.S. average grid) and 80 percent (in California) less grams of CO2 / km
than the average U.S. conventional car. • Between 51 percent (in the Netherlands) and 98 percent (in Norway) less grams of CO2 / km than the
average European conventional car.
20 https://www.theicct.org/sites/default/files/publications/New-mobility-landscape_ICCT-white-paper_27072017_vF.pdf 21 https://www.theicct.org/sites/default/files/publications/New-mobility-landscape_ICCT-white-paper_27072017_vF.pdf 22 With the dramatic improvements in battery performance (and longer range) and cost reductions per kWh as well as the increased presence of
charging solutions, it is reasonable to expect a shift towards BEVs to the detriment of PHEVs. Given the significant cost associated with refueling infrastructure, the limited number and high purchase price of FCEV models, it would be reasonable to expect that in the foreseeable future, FCEVs will remain a niche solution.

Accelerating the Transition to ZEVs in Shared and Autonomous Fleets 16
Figure 3. Environmental comparison: ZEV vs ICE in multiple jurisdictions
Source: International Council on Clean Transportation. Integrating electric vehicles within U.S. and European efficiency regulations. https://www.theicct.org/integrating-EVs-vehicle-CO2-regs
A report by the World Economic Forum concludes that ZEVs in the U.S. release 60 percent less CO2 per mile than ICEs (140 grams of compared to 330 grams per mile for an ICE based on U.S. energy mix)23 during their life. Shared Several studies have focused on the impact of the use of newer shared mobility services (particularly car sharing and ride hailing) on the environment, on number of VKT, on vehicle ownership rates, on modal shift (complementing or replacing mass transit use) as well as on urban congestion levels. The impacts vary by jurisdiction and context. According to the study Mobility and environmental impacts of car sharing in the Netherlands (2017)24, the use of a vehicle through a car sharing program generally replaces the household’s second or third car and car share service users:
• Own 30 percent fewer cars than prior to car sharing • Drive 15-20 percent fewer car kilometres than prior to car sharing • Emit 13-18 percent less CO2 on car ownership and use.
According to a 2017 ICCT paper25, researchers have documented environmental benefits from particular elements of new mobility, including evidence that car sharing can result in reduced energy usage, lower GHG emissions through modal shifting, reduced VKT and improved fuel economy through accelerated fleet turnover. Despite concern that car sharing will lead to reduced public transit use, several researchers conclude that car sharing will result in net environmental benefits. Other research, including a 2018 study by the Oeko Institute26, concludes that only when free-floating car sharing is used as an enabler for the use of public transit and active mobility does it provide with desired benefits such as a reduction in VKT and GHG emissions. Table 2 summarizes the impacts associated with car sharing as reported in recent studies.
23 http://www3.weforum.org/docs/WEF_2018_%20Electric_For_Smarter_Cities.pdf 24 https://www.sciencedirect.com/science/article/pii/S2210422417300230 25 https://www.theicct.org/sites/default/files/publications/New-mobility-landscape_ICCT-white-paper_27072017_vF.pdf 26 https://www.oeko.de/fileadmin/oekodoc/share-Wissenschaftliche-Begleitforschung-zu-car2go-mit-batterieelektrischen-und-konventionellen-
Fahrzeugen.pdf
0
50
100
150
200
AverageUnitedStates
AverageEurope
Mostefficienthybrid
Netherlands UnitedStates
Germany UnitedKingdom
California France Norway
Conventional vehicle Electric vehicle
CO2
emis
sion
s (g
/km
)Fuel cycle Tailpipe

Accelerating the Transition to ZEVs in Shared and Autonomous Fleets 17
Table 2. Environmental and other impacts of car sharing27
Mobility category Study authors Study analysis Metric Impact
Round-trip car sharing
Martin, Shaheen, and Lidicker (2010)
Analysis of how car sharing influences user vehicle ownership rates based on North American consumer survey
Fuel economy Increase by 10 MPG from fleet turnover
Vehicle ownership Per household rate decline from 0.47 to 0.24
Vehicles removed 1 car share vehicle removes 9-13 personally-owned & operated vehicles
Martin and Shaheen (2011)
Evaluation of GHG emission reduction impacts from round-trip car sharing in North America based on consumer survey
VKT Reduced by 27%
GHG emissions Average household reduction of 0.58-0.84 tons of GHG/year
Free-floating car sharing
Namazu and Dowlatabadi (2015)
Study of the GHG emission implications of car sharing on various types of households and their characteristics in Vancouver, Canada
GHG emissions
Mode shifting reduced emissions 42-45% New fleet reduced emissions 19-20%
Right sizing reduced emissions 31-34%
Martin and Shaheen (2016)
Analysis conducted across 5 U.S. cities to study the impacts of car2go. Includes data from car2go as well as consumer survey and activity data
GHG emissions Reduced by 4-18%
VKT Reduced by 6-16%
Vehicle ownership Removed 7-11 individually-owned and operated vehicles per car share vehicle
Oeko Institute (2018)
Analysis of the impacts of free-floating car sharing on car ownership, VKT and over emissions
GHG emissions No reduction
Vehicles removed No reduction
Source: Based on Peter Slowik and Fanta Kamakate, New Mobility: Today’s Technology and Policy Landscape, ICCT, 2017 and Oeke Institute, 2018 As the popularity of ride hailing has increased, research to understand its impacts has also increased. U.S.-based research28 from University of California Berkeley29, University of California Davis30, the University of Colorado31, the University of Michigan and Texas A&M University32 has concluded that a significant portion of ride hailing users would have traveled by transit or used active mobility or would have opted against traveling had ride hailing been unavailable. This indicates that ride hailing is displacing transit ridership and increasing vehicle miles traveled by cars. Despite the early evidence that ride-hailing is increasing urban congestion, pooled ride-hailing services have the potential to decrease urban congestion. However, not enough research exists to definitively quantify the impact of such services. One of the more recent literature reviewed is the April 2018 UC Davis study by Caroline Rodier titled The Effects of Ride Hailing Services on Travel and Associated Greenhouse Gas Emissions, that develops a framework to identify the range of possible travel effects of ride hailing and summarizes available literature on the effects of ride hailing on auto ownership, trip generation, destination choice, mode choice, network vehicle travel and land use. In general, the results of the analysis indicate that ride hailing will tend to reduce auto ownership and increase vehicle trip generation, vehicle mode share, and network vehicle travel necessary to pick up new passengers. The overall conclusion is that ride hailing results in increased VKT and associated GHG emissions, but that the magnitude is uncertain. The author states that gaining access to “driver and passenger activity data across a wider range of geographic and socio-demographic contexts” will allow for a better understanding of the magnitude of the impacts. More detailed information regarding the impacts of ride hailing underlined in this report are available in Appendix C. 27 See report The State of European Car-Sharing (2010), http://www.eltis.org/sites/default/files/tool/the_state_of_carsharing_europe.pdf, which
addressed many of the conclusions presented in this table and presents concrete examples of CO2 emissions reductions associated with car sharing fleets in Europe.
28 Much of the ride hailing research is US-based, reflecting the strong presence of Uber and Lyft in the US. In Europe, where travel distances are shorter and urban mobility options are generally more developed than in North America, ride hailing may not experience the same level of growth.
29 https://www.its.dot.gov/itspac/dec2014/ridesourcingwhitepaper_nov2014.pdf 30 https://ncst.ucdavis.edu/wp-content/uploads/2016/07/NCST-TO-028-Rodier_Shared-Use-Mobility-White-Paper_APRIL-2018.pdf 31 https://search.proquest.com/openview/5486ff6cc229889a3cdf2df1cd3993cb/1?pq-origsite=gscholar&cbl=18750&diss=y 32 https://papers.ssrn.com/sol3/papers.cfm?abstract_id=2977969

Accelerating the Transition to ZEVs in Shared and Autonomous Fleets 18
While the magnitude of the impacts of ride hailing vary by geography33, the potential of shared modes should not only be evaluated in absolute terms, but also as a mode within a MaaS offering. The seamless integration of multiple mobility modes on a single platform with a single monthly payment, has the potential to significantly reduce personal car ownership, increase the use of public transit, reduce GHG emissions and be less costly than owning a vehicle. Autonomous AV technology is currently in testing and pilot phases by many companies, and numerous hurdles must be overcome before AVs are used as a routine form of mobility. These hurdles include the manufacturers’ ability to demonstrate the safety of the technology, development of the regulatory framework required to allow for the regular usage of the technology, as well as public acceptance. While semi-autonomous technologies can offer some environmental benefit (through platooning34 and eco-driving) and improve safety35 (through the use of accident avoidance and driver assistance features), the real potential environmental benefits in automation lie with SAE automation levels 4 and 5. At these higher levels of automation, on a per-kilometre basis, on-demand, shared mobility is expected to cost a fraction of the cost of human-driven ride hailing36. Using taxation and road pricing levers to encourage multi-passenger use of these vehicles and minimize zero occupancy kilometers can minimize the VKT and have important environmental benefits (see Figure 2). Accordingly, and as mentioned earlier, this paper focuses on higher levels of automation. A multitude of studies have focused on the potential future impacts of SAE Levels 4 and 5 AVs. These impacts vary depending on such assumptions as propulsion/powertrain technology (electric vs. ICE), use of the vehicle (shared vs. individual use) and cost per kilometer (the lower the cost, the greater the use, the greater the number of kilometers). Table 3 summarizes some of the studies related to the impacts of AVs. Without policy action, AVs are unlikely to deliver desired environmental benefits. Policymakers have a unique opportunity to shape the deployment of this technology to ensure that it contributes to a low-carbon and socially equitable mobility system.
33 The effect of vehicle travel without passengers on total systemwide VMT is estimated for the City of San Francisco in a study that uses ride hailing
vehicle activity data and in several modeling studies in Austin (Texas). The San Francisco study shows an overall increase in VMT of 6.5% on a typical weekday and of 10% on the weekend and, in Austin, the increase ranges from 8% to 11% for a typical weekday. Several studies attempt to estimate change in VMT and represent mode choice and vehicle travel without passengers. One study combines ride hailing vehicle activity data and passenger survey data and finds an average 85% increase in VMT for each ride hailing trip. Modeling studies in Austin and Lisbon show increases on the order of 20% to 50%. Source: Caroline Rodier 2018 study
34 Groups of vehicles traveling close together to minimize aerodynamic drag 35 The safety of SAE Automation Level 3 is debatable given the difficulty of human beings to actively monitor automated driving and be alert to
resume control of the vehicle when required. 36 https://www.sciencedirect.com/science/article/pii/S0967070X17300811

Accelerating the Transition to ZEVs in Shared and Autonomous Fleets 19
Table 3. Impacts of AVs
ZEV + shared As already stated, separately, electromobility and shared mobility present significant opportunity to achieve positive environmental results. The combination of these two trends can amplify environmental benefits. Given that the VKT by shared vehicles is significantly greater than that of the non-shared vehicles, it is understandable that replacing a shared ICE vehicle with a shared ZEV results in greater GHG emissions reductions. In the U.K., for example, the average motorist drives approximately 7,500 miles annually37 while taxi drivers drive between 20,000 and 30,000 miles annually38. When taking double shifting into account, that number doubles to between 40,000 and 60,000 miles annually. Therefore, by replacing a U.K. ICE taxi by a BEV taxi, the environmental impact is up to eight times greater than replacing a non-shared ICE to full electric propulsion. Making BEV taxis operationally and financially viable will involve addressing the charging and logistical challenges described in the next section of this paper. Primary research undertaken in the context of this study revealed that when PHEVs are used in the context of ride hailing and taxi services, it is estimated that more than 85 percent of the VKT are undertaken using the internal combustion engine39. Given this reality and the significant obstacles associated with the use of FCEVs, as indicated earlier, the analysis focuses on the use of BEVs in shared mobility. The anticipated advances in battery technology, range improvements, and new BEV models at declining purchase prices support a focus on BEVs.
37 MARCON calculations based on https://www.statista.com/statistics/513456/annual-mileage-of-motorists-in-the-united-kingdom-uk/ 38 https://www.insuretaxi.com/2016/08/taxi-driver-survey-2016/ 39 In personal use vehicles, PHEV drivers make every effort to maximize the electric VKT by charging frequently. In the case of shared use mobility
vehicles, drivers are focused on maximizing revenue generating time. Taking time to drive to and from a charging station and waiting for the vehicle to charge takes away from the revenue generating time.
AV impacts Impact Sources
Energy and GHG emissions
Increased VKT / VMT & greater energy requirements
Convenience and relatively low cost resulting in use by those currently unable to drive, increased number of trips (both occupied and unoccupied), a shift away from public transit, self-parking and self-fueling/charging, and longer commutes
The ability of ZEV AVs to reduce emissions will depend on the carbon intensity of the electricity grid
Researchers estimate that AVs could reduce energy use up to ~80 % from platooning, efficient traffic flow and parking, safety-induced light-weighting, and automated ridesharing
Automated Vehicles, On-Demand Mobility, and Environmental Impacts, Greenblatt, Shaheen (2015)
Brown A., J. Gonder and B. Repac. An analysis of possible energy impacts of autonomous vehicles (2014)
G. Meyer, S. Beiker, Road vehicle automation (2013)
Urban land use - parking
Decreased need for parking, particularly if AVs are shared Parking adds from 1.3 to 25 grams of carbon dioxide equivalent/passenger-kilometer to total lifecycle GHG emissions of vehicle transport and from 24 to 89 % to sulfur dioxide and 10 µm particulate matter emissions. With a large decrease in parking requirements, a substantial fraction of these emissions could be eliminated
Chester MA, Horvath A, Madanat S. Parking infrastructure: energy, emissions, and automobile life-cycle environmental accounting, Environmental Research Letters (2010)
Human health / safety
Fewer deaths associated with use of AV technology1.25 million deaths worldwide associated with vehicular accidents. More than 90% of road accidents are related to human error
If AVs enable greater use of BEVs or FCEVs, improvements in air quality would also be significant because these technologies emit no ozone-forming precursors (nitrogen oxides, volatile organic compounds) or particulate matter that can cause respiratory illnesses
World Health Organization, Road traffic deathsData by country (2013)
Bryant Walker Smith, The Center for Internet and Society, Human Error as a Cause of Vehicle Crashes (2013)
Safety Collision reduction: If AVs could eliminate all human causes of crashes, accident rates could fall by ~80 to 90%
NHTSA (National Highway Traffic Safety Administration). National motor vehicle crash causation survey: report to Congress. U.S. Department of Transportation (2014)
Economic
U.S. studies have estimated the economic benefits of crash reduction at ~USD $280 billion/year in 2010 or USD $1232/year/vehicle. Together with decreases in insurance, traffic congestion, and parking costs, AV benefits could amount to between USD $2960 and USD $3900/year/vehicle
NHTSA (National Highway Traffic Safety Administration). National motor vehicle crash causation survey: report to Congress. U.S. Department of Transportation (2014)
Energy Information Administration. Annual energy outlook 2014, U.S. Department of Energy (2014)
Productivity The human being being freed from the driving function, will result in-vehicle time that can be dedicated to productive tasks
Vehicle ownership Depending on the cost of the vehicle and the ease (availability and cost) of access of the shared AVs, vehicle ownership may decline

Accelerating the Transition to ZEVs in Shared and Autonomous Fleets 20
ZEV + autonomous Some auto manufacturers and technology developers have announced that their AVs will be BEVs. General Motors and Tesla, for example, are committed to developing automation technology on an all-electric platform. Ford, on the other hand is prioritizing hybrid-electric technology. The power consumption of automation technology as well as the frequent use of DC fast charging are considerations in the decision regarding AV propulsion technology40. If AVs will increase the number of VKT, then it would be environmentally imperative for these VKT to be free of emissions. Governments have the opportunity to develop the policies required to influence the decisions of automakers and other AV developers to ensure that AVs, particularly shared AVs, deployed are zero emission. Shared + autonomous Several auto manufacturers and technology developers have announced plans to launch shared autonomous vehicle services in the early 2020s. Much of the research undertaken to date concludes that the on-demand accessibility and convenience of using AVs will result in an increase in the number of VKT. The use of shared AVs where rides are pooled will help to mitigate this increase in VKT. The successful transition to autonomous MaaS, where active mobility and right-sized shared AVs connect riders with high-volume transit has the potential to decrease VKT as well as GHG emissions. Achieving such an efficient mobility system will require government vision and planning, collaboration between public and private stakeholders (including data sharing) as well as measures, policies, incentives and disincentives to encourage sustainable travel behaviours. ZEV + shared + autonomous The combination of the three abovementioned trends – electric, shared, and autonomous – in increasingly connected vehicles is reflected in the visions of some automakers including Daimler (CASE), BMW (ACES) and General Motors41. The anticipated revenues associated with operating shared driverless fleets is enticing auto manufacturers to reposition themselves as mobility service providers42. In fact, several companies have set up or have publicly discussed plans to launch autonomous electric ride hailing services. Some examples include Waymo43 (PHEV and BEV), General Motors44 (BEV), Daimler45 (BEV) and Volkswagen46 (BEV). Accompanied by the appropriate policies, this triple-trend combination holds significant promise for more efficient use of valuable urban space, reducing traffic congestion as well as improving energy efficiency and cutting harmful emissions. The UC Davis study, Three Revolutions in Urban Transportation47, concludes that—
“While vehicle electrification and automation may produce potentially important benefits, without a corresponding shift towards shared mobility and greater use of transit and active transport, these two revolutions could significantly increase congestion and urban sprawl, while also increasing the likelihood of missing climate change targets. In contrast, by encouraging a large increase in trip sharing, transit use, and active transport through policies that support compact, mixed use development, cities worldwide could save an estimated $5 trillion annually by 2050 while improving livability and increasing the likelihood of meeting climate change targets.”
Despite the difficulty to predict the outcomes of the interaction of technologies and trends, this study, as illustrated in Figure 4, concludes that these three revolutions have the potential to cut global energy use from urban
40 https://www.theverge.com/2017/12/12/16748024/self-driving-electric-hybrid-ev-av-gm-ford 41 https://www.gm.com/our-stories/commitment/for-crashes-emissions-and-congestion-zero-is-more.html 42 https://ihsmarkit.com/research-analysis/vw-ceo-targets-billions-in-mobility-revenue-by-2025.html 43 https://www.theverge.com/2018/7/31/17635472/waymo-self-driving-cars-pricing-ride-hail-arizona 44 https://www.cnbc.com/2017/11/30/gm-to-take-on-ride-sharing-services-with-self-driving-cars-by-2019.html 45 https://www.theverge.com/2017/8/30/16226514/smart-vision-eq-electric-future-car2go 46 https://techcrunch.com/2017/12/04/volkswagens-moia-debuts-its-all-electric-rideshare-vehicle/ & conversations with MOIA personnel 47 Fulton, Lewis, Jacob Mason, Dominique Meroux (2017) Three Revolutions in Urban Transportation. Institute of Transportation Studies, University of
California, Davis, Research Report UCD-ITS-RR-17-03

Accelerating the Transition to ZEVs in Shared and Autonomous Fleets 21
passenger transportation by more than 70 percent, to reduce CO2 emissions by more than 80 percent and to lower the measured costs of vehicles, infrastructure, and transportation system operation by more than 40 percent.
Figure 4. Impacts of electromobility, sharing and automation
Source: Based on Institute for Transportation & Development Policy and UC Davis Three Revolutions in Urban Transportation, 2017 The UC Davis report underlines how important synergies can be achieved by combining these trends48:
• Electrification can assist in the power and electronic demands of AVs • Automation can assist electrification in terms of battery operation and recharging management, such as
automatically seeking opportunities to recharge during slow periods • Similarly, AVs can help manage recharging of shared vehicles between trips and extend their effective
daily driving range in this manner • Automation can lower the costs of sharing vehicle trips including public transport services by eliminating
driver costs, which can be 50 percent or more of ride hailing costs. However, this also could lower the costs of non-shared ride hailing trips enough that there is less incentive to share trips or even to take public transport
• Trip sharing and strong public transport can help overcome the tendency of automation to trigger increases in travel, as consumers will pay for trips at the margin, and may continue to budget their time spent in travel in a similar way as they do today (rather than purchase more comfortable vehicles and spend more time in them)
• Widespread trip sharing and use of public transport can cut the number of vehicles in use dramatically and reduce traffic levels and congestion significantly, and (on a societal basis) provide cost savings that more than offset the higher purchase costs of automated ZEVs.
Researchers warn that this triple-trend combination will not be achieved without government policy and regulation that supports shared use mobility and urban planning that supports shorter trip lengths, active mobility and public transport use. Further, AV ride hailing must be encouraged to prioritize pooled rides over single-occupant travel. Pricing levers will be important in encouraging shared trips and minimizing zero-occupancy travel. Finally, policies will be required to ensure AV ride hailing providers work with public transport, maximizing use of the public transit services. The objective is to have an autonomous electric MaaS.
48 Direct text from “Synergies achieved by combining revolutions” on Page 7 of Fulton, Lewis, Jacob Mason, Dominique Meroux (2017) Three
Revolutions in Urban Transportation. Institute of Transportation Studies, University of California, Davis, Research Report UCD-ITS-RR-17-03
Three Revolutions in Urban TransportationBusiness-as-Usual Scenario 2 Revolutions Scenario 3 Revolutions Scenario
20th Century Technology Electromobility + Automation Electromobility + Automation + Sharing
• Through 2050• Use of ICE used at increased
pace• Use of transit & shared vehicles
at current rate• Population & income grow over
time
• Embrace more technology• ZEVs become common by 2030• Automated EVs become dominant by
2040• Continue to embrace single-
occupancy vehicles• Even more VKT than Business-as-
Usual scenario
• Embrace more technology of 2 Revolutions Scenario and maximize shared vehicle trips
• ZEVs become common by 2030• By 2030, widespread ride sharing,
increased transit performance, with on-demand availability, and strengthened infrastructure for active mobility, allowing maximum efficiency
Number of vehicles on the road by 2050
C02 emissions by 2050
2.1 billion 2.1 billion 0.5 billion
4,600 megatonnes 1,700 megatonnes 700 megatonnes

Accelerating the Transition to ZEVs in Shared and Autonomous Fleets 22
4 Electromobility in shared mobility fleets
This section reflects the results of interviews undertaken with representatives of 25 shared use fleets, complemented by online research about the use of ZEVs in shared mobility. Some of the information requested in the interviews was deemed by respondents to be confidential. As such, to undertake the interviews, the author signed non-disclosure agreements with several of the companies providing information. Given requests for anonymity, this paper does not identify the responding organizations, nor does it associate responses with individual companies. Where company-specific information is used, it is either publicly available or has been approved for inclusion within this paper. The operations49 interviewed were distributed geographically, with ten located in Europe, ten in North America and five in Asia. The research focused on mobility service users, logistics and operations related to operating ZEVs within a shared mobility fleet, the challenges of using ZEVs in taxi, car sharing and ride hailing services as well as the lessons learned and the key policies to support program success. Where differences between the business models exist, they are highlighted. Vehicle type Some of the respondents represent shared mobility providers that have experience with both BEVs and PHEVs. Respondents estimate that the large majority of VKT by PHEVs are powered by the internal combustion engine. This reflects the low range of PHEVs and the interest to minimize the lost time associated with Level 2 charging50. Consequently, the GHG emissions reduction benefits associated with ZEVs in shared use mode are significantly diminished when using PHEVs. For the reasons highlighted in the Introduction section of this paper, few fleets currently use FCEVs and those who do consider that this technology presents significantly more challenges than BEVs. As stated earlier, given this reality and the announced arrival of multiple BEV models with longer range in the next five years, including several more affordably-priced models51, the analysis focuses on BEVs in shared mobility fleets. Profiles of users and riders of shared use mobility Figure 5 presents overall demographics of users of shared mobility services. These users tend to be younger adults, living in urban areas. They also tend to live in childless households, with one or no cars.
Figure 5. Ride hailing and car sharing user demographics
Source: Based on Uber Revenue and Usage Statistics, 2017 – Business of Apps & Carsharing: Evolution, Challenges and Opportunities, 2014 ACEA
49 Operations refers to the location of the shared use mobility fleet operations. It does not reflect the location of the company headquarters. 50 PHEVs generally cannot charge using DC fast chargers. 51 Price parity expected by 2022 in Europe and by 2025 in North America. See UBS (2017). UBS Evidence Lab Electric Car Teardown – Disruption
Ahead? https://neo.ubs.com/shared/d1ZTxnvF2k/
RIDE HAILING (USA) CAR SHARING (round trip)
Well-educated
Predominantly male
Young adults predominantly between the ages of 25 and 45
Single-person or childless-couple household
Middle or middle/upper income household
Carless or single-car household
Living in urban neighbourhood
Relatively heavy users of non-car forms of urban mobility (ex: transit, active mobility)
INCOMEBottom 25%: 22%Mid 50%: 44%Top 25%: 27%No answer: 7%
CONTEXTUrban: 46%Suburban: 48%Rural: 6%
48%
52%
42%
58%
Gender
Age Distribution18-2425-3435-4445-54
55+
10%40%28%14%8%
18-2425-3435-4445-54
55+
13%41%25%13%8%
Uber Lyft
Taxi Car sharing Ride hailingEurope 3 5 2North America 3 4 3Asia 1 2 2

Accelerating the Transition to ZEVs in Shared and Autonomous Fleets 23
Profiles of users and riders of shared use ZEVs & opportunities for acceleration Electric vehicle knowledge among average residents is extremely low, with tracking research demonstrating that the level of ZEV awareness has not improved. UC Davis researchers conclude that “the rapid growth in the number of ZEVs and charging stations in the state [of California] hasn’t improved consumers’ awareness of plug-in cars”52. This lack of awareness of ZEVs among residents is also generally reflected in the users / riders of shared mobility services. While this lack of awareness does not pose a challenge for taxi and ride hailing service providers53, for car sharing operators where the vehicles are driven by members of the service, it translates into the need for education. Appendix D presents an example of the member education used by Communauto car sharing. According to respondents, the online information provided, supplemented by demonstration videos, is sufficient to educate the car sharing members on BEVs. Car sharing fleets that operate both BEVs and ICE vehicles note that members who reserve BEVs tend to be younger than those who reserve ICE vehicles. Further, BEV reservations are higher among males than among females. Similarly, a BEV-only taxi fleet where reservations are made using smartphone technology noted that their customers are younger than the general population. While this may reflect the use of smartphone technology for reservations, it may also reflect a greater environmental awareness among younger people. The users of taxi and ride hailing services deploying ZEVs are riders who demonstrate a great interest in learning about electromobility. ZEV taxi drivers and ride hailing partner-drivers report that riders notice that the vehicle is “different” (either from the vehicle design, with the driving experience or through company communications54 provided electronically or inside the vehicle) and ask multiple questions. In a research study undertaken by Energy Saving Trust in London55 among Uber partner-drivers, “67% of partner-drivers reported riders discussing the electric vehicle technology at least once per work period”. According to this same research, riders loved the electric vehicles and enjoyed the EV-related conversations. In fact, during focus group discussions, Uber partner-drivers stated they “felt they had in effect sold electric vehicles from the journeys they have given”. Public education is one of the challenges to ZEV adoption by the general public. Each ZEV used in shared use business models is an education opportunity as it brings members of the general public in contact with these vehicles. The drivers of these vehicles, having nothing to gain by convincing the public of the merits of ZEVs, are perceived as unbiased when answering rider questions. These drivers therefore play the role of ZEV ambassadors. Further, it is reasonable to expect that riders/drivers will draw the conclusion that if a ZEV is used as a taxi, a car share or ride hailing vehicle where vehicle use is more intense, it can stand up to personal car everyday use. Positive experiences with ZEVs in shared use modes will encourage riders to consider the purchase of a ZEV when they are seeking to purchase a vehicle. Challenges There are both operational and financial viability challenges associated with using BEVs in shared use mobility models that stem from the vehicle characteristics, pricing and supply, as well as from charging access, location and affordability. These challenges, as revealed through the primary research, are summarized in the following table and vary by jurisdiction. Improvements in battery technology and increased availability of affordably-priced, longer-range56 electric vehicles will minimize or eliminate some of these challenges. In reading the contents of Table 4, it is important to remember the difference in vehicle ownership in the three shared use modes. Car share vehicles are owned and operated by a car share operator. Ride hailing vehicles are owned (or leased or rented) and operated by the partner-drivers. Taxi operations include both driver-owned and operated vehicles and taxi company owned vehicles that are operated by the drivers. The reasoning to purchase a ZEV varies depending on who owns and operates the vehicle. When the vehicle is owned by a company, the decision is based on financials as well as other considerations, including environmental responsibility and
52 https://www.greentechmedia.com/articles/read/consumers-lack-ev-awareness-even-in-the-nations-largest-market#gs._ta1uJQ 53 EV driver training provided by Maven Gig involves 0.5 to 1 hour focused primarily on charging (including use of charging-related apps). 54 Within the UberELECTRIC program, for example, a rider who has been connected with an EV, receives an electronic message. Leaflets are also
available inside the vehicle. See Appendix E. 55 http://www.energysavingtrust.org.uk/sites/default/files/reports/Uber%20EV%20Trial%20-
%20Electric%20Private%20Hire%20Vehicles%20in%20London_1.pdf 56 Respondents stated ideally vehicles will have enough range to meet the daily needs of the business model. Shorter-range vehicles may be used in
business models involving the use of extra vehicles that can be brought into service while other vehicles are being charged.

Accelerating the Transition to ZEVs in Shared and Autonomous Fleets 24
respecting municipal programs, and rules and guidelines that encourage the use of electromobility. When the shared vehicle is owned and operated by an individual, the decision to purchase a ZEV is generally driven by financial considerations alone. This is supported by the findings of the Energy Saving Trust study where financial benefits was the reason provided most frequently by partner-drivers for having chosen to take part in the London Uber EV trial.
Table 4. Current challenges associated with using BEVs in shared use mobility
The orange text in the preceding table identifies opportunities for increasing the adoption of BEVs in shared use modes. The higher acquisition cost can be offset by lower operational costs associated with using the BEV for a greater number of kilometers per annum. In the case of car sharing, if members use BEVs for shorter distance trips, resulting in less daily mileage than an ICE vehicle, the car sharing operator does not accrue the benefits associated with BEVs. As the range of affordably-priced BEVs increases, the range anxiety experienced by car sharing members should diminish, allowing car sharing operators to benefit from a lower operational cost per kilometer. In the case of taxi and ride hailing service drivers, the opportunity to experience lower operational costs per kilometer is possible for those who work longer hours. It should be noted that ride hailing driver profiles vary from region to region. For example, in North America, the large majority of ride hailing drivers are part-time drivers57, whereas in Europe, for regulatory reasons, they tend to be full-time drivers. Consequently, the majority
57 Source: interviews undertaken in the context of this research. Estimate of 85% of Lyft drivers driving part time (https://qz.com/india/926220/uber-in-
india-is-fundamentally-different-from-uber-in-the-west/)
Operational viability Financial viability
Access to electric vehicles, parts
Insufficient supply. If the vehicle requires repairs, difficulty accessing parts, delays.
High cost of the parts compared to ICE vehicle parts. When a vehicle needs to be repaired, parts delays result in loss of revenue generation opportunities.
Availability of model options
Model options are significantly limited compared with ICE models.
Access to reliable, durable vehicles
In certain emerging markets, ZEV access and/or availability is limited to domestically-manufactured vehicles that lack reliability, durability.
Lack of vehicle durability and reliability results in additional costs. Every minute that a vehicle is not operating represents lost revenue potential.
Access to affordably-priced vehicles
The acquisition cost of a BEV is higher than that of an ICE. The higher capital cost can however be offset by lower operational costs when the EV is used for a greater number of miles / kms per annum.
Vehicle range The more limited the electric range of the vehicle, the greater the operational limitations and challenges.
The more limited the vehicle range, the less profitable it is to operate within a shared fleet given the need for frequent stopping for charging. Every minute that the vehicle is charging is a minute that it is not being used for revenue generation.
Availability of public charging infrastructure in urban environments
The lower the availability of charging infrastructure in urban environments, the greater the operational difficulties of incorporating BEVs in shared use fleets.
The lower the availability of DC fast charging in urban environments, the more time spent charging, the less time is available for revenue generation.Cost of purchase, installation and operation of charging infrastructure, when not supplied by government.
Dedicated access to urban DC fast charging infrastructure
If urban DC fast chargers are shared with the public, their availability for use by shared use fleets is diminished. This may result in queuing and loss of revenue generation time. Some fleets have to invest in their own charging infrastructure (purchase, installation & operation of the chargers)
Access to amenities at urban DC fast charging locations
Location of charging far from access to amenities (washrooms, coffee shops, fast food outlets) diminishes shared use BEV driver ability to use the time required for charging to undertake activities that they would likely have stopped for.
Access to such amenities at urban DC fast charging locations results in less time "wasted", thereby maximizing revenue generation time.
Strategic location of charging infrastructure
Availability of affordably-priced electricity
The higher the cost of electricity or use of shared use DC faster chargers, the higher the cost of operation. Demand charges also add to cost.
VE
HIC
LES
CH
AR
GIN
G
CHALLENGES
The closer the DC fast charging infrastructure is located to where the shared use vehicles move, the less time lost in traveling to & from the charging location. This maximizes the revenue generating time for the shared use BEV driver. The closer the BEV is to the charging location, the less range is consumed in travel to and from the charger. Optimal placement requires data sharing between mobility providers and organizations responsible for placement of charging infrastructure.

Accelerating the Transition to ZEVs in Shared and Autonomous Fleets 25
of North American ride hailing partner-drivers would likely not experience the BEV operational savings associated with greater annual mileage. Transportation Network Company (TNC) partner-drivers that rent Chevrolet Bolt EV vehicles from Maven Gig58 pay USD $239 per week which includes insurance, maintenance and charging. To maximize the return on investment of the rental, these partner-drivers drive for TNCs full time. The high demand for the Chevrolet Bolt EV vehicles at an annual rental price of USD $12,428 supports the premise that the purchase price of the ZEV is an impediment to purchase. In fact, in California where Maven Gig Bolt EV demand exceeds supply, after purchase incentives, the purchase price of a Bolt EV is approximately USD $25,00059. Primary research undertaken indicates that shared use would be better served by the removal or reduction of restrictions to incentive access. The Energy Saving Trust research reveals that the economic viability of using a BEV for private hire in London was limited by the vehicle range, the insufficient number of chargers as well as the less than optimal distribution of the charging infrastructure. In fact, the authors state that “most driver-partners reported wanting to drive at least an additional 10 hours more per week than was possible” 60. The combination of longer-range BEVs and access to strategically-located DC fast charging stations in urban settings, where much of the ride hailing and taxi activity takes place, would minimize the time wasted to, from and at the charging location. This would increase the financial viability of using a BEV in the context of taxi and ride hailing services. If the DC fast chargers were also located in close proximity to such amenities as washrooms and retail establishments serving food and beverages, the time waiting for the vehicle to charge could be used by the driver more effectively, maximizing revenue generation time. In a future of shared autonomous ZEVs, many of the preceding challenges will be eliminated. For example, battery performance improvements will eliminate range issues. Representatives of companies working with shared AV fleets stated that while the intent is to use electric AVs, charging models are currently being studied. Will shorter-range vehicles be used and switched while others are charging? Will longer-range vehicles be preferred? Will battery switching become an option? Where will the vehicles charge? At urban hubs or depots on the outskirts of cities? How will the charging happen? Through induction or through other means? Reasons for adopting BEVs in shared mobility While the challenges associated with incorporating BEVs in shared mobility are numerous, an increasing number of fleets are adopting them. The reasons provided by interview respondents are:
• Financial: o Lower maintenance costs of BEVs although several respondents stated that when a vehicle requires
repairs, the cost is significantly greater o Lower energy costs
• Coolness factor associated with BEVs • Silence and no vibration are appreciated by users (passengers and drivers) • Environmental consciousness and commitment to sustainability • Contribution to improving relationships with municipal governments who are interested in lowering
pollution in their cities • Preparing for tomorrow where mobility is increasingly electric.
58 https://mavengig.maven.com/us/en/ 59 https://electrek.co/2017/03/20/chevy-bolt-ev-discounts/ 60 http://www.energysavingtrust.org.uk/sites/default/files/reports/Uber%20EV%20Trial%20-
%20Electric%20Private%20Hire%20Vehicles%20in%20London_1.pdf

Accelerating the Transition to ZEVs in Shared and Autonomous Fleets 26
Logistics, operations of BEVs within shared use mobility Using BEVs in shared use modes involves planning and operational adjustments to compensate for the some of the previously-mentioned challenges, particularly the limited vehicle range of some BEV models as well as the lack of DC fast charging infrastructure in strategically-located urban areas. The business models being very dissimilar, there are several differences in operating BEVs in car sharing versus taxi and ride hailing. Car sharing operates in two ways: free-floating and station based. Free-floating schemes use the latest tracking technology to provide customers with more flexibility. A member can see which cars are available on a mobile app and chooses the closest one. Once the member is finished using the car, he/she can drop it off at any location, usually near their destination. Station-based car sharing, on the other hand, provides less flexibility with the member picking up and returning the vehicle at fixed locations (but not necessarily the pick-up location). The logistics and operations associated with using BEVs therefore vary as a function of the car sharing model used by the operator. Bolloré’s61 BEV car sharing model is an example of station-based BEV car sharing. The member picks up the BEV from a charging point and when finished, returns it to a charging point where he/she is required to plug in the vehicle. This type of operation currently necessitates at least one, and more likely two, Level 2 charging stations per vehicle62. Although, as vehicle range improves, this is likely to change. Communauto’s Auto-mobile63 and car2go64 are examples of free-floating car sharing models. Both of these companies have personnel to charge the vehicles, and after being charged, to park them in areas where demand exists. In the case of some car2go operations, customers receive credits if they connect a vehicle with less than 50 percent of range in a charger. Regardless of the car sharing model, technology is used to track the BEV’s available range. When the vehicle’s range is identified as being low (depending on the car sharing operator: between 15 and 25 percent), the BEV is removed from the list of available vehicles, allowing the vehicle the time to charge. With the commercialization of AV technology, taxi, car sharing and ride hailing can offer the same service: autonomous ride hailing or robotaxi services. The services offered will likely be very similar to ride hailing without a driver. As discussed in Section 3, it will be essential for these services to act as first/last-mile connectors to public tansport services. Trip distance Despite the fact that the state of charge is tracked, trip distance is impacted when using BEVs in car sharing. Car sharing companies that operate both BEVs and ICE vehicles in their fleets stated that for shorter-distance trips, members use both propulsion technologies. However, for longer-distance trips, members presently tend to reserve ICE vehicles. This is graphically represented in Figure 6. Communauto’s experience in Montréal (Canada) is that members’ preference for ICE vehicles is evident for trips of 25 km or more. The longer the trip distance, the lower the preference for a BEV. Similar experiences were noted by BMW ReachNow operations in the United States, where ICE vehicles are more typically used for longer-distance trips, although precise distances were not noted. According to car sharing operators interviewed, European car sharing trips are typically shorter than those in North America, and no clear or precise trip distance differences were specified for the combustion vehicle technologies.
61 Bolloré has BEV car sharing operations in the U.S.,US, the U.K.,UK, Singapore. The company’s operations in France were terminated July 2018. 62 Bolloré car sharing operations in Singapore: by 2020, 2000 charging stations for 1000 BEVs. 63 Primary operations in Montréal, Canada. 64 Car2go has all-electric fleets in three European cities (Madrid, Amsterdam and Stuttgart) and is testing them in Montréal, Canada. Car2go withdrew
its all electric fleet from San Diego due to a lack of chargers.

Accelerating the Transition to ZEVs in Shared and Autonomous Fleets 27
Figure 6. Vehicle type preference by trip distance (in kilometers) for car sharing, Montréal
Source: Communauto, Montréal, 2017
Taxi operations vary depending on whether the BEV taxi is part of a centrally owned, operated and controlled fleet or is owned by the driver. In the former case, the BEV returns to a central location at the end of the day, where overnight charging is possible. The challenge is to optimize the movement of the taxis, keeping vehicle range and available charging locations and opportunities in consideration. In the latter case, the owner-driver, just as any other BEV driver, is responsible for monitoring the battery’s state of charge and for charging the vehicle before the battery is depleted. In ride hailing, the partner-driver owns, leases or rents the vehicle he/she operates65. Like the taxi owner-driver, the ride hailing partner-driver is responsible for monitoring the battery’s state of charge and for charging the vehicle before the battery is depleted. With the recent launch of the UberELECTRIC program, Uber has introduced 30-minute trip notifications for BEV drivers to inform them of trip length before picking up a rider. Longer-range BEVs will make logistics associated with state of charge monitoring, route optimization and charging planning significantly simpler. AVs are expected to contribute to urban sprawl, enabling increased driving distances. As stated in Section 3, government policy and regulation will be required to support shared use mobility, active mobility and public transport use. Where AV ride hailing is used, policies, incentives and disincentives should prioritize pooled rides over single-occupant travel. Pricing levers will be important in encouraging shared trips and minimizing zero-occupancy travel. The objective is to have an autonomous electric MaaS. Daily vehicle kilometers traveled and parking time As illustrated in Figure 7, the daily VKT varies by mobility model and jurisdiction. The number of VKT per vehicle is greater in North America than in Europe. This reflects the longer commutes and geographic size of urban and suburban areas in North America. Unlike car sharing where the vehicle travels only when it is generating revenue, in the taxi and ride hailing models, the vehicle travels in between revenue-generating trips. In fact, where taxi statistics were provided, it is estimated that half the VKT are non-revenue generating. In ride hailing, given the use of algorithms for more optimal vehicle positioning, non-revenue generating mileage is lower. Within car sharing models, the vehicles are parked the majority of the time. Interview respondents stated that the vehicle is parked between 55 and 75 percent of the time. 65 Unlike the majority of EV owners who have a dedicated place to park (and therefore install a charger), the majority of ride hailing partner-drivers do
not have access to dedicated parking, relying solely on public charging stations for charging their vehicles. Without overnight charging at home, more frequent public charging will be required. This is supported by the Energy Saving Trust findings in London.

Accelerating the Transition to ZEVs in Shared and Autonomous Fleets 28
Figure 7. Vehicle kilometers (and miles) traveled by mobility model66
The VKT of the average shared ZEV AV in North America will likely continue to be greater than that of the average shared ZEV AV in Europe. With no driver fatigue to consider and advanced algorithms maximizing revenues per vehicle, the only non-revenue generating time will be time allocated to vehicle charging/refueling, maintenance and cleaning. BEV range and charging needs The difference in how the vehicles are used, the length of the journeys and the daily VKT by vehicles in car sharing, taxi services and ride hailing have important implications for charging needs. In addition to how the vehicle is used (depending on business model), the range of the vehicle and, in the case of vehicles used in taxi and ride hailing services, the availability of home charging (or lack thereof) will impact the charging requirements. Car sharing: BEVs used in car sharing operations tend to have more limited range (examples include: Renault ZOE, Nissan LEAF and Smart ForTwo electric drive) but are used for a limited number of kilometers per day, with the vehicle being parked more than half of the day. Access to Level 2 charging in areas where car sharing members pick up and drop off the vehicles currently meets the needs of these operators. Taxi: An array of BEVs with various ranges67 are used in taxi services (examples include: Tesla Model S, Renault Zoe, Nissan LEAF, Kia Soul EV, BYD e6). Given the daily VKT of these vehicles, access to DC fast charging would minimize the time dedicated to charging, maximizing the revenue-generating time.
Ride hailing: As in car sharing, the BEVs in ride hailing tend to have limited range. Although, with the arrival of longer-range affordably-priced models such as the Chevrolet Bolt EV, longer-range BEVs will increasingly be used in this mobility model. BEVs in ride hailing are used both for personal use as well as for revenue generation. The number of daily VKT varies widely depending on the number of hours the driver is on the ride hailing platform. Given that the large majority of ride hailing partner-drivers do not have access to home-based charging, access to DC fast charging becomes essential. As with taxis, fast charging would minimize the time dedicated to charging, maximizing revenue-generating time.
66 Based on primary research undertaken by MARCON. 67 Ranges vary from 120 to 535 km.
TaxiCar sharing Ride hailing
Free floating Station based One shift Double / triple shift Personal use Ride hailing
use
Part-time*
(from a couple
of hours to 20)
Full-time (> 20
hours)
Can exceed 200 km or 125 miles per day
Varies depending on
number of hours
Average varies by
jurisdiction
Includes both passenger VKT and no passenger VKT as drivers drive to & between trips seeking next passenger
• Free floating: more rides / week than station based but shorter length trips than station based
• Average trip length (free floating and station based): approximately 50% longer in NA than in Europe
• Free floating:• NA average: 11 km /
7 miles• Europe average: 7 km /
4.4 miles
• Average daily VKT: • Station based approximately
double free floating• In fleets with both EV and ICE
vehicles, EV annual VKT is almost half that of ICE VKT
• NA: 50-70 km / 30-45 miles• Europe: 30-55 km / 19-35 miles
• Average % of time parked: 55-75%
• Average trip length: longer in NA than in Europe
• Daily VKT:• NA: 200-350 km / 125-220 miles• Europe: 90-120 km / 60-70 miles
• VKT with passenger: 40-50%
• Average trip length: longer in NA than in Europe
• VKT with passenger: 55-65%
• Full time vs part time: • NA: 75-85% of drivers are part
time• Europe & Asia: full time drivers

Accelerating the Transition to ZEVs in Shared and Autonomous Fleets 29
Longer-range affordably-priced BEVs will improve the value proposition and encourage shared use fleets to integrate them within their operations. Longer-range BEVs will require less frequent charging, minimizing the time dedicated to charging (including the time driving to and from charging station). For car sharing operators, longer-range affordably-priced BEVs will result in members having the confidence to use them for longer-distance travel and increase the number of km/day driven by each vehicle. While no given charging model has been specified for the use of electric AVs in ride hailing, it would be reasonable to expect that travel will be optimized through algorithms, charging the vehicle whenever and wherever it makes most sense. Some mobility visionaries have discussed the use of charging hubs. Questions regarding the use of induction charging requiring no human intervention for electric AVs remain unanswered.

Accelerating the Transition to ZEVs in Shared and Autonomous Fleets 30
5 Practicality and business case for BEVs in shared use mobility
The practicality of using BEVs in shared mobility takes into consideration a multitude of factors, including financial viability (cost of purchasing / leasing / renting the vehicle, annual expenses of a BEV compared to an ICE vehicle) and operational viability (access to strategically located charging infrastructure). A cost comparison of a BEV versus a comparable ICE vehicle68 is presented in Figure 8 for car sharing and in Tables 5, 6 and 7 for ride hailing. The analysis has been undertaken for two jurisdictions. Cost of ownership and BEV value proposition in car sharing To maximize confidentiality of information shared, Figure 8 presents the revenues as well as the purchase cost and operating expenses of the average BEV compared with the average ICE vehicle69 in car sharing fleets operating in North America and in the EU In this graph, the ICE vehicle is the baseline (100 percent) and the BEV is compared to that baseline.
Figure 8. BEV free-floating car sharing revenues, costs and expenses as a percent of ICE vehicle
Source: MARCON analysis based on interviews undertaken, 2018 While in the EU, the revenues generated by a BEV and an ICE are reported to be similar, in North America, the experiences of the free-floating car sharing operators interviewed indicate that the distances covered with a BEV are shorter, resulting in lower annual revenues. The purchase price (even after incentives) of a BEV is higher than the more affordably-priced ICE vehicles in both North America and the EU. This greater vehicle purchase price is reflected in higher annual vehicle depreciation costs. As far as operating expenses are concerned, BEVs benefit from lower energy costs and often from municipal incentives in the form of lower-priced parking permits. However, the cost of moving BEVs to charging infrastructure, charging them and relocating them for use by car sharing members represents a significant cost. BEV logistic-related costs are nine times that of the ICE vehicle in North America and four times that of the ICE vehicle in the EU. To diminish the cost associated with operating BEVs within car sharing fleets, it will be essential to increase the availability of charging infrastructure in locations where members pick up and drop off the vehicles. In increasing the availability of Level 2 chargers in popular pick up and drop off areas, free-floating car sharing operators could 68 BEVs a are technologically superior vehicles compared to the affordably-priced ICE vehicles used within shared mobility fleets. 69 Fleets provided averages. A multitude of BEV and ICE models are used in these fleets.
0%
100%
200%
300%
400%
500%
600%
700%
800%
900%
1000%
Avg # of rides/ day
Avg distance /ride
Avg # ofminutes / ride
Avg VMT /VKT per year
Avg vehiclecost
Avgdepreciation
per year
Avg energy(e lectricity,
fuel) per year
Avginsurance
cost per year
Avgmaintenancecost per year
Avg cleaningcost per year
Avg logisticscost per year
Parkingpermits
N.A. E.U.
EV c
ar s
harin
g re
venu
es &
exp
ense
s as
a %
of I
CE v
ehic
le
REVENUES PURCHASE COST & EXPENSES

Accelerating the Transition to ZEVs in Shared and Autonomous Fleets 31
encourage members to plug in the vehicle after use, thereby decreasing logistics costs. This will require public-private collaborations (including data sharing) involving the municipal government, the electric utility and the car sharing operators. Without financial incentives in the form of lower-priced or free parking permits and the presence of charging infrastructure in strategic locations, the business case for using BEVs in free-floating car sharing operations appears weak. As one North American respondent noted, “If the municipality required us to operate using only BEVs, with the current cost structure, we would go out of business.” Cost of ownership and BEV value proposition in ride hailing In ride hailing, the vehicle is owned (or leased or rented) and operated by the driver. While in North America, ride hailing drivers are predominantly part-time drivers; in Europe and Asia, they are mostly full-time. For the purpose of facilitating comparison, the analysis below has been undertaken for full-time ride hailing drivers in Montréal and London. Data used in Tables 5 and 6 was extracted from multiple interviews with mobility providers as well as through online sites or interviews with third-party stakeholders (examples: insurance brokers, Canadian Automobile Association, Nissan U.K. and Nissan Canada). The findings presented in the 2017 Energy Saving Trust report70 also contributed to the analysis. None of the data relates to any single mobility provider. The vehicles being compared are the 2018 Nissan LEAF and the 2018 Nissan Versa / Nissan New Micra. The ICE models were recommended by Nissan representatives as the closest in size and look to the LEAF. The Nissan Versa / Nissan New Micra are the most affordable Nissan models. Consequently, the comparisons are showing the largest potential discrepancies.
Table 5. Cost of ownership of BEV and ICE in ride hailing – Montréal
Cost of Ownership - Full-time ride hailing driver in Montréal, Québec BEV
Nissan LEAF 2018 (242 km of range)
ICE Nissan Versa 2018
UTILIZATION
Average # of rides / day (a) 18 18
Average distance / ride (b) ∼ 12 km ∼ 12 km
Average # of minutes / ride (c) ∼ 20 minutes ∼ 20 minutes
Average VKT (d) 240 km / day 240 km / day
PURCHASE Average vehicle purchase price BEFORE incentives + taxes (e) $ 45,000 $ 18,400
Average purchase price AFTER purchase incentives - $8,000 incentive (f) $ 37,000 $ 18,400
ANNUAL EXPENSES
Average depreciation per year (g) $ 6,900 $ 4,900
Average fuel costs per year (h) $ - $ 6,401
Charging infrastructure costs (DCFC use 5x/week + Level 2 use / 5x/week) (i) $ 2,500 $ -
Average insurance cost per year (j) $ 1,176 $ 1,396
Average maintenance cost per year (k) $ 500 $ 2,330
EXPENSES TOTAL (all other expenses assumed to be similar) $ 11,076 $ 15,027
REVENUE Average gross annual revenues per full-time driver (l) $ 49,500 $ 55,000
Average after-tax annual revenues per full-time driver (m) $ 39,150 $ 42,608 (a) Assumption based on interviews with ride hailing and taxi industry representatives. Assumptions: 10 hours/day of work, average ride duration of 20 minutes and 60% of time with customer =
18 rides per day. (b) Assumption based on interviews with ride hailing and taxi industry representatives (c) Assumption based on interviews with ride hailing and taxi industry representatives (d) Natural Resources Canada/Office of Energy Efficiency, 2008 Canadian Vehicle Survey Update Report, 2010 & extrapolations based on interviews with ride hailing & taxi industry
representatives (e) www.nissannews.com (f) vehiculeselectriques.gouv.qc.ca (g) Extrapolation based on CAA annual driving cost calculator: https://www.caa.ca/carcosts/ (h) Extrapolation based on CAA annual driving cost calculator: https://www.caa.ca/carcosts/ (i) https://lecircuitelectrique.com, assume no home charging available (j) Interview with insurance broker, Assurances Simon & Associés, Montréal (k) Extrapolation based on CAA annual driving cost calculator: https://www.caa.ca/carcosts/ (l) https://www.uberdrive.ca/much-uber-drivers-make-montreal-start-driving/ EV driver revenue is 10% lower to reflect time revenue-generating time dedicated to driving to charging infrastructure, charging and returning to earn revenues. While the Energy Saving Trust
report concludes that the percentage is 20% loss of revenue generating time, 10% is used to reflect the range of the 2018 Nissan Leaf (m) https://www.ey.com/ca/en/services/tax/tax-calculators-2018-personal-tax
70 Alexander Lewis-Jones, Jacob Roberts, Electric Private Hire Vehicles in London, Energy Saving Trust, 2017

Accelerating the Transition to ZEVs in Shared and Autonomous Fleets 32
Table 6. Cost of ownership of BEV and ICE in ride hailing – London
Cost of Ownership - Full-time ride hailing driver in London, UK BEV
Nissan LEAF 2018 (150 miles of range)
ICE Nissan New Micra 2018
UTILIZATION Annual mileage (n) 27,800 miles 27,800 miles
Daily mileage (o) 76 miles 76 miles
PURCHASE Average vehicle purchase price BEFORE incentives + taxes (p) £ 26,800 £ 13,900
Average purchase price AFTER purchase incentives - £4,500 incentive (q) £ 22,300 £ 13,900
ANNUAL EXPENSES
Average depreciation per year for first three years (r) £ 1,178 £ 2,178
Average fuel costs per year (s) £ - £ 2,757
Charging infrastructure costs (DCFC use 3x/week + Level 2 use / 7x/week) (t) £ 1,014 £ -
Average maintenance cost per year (u) £ 239 £ 275
Average London congestion charge (v) £ - £ 2,500
EXPENSES TOTAL (all other expenses assumed to be similar) £ 2,431 £ 7,710
REVENUE Average gross annual revenues per driver (w) £ 25,650 £ 28,500
Average after-tax annual revenues per driver (x) £ 22,890 £ 25,170
(n) Annual mileage is the sum of the average vehicle mileage in the UK (7,800) + annual mileage of a taxi in London (20,000) https://www.insuretaxi.com/2016/08/taxi-driver-survey-
2016/ (U.K. Department for Transportation, National Travel Survey: England 2016, 2017 (o) Annual mileage / 365 (p) www.nissan.co.uk (q) www.nissan.co.uk (r) https://www.independent.co.uk/life-style/motoring/the-cars-that-will-cost-you-most-in-depreciation-a7992941.html (s) www.nimblefins.co.uk (t) Given daily VMT, make most use of Level 2 and use DC fast charging 3 times per week https://pod-point.com/landing-pages/cost-of-charging-electric-car assuming no home
charging available (u) For BEV: Cost estimation of £845 for the first five years is based on current service costs for minor reairs of £149 and £199 for major repairs for a 2018 Nissan Leaf Acenta (base
model). Information was provided by the Servicing Department of Shelbourne Motors Nissan (UK) on Sept. 11, 2018. For ICE vehicle: £ 256 to £ 275 per year (for first 5 years of ownership). Information was provided by the Servicing Department of Shelbourne Motors Nissan (UK) on Sept. 14, 2018
(v) www.nissan.co.uk (w) https://www.indeed.co.uk/cmp/Uber/salaries?location=GB%2FENG%2FGTL%2FLondon EV driver revenue is 10% lower to reflect time revenue-generating time dedicated to driving to charging infrastructure, charging and returning to earn revenues. While the Energy
Saving Trust report concludes that the percentage is 20% loss of revenue generating time, 10% is used to reflect the range of the 2018 Nissan Leaf (x) https://www.gov.uk/income-tax-rates Personal allowance: £11,850, tax rate: 20% Today’s charging infrastructure has generally been deployed to meet the needs of personal-use vehicles. However, the charging behaviours, patterns and needs of shared mobility vehicles are different from those of private owners. The growth of these shared use mobility models necessitates modifications to charging infrastructure deployment strategies (type of charging stations and location). To minimize the risk of stranded assets, these strategies should take into consideration the anticipated increased range of BEV models as well as the arrival of AVs (including associated changes in mobility patterns and behaviours).

Accelerating the Transition to ZEVs in Shared and Autonomous Fleets 33
Given the socio-economic profile of the average ride hailing driver71, a key assumption in the preceding analysis is that he/she does not have access to home charging72. Access to strategically-positioned DC fast charging therefore becomes essential73. As noted in the Energy Saving Trust report, ride hailing partner-drivers “overwhelmingly reported the network as being insufficient in terms of both the number and distribution of chargepoints across the city, and time taken to charge the vehicle”. In fact, according to this same report, “most partner-drivers reported wanting to drive at least an additional 10 hours more per week than was possible.” This represents approximately 20 percent of the work time and accordingly, 20 percent of the revenues generated. Given the greater range of the 2018 Nissan LEAF compared to many of the affordable BEVs on the market at the time the Energy Saving Trust research was undertaken, the results presented in Tables 5 and 6 assume that the revenue impact is 10 percent instead of 20 percent. Table 7 presents a summary of the information in the two preceding tables to assess the payback period for a BEV driver in Montréal and one in London under the current conditions and if revenues were equivalent to the driver of an ICE vehicle. The results for each are shown in the applicable market currency (i.e., Canadian dollars and British pounds).
Table 7. BEV in ride hailing payback, Montréal and London74
Under the current conditions, the payback period for a BEV driver in Montréal is 37.7 years and in London 2.8 years. By raising the income of the BEV ride hailing driver to that of the ICE vehicle ride hailing driver, by minimizing the time wasted in driving to and from charging infrastructure and waiting for the vehicle to charge (maximizing revenue generating time), the payback improves considerably: 4.7 years in Montréal and 1.6 years in London. If ride hailing drivers are to adopt BEVs at scale, the availability of strategically-located DC fast charging 71 Research suggests that the household income of at least half of ride hailing drivers is lower than the median household income of the general
population. In California, for example, approximately 50% of surveyed Lyft drivers in LA, San Diego and San Francisco reported an annual household income of $50,000. The median annual household income in California is close to $64,000. Uber and Lyft report that their partner-drivers rely heavily on used cars. In 2015, used EV owners reported an average household income of $173,400. (Source: California Public Utilities Commission Policy & Planning Division: “Electrifying the Ride-Sourcing Sector in California”, April 2018)
72 More than 80% of the TNC partner-drivers renting Chevy Bolt EV vehicles from Maven Gig have no access to dedicated parking. This is confirmed by ride hailing companies operating in multiple cities throughout the world. Lyft reports that most TNC drivers who rent vehicles through its Express Drive program have no access to home charging, relying solely on public charging. (Source: California Public Utilities Commission Policy & Planning Division: “Electrifying the Ride-Sourcing Sector in California”, April 2018)
73 This assumes a collaboration, including data sharing, between relevant public and private stakeholders. 74 Please see Appendix F for single currency conversion.
BEV ICE ∆ BEV ICE ∆
Average purchase price AFTER purchase incentives 37,000$ 18,400$ 18,600$ 22,300£ 13,900£ 8,400£
Annual expenses (all other expenses assumed to be similar) 11,076$ 15,027$ 3,951$ 2,431£ 7,710£ 5,279£ Average annual after-tax annual revenues per full-time driver 39,150$ 42,608$ 3,458$ 22,890£ 25,170£ 2,280£ Annual impact (lower expenses and lower income) 493$ 2,999£
Payback (years) 37.7 2.8
BEV ICE ∆ BEV ICE ∆
Average purchase price AFTER purchase incentives 37,000$ 18,400$ 18,600$ 22,300£ 13,900£ 8,400£
Annual expenses (all other expenses assumed to be similar) 11,076$ 15,027$ 3,951$ 2,431£ 7,710£ 5,279£ Average annual after-tax annual revenues per full-time driver 42,608$ 42,608$ -$ 25,170£ 25,170£ -£ Annual impact (lower expenses and lower income) 3,951$ 5,279£
Payback (years) 4.7 1.6
Positive for the BEV ride hailing driverNegative for the BEV ride hailing driver
EQUAL INCOME BEV & ICEMontréal, QC, Canada London, U.K.
Montréal, QC, Canada London, U.K.CURRENT CONDITIONS

Accelerating the Transition to ZEVs in Shared and Autonomous Fleets 34
infrastructure will be key. To ensure that charging time is used most effectively, the DC fast chargers should be located where riders are expected and in close proximity to washroom facilities as well as food and drink retailers. This access will contribute to improving the financials of ride hailing drivers and making BEVs a viable option. The increased use of DC fast charging by shared use vehicles would improve the business case for charging infrastructure deployment. Currently, given limited usage of DC fast charging stations, the business case associated with their deployment is weak. However, the usage of this infrastructure by shared use mobility fleets improves the business case. In fact, according to Maven representatives, in urban areas where the Maven Gig program is available, the use of DC fast charging infrastructure reaches maximum use, based on hours of operation.

Accelerating the Transition to ZEVs in Shared and Autonomous Fleets 35
6 Shared electromobility deployment conclusions
Key success factors Table 8 summarizes the key success factors associated with using BEVs in shared use mobility mentioned by interview respondents. It is important to note that these factors are also identified as challenges. Vehicle range improvements combined with expected price parity will be important contributors to BEV adoption by shared use mobility fleets. In the meantime, purchase and other75 incentives contribute to improving the value proposition for the use of BEVs in shared mobility.
Table 8. Key success factors associated with using BEVs in shared use mobility based on interviews
Lessons learned Key lessons shared by respondents include (a) the need to design policies, incentives and charging deployment strategies for shared mobility, (b) the value of collaboration between public and private stakeholders, (c) the importance of technology in helping to overcome some of the challenges to BEV adoption and (d) the usefulness of progressive implementation.
• Policies, incentives, charging deployment: The policies, incentives, programs and charging infrastructure deployment strategies are not designed for shared use fleets. For greater deployment of BEVs within such fleets, governments will need to take the realities of these fleets into consideration. Unlike the individual motorist whose purchase criteria includes non-financial considerations, in the case of shared use mobility fleets, financials are more important. In the context of shared use fleets, the vehicle is a revenue generation tool. As far as charging deployment strategy is concerned, decisions of what charging technology and location of the charging infrastructure should be made with a good understanding of the charging needs of shared mobility fleets.
• Collaboration: Partnerships between shared fleet operators and other stakeholders (including electric
utilities and municipalities) facilitate the adoption of BEVs by shared use mobility fleets. If shared electric vehicles are to be increasingly used within urban environments, it will be important for municipal / local governments to engage with shared use mobility fleets to understand their needs, to develop a multi-departmental approach to curbside access and potentially to the creation of mobility hubs. Working
75 Examples: parking privileges for electric car sharing vehicles and free charging.
Key Success Factor Expectations / Opportunity
Vehicle range Longer range combined with affordably-priced BEVs would allow for greater VKT / VMT between charging.
Multiple manufacturers have announced the launch of longer-range BEV models.
Access to affordably priced EVs
Purchase price being higher than comparable ICE vehicles, it represents a challenge for shared use fleets and individual drivers working in shared use mobility as it impacts total cost of ownership.
BEVs are expected to reach price parity by the early 2020s in Europe and by 2025 in North America.
Availability of charging, particularly DC fast charging
DC fast charging is key to the operations of many shared mobility operations as it minimizes the time that the vehicle is not generating revenue.
DC fast charging purchase costs are declining. A greater collaboration between private and public stakeholders can result in a greater penetration of these units.
Strategic charging locations of DC fast chargers
DC fast charging has generally been used to facilitate intercity travel. Around cities, many of the DC fast chargers have been located on city limits. By locating them where shared use vehicles travel frequently, it can maximize use and increase revenue generation time.
By strategically locating the DC fast chargers in urban areas (where riders are located) and making use of shared mobility hubs that are accompanied by washroom amenities and food & drink shops exist, it can minimize the time required for charging, maximizing revenue generating time.
CollaborationsGreater collaboration between private and public stakeholders can encourage the greater adoption of ZEVs in shared use mobility fleets.
Multi-departmental government approach implementing a strategy for shared use ZEVs. Collaboration desired between municipalities, electric utilities and share used mobility providers.
Education
Educating car sharing members is important to ensuring proper use and adoption of ZEVs. Exposure of car share members and taxi and ride hailing riders to ZEVs can have a positive impact on communicating positive messaging to the general public.
Using taxi drivers and ride hailing partner-drivers who drive ZEVs as ZEV ambassadors is an important opportunity to educating the general public and to ZEV adoption by consumers.

Accelerating the Transition to ZEVs in Shared and Autonomous Fleets 36
together, public and private stakeholders can bring about an accelerated adoption of BEVs, enabling cities to better meet climate goals, fostering innovation of services and infrastructure and providing greater benefits to the public. The availability of strategically-located DC fast charging, being of great importance to the operational and financial viability of BEV shared use fleets, is an opportunity for mobility operators to work with public and private stakeholders to ensure the most impactful placement of the right type of charging technology to maximize use by fleets. As mentioned earlier, this will involve data sharing. In the longer-term, the collaboration will set the stage for the most effective transition to and sustainable implementation of shared BEV AVs within a MaaS system.
• Technology: The use of technology to monitor state of charge and optimize routing and charging is critical. In fact, taxi fleets where vehicles are owned and operated by a central entity have concluded that charging decisions should not be left to driver. Rather, central planning should direct drivers to charging locations at the most opportune times. The use of technology can be used to overcome the challenges of using BEVs in shared mobility. For example, Uber customized route information for the benefit of ZEV partner-drivers within the UberELECTRIC program identifying longer-range journeys. The use of technology will also help the transition to shared BEV AVs within a MaaS system.
• Progressive implementation: Several fleet operators recommended progressively increasing the number of ZEVs within the fleet. This will allow management to understand the ZEV-related challenges and to adjust operations accordingly. The use of pilot projects can be useful.
Policies that support electromobility in shared use fleets Given the anticipated growth of shared mobility fleets (see examples in Appendix B) and the greater number of VKT of the average shared vehicle compared with the average personal passenger vehicle, the opportunity for governments to develop policies, regulations and programs that impact higher-use vehicles should be seized. As discussed in Section 3, shared mobility models are not likely to result in environmental benefits without policy action. Given that the shared mobility fleets operate within municipal / regional / state / provincial regulatory frameworks, many of the policies and regulations that will impact the accelerated adoption of ZEVs in shared fleets will be developed and implemented by these governments. When asked about policy-related thoughts, interview respondents underscored that existing electromobility-related programs, incentives, and policies tend to target the average consumer, yet shared use mobility fleets are the low-hanging fruit with respect to impacting GHG emissions reductions. The key to increasing the penetration of ZEVs in shared use mobility fleets is by improving their economic viability. The use of policies or programs that lower the initial purchase price and/or lower the cost of operating these vehicles can increase the adoption of ZEVs in shared mobility. Potential policy options are provided in Table 9. Several interview respondents recommended that governments provide higher incentives for shared use ZEVs to reflect the greater number of VKT associated with these vehicles, and the associated GHG emissions reductions opportunities. Some government representatives contacted in the context of this research consider that the greater the VKT, the greater the financial savings associated with operating a ZEV. Given these greater energy savings, it could seem intuitive that shared use drivers requires less financial incentive to adopt a ZEV. However, despite the greater savings potential, the socio-economic characteristics of many taxi drivers and ride hailing partner-drivers result in an inability to afford ZEVs due to a higher purchase price.

Accelerating the Transition to ZEVs in Shared and Autonomous Fleets 37
Table 9. Potential policies, programs, measures to increase use of shared electromobility
Policy / program / measure Reasoning Government
level Impact on shared use mobility fleets Challenges / Issues
Purchase incentives ZEV purchase price is higher than comparable ICE models. Lowering purchase price will encourage greater ZEV adoption.
Federal / Regional / State / Provincial
Make ZEVs more affordable for fleet operators and individual owners of vehicles used in shared use mobility
Unlike vehicles used in car share and taxi operations, not all ride hailing vehicles are used on a full-time basis in shared mode. This limits the environmental benefits. Issues with dealing with temporary or seasonal ride hailing partner-drivers. The greater the VKT traveled, the more financial sense for ZEV adoption. Consequently, shared use vehicles have less of a need for purchase incentives.
ZEV per km / mile traveled incentive
Incentives should be environmentally-impact oriented. The greater the VKT, the greater the environmental impact of a ZEV vs an ICE vehicle.
Federal / Regional / State / Provincial
Make ZEVs more attractive to high mileage drivers.
The greater the VKT traveled, the more financial sense for ZEV adoption. Consequently, shared use vehicles have less of a need for purchase incentives. Potentially complicated system to administer.
Installation of charging infrastructure in strategic locations in urban environments
Car sharing operators require easy access to charging infrastructure where members drop off their vehicles. Taxi drivers and ride hailing partner-drivers require easy access to DC fast charging where vehicles circulate. Ideally, DC fast charging hubs will be in close proximity to accessible washrooms and food/beverage retailers. This will minimize the number of stops required by drivers and minimize the distances driven to and from charging.
Federal / Regional / State / Provincial / Municipal
Greater adoption of ZEVs in shared mobility as access to strategically-located charging is perceived as a key barrier to adoption. Mobility hubs where charging is available can present opportunities for navigating to shared ZEV AVs.
Installing charging infrastructure in strategic locations to support shared mobility vehicle use will require collaboration between public (multi-departmental, multi-player: government, utility) and private stakeholders. There are numerous competing interests for limited urban real estate. Potential impact on grid of rapidly increasing the number of DC faster chargers in limited geographic area.
ZEV regulations that encourage auto manufacturers to provide preferential access of ZEVs to fleets
Supply of many ZEV models being limited, the use of regulations to encourage auto manufacturers to fleets priority would facilitate adoption.
Federal / Regional / State / Provincial
Faster adoption of ZEVs by shared mobility fleets Potentially complicated to administer.
Low or zero emission zones
Such zones require fleets to adopt ZEVs without which their vehicles do not have access to parts of the city. (ex: Madrid - access to most of old city)
Municipal Increased use of ZEVs by fleets. Ensure that AVs are ZEVs.
Given limited supply of many ZEV models, securing vehicles will require time. Notice is required to allow for fleets to plan and make the purchases required for uninterrupted service.
Minimum ZEV quotas
Shared use fleets that do not meet minimum ZEV quotas either cannot operate within the city or do not access privileges (ex: parking permits for car sharing operators).
Municipal Increased use of BEVs in all shared use fleet models
Given limited supply of many ZEV models, securing vehicles will require time. Notice is required to allow for fleets to plan and make the purchases required for uninterrupted service.
Parking privileges to BEVs
Provide important parking privileges to BEV shared vehicles or provide lower cost parking permits to BEVs. Parking represents an important cost to car sharing fleets. (ex: EVs park in time limited spots in Helsinki, Free parking for EVs in Stuttgart, Hamburg, Oslo)
Municipal Increased use of BEVs in car sharing fleets
Taxis and ride hailing vehicles do not park as much as car sharing vehicles. This measure is likely not to have an impact on these operations.
Vehicle emission taxing
The greater the VKT, the greater the taxes. Using zero emission vehicles would make more financial sense.
Federal / Regional / State / Provincial
Increased use of zero emission vehicles in all shared use fleet models
Potentially complicated to administer.
Taxation reflected in pricing to encourage pooled instead of single-occupant rides and eventually zero-occupant travel
The higher pricing for rides with lower occupancies would encourage pooling, lower congestion and energy use.
Regional / State / Provincial / Municipal
Increased use of pooling with ride hailing and eventually shared AVs
Administering this program would require collaboration with TNCs, including sharing of data.
Regulation requiring every shared AV to be a ZEV
Given that AVs will result in greater VKT, essential for vehicles to be ZEVs.
Federal / Regional / State / Provincial / Municipal
Increased use of ZEVs among shared AV fleets Will require strong political will.
ZEV mandate with progressively increasing percent of e-VKT quotas with penalties
e-VKT as a % of total VKT by shared mobility operator would recognize the GHG emissions generated by the fleet being operated within its model. This would be a more useful statistic than number of vehicles (ex: the VKT of full-time ride hailing vehicles is greater than the part-time ride hailing vehicle).
Regional / State / Provincial / Municipal
Increased use of ZEVs in shared use fleets - all shared use mobility models
Penalties would add pressure on the shared mobility operator. Would require fleets to share data with public authorities. Would need to be accompanied by ZEV-stimulating conditions, particularly the availability of strategically-located charging infrastructure.

Accelerating the Transition to ZEVs in Shared and Autonomous Fleets 38
With respect to the last potential policy in the preceding table, a regulation to increase the percent of electric VKT, penalties can be structured as presented in the table opposite. The intent being to progressively increase the percentages over time, encouraging shared use fleets to transition towards 100 percent zero-emission vehicles. While it may appear ambitious, Uber has announced that every vehicle operating on its platform in the U.K. will be a PHEV or BEV by the end of 2022. Such a policy places the emphasis on VKT and the impact on GHG emissions. It also eliminates potential issues with inordinate incentives being captured by part-time or occasional ride hailing partner-drivers. This policy would need to be accompanied by a strategic deployment of charging infrastructure to ensure that shared use vehicles can access the charging infrastructure in such a way as to improve the operational and financial viability of BEVs within the various shared use mobility models. The revenues collected through the penalties can be used to finance the charging infrastructure deployment. Another way to encourage the adoption of BEVs within ride hailing fleets is by implementing a Maven Gig76-type or Lyft Express Drive-type program where the partner-driver can rent a vehicle on a weekly basis with an all-inclusive price (combining the vehicle rental, charging costs and insurance). The experience of Lyft Express Drive and Maven Gig indicate that while ride hailing drivers find the BEV purchase price challenging, a weekly price is easier to manage. In fact, according to financial analyses undertaken in the U.S. with the Lyft Express Drive program, the “breakeven point for leasing a [Chevy] Bolt was approximately 260 miles per week…For every mile after the 260-mile mark”, fuel cost savings would return a net gain for the Bolt EV driver versus the ICE vehicle driver. Drivers who leased the Bolt EV drove an average of 450 miles per week, translating to a net gain of $570 per week77. These programs have the advantage of allowing ride hailing partner-drivers to test the BEV technology without making an important financial commitment. After experiencing the financial savings, drivers may opt to purchase, rather than rent, the BEV. Concluding remarks The primary research undertaken, supported by secondary sources, indicate that there are significant environmental benefits associated with accelerating the transition to ZEVs among shared use passenger car fleets. Given the important anticipated growth of shared mobility fleets (see Appendix A) and the greater number of VKT of the average shared vehicle compared with the average personal passenger vehicle, the opportunity for governments to develop policies, regulations and programs that impact higher-use vehicles should be seized. Political action by governments (all levels) will have an important impact on the rate of adoption of ZEVs within these fleets. In fact, without government intervention (policy, measures, regulations), these shared mobility models are unlikely to result in lower-carbon transportation. Policies, programs, incentives and charging deployment strategies will need to be designed specifically for shared mobility and take the following into consideration:
• The difference in environmental impact of BEVs versus PHEVs in the context of shared mobility • The socio-demographic profiles of shared mobility providers (taxi and ride hailing drivers), including the
lack of access of many shared mobility drivers to home charging • The purchase criteria differences between those who purchase/lease/rent a vehicle for personal reasons
and those who do so for revenue-generation purposes (financial considerations are paramount as the vehicle is a revenue generation tool)
76 https://mavengig.maven.com/us/en/ 77 Source: California Public Utilities Commission Policy & Planning Division: “Electrifying the Ride-Sourcing Sector in California”, April 2018
e-VKT as a % of total VKT Penalty0 to > 3% 5x amount per 100 ICE VKT
3% to > 4% 4x amount per 100 ICE VKT4% to > 5% 3x amount per 100 ICE VKT5% to > 6% 2x amount per 100 ICE VKT
6% to > 7.5% x amount per 100 ICE VKT7.5% plus no penalty
0 to > 5% 5x amount per 100 ICE VKT5% to > 6% 4x amount per 100 ICE VKT6% to > 7% 3x amount per 100 ICE VKT
7% to > 8.5% 2x amount per 100 ICE VKT8.5% to > 10% x amount per 100 ICE VKT
10% plus no penalty
Year
s 1
& 2
Year
s 3
& 4

Accelerating the Transition to ZEVs in Shared and Autonomous Fleets 39
• The expected improvements of battery performance as well as the announced release of multiple affordably-priced BEV models
• The arrival of AVs and the likely increase in VKT associated with the use of AVs, unless policy encourages a shift towards shared zero-emission AVs within MaaS transportation systems
• The value of public-private multi-stakeholder collaboration • The importance of integrating ZEV shared mobility objectives within urban sustainable mobility planning.
Improving the economic viability of ZEVs is a key to increasing their penetration in shared use mobility fleets. The use of policies or programs that lower the initial purchase price or lower the cost of operating these vehicles can increase the adoption of ZEVs in shared mobility. Eliminating or loosening the cap for number of vehicles within shared use fleets that can benefit from incentives would be beneficial. The availability of strategically-located DC fast charging being of great importance to the operational and financial viability of ZEV shared use fleets is an opportunity for mobility operators to work with public and private stakeholders to ensure the most impactful placement of the right type of charging technology to maximize use by fleets. The optimal placement of such infrastructure will necessitate exchange of data. In the longer-term, the collaboration will set the stage for the most effective transition to and sustainable implementation of shared ZEV AVs within a MaaS system that encourages the use of transit and active mobility using smaller-size AVs for first/last-mile connections. In addition to the deployment of strategically-located urban charging infrastructure, the use of low- or zero-emission zones can increase the financial viability of BEVs within shared mobility fleets. In fact, as demonstrated in Table 7, the London congestion charges avoided by BEVs play an important role in improving its payback period. Policies that place the emphasis on VKT and associated impact on GHG emissions recognize the higher VKT associated with shared mobility use vehicles and eliminate potential issues associated with inordinate incentives being captured by part-time or occasional ride hailing partner-drivers. In addition, taxation schemes reflected in pricing that encourage pooled rides and discourage single-occupancy rides and in the future, zero and single-occupancy AV rides, will contribute to mitigating VKT, congestion and energy use. The implementation of a Maven Gig or Lyft Express Drive-type program using ZEVs would make such vehicles accessible to shared mobility drivers and result in improving their financial gains. Governments have the opportunity to set ambitious targets that can be achieved through multi-stakeholder collaborations. This will require vision, multi-departmental planning and public-private efforts to bring all-electric, autonomous MaaS systems to life. Using taxation levers to impact the pricing of single and, in the future, zero-occupancy travel is an effective means of mitigating VKT, congestion and energy use. To ensure maximum positive benefits for the public and public funds, policies should encourage active mobility and maximize the use of public transit assets. Through policies, regulations and taxation, future AV ride hailing must be encouraged to prioritize pooled rides over single/zero-occupant travel. Policies, incentives and disincentives will also be required to ensure AV ride hailing providers work with public transport, maximizing use of the public transit services. The objective is to have an autonomous electric MaaS where shared, pooled AVs connect passengers with public transport and where active mobility is encouraged. While the primary research undertaken lead to an analysis that focused on BEVs, looking into the future, there may be niche shared mobility applications and duty cycles where FCEVs and PHEVs are better suited than BEVs.

Accelerating the Transition to ZEVs in Shared and Autonomous Fleets 40
Appendix A Growth of shared mobility services
Figure 9. Growth of shared mobility services
Sources: https://orfe.princeton.edu/~alaink/SmartDrivingCars/PDFs/Rethinking%20Mobility_GoldmanSachsMay2017.pdf https://www.gminsights.com/industry-analysis/carsharing-market https://www.mckinsey.com/industries/automotive-and-assembly/our-insights/gauging-the-disruptive-power-of-robo-taxis-in-autonomous-driving https://pitchbook.com/news/articles/uber-v-waymo-in-28-trillion-battle-for-robo-taxis https://www.nextbigfuture.com/2017/10/worldwide-ridesharing-at-285-billion-per-year-by-2030-will-be-profitable-when-self-driving.html https://www.ft.com/content/8c79dabe-47a2-11e8-8ae9-4b5ddcca99b3 http://www.businessofapps.com/data/uber-statistics/ https://www.recode.net/2018/6/24/17493338/ride-sharing-services-uber-lyft-how-many-people-use https://www.statista.com/outlook/368/102/ride-sharing/europe#market-revenue
Taxi Car Sharing Ride Hailing
SHARED USE MOBILITY MODELS TODAY – HUMAN DRIVEN
SHARED USE MOBILITY MODELS TOMORROW – AI DRIVEN
Robo-taxis
$108 billion $36 billionGlobal market (2017)
NEWER BUSINESS MODELS
Global market (2030) $285 billion
# of trips (2017)
# of trips (2030)
6 billion
83 billion
$54 billion
$1.5 billion
# of vehicles (2017) > 100,000
$2.8 trillion
# of users (2018) >600 million
millions

Accelerating the Transition to ZEVs in Shared and Autonomous Fleets 41
Appendix B List of ZEV shared mobility services
Figure 10. Selected list of shared mobility programs of various types around the world
Country City / Region Program name / service /
company Business model Estimated ZEVs Example models
Belgium Antwerp Poppy Car sharing Audi A3 g-tron, Volkswagen e-Golf Belgium Brussels ZenCar Car sharing/car rental Renault Zoe Belgium Brussels Taxi 50 BYD e6 Belgium Flanders Taxi
Bhutan Thimpu Taxi & government fleet
Brazil Urbano Carsharing Car sharing 15 BMW i3
Bulgaria Sofia Spark Car rental and ride sharing
Canada Govt of Québec 50 Toyota Mirai Canada Kelowna, BC Current Taxi Taxi 2 Tesla Model S, Tesla Model X Canada Laval Taxi Coop Laval Taxi 30 Model S & other BEVs Canada Montréal Communauto / Automobil Car sharing 100 Nissan Leaf, Ford Focus, Chevy Volt
Canada Montréal Taxelco / Téo Taxi Taxi 130 Kia Soul EV, Nissan Leaf, Tesla Model S, Tesla Model X
Canada Montréal Car2Go Car sharing 25 Smart EV Canada Montréal Uber Ride hailing >100 Various makes & models Canada Port Elgin, ON Bruce Electric Taxi Company Taxi Canada Toronto Maven (GM) Car sharing Canada Vancouver Modo Car sharing 4 Kia Soul EV, Nissan Leaf Czech Republic Prague Re.Volt Car sharing 20 China 17 cities Cao Cao Ride hailing, rental Geely China Beijing Goal Taxi China Beijing Green Go Car sharing China Beijing GoFun Car sharing China Beijing LeShare Car sharing 200 BYD, Chery, JAC, Beijing Auto and Geely China Hangzhou Wei Gong Jiao Car sharing China Shenzhen Taxi 2200 BYD e6 China Taiyuan Taxi BYD e6 China EV Card Car sharing China Gofun Car sharing China Didi Ride hailing multiple Colombia Bogota BIOTAXIS Taxi 45 BYD e6 Costa Rica San José Taxi 200 BYD e6 Croatia Koprivnica Car sharing Denmark Aarhus letsgo Car sharing Denmark Copenhagen DriveNow Car sharing 400 BMW i3 Denmark Copenhagen letsgo Car sharing Denmark Copenhagen Move About Car sharing Denmark Copenhagen GreenMobility Car sharing 400 Renault Zoe Denmark Odense letsgo Car sharing Ecuador Loja Taxi 30 BYD e6 France Avignon Wattmobile Car sharing Renault Twizy France Bordeaux Bollore Car sharing Bollore Bluecar France Chamonix Les Ponettes Car sharing 3 France Grenoble Cité Lib Car sharing Toyota 3-wheeled France Liège Car sharing France Lille Wattmobile Car sharing Renault Twizy France Lyon Bluely (Bollore) Car sharing Bollore Bluecar France Lyon Wattmobile Car sharing Renault Twizy France Marseille Wattmobile Car sharing Renault Twizy France Paris Autolib (Bollore) Car sharing 4000 Bollore Bluecar France Paris Uber Ride hailing France Paris Wattmobile Car sharing Renault Twizy
France Paris Société de Taxi Electrique Parisien Taxi 100 Hyundai ix35, Toyota Mirai
France Paris Renault / PSA Car sharing 120 Renault Zoe, Renault Twizy France multiple cities Renault / IKEA Car sharing Renault Trafic, Kangoo, Kangoo Z.E., Zoe Georgia Tbilisi Taxi 50
Germany Berlin ViaVan (with Mercedes-Benz Vans & VIA)
Car sharing (van sharing)
Vito, V Class, electric B Class
Germany Berlin Taxi Germany Berlin DriveNow Car sharing 140 BMW i3 Germany Berlin DB Flinkster Car sharing Germany Berlin We Share Car sharing 1500 e-Golf Germany Hamburg MOIA Microtransit 200 VW Germany Munich Taxi 100 Jaguar i Pace Germany Stuttgart Car2go Car sharing 550 Smart fortwo EV Germany Move About Car sharing

Accelerating the Transition to ZEVs in Shared and Autonomous Fleets 42
Hungary Budapest Limo Carsharing Car sharing 100 Volkswagen e-UP Hong Kong Taxi BYD e6 India Nagpur Taxi India ZoomCar Car sharing/car rental India multiple cities Ola Ride hailing Tata, Mahindra Ireland Dublin Go Car Car sharing 10 BMW i3 Israel Haifa Car2Go Car sharing 40 Renault Zoe Italy Bologna ioGuido Car sharing Italy Florence Share'ngo Car sharing
Italy Florence Adduma Car sharing 40 Renault Zoe Renault Kangoo Ze
Italy Lombardy E-vai Car sharing Mitsibushi i-Miev, Citroen C-Zero, Renault Zoe, Peugeot iOn, Fiat Panda
Italy Milan E-vai Car sharing Mitsibushi i-Miev, Citroen C-Zero, Renault Zoe, Peugeot iOn, Fiat Panda
Italy Rome START Romagna Taxi Italy Torino Bollore Car sharing Bollore Bluecar Japan 100 locations e-Share Mobi Car sharing Nissan Leaf & Nissan Note e-Power Japan Toyota City Hamo Car sharing 55 Jordan Taxi Latvia Riga BalticTaxi Taxi
Lithuania Vilnius SPARK Car sharing 38 VW e-up, Nissan Leaf, Tesla Model S, Tesla Model X
Malaysia Kuala Lumpur Comos Car Sharing Car sharing 16 Renault Zoe Netherlands Amsterdam Airport Taxi 167 Tesla Model S Netherlands Amsterdam Taxi Electric, Connexxion, TCA Taxi 650 Nissan Leaf & others Netherlands Amsterdam Car2Go Car sharing 350 Smart fortwo EV Netherlands Amsterdam Hyundai Car sharing 100 Hyundai Ioniq BEV
Netherlands Amsterdam ViaVan (with Mercedes-Benz Vans & VIA)
Car sharing (van sharing) Vito, V Class, electric B Class
Netherlands Rotterdam Car sharing
Netherlands The Hague, Utrecht, Amsterdam, Rotterdam
Electric Greenwheels Car sharing
Netherlands Utrecht Prestige GreenCab Taxi New Zealand Christchurch Yoogo Share Car sharing 100 Hyundai Ioniq, BMW i3 New Zealand Wellington mevo Car sharing Audi A3 g-tron Norway Oslo Move About Car sharing Norway Oslo Green Mobility Car sharing 250 Renault Zoe Poland Gdansk e-mobility Car sharing Portugal Lisbon Uber Ride hailing Portugal Lisbon emov Car sharing 150 Citroen C-Zero Portugal Lisbon DriveNow Car sharing Romania Bucharest Uber Ride hailing 20 Renault Zoe Romania Bucharest BCR eGo Car sharing 20 BMW i3 Russia Moscow Car sharing
Singapore Singapore nuTonomy Autonomous ride hailing
Renault Zoe, Mitsubishi i-MiEV
Singapore Singapore BlueSG Car sharing 135 Bollore Bluecar Singapore S Dreams to be booked via Uber Ride hailing 1000 BYD e6 Singapore HDT Singapore Taxi Taxi 100 Slovakia Bratislava up! city Car sharing 7 Volkswagen e-Up!
Slovenia Ljubljana Avant2Go Car sharing 200 Smart, Nissan Leaf, Renault Zoe, BMW i3, VW eGolf
South Korea Gwangju J'Car Car sharing 42 Hyundai Tucson FCEV, Ioniq, Kia Soul Spain Barcelona Taxi Nissan Leaf Spain Madrid Car2go Car sharing 500 Smart fortwo EV Spain Madrid Local taxi service Taxi 110 Nissan Leaf Spain Madrid emov Car sharing 600 Citroen C-Zero Spain Madrid Zity Car sharing 500 Renault Zoe Sweden Gothenburg Move About Car sharing Sweden Helsingborg Move About Car sharing Switzerland Lausanne ElectricEasy Car sharing Switzerland Zermatt Taxi and microtransit 500 custom Taiwan Kaohsiung Car sharing Taiwan Taipei Ucar Car sharing Taiwan Taxi 1500 BYD e6 Thailand Taxi 100 likely BYD e6 UAE Dubai Shift Car Rental Car rental 10 Renault Zoe UAE Dubai Dubai Taxi Taxi Toyota Mirai UAE Selfdrive.ae Car sharing Renault Zoe
UK Northumberland, Newcastle, Durham Phoenix Taxi Taxi Nissan Leaf, Nissan ENV, Tesla Model S
UK England & Scotland ecar Car sharing Renault Zoe, Nissan Leaf, BMW i3, Renault Kangoo ZE
UK London Uber Ride hailing Nissan Leaf, BYD e6, Tesla Model S UK London London taxis Taxi TX eCity London Taxi
UK London ViaVan (with Mercedes-Benz Vans & VIA)
Car sharing (van sharing) Vito, V Class, electric B Class
UK London bluecity (Bollore) Car sharing Bollore Bluecar

Accelerating the Transition to ZEVs in Shared and Autonomous Fleets 43
UK London E-car club Car sharing UK Poole, England Co-Wheels car club Car sharing 3 Nissan Leaf USA Austin Maven (GM) Car sharing 20 Chevrolet Bolt
USA Boston nuTonomy Autonomous ridehailing
Renault Zoe
USA Boston Maven (GM)* - Maven Gig for ride hailing Ride hailing Chevy Bolt
USA California Car sharing 15 USA Chattanooga Green Commuter Car sharing 20 Nissan Leaf USA Contra Costa County EasyMile Shared autonomous 2 EasyMile EZ10 shuttles
USA Detroit Maven (GM)* - Maven Gig for ride hailing Ride hailing Chevy Bolt
USA Indianapolis BlueIndy (Bollore) Car sharing 300 Bollore Bluecar USA Los Angeles BlueLA (Bollore) Car sharing 50 Bollore Bluecar USA Los Angeles Maven (GM) Car sharing 100 Chevrolet Bolt USA Los Angeles Lyft Express Drive Rental ride hailing
USA Los Angeles Maven (GM)* - Maven Gig for ride hailing Ride hailing Chevy Bolt
USA New York City Taxi 6 Nissan Leaf
USA Phoenix Maven (GM)* - Maven Gig for ride hailing Ride hailing Chevy Bolt
USA Portland Forth Mobility and Turo Car sharing Several makes and models USA Portland Car sharing 3 Honda Fit (used) USA Sacramento Volkswagen: GIG Car Share Car sharing 260 Volkswagen
USA Sacramento Our Community, Car-Share Program Car sharing 8 Kia Soul
USA San Diego Car2go Car sharing 400 Smart fortwo EV USA San Diego Lyft Express Drive Rental ride hailing
USA San Diego Maven (GM)* - Maven Gig for ride hailing Ride hailing Chevy Bolt
USA San Francisco Maven (GM) Car sharing Chevrolet Bolt USA San Francisco Carma Car rental 400 Ford Focus Electric, Nissan Leaf, and Scion iQ EV USA San Francisco City CarShare Car sharing USA San Francisco Lyft Express Drive Rental ride hailing
USA San Francisco Maven (GM)* - Maven Gig for ride hailing Ride hailing Chevy Bolt
USA Santa Monica WaiveCar Car sharing Chevrolet Spark, Hyundai IONIQ
USA Schenectady, New York Electric City Taxi Taxi
USA Southern California StratosFuel Car sharing 15 Fuel cell (unspecified) USA Utah Live Electric Ride Hailing Ride hailing USA Washington DC Maven Gig Ride hailing Chevy Bolt USA Washington DC Sprynt Ride hailing 4 USA Enterprise Car sharing USA Hertz Green Travel Collection Car rental USA Multiple cities Lyft Ride hailing 3007 Various makes & models Multiple countries Multiple cities ZipCar Car sharing
Multiple countries Multiple cities Uber Ride hailing Various makes & models
Multiple countries Multiple cities Didi Ride hailing >260,000 Various makes & models
Multiple countries
Brussels, Paris, and London ZEFER Taxi Toyota Mirai

Accelerating the Transition to ZEVs in Shared and Autonomous Fleets 44
Appendix C Impacts of ride hailing
Extract from UC Davis Institute for Transportation Studies by Caroline Rodier A White Paper from the National Center for Sustainable Transportation titled The Effects of Ride Hailing Services on Travel and Associated Greenhouse Gas Emissions, April 2019 Auto Ownership: 9% to 10% of respondents in two surveys stated that they gave up a vehicle after joining ridesharing. One of these studies includes a representative sample of the population in seven major U.S. cities and another targeted ride hailing users in downtown San Francisco. These studies represent initial evidence for some reduction in auto ownership. However, the responses to specific questions in these surveys raise questions about other factors that may contribute to reduced vehicle ownership. More research is needed to verify the cause and effect relationship between reduced auto ownership and use of ride hailing. Trip Generation: Available research currently reports a widely varying range of new vehicle trips resulting from the availability of ride hailing: 8% to 22%. These results are from surveys of a representative sample of U.S. cities (22%), a representative sample of Millennial and Generation Xers in California (8%), and ride hailing users in San Francisco (8%) and Denver (12%). Available research indicates that reduced physical and legal limits to driving, avoiding drinking and driving, and lack of auto ownership contribute to new vehicle trips. However, more research is needed to understand the wider range of factors that contribute to variation in induced vehicle trip generation from ride hailing and their relative importance. Mode Choice: One of the more controversial issues surrounding ride hailing is whether these services support transit use by increasing first and last mile access to transit or undermine transit by a providing a faster and cheaper travel alternative. The body of research to date suggest that the substitution effect is stronger than the complementary effect. In response to the question, “What mode(s) would you have used if ride hailing were not available?” in four surveys, 16% to 33% of respondents indicated that they would have taken transit if ride hailing was not available. These results are from surveys of a representative sample of U.S. cities (17%), a representative sample of Millennial and Generation Xers in California (16%), and ride hailing users in San Francisco (33%) and Denver (22%). These studies also show some use of ride hailing for access and egress purposes (3%, 9%, 5%, and 6%, respectively), but this is more than offset by reductions in transit travel. These studies show reductions in carpool, walk, and bike travel, and one study suggests that ride hailing may also reduce car sharing. Research is needed to more carefully measure the transit ridership effects of ride hailing and the potential to increase the use of ride hailing as a first and last mile transit access mode. Network Vehicle Travel without Passengers: Available research suggest that empty vehicle travel can range from about 10% to 20% in high density downtown urban areas where the supply of ride hailing vehicles is high and about 45% to 60% in lower density suburban areas where the supply of ride hailing vehicles is lower. These results are based on three studies that use ride hailing driver activity data and two modeling studies. Current studies are limited due to lack of access to ride hailing activity data. More studies that use ride hailing driver activity data are needed, particularly in suburban areas. Source: https://ncst.ucdavis.edu/wp-content/uploads/2016/07/NCST-TO-028-Rodier_Shared-Use-Mobility-White-Paper_APRIL-2018.pdf

Accelerating the Transition to ZEVs in Shared and Autonomous Fleets 45
Appendix D Example of BEV car sharing education tools
Source: Communauto, Montréal, https://www.communauto.com/en/faq.html#faqG9-Q1

Accelerating the Transition to ZEVs in Shared and Autonomous Fleets 46
Appendix E Uber ZEV-related communications
An electronic communication is sent to riders when they take their first trip in a ZEV. A rider will receive an email notification after the first trip with a ZEV. The rider will receive an in-app notification each time he/she is paired with a ZEV (part of UberÉLECTRIQUE / UberELECTRIC program)78:
Source: Uber
78 https://www.uber.com/en-CA/newsroom/electrifying-our-network/

Accelerating the Transition to ZEVs in Shared and Autonomous Fleets 47
Leaflet available in vehicles of Uber partner-drivers who are part of the UberÉlectrique79 program in Montréal:
Source: Uber
79 https://www.uber.com/en-CA/newsroom/electrifying-our-network/

Accelerating the Transition to ZEVs in Shared and Autonomous Fleets 48
Appendix F BEV in ride hailing payback, Montréal and London
Table 7. BEV in ride hailing payback, Montréal and London (currency: Canadian dollars)
BEV ICE ∆ BEV ICE ∆
Average purchase price AFTER purchase incentives 37,000$ 18,400$ 18,600$ 38,203$ 16,281$ 14,390$
Annual expenses (all other expenses assumed to be similar) 11,076$ 15,027$ 3,951$ 4,165$ 13,208$ 9,043$ Average annual after-tax annual revenues per full-time driver 39,150$ 42,608$ 3,458$ 39,213$ 43,119$ 3,906$ Annual impact (lower expenses and lower income) 493$ 5,137$
Payback (years) 37.7 2.8
BEV ICE ∆ BEV ICE ∆
Average purchase price AFTER purchase incentives 37,000$ 18,400$ 18,600$ 38,203$ 23,812$ 14,390$
Annual expenses (all other expenses assumed to be similar) 11,076$ 15,027$ 3,951$ 4,165$ 13,208$ 9,043$ Average annual after-tax annual revenues per full-time driver 42,608$ 42,608$ -$ 25,170$ 25,170$ -$ Annual impact (lower expenses and lower income) 3,951$ 9,043$
Payback (years) 4.7 1.6
Positive for the BEV ride hailing driverNegative for the BEV ride hailing driver
CURRENT CONDITIONSMontréal, QC, Canada London, U.K.
EQUAL INCOME BEV & ICEMontréal, QC, Canada London, U.K.