Embed Size (px)
Citation preview
INTELLIGENCE 23, 205-228 (1996)
Academic Achievement in Blacks and Whites: Are the Developmental
Processes Similar?
DAVID C. ROWE
HOBART H. CLEVELAND
University of Arizona
Genetic and environmental influences on academic achievement were investigated in four
groups of siblings: (1) White full siblings, (2) White half-siblings, (3) Black full siblings,
and (4) Black half-siblings. Our expectation was that the variances and covariances
among three achievement tests would have the same structure across the four groups. This
expectation was confirmed by a quantitative genetic model that imposed equal factor
loadings across groups. This best fitting mode1 had two factors: a Genetic factor represent-
ing genetic variation and a Shared Environment factor representing environmental differ-
ences among families. Reading recognition, reading comprehension, and mathematics
tests all loaded on the Genetic factor, but primarily mathematics loaded on the Shared
Environment factor. The quantitative genetic model was next fit to the achievement test
means. Its successful fit suggested that the genetic and environmental influences involved
in producing individual variation were the same as those producing the group-mean differ-
ences. In this sample, genes accounted for 66% to 74% of the observed group difference
in verbal achievement and 36% of the difference in mathematics achievement. Shared
environment accounted for the remainder, 34% to 26% of the difference in verbal achieve-
ment and 64% of that in mathematics achievement.
In a neighborhood school, two children learn to read simple books and handle basic arithmetic skills. One child masters reading and math easily and is ahead of grade level, whereas another child struggles and falls behind. If both children were White, or if they were both African American, then most social scientists would make similar attributions about the causality of their academic achieve- ment. Social scientists’ list of identified etiologies would probably include family environmental stimulation, genes, school quality, and combinations of them. In a particular instance, the better performing child may have had parents with greater intellectual capacities than the parents of the child performing more poorly. Genes inherited from a high-IQ parent should advantage one child over the other academically. Now, suppose that one child was racially White (i.e., of European origin), whereas the other was racially Black (of African origin). In this latter case, minority-specific explanations of academic achievement may be proposed,
Correspondence and requests for reprints should be sent to David C. Rowe, School of Family and
Consumer Resources, University of Arizona, Tucson, AZ 85721 <[email protected]>.
205

206 ROWE AND CLEVELAND
whereby specific factors are assumed to influence the academic learning of mi- nority children, but not majority children (Helms, 1992).
A great variety of minority-specific explanations for academic achievement have been posed. Many were mentioned in an issue of Child Development (Spe- cial Issue on Minority Children, 1990) devoted to minority children. For ex- ample, theories of minority development selected such explanations as (a) a culturally rooted value on power assertion among American Blacks deriving from traditional African values (McLoyd, 1990), (b) a minority emphasis on collectivism rather than on individualism (Harrison, Wilson, Pine, Chan, & Buriel, 1990; Spencer, 1990), and (c) a traditional Asian value such as respect for authority and group affiliation (Slaughter-Defoe, Nakagawa, Takanishi, & John- son, 1990). Without adding further claims of cultural differences, it can be ac- cepted that minority-specific explanations of achievement have been widely influential in the social sciences.
A tendency to postulate minority-specific explanations of achievement be- comes even stronger when the topic shifts from differences in achievement among children to racial or ethnic group means. In a discussion of adoption studies of intelligence, Turkheimer (1991) called the “two realms” hypothesis that individual differences are shaped partly by genetic influences, whereas group-mean differences are shaped entirely by environmental influences, the “re- ceived view of nature and nurture” (p. 393).
This received view is often justified by hypothetical analogies to human de- velopment. In the typical agricultural example, two plots of plants growing in a greenhouse are contrasted, one grown in fertilized soil and the other in unfer- tilized soil. Within each experimental plot, the plants vary in their genetic com- positions. Thus, within the plots, variation in crop yield would be entirely genetic in origin. Between the plots, however, the difference in crop yields would be entirely environmental and attributable to the differential availability of the nitrogen in fertilizer.
A problem in applying this analogy is that children are not literally “devel- oped” in environments to which all group members are equally exposed. Psycho- logical (and biological) developmental processes apply to each child separately. The micro-environments of two families in a poor neighborhood may be ex- tremely unlike, and one of them could well match the micro-environment of a family in a middle-class neighborhood.
The same logic holds for any possible effect of social rejection on psychologi- cal traits. For instance, the extent to which minority members have been vic- timized by social discrimination also varies within minority populations (one correlate, the degree of Europeanness vs Africanness of physical appearance, has been long discussed within minority communities). Furthermore, some minority families may endorse middle-class values such as academic competition, where- as others may endorse alternative values such as collectivism. Turkheimer (1991) contrasted the statistical operation of partitioning trait variance into that between
and within groups with the mechanisms of development, which should affect

ACADEMIC ACHIEVEMENT IN BLACKS AND WHITES 207
each child separately. In Turkheimer’s eloquent words, “There are two realms of variance, between and within groups; there is only one realm of development” (p. 394). Given separate (and group-unrelated) developmental processes for each child, group means are nothing more than averages of the individual differences. They are also the average of the etiologies that contribute to the individual differ- ences. For example, a combination of genetics and diets may contribute to weight differences among individuals. If children in Group A weigh more than those in Group B, it could be because these same dietary and genetic factors were more prevalent in Group A. That is, no influence is involved in producing fhe
group diferences other than those involved in producing the variation among children.
Genetic variation, of course, is one possible source of both trait variation among children in achievement and ethnic or racial group means. Differences in group means would arise if the distribution of genes differed among the ethnic groups, racial groups, or among the otherwise subdivided populations sampled. At the same time variation in gene combinations within populations should also contribute to individual variation in achievement.
This issue of racial genetic differences is sometimes debated on grounds of the historical (and evolutionary) distinct lineages of racial groups. Historically, the Black population in the United states originated in Africa, whereas most of the White population came from Europe. Although about 25% admixture of genes of Caucasian origin now exist in Blacks in the United States, and some lesser de- gree of Negro origin genes now exist in U.S. Whites, the two populations are still somewhat distinct genetically (Chakraborty, Kamboh, Nwankwo, & Ferrell, 1992).
The degree of racial or ethnic group genetic distance, however, must be evalu- ated relative to a particular trait, The ABO blood groups, used in medicine to match blood donors, show a complex worldwide distribution that fails to match the geographic distribution of commonly recognized racial groups (Futuyma, 1986). On the other hand, some single-gene medical disorders show striking differences in frequency associated with racial or ethnic group membership. For instance, sickle cell anemia is a genetic disorder prevalent in Blacks (because carriers of the sickle cell gene are resistant to malaria), whereas cystic fibrosis is prevalent in Whites (possibly also because of pathogen-driven selection pres- sures). Multiple-gene medical disorders also vary in their group distributions. For instance, the risk of diabetes in Pima Indians of the southwest is higher than in Whites. To the degree that Pima Indian individuals have had genetic admixture with Caucasians, their risk of diabetes is lowered (Lander & Schork, 1994).
The identities of genes affecting variation in academic achievement are at present unknown (although their identities may be discovered in the future using the new techniques of molecular genetics; Plomin et al., 1994). However, if one postulates “one realm” of developmental processes, then those genes contribut- ing to achievement differences among children should also contribute to racial group averages on achievement tests. This scenario can be avoided only if the

208 ROWE AND CLEVELAND
genes that affect achievement strongly have nearly equal frequency distributions in White as in Black populations in the United States.
In previous publications, we have investigated the similarity of developmental processes across ethnic and racial groups (Rowe, Vazsonyi, & Flannery, 1994, 1995). Developmental processes were estimated from the strength of associations among psychological variables. First, covariance matrices were computed on the same variables for different racial and ethnic groups. Each matrix contained the variances and covariances of about 10 variables, both possible influence vari- ables (e.g., intellectual stimulation in the family) and developmental outcomes in children (e.g., their academic achievement). Second, the matrices were tested for equality using a general statistical test from structural equation models. They proved to be statistically equal across different ethnic and racial groups; that is, when matrices from any two ethnic or racial groups were compared, they had within them associations of about identical magnitude (Rowe et al., 1994). This conclusion held “for the examination of six data sources, containing a total of 3,392 Blacks, 1,766 Hispanics, and 8,582 Whites, and in one data source, 906 Asians” (p. 408).
Work cited by Jensen (1985) also suggests developmental similarities in Blacks and Whites. In both racial groups, the factor structure of IQ tests was generally similar. Moreover, IQ subtests on which heritabilities were greater tended to load more strongly the first principal component (g) extracted from a group of subtests. These most g-loaded subtests had the largest Black-White mean differences. Jensen argued that racial group differences in intelligence were greatest in g, but weaker in other components of cognitive abilities. Therefore, a subtest’s g loading should predict its relative magnitude of racial group dif- ference. Although Jensen’s statistical hypothesis was generally confirmed, de- bate over its implications was intense (see the commentaries following Jensen’s article).
ANALYTIC STRATEGY
In this study, we now consider both individual differences and group-mean differ- ences within a single statistical model. Recent advances in structural equation modeling are used as the basis for our analysis. In a method called “structural equation modeling with mean structures” (Joreskog & Sorbom, 1989), a hypoth- esis can be tested about whether the determinants of group means are the same as those of individual differences. The approach is to (1) first perform a standard quantitative genetic analysis of covariance matrices, and (2) add the group means and determine whether the covariance structure is consistent with the mean dif-
ferences between groups (Dolan, Molenaar, & Boomsma, 1992). I In this proce-
‘Our quantitative genetic model requires the assumption that species constant characteristics be
equal in African Americans and Whites.
ACADEMIC ACHIEVEMENT IN BLACKS AND WHITES 209
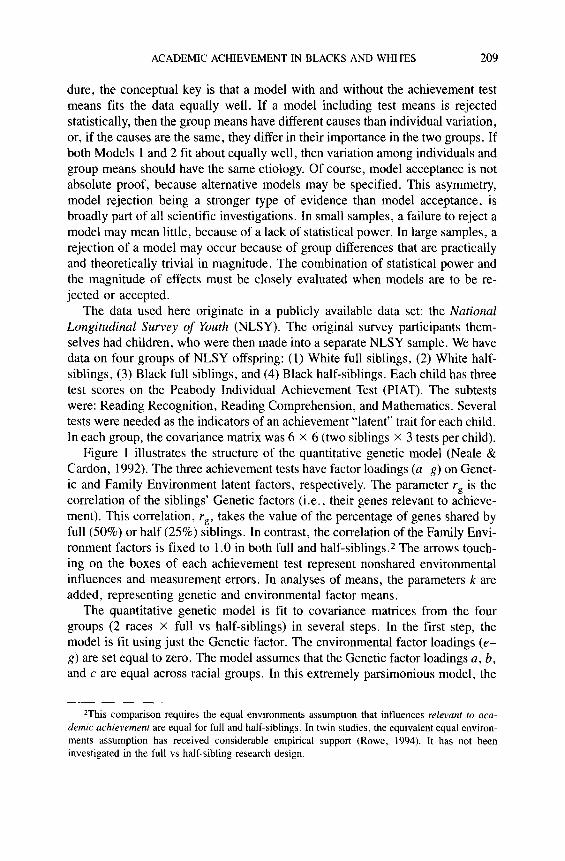
dure, the conceptual key is that a model with and without the achievement test means fits the data equally well. If a model including test means is rejected statistically, then the group means have different causes than individual variation, or, if the causes are the same, they differ in their importance in the two groups. If both Models 1 and 2 fit about equally well, then variation among individuals and group means should have the same etiology. Of course, model acceptance is not absolute proof, because alternative models may be specified. This asymmetry, model rejection being a stronger type of evidence than model acceptance, is broadly part of all scientific investigations. In small samples, a failure to reject a model may mean little, because of a lack of statistical power. In large samples, a rejection of a model may occur because of group differences that are practically and theoretically trivial in magnitude. The combination of statistical power and the magnitude of effects must be closely evaluated when models are to be re-
jected or accepted. The data used here originate in a publicly available data set: the National
Longitudinal Survey of Youth (NLSY). The original survey participants them- selves had children, who were then made into a separate NLSY sample. We have data on four groups of NLSY offspring: (1) White full siblings, (2) White half- siblings, (3) Black full siblings, and (4) Black half-siblings. Each child has three test scores on the Peabody Individual Achievement Test (PIAT). The subtests were: Reading Recognition, Reading Comprehension, and Mathematics. Several tests were needed as the indicators of an achievement “latent” trait for each child. In each group, the covariance matrix was 6 X 6 (two siblings X 3 tests per child).
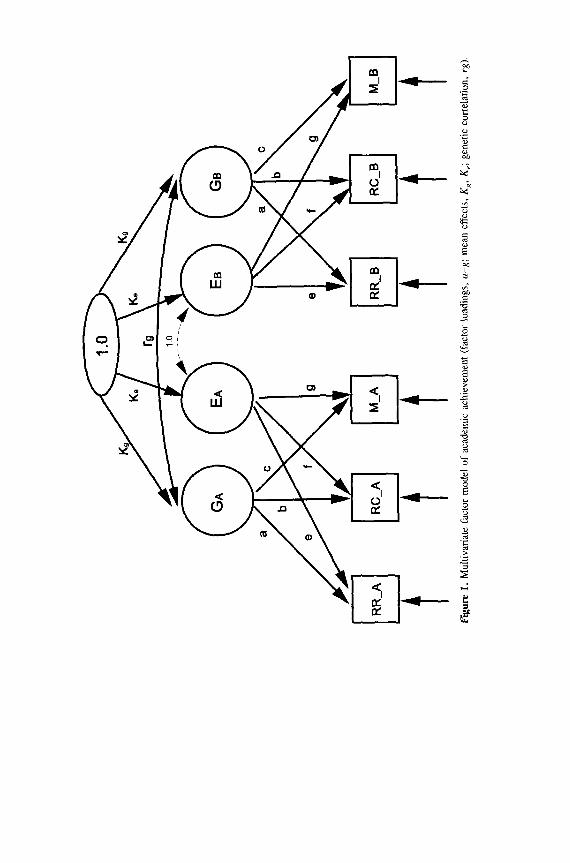
Figure 1 illustrates the structure of the quantitative genetic model (Neale & Cardon, 1992). The three achievement tests have factor loadings (u-g) on Genet- ic and Family Environment latent factors, respectively. The parameter rg is the correlation of the siblings’ Genetic factors (i.e., their genes relevant to achieve- ment). This correlation, rg, takes the value of the percentage of genes shared by full (50%) or half (25%) siblings. In contrast, the correlation of the Family Envi- ronment factors is fixed to 1 .O in both full and half-siblings.* The arrows touch- ing on the boxes of each achievement test represent nonshared environmental influences and measurement errors. In analyses of means, the parameters k are added, representing genetic and environmental factor means.
The quantitative genetic model is fit to covariance matrices from the four groups (2 races X full vs half-siblings) in several steps. In the first step, the model is fit using just the Genetic factor. The environmental factor loadings (e- g) are set equal to zero. The model assumes that the Genetic factor loadings a, b, and c are equal across racial groups. In this extremely parsimonious model, the
ZThis comparison requires the equal environments assumption that influences relevant to aca- demic achievemenf are equal for full and half-siblings. In twin studies, the equivalent equal environ- ments assumption has received considerable empirical support (Rowe, 1994). It has not been
investigated in the full vs half-sibling research design.
rs
\ \
\ 1 .o
--
-&
Y
n
Figu
re
1.
Mul
tivar
iate
fa
ctor
m
odel
of
ac
adem
ic
achi
evem
ent
(fac
tor
load
ings
, a-
~;
mea
n ef
fect
s,
K,,
K,;
gene
tic
corr
elat
ion,
rg
).

ACADEMIC ACHIEVEMENT IN BLACKS AND WHITES 211
equality constraints require similar developmental processes on achievement variation in all racial groups.
In the second step, the model is refit adding the Shared Environment factor. The Chi-square is automatically lower because the model now fits two factors, instead of one. The appropriate statistical test here is the change in Chi-squares. The Chi-squares of the one-factor model are subtracted from that of the two- factor model. This Chi-square is tested for statistical significance against the difference in degrees freedom (df one-factor model - df two-factor model). If this Chi-square test is significant, then better fit is gained by adding the Family Environment factor to the quantitative genetic model. If not, genetic influences, plus nonfamilial environmental influences, would be sufficient to explain the variation in academic achievement.
In the third step, the best fitting model from above will be fitted to both the means and covariance matrices. As noted earlier, the achievement trait means are modeled via the path coefficients k. One racial group is used to set scale. In this group, the value of k is specified as zero. In the other racial group, the value of k would represent the mean difference of that group relative to the group in which k was zero. Thus, the model does not consider the Homo sapiens species-average level of achievement in an absolute sense. Mean differences in achievement among the groups are what are actually compared. Consider further that in this analysis the values of the factor loadings u-g must be fixed to those from the former analysis of covariance matrices. This restriction forces the means on the observed tests (i . e . , reading recognition, reading comprehension, and mathemat- ics) to be proportional to k times their respective factor loading plus an estimated intercept term for each test. That is, a test loading more strongly on the achieve- ment trait should produce a greater mean difference between groups than one with a weak loading.
Therefore, our methods address two theoretical questions about achievement. First, they ask whether assuming developmental processes to be identical across Black and White children is consistent with the data. More precisely, they deter- mine whether statistical associations (such as the covariance of the reading rec- ognition and mathematics tests or those of sibling A’s and B’s reading tests) were identical across races and can be accounted for by the same underlying genetic and family-environmental influences. Second, they evaluate whether racial mean differences are attributable to the same etiology as are the individual differ- ences.
METHOD
The National Longitudinal Survey of Youth-Children Data The NLSY survey began in 1979 as a household probability sample of 11,406 civilian respondents 14 to 21 years old in the United States, and respondents have
been resurveyed annually since. Because all available youth in the 2,400 sampled
212 ROWE AND CLEVELAND
households were surveyed, many siblings, half-siblings, and cousins are repre- sented within the sample (e.g., 5,776 of the original respondents lived in a household with one or more siblings). In 1986, 1988, 1990, and 1992, all chil- dren ever born to NLSY females were interviewed. In 1988, when the second child assessment was completed, a total of 6,543 children had been born. As of the 1990 interview, 7,250 children had been born. In each round, an extensive battery of assessments was completed. This design structure naturally led to a large number of siblings and half-siblings and a few twins of unknown zygocity. Furthermore, children of sisters from the original sample were cousins, so cous- ins were identifiable in the data set as well.
We will use the children of the original NLSY respondents, a data source we will call the NLSY-children data set (as distinguished from the original NLSY- youth data set, which contains the mothers of these children). As our measure of academic achievement, we use the average of the 1988 and 1990 tests scores on reading recognition, reading comprehension, and mathematics, respectively. Av- eraging two test scores (I 988 and 1990) increases the reliability of each child’s achievement score on a particular test. The choice of the two middle years was governed by the following: (1) the children were older in 1988 than in 1986, allowing for better estimates of childhood achievement, and (2) in 1990 and 1992 funds were short so some poor White families were not surveyed. These fami- lies, however, were surveyed in 1988.
The NLSY-children data set represents the children born to young mothers who were part of a 1979 nationally representative probability sample. Clearly, there are several features of this data set that prevent treating these children as nationally representative. First, there is some nonresponse and attrition within both the NLSY-youth data set and the NLSY-children data set, although re- sponse rates are remarkably high (typically around 95%). Second, some errors may be introduced by our algorithm for classifying full and half-siblings. Third, these children were select in that they were born to young mothers. The younger mothers in the NLSY tend to have lower IQs than the mothers who have not yet had children, putting a downward bias on their children’s IQs. Only after the NLSY-youth females have completed childbearing will the sample of NLSY- children be a complete sample of children born to a representative sample of mothers. Fourth, it is the mothers and not the children that were drawn through a probability sampling mechanism. Despite these limitations, this data set is an extraordinary one for social science research in terms of the economic and social diversity of the families sampled and its low rates of subject attrition (Chase- Lansdale, Mott, Brooks-Gunn, & Phillips, 1991).
No explicit information about genetic relatedness was collected, which is a critical requirement for behavior genetic analyses. However, certain variables in the data files were informative about genetic relatedness, and we used them to classify a large percentage of NLSY-children kinship pairs. A detailed descrip-

ACADEMIC ACHIEVEMENT IN BLACKS AND WHITES 213
tion of the linking algorithm appears in an earlier publication (Rodgers, Rowe, & Li, 1994; Rodgers, Rowe, & May, 1994).
In this study, we used only the full sibling definite and half-sibling pairs. Mothers responded to questions in the 1984 and 1988 NLSY-youth surveys about whether the father of each of her children lived with her. If the fathers of both members of a classified sibling pair lived in the home with the mother for at least 1 of these years, and this response was identical across all 5 years, we assumed that person was the common father and classified to two as definitely full siblings, or FD status (which clearly assumes that a mother is not living simultaneously with two different fathers of her children). If the father of one member of the sibling pair lived in the home, and the other sibling’s father did not at some time during the 5 years, the pair was classified as definitely half- siblings, or HD status.
The number of sibling pairs varied by the cross-classification of ethnicity and sibling type. Half-siblings were most discrepant in number among groups: 106 half-sibling pairs were Black, 53 pairs were White, and 14 pairs were Hispanic. Because of the small number of Hispanic half-sibling pairs, we decided to fit models only to siblings who were Black or White. The Hispanic half-sibling correlations were -.28 for reading recognition, -.48 for reading comprehen- sion, and .Ol for mathematics. These unusual values suggest that the sample size of 14 pairs was simply too small for reliable correlations.
More full sibling pairs were present than half-sibling ones. There were 161 pairs of Black full siblings and 314 pairs of White full siblings. As some siblings have missing data on PIAT tests, sample sizes for particular computations were slightly smaller. The Black and White children’s average age was 9 years in 1988 (SD = 2.6 years). The mean age difference between White and Black siblings was 2.6 and 2.7 years, respectively. Sibling pairs were nearly evenly divided between same and mixed-sex pairs in both racial groups. Mothers in both racial groups averaged less than a high school education (in 1989, 11.6 years for Black mothers, 11.4 years for White mothers).
Measures Academic achievement was assessed using three PIAT subtests: Mathematics, Reading Comprehension, and Reading Recognition (Center for Human Resource Research, 1991; Dunn & Markwardt, 1970). The math and reading comprehen- sion subtests have a multiple-choice format. The math test involves skills ranging from recognizing numerals to measuring understanding of concepts in geometry and trigonometry. For reading comprehension, the child silently reads a printed sentence and then selects one of four pictures that portrays the best meaning of the sentence (66 items). The reading recognition subtest employs a combination of multiple-choice items and the identification of letters, words, and names that the child reads aloud to the examiner. Test-retest reliabilities for the subtests

214 ROWE AND CLEVELAND
range from .64 for reading comprehension to .88 for reading recognition (Sattler, 1992).
The NLSY created scores standardized for age and gender for each subtest. As these scores were highly intercorrelated across rounds of data collection (Rowe et al., 1993, the nonmissing 1988 and 1990 scores on each test were averaged to form a more reliable composite score. In a conversation with NLSY project staff, we discovered that a table of 1969 PIAT norms had been used in the PIAT norming in the NLSY-children data set. These outdated norms appear to have made the PIAT too easy for children in the 1980s and 1990s. Hence, the absolute means given for the different tests probably overstate academic compe- tence relative to current community standards. As the same norms were used for Blacks and Whites, however, they should not affect the relative standing of the two groups.
Perhaps because of the use of outdated norms, the PIAT tests correlated with age in the combined sample of Black and White children. Younger children did slightly better on the PIAT subtests than older children. Specifically, the age- regression equations accounted for 2% to 4% of the variance in achievement. Using these regression equations, we adjusted each subtest for its association with age. The analyses reported next use these age-adjusted PIAT scores.
RESULTS
Our analyses focus on the covariance matrices and means given in Table 1. The covariance matrices were computed using a double-entry format (Haggard, 1958) in which the number of observations was twice the number of sibling pairs (i.e., the number of individuals). The first N/2 cases of a variable consist of Sibling A; the second NJ2 cases consist of Sibling B. Entered in this way, a sibling correlation closely approximates an analysis of variance intraclass-cor- relation coefficient (such double entry is routine in behavior genetic studies). In this format, the correlation of any two tests, for instance, reading comprehension and mathematics, is that for all individuals in the particular group. However, for the LISREL analyses, described later, the Ns were returned to the mean number of sibling pairs across variables. Furthermore, because of the dependencies in a double-entry matrix, the degrees of freedom associated with each LISREL model were reduced by nine times the number of matrices fit (for each matrix, 21 data observations in an unconstrained 6 X 6 covariance matrix minus 12 data observa- tions in a double-entry covariance matrix yields a 9 @reduction).
Several features of the data can be gleaned from an inspection of Table 1. First, the three achievement tests were highly intercorrelated, rs about .60-.80, with the two verbal tests intercorrelating most highly. This pattern shows that the three tests belong on one factor (there are no degrees of freedom with which to determine fit to the factor, however). Sibling correlations in the Whites clearly conformed to the pattern expected under genetic theory; the full siblings are more

ACADEMIC ACHIEVEMENT IN BLACKS AND WHITES 215
TABLE 1 Covariance Matrices for Peabody Individual Achievement Tests
White Full Siblings N = 299 pairs
RRA RCA MA RRB RC-B MB
Reading rec_A 175 .80 .63 .40 .37 .36
Reading comp_A 141 177 .62 .37 .36 .32 MathA 100 99 142 .36 .32 .44 Reading rec_B 70 65 57 175 .80 .63
Reading comp_B 65 63 51 141 177 .62 Maths 57 51 63 100 99 142 M 102 100 102 102 100 102
White Half-Siblings N = 50 pairs
RRA RCA MA RRB RCB IKB
Reading rec_A 18.5 .83 .65 .16 .I6 .I9 Reading comp_A 136 147 .62 .I6 .09 .28 MathA 114 97 168 .19 .28 .26 Reading rec_B 31 26 34 185 .83 .65
Reading comp_B 26 14 44 136 147 .62 Maths 34 44 44 114 97 168 M 102 100 100 102 loo 100
Black Full Siblings N = 158 pairs
RRA RCA bLA RRB RCB h4B
Reading rec_A 175 .84 .67 .38 .37 .21
Reading comp_A 149 179 .63 .37 .42 .30 MathA 97 92 120 .27 .30 .32 Reading rec_B 66 66 40 175 .84 .67 Reading comp_B 66 75 44 149 179 .63
MathB 40 44 39 97 92 120 M 98 94 95 98 94 95
Black Half-Siblings N = 103 pairs
RRA RC_A MA RRB RCB I&B
Reading rec_A 185 .85 .64 .33 .28 .27 Reading comp_A 153 174 .66 .28 .22 .31 MathA 103 103 138 .27 .31 .42 Reading w-B 61 50 44 185 .85 .64 Reading comp_B 50 38 47 153 174 .66 MathB 44 47 58 103 103 138 M 97 94 96 97 94 96
Note. Correlations above diagonal; covariances below the diagonal; variances on diagonal; A and B designate each sibling. Reported sample sizes are the average number of sibling pairs.
216 ROWE AND CLEVELAND
alike in their test scores than the half-siblings. In the Blacks, the mathematics test failed to conform to genetic expectations, as its correlation was greater in half- siblings (.42) than full siblings (.32). The other correlations conformed to the genetic expectation (reading recognition, .38 full, .33 half; reading comprehen- sion, .42 full, .22 half). The average White correlations for siblings were .40 and .I7 for full and half-siblings, respectively. The average Black correlations were .37 and .32, respectively. Although the larger Black than White half-sibling cor- relations may suggest different etiologies in the two groups, the modest sample sizes give them substantial standard errors. The best way to use all the informa- tion in the covariance matrices for each group is by fitting quantitative genetic models to them.
The Blacks had significantly lower mean scores than the Whites. In absolute magnitudes, these racial differences were smaller than Black-White IQ differ- ences reported for population-representative samples. A typical Black-White difference here was about one third to one half a standard deviation, whereas the population IQ differential is typically reported as about a full standard deviation. The smaller racial difference, however, is consistent with how the pairs were sampled. They were children from disproportionately poorer families because they were the children of less educated, early childbearing mothers.
LISREL Models of Individual Variation in Developmental Processes The LISREL code for the computer runs is given in Appendix A for a genetic model that fits both means and covariances. The covariance model is fit using the same LISREL code, except that the vectors 7-y and (Y would be dropped from the computer program. In addition, the values of the factor loadings in X-y would be set as free, but equated across pair members and groups.
The quantitative genetic factor model was first fit using only the Genetic factor. This genetic factor model was rejected, x2 = 81.2, df= 33, p = < .OOl. The factor model was refit a second time using both the Genetic and Shared Environment factors. This model yielded an acceptable fit, x2 = 39.4, df = 30, p = .12. The model’s loss of three degrees of freedom resulted from the estimation of the environmental factor loadings (e-g in Figure 1). The change in Chi-square between the one- and two-factor models was statistically significant, 41.8, df = 3, p < .OOl. Hence, the Shared Environment factor improved the fit of the quantitative genetic model and should be retained.3
‘One reviewer noted the similarity of the (averaged) full and half-sibling correlations in the Blacks. This reviewer suggested that a model assuming no heritability (i.e., h2 = 0) might fit the
Black sibling groups as well as one assuming some heritability Ch* > 0).
Two models were fit assuming no heritability. The first had a Shared Environment factor and
residual sources of variation. It was soundly rejected, x 2 = 654.32, df = 15, p < .OOl. A second
purely environmental model assumed a Shared Environment factor, a Nonshared Environment factor (i.e., a factor inducing correlations within individuals but not across sibling pairs), and residual
sources of variation. It was rejected, x2 = 32.41, df = 12, p = .OOl.

ACADEMIC ACHIEVEMENT IN BLACKS AND WHITES 217
Thus, the two-factor model was then chosen to be refit to the achievement means. One approach would be to refit the model estimating both the factor loadings in A-y and the factor means. In this LISREL analysis, however, the values in h-y were fixed to those obtained from the solution on covariance ma- trices (see Appendix A for the LISREL code). This is an especially strict test of common causality for means and covariances (Dolan et al., 1992). However, because these fixed parameters were estimated from the same data as the means, six degrees of freedom must be removed from the LISREL analysis that fits the means.4 The degrees of freedom must be reduced by another 12, because in each group three means are dependent in a double-entry matrix (12 = 3 means per group X 4 groups). Finally, 36 degrees of freedom must be removed because of the dependencies of covariances in double-entry matrices (4 matrices X 9 df per matrix). The program ran with 91 df, but the adjusted degrees of freedom was 37. The fit of this means model was accepted, x2 = 46.6, df = 37, p = .13. There was also no loss of fit compared with the model’s solution without means, x2 change = 46.6 - 39.4 = 7.2, df = 7, p = .42. Although no prediction was made about equal error variances across racial groups, the means model was run constraining the error variances to be equal across groups. The model was slight- ly rejected by a Chi-square test, x 2 = 65.01, df = 46, p = .03. Nonetheless, using LISREL indices of model fit that were independent of sample size, the means model with equal error variances gave an excellent fit, goodness-of-fit index = 97, normed goodness-of-fit index = .97. Thus, the genetic and environ- mental sources of individual differences and of differences between racial groups were shown to be consistent with the model that specifies that there are no differ- ences in causal influences on means and variation.
Table 2 presents the parameter estimates from the two-factor models fitted with and without means. The unstandardized loadings were estimated in the fit to covariance matrices and then fixed in the estimation of group-mean structure. Instead of giving these same values twice, Table 2 gives the more easily inter- preted standardized loadings in the “model fitted without means” column and the corresponding unstandardized (fixed) loadings in the “model fitted with means” column. According to the standardized loadings, the two verbal tests played a larger role than the mathematics one in defining the Genetic factor (loadings of
Two models assumed heritability (i.e., h* > 0). The first had a Genetic factor and residual sources
of variation; it was rejected, x2 = 39.64, df = 15, p < ,001. The second model had a Genetic factor,
a Shared Environment factor, and residual sources of variation. This quantitative genetic model fit well and was the best fitting model of those tried, y,a = 16.29, df = 12, p = .18. This last model is
also the best fitting model when the Whites were fitted separately. Thus, the findings from separate
analyses of the Blacks and Whites support those obtained from model-fitting both groups simul-
taneously.
4A reviewer of this article suggested that with large-sized samples, estimating means from the
same data used to estimate covariances would represent only a very slight constraint.

218 ROWE AND CLEVELAND
TABLE 2 Solutions From Multivariate Genetic Factor Models
of Academic Achievement
Model Without M, With M, (fixed)
Standardized Loadings Unstandardized Loadings
Measurement factor loadings Genetic factor
Read ret a .93* 12.44
Read camp b .87* 11.50
Math c .63* 7.41 Shared environmental factor
Read ret e .I4 1.83
Read camp f .I9 2.48
Math 8 .47’ 5.56
Mean effects (Y Vector
Whites
k‘? .oo
k, - .oo
Blacks
% -.30
k, -.70
Note. Standardized loadings are within-group completely standardized load- ings averaged over full White siblings, full Black siblings, half White siblings, half Black siblings.
“p < .05.
.93-27 vs .63). However, all test loadings on this Genetic factor were substan- tial (i.e., > .30). In contrast, the Shared Environment factor was most strongly defined by the mathematics test (loading = .47), and only weakly by the two verbal tests.
In fitting group means, the Whites were used as the reference group for esti- mating the factor mean parameters, that is, k = 0 (see Figure 1). In the Black group, the k values represented the mean difference between racial groups. Rela- tive to Whites, Blacks had lower means on the Genetic and Shared Environment factors. This mean difference was larger for the shared environmental factor (full, k, = - .70) than for the genetic factor (kg = - .30). The latent factor means alone, however, do not decide the degree to which the observed means are genet- ically or environmentally determined. This also depends on the factor loadings. For example, because the Genetic factor loading on reading recognition was greater than that for Shared Environment (.93 vs .14), the genes carried a greater weight in accounting for the group difference in reading recognition, accounting for 74% of the observed group difference, that is, .74 = .93 X .30/[(.93 X .30) + (. 14 X .70)]. Genes accounted for 66% of the group difference in reading comprehension. In contrast, shared environment was relatively more important

ACADEMIC ACHIEVEMENT IN BLACKS AND WHITES 219
than genes for mathematics achievement, accounting for 64% of the group differ-
ence . Table 3 presents the mean intercepts (LISREL vector 7). Because the Whites
were arbitrarily set as the reference group and had a mean of zero, these inter- cepts are also the model-predicted means for Whites. The predicted means for Whites ranged from 99.47 to 102.43. The predicted means for Blacks can be derived from the sum of an intercept and the products of the factor mean times the unstandardized factor loadings, For example, the Blacks’ reading recognition mean was derived as: [102.43 - (.3 X 12.44) - (.7 X 1.83) = 97.421. As expected from a good fit, the predicted means come close to the magnitude of racial mean differences in Table 1.
This analysis of means indicates that group-mean differences can be estimated from the factor loadings (see Table 2) derived from covariance matrices, in which no mean-level information was available. What if means and within-group achievement variation had different causes? In this case, the means would not track the factor loadings derived from the analyses of covariance matrices.
To have some intuition about the possibility of model rejection, we reran the quantitative genetic two-factor model on covariance matrices and means, but this time substituted two fake mean values for the correct ones. In the White full siblings, the mean of reading recognition was incorrectly set to 94. In the Black full siblings, the mean of mathematics was incorrectly set to 101. These two fake means lie within the range of mean values found in the data set. The Chi-square resulting from an analysis of purposely falsified means was large, x2 = 398.47, df = 37, p < .OOl . Thus, a seemingly small change in the values of two means can sharply reduce the quality of the model fit. Under these circumstances, it was certainly possible to reject a model in which the means have arbitrary causes unrelated to those of variation.
Another way to test the sensitivity of the quantitative genetic model to the means is to impose an equality constraint that the factor means be equal for Blacks and Whites. As Blacks actually have lower achievement test means than Whites, this model should be rejected. This model of equal factor means was strongly rejected, x2 = 105.11, df = 39, p < .OOl.
TABLE 3 Fitted Means From Genetic and Shared Environment
Quantitative Genetic Model
Test Intercepts Predicted (7 Vector) MS for Blacks
Read ret 102.43 91.42 Read camp 99.47 94.28 Math 101.50 95.39

220 ROWE AND CLEVELAND
DISCUSSION
In this study, we examined the hypothesis that racial mean differences (Blacks vs Whites) in reading and mathematics achievement would have the same causal structure as individual variation within the racial groups. We used the method of fitting quantitative genetic factor models to covariance matrices and achievement test means. The data were the variances and covariances among three achieve- ment tests (reading recognition, reading comprehension, and mathematics) for sibling pairs.
First, a model with a single Genetic factor was fit to the achievement test covariance matrices computed separately for White full siblings, White half- siblings, Black full siblings, and Black half-siblings. It was rejected. Next, a shared Family Environment factor was added to the model. This quantitative genetic model with two factors, one environmental and the other genetic, gave a good fit. All three achievement tests loaded strongly on the Genetic factor. The two verbal tests were weakly loaded on the Shared Environment factor; it was most strongly defined by achievement in mathematics. As all factor loadings were fixed to be equal across Black and White children, our model implies that the developmental causes of achievement in the two racial groups were similar.
The quantitative genetic factor model was next refit to the covariance matrices and means simultaneously. As the factor loadings from the individual differences (covariance) solution were fixed, a good fit would suggest similar causal deter- mination of both means and variation. Our findings supported this conclusion- the quantitative genetic model gave an excellent fit to the means. Racial differ- ences occurred in both the Genetic and Shared Environment factors, where both respective factor means were lower in Black than in White children.
Two model-sensitivity tests were also tried. First, fake (but not unrealistic) mean values were arbitrarily assigned to the reading recognition test in White (full sibling) children and to the mathematics test in Black (full sibling) children. When fitted against this purposely faked data, the quantitative genetic model was strongly rejected. Second, a test was done for the equality of factor means. This second model imposed the constraint of equal factor means for Blacks and Whites. As expected, because the actual achievement test means differed be- tween racial groups, it was rejected. Many mean structures could potentially falsify our quantitative genetic factor model, whereas only those achievement test means consistent with the magnitude of causal effects on individual variation should (and, in fact, do) support it.
An exciting finding is a racial difference in the Shared Environment factor of .7 of a sample standard deviation. This factor loaded most strongly on mathemat- ics; hence, it could account for 64% of the observed group-mean difference in mathematics achievement. Of course, the analyses used a latent environmental factor, not a measure of family environment. Further research is required to identify the particular features of family environment that have contributed to

ACADEMIC ACHIEVEMENT IN BLACKS AND WHITES 221
both individual variation and to the racial mean difference favoring White over
Black children. The broad genetic factor, on which all three tests loaded (although the mathe-
matics test was less heritable than the verbal ones), also had a lower mean in Black than in White children. This difference was about one third of a sample standard deviation. Because of the pattern and size of loadings, the Genetic fac- tor accounted for 66% to 74% of the observed group differences in the verbal tests, but only 36% of the group difference in mathematics. These estimates, of course, are imprecise because of sampling variation; they suggest that a part of the Black versus White mean difference is caused by racial genetic differences, but it would take a larger study, especially one with more genetically informative half-sibling pairs, to make such estimates quantitatively precise (but see Rodgers, Rowe, & May, 1994, for heritability estimates from this data set uncon- ditional on race).
Nonetheless, the existence of racial differences in genotypes (i.e., one’s ge- netic make-up) relevant to achievement could partly explain some racial differ- ences. It has been observed that the IQs of Black children are lower than those of White children, even when their homes have been matched on income or on parental education (Jensen, 1973; Jensen & Figueroa, 1975). This racial differ- ence becomes more pronounced in the upper social classes, where environmental advantages presumably are greatest for all children, than in the middle or lower classes. If genes favoring high academic achievement (i.e., IQ-related genes) were somewhat less prevalent in Black than in White persons in the United States, this may explain why, even among wealthy and well-educated families, a racial gap in children’s academic achievement persists.
Our approach contrasts with that used in another recent study of racial differ- ences in IQ (Weinberg, Starr, & Waldman, 1992; see also Lynn, 1994; Levin, 1994; Waldman, Weinberg, & Starr, 1994). In the Minnesota Transracial Adop- tion Study, the IQs at age 17 years were compared for (1) the (White) biological children of the adoptive parents, mean IQ = 109; (2) the adoptive children with two White biological parents, M,, = 106; (3) the adoptive children with one White parent and one Black parent, (M,o = 98; and (4) the adoptive children with two Black parents, M,, = 89. The sample sizes were quite small, for exam- ple 21 adoptees with two White parents. As can be seen, the mean IQs rank ordered accordingly with a genetic explanation of racial differences; they de- creased as Black parentage increased.
Nonetheless, other interpretations may apply. Waldman et al., (1994) inter- preted their Minnesota study as not supporting genetic effects on racial differ- ences. They offered two alternative explanations for the pattern of racial means. Their first was that race was confounded with particular adoption experiences- for instance, that the Black/Black adoptee group had the latest adoptive place- ments and had been placed with the least educated adoptive parents. Their second argument was made on the basis of racial discrimination: If racial dis-

222 ROWE AND CLEVELAND
crimination could reduce IQ, then the mean IQs of the adoptees could reflect the degree to which they were socially identifiable as members of racial minority groups. A third problem, which Waldman et al. did not emphasize, was that IQs on the adoptees’ biological parents were unavailable. Hence, the adoptees’ ex- pected mean IQs could only be conjectured at from existing population norms rather than estimated directly from parental IQs.
In retrospect, we can see that the Minnesota transracial study had inadvertent design flaws (e.g., unequal placement ages among adoptee groups). Rather than trying to second guess which explanation of their findings is correct, we advocate that better studies be done of racial differences. The transracial adoption ap- proach has both practical and theoretical limitations. Transracial adoptive chil- dren are extremely rare, and information on their biological parents is usually lacking. Furthermore, a theoretical limitation is that this method identifies only mean IQ differences, and not similarity of developmental processes among racial groups.
Although an ideal research design should include genetic markers for achieve- ment-relevant genotypes, these markers may be unavailable for some years. As a second best approach, we propose a research design that extends our sibling method. We recommend the addition of two new groups of children: (1) interra- cial full siblings and (2) interracial half-siblings (e.g., the mother may be White and her children have different Black fathers).
In this design, the interracial children would vary tremendously in physical appearance from very African to very European. Physical appearance can be treated either as a within sibling pair variable or as a between child one. If Waldman et al. are correct, in their hypothesis about racial discrimination noted earlier, then variation in appearance should predict academic achievement, or IQ, scores. Because genes segregate independently within families, the theo- retical genetic expectation would be a zero correlation of achievement and ap- pearance in interracial children. Similarly, psychological variables related to discrimination could be tested on the interracial siblings’ differences in achieve- ment or IQ.
Data on these interracial siblings also can be joined with data on Black and White full and half-siblings in a six-group research design. Similarity of the factor structure may be tested across all six groups, as can the validity of particu- lar genetic and environmental models. Lastly, whether the explanation of indi- vidual variation also applies to tests’ means can be evaluated. In the case of interracial children, one environmental prediction would be that children who are more European in appearance would do better on IQ tests than their brothers or sisters of greater African appearance. The genetic model’s prediction is one of no difference by appearance within interracial sibling pairs, and a structure of co- variances, variances, and means for IQ tests totally consistent among siblings of Black, White, and interracial parentage.
Survey procedures in the NLSY sample created several limitations for this research. The full and half-siblings were identified using a complex algorithm

ACADEMIC ACHIEVEMENT IN BLACKS AND WHITES 223
because no question in the NLSY survey directly obtained sibling status. In all likelihood, some sibling pairs were misclassified. The effect of misclassification is to lower estimates of the genetic effects, because the genetic difference be- tween “full” and “half” siblings is reduced. Although the original parents of the NLSY children constitute a nationally representative sample, the children do not. They are mainly the offspring of the less educated White and Black mothers in the NLSY. This is a possible explanation of the relatively small racial differences in means on the PIAT tests. A more representative sample would probably in- crease the racial mean difference in achievement. However, a greater phenotypic difference would not necessarily translate into a greater difference on the genetic factor. Resolution of such genetic and environmental effects would require a quantitative genetic analysis of a representative sample. Finally, the study lacked the statistical power needed to demonstrate more subtle group differences. In this sample, the heritability estimates that were obtained from the sibling and half- sibling correlations were discrepant between Blacks and Whites. They were not different statistically, however, because of the large standard errors possessed by heritability estimates. If some developmental processes are quantitatively stronger in one racial group than in the other, then larger samples would be needed to demonstrate this kind of effect. That is, a larger sample would give the greater statistical power needed to detect more subtle group differences.
An additional limitation is that the study must accept the “equal environ- ments” assumption for full and half-siblings. This assumption is sometimes mis- understood to indicate that different types of siblings must receive exactly equal treatments; this is a false conclusion. They may be treated unequally so long as the treatment variable does not affect academic achievement. For example, al- though identical twins are dressed more alike than fraternal twins, no one liter- ally proposes that the selection of clothes is a critical determinant of IQ. Furthermore, unequal treatments that are evoked by siblings do not violate the assumption because the direction of causality would be reversed. Although the “equal environments” assumption has been supported for twin studies (Rowe, 1994; e.g., Kendler, Neale, Kessler, Heath, & Eaves, 1993), it has not been tested in the full versus half-sibling research design. In this study, the half-sib- lings were related via their mother. They were reared by her and so should have shared many aspects of family environment believed to be related to academic achievement (i.e., neighborhood schools, exposure to mother’s vocabulary and intellectual interests, family income level). The equal environments assumption for full versus half-siblings is an important topic for further research.
Another limitation of the research design is that the genetic variation was anonymous; it was not tied to known genes. This anonymnity makes a finding of a genetic mean difference between racial groups strongly suggestive of genetic group differences, but not definitive proof. As genes related to IQ are discov- ered, their frequencies in various racial groups can be compared, and the issue of a genetic basis to racial differences in IQ and achievement fully resolved.
Although this molecular genetic evidence is highly desirable, it also lends

224 ROWE AND CLEVELAND
itself to misinterpretation by the public. A gene that explained 1% or 2% of the variance in IQ, but differed in frequency between Blacks and Whites, might easily be misinterpreted as showing that the entire racial difference is a genetic one. Our quantitative genetic model can be extended to include both measured genotypes and a genetic factor, as estimated through the comparison of pairs of relatives of different genetic relatedness. As was shown in this article, such a model also may include environmental effects. In future research, the best use of “IQ genes” would be in the context of a quantitative genetic model that identifies other genetic and environmental influences on IQ. This would help to place a molecular genetics of IQ into its proper context.
In summary, this article has presented a first exploration of the question of genetic and environmental effects on racial differences in academic achievement. We found equivalence across the racial groups in the causal structure of covaria- tion and variation among three tests of academic achievement. This observation supports a “common developmental process” view of the growth of academic knowledge and emphasizes our common heritage as one species, Homo sapiens. The determinants of covariation among achievement tests were genes and shared environment. In our model, these same genetic and shared environmental influ- ences produced the racial mean difference in academic achievement. We believe that the issue of genetic effects on racial differences in traits will be better re- solved if viewed as a quantitative one answerable by large, genetically informa- tive studies (Loehlin, 1992). We also reiterate that heritable does not imply “unchangeable,” as many genetic traits have responded to various environmental interventions. Finally, changes in family environments should reduce the existing racial difference in achievement, especially for mathematics achievement, be- tween White and Black children.
REFERENCES
Center for Human Resources Research. (1991) Children of the NLSY: 1988 tabulations and summary
discussion. Columbus: Ohio State University.
Chakrabory, R., Kamboh, M., Nwankwo, M., & Ferrell, R. (1992). Caucasian genes in American
Blacks: New data. American Journal of Human Genetics, 50, 145-155.
Chase-Lansdale, P.L., Mott, F.L., Brooks-Gunn, J., & Phillips, D.A. (1991). Children of the Na- tional Longitudional Survey of Youth: A unique research opportunity. Developmental Psy-
chology, 27, 918-931. Dolan, C.V., Molenaar, P.C.M., & Boomsma, D.I. (1992). Decomposition of multivariate phe-
notypic means in multigroup genetic covariance structure analysis. Behavior Genetics, 22,
319-335.
Dunn, L.M., & Markwardt, F.C. (1970). Peabody individual achievement test manual. Circle Pines, NM: American Guidance Services.
Futuyma, D.J. (1986). Evolutionary biology (2nd ed.). Sunderland, MA: Sinauer Associates.
Haggard, E.A. (1958). Intraclass correlation and the analysis of variance. New York: Dryden Press.
Harrison, A.O., Wilson, M.N., Pine, C.J., Chan, S.Q., & Buriel, R. (1990). Family ecologies of
ethnic minority children. Child Development, 61, 347-362.

ACADEMIC ACHIEVEMENT IN BLACKS AND WHITES 225
Helms, J.E. (1992). Why is there no study of cultural equivalence in standardized cognitive testing.
American Psychologist, 47, 1083-1101.
Jensen, A.R. (1985). The nature of the black-white difference on various psychometric tests: Spcar-
man’s hypothesis. Behavioral and Brain Sciences, 8, 193-263. Jensen, A.R. (1973). Educability and group dtyerences. New York: Harper & Row.
Jensen, A.R., & Figueroa, R.A. (1975). Forward and backward digit span interaction with race and
IQ: Predictions from Jensen’s theory. Journal of Educational Psychology, 67, 882-893. Joreskog, K.G., & Sorhom, D. (1989). LISREL 7: A guide to the program and applications (2nd
Ed.). Chicago: SPSS Inc.
Kendler, K.S., Neale, M.C., Kessler, R.C., Heath, A.C., & Eaves, L.J. (1993). A test of the equal
environments assumption in twin studies of psychiatric illness. Behavior Genetics, 23, 21- 27.
Lander, E.S., & Schork, N.J. (1994). Genetic dissection of complex traits. Science, 265, 2037-
2048.
Levin, M. (1994). Comment on the Minnesota transracial adoption study. Intelligence, 19, 13-20. Loehlin, J.C. (1992). Should we do research on race differences in intelligence? Intelligence, 16, l-
4.
Lynn, R. (1994). Some reinterpretations of the Minnesota transracial adoption study. Intelligence, 19, 21-27.
McLoyd, V.C. (1990). The impact of economic hardship on Black families and children. Psychologi-
cal distress, parenting, and socioemotional development. Child Development, 61, 31 l-346. Neale, M.C., & Cardon, L.R. (1992). Methodology for genetic studies of twins andfamilies. Dor-
drecht: Kluwer.
Plomin, R., McCleam, G.E., Smith, D.L., Vignetti, S., Chomey, M.J., Chomey, K., Venditti,
C.P., Kasarda, S., Thompson, L.A., Detterman, D.K., Daniels, J., Owen, M., & McGufftn,
P. (1994). DNA markers associated with high versus low IQ: The IQ quantitative trait loci
(QTL) project. Behavior Genetics, 24, 107-l 18. Rodgers, J.L., Rowe, D.C., & Li, C. (1994). Beyond nature versus nurture: DF analysis of non-
shared influences on problem behavior. Developmental Psychology, 30, 374-384. Rodgers, J.L., Rowe, D.C., & May, K. (1994). DF analysis of NLSY IQ/Achievement data: Non-
shared environmental influences. Intelligence, 19, 157- 177.
Rowe, D.C. (1994). The limits of family influence: Genes, experience, and behavior. New York: Guilford.
Rowe, D.C., Vazsonyi, A.T., & Flannery, D.J. (1994). No more than skin deep: Ethnic and racial
similarity in developmental process. Psychological Review, 101, 396-413. Rowe, D.C., Vazsonyi, A.T., & Flannery, D.J. (1995). Ethnic and racial similarity in developmental
process: A study of academic achievement. Psychological Science, 6, 33-38. Sattler, J. (1992). Assessment of children (3rd ed.). San Diego: Jerome M. Sattler.
Slaughter-Defoe, D.T., Nakagawa, K., Takanishi, R., & Johnson, D.J. (1990). Toward cultur-
al/ecological perspectives on schooling and achievement in African- and Asian-American
children. Child Development, 61, 363-383. Special issue on minority children. (1990). Child Development, 61(2). Spencer, M.B. (1990). Development of minority children: An introduction. Child Development, 61,
267-269. Turkheimer, E. (1991). Individual and group differences in adoption studies of IQ. Psychological
Bulletin, 110, 392-405. Waldman, I.D., Weinberg, R.A., & Starr, S. (1994). Racial group differences in IQ in the Minnesota
transracial adoption study: A reply to Levin and Lynn. Intelligence, 19, 29-44. Weinberg, R.A., Scan, S., & Waldman, I.D. (1992). The Minnesota transracial adoption study: A
follow-up of IQ test performance at adolescence. Intelligence, 15, 117-135.