Embed Size (px)
Citation preview

Discussion Papers
Berlin, November 2004
Self-Employment Dynamics Across the Business Cycle: Migrants Versus Natives
Amelie Constant Klaus F. Zimmermann

Opinions expressed in this paper are those of the author and do not necessarily reflect views of the Institute.
DIW Berlin German Institute for Economic Research Königin-Luise-Str. 5 14195 Berlin, Germany Phone +49-30-897 89-0 Fax +49-30-897 89-200 www.diw.de ISSN 1619-4535

Self-Employment Dynamics Across the Business Cycle:
Migrants Versus Natives*
Amelie Constant
IZA, Bonn [email protected]
and
Klaus F. Zimmermann
Bonn University, IZA, Bonn, and DIW Berlin [email protected]
November 3, 2004
Abstract
Economically active people are either in gainful employment, are unemployed or self-employed. We are interested in the dynamics of the transitions between these states across the business cycle. It is generally perceived that employment or self-employment are absorbing states. However, innovations, structural changes and business cycles generate strong adjustment processes that lead to fluctuations between employment and self-employment, directly or through the unemployment state. Migrants are more likely to be sensitive to adjustment pressures than natives, since they have less stable jobs and choose more often self-employment to avoid periods of unemployment. These issues are investigated using a huge micro data set generated from 19 waves of the German Socio-economic Panel. The findings suggest that the conditional probabilities of entry into self-employment are more than twice as high from the status of unemployment as from the status of employment. Self-employment is also an important channel back to regular employment. Business cycle effects strongly impact the employment transition matrix, and migrants take a larger part in the adjustment process. They use self-employment as a mechanism to circumvent and escape unemployment and to integrate into the host country's labor market. JEL classification: E32; J23; J61; M13 Keywords: Self-employment, entrepreneurship, business cycle, migration, Markov chain analysis * Presented at the 2004 meeting of the Society of Labor Economists (SOLE) in San Antonio and at the 2004 Western Economic Association Annual Meeting in Vancouver. We wish to thank conference participants including Holger Bonin and Robert W. Fairlie for valuable comments. The GSOEP data used in this study are available upon request from the German Socio-Economic Panel at DIW Berlin (www.diw.de/gsoep). The paper has also benefitted from a research visit of Amelie Constant to DIW Berlin in the Fall of 2004. Corresponding author: Klaus F. Zimmermann IZA, P.O. Box 7240 D-53072 Bonn, Germany Phone: +49 228 3894 200 Fax: +49 228 3894 210

1
1. Introduction
There are two types of entrepreneurship: First, there are those individuals who freely choose an
independent profession that enables them to materialize their visions. They face risky choices, but
this is part of their success strategy; they are pulled or attracted by the lucrative facets of self-
employment. Second, there are those forced to work on their own risk because nobody else wants to
take the risk to employ them. The latter are often either the former unemployed or immigrants and
ethnic minorities, who use this activity as a channel of circumventing or escaping from long-term
unemployment or as a means to climb up the employment ladder into regular employment. Forced
self-employment, however, does not exclude the fact that these individuals are industrious and
venturesome. It is important to note that these push-pull scenaria depend on the phase of the
business cycle. Empirically, it is difficult to separate these two types of self-employed individuals
in a static data setting due to the lack of appropriate panel data.
Therefore, the focus of this paper is to contribute to this under-researched area by
investigating the dynamics of self-employment using a rich and long panel micro data set for
Germany. In the German context immigrants and ethnic minorities are difficult to separate,
however. Hence, due to the nature of our data, we jointly investigate the behavior of more recent
immigrants and those who still carry the foreign passport and compare them with the dynamic
behavior of natives when confronted with the ups and downs of the business cycle. To introduce
our research approach, we first outline the relevant literature on the self-employment of natives,
immigrants and ethnic minorities and the related results associated with the business cycle.
While the prevalence of self-employment among immigrants, ethnic groups in general and
natives in the labor market has been researched and documented by many studies in the US,
research on entrepreneurship and especially immigrant or ethnic entrepreneurship in Europe and
Germany, in particular, has been somewhat scant. Recent surveys on the rising empirical literature
on self-employment in a comparative setting investigating research in the US, Europe, and other

2
immigration countries include Le (1999), Blanchflower, Oswald and Stutzer (2001), Audretsch
(2002), Audretsch, Thurik, Verheul and Wennekers (2002) and Blanchflower (2004). These studies,
mostly cross-sectional, identify the role of managerial and other individual abilities, gender,
education, family background, occupational status, financial constraints, the nature of work, and
ethnic enclaves, among other factors as relevant determinants of self-employment.
Borjas (1986) finds that the probability of self-employment of migrants increases with years
since migration in the US, and that recent immigrant cohorts have higher self-employment rates
than earlier cohorts. Living in enclaves also increases self-employment probabilities. Compared to
similarly skilled native-borns, immigrants are more likely to be self-employed. Other outstanding
work for the US includes the paper by Fairlie and Meyer (1996); this comprehensive study of
ethnic/racial groups by gender presents tests of many theories and provides evidence that
individuals are pulled rather than pushed into self-employment. That is, self-employment is
appealing to ethnic groups because of its high relative returns rather than it is the outcome of
discrimination or language difficulties. However, a panel study on black and white men in the US
finds that blacks are severely underrepresented in self-employment, and the self-employment ratio
between blacks and whites has been constant over the last 80 years at one to three (Fairlie 1999).
The paper goes beyond looking at determinants of self-employment by calculating dynamic
transition probabilities between self-employment and paid employment, both for entry and exit;
transition rates differ substantially by race. By decomposing the racial gap in the transition rate in
and out of self-employment this study finds, however, that education, assets, and father's self-
employment explain part of the racial gap in entry rates but not in exit rates.
There is only scarce evidence about migrant entrepreneurs in Europe and especially in
Germany. The findings by Clark and Drinkwater (1998) suggest that self-employment is a way out
of discrimination in paid employment for immigrants in Great Britain. Wage work pays less well
for ethnic minorities when they are compared to natives, and the difference has increased over time.
The increase in the earnings disadvantage is correlated with a rise in the self-employment of ethnic

3
minorities. Although there are higher self-employment rates for non-whites than for whites, one
nevertheless observes a substantive variance among the ethnic groups. Most ethnic minorities also
earn less in self-employment than similar self-employed whites.
For Germany, Constant, Shachmurove and Zimmermann (2003) find that the probability of
self-employment increases significantly with age for all groups albeit at a decreasing rate. While
Turks are twice as likely to choose self-employment as any other immigrant group, their earnings
are no different than the earnings of the other self-employed immigrants. The age-earnings profiles
of self-employed native and immigrant men are concave and surprisingly similarly shaped. While
for self-employed German men hours of work and Treiman prestige scale increase their earnings,
for self-employed immigrant men it is the longevity of the business that makes a difference.
Constant and Schulz-Nielsen (2004) find that self-employment rates among ethnic groups
vary widely with ethnicity and sex, and that many refugees are in self-employment. Self-employed
immigrants in Germany are self-selected with respect to human capital, age, years since migration,
family background characteristics, homeownership, and enclave living. Iranians and Lebanese are
more entrepreneurial than Turks. Self-employed immigrants also earn twice as much as immigrants
in paid employment, while those immigrant entrepreneurs of younger age, who own a larger size
business and live outside ethnic enclaves, have higher earnings. In Denmark, however, it is only the
males and those with disabilities who are self-selected into self-employment. While Iranians are
still more entrepreneurial than Turks, the ex-Yugoslavs are not. Overall, in Denmark, immigrant
entrepreneurs earn less than immigrants in paid employment. This comparative study of the same
immigrant groups in two host countries observes that maybe some countries are not conducive to
self-employment and that self-employed immigrants in Denmark, for example, would find a better
match for their talents if they were to move to Germany.
The literature on the business cycle effects on self-employment around the world uses
unemployment rates as a proxy for the business cycle, and produces rather conflicting evidence.
Some studies find that self-employment is inversely related to business fluctuations and it lags in
4
response to recession (see Aronson 1991 for a review). In a panel study on the OECD countries,
Blanchflower (2000) also finds a negative relationship between self-employment and
unemployment rates. In contrast, Evans and Leighton (1989) in their longitudinal study on white
men in the US find a positive relationship between self-employment entry and unemployment rates,
supporting the push theory. Using longitudinal data for men in Spain, Carrasco (1999) also finds
that the unemployed are more likely to switch into self-employment, and this likelihood is
increasing with the availability of assets, more education, and older age. The switch is more
attractive for the unemployed when the economic situation improves.
Moore and Mueller (2002) find, among other things, that self-employment decisions are
independent of the situation in the labor market as measured by the unemployment rate. Still, their
results are more consistent with the push theory. Yet, Robson’s (1998) study, based on various
sources of aggregate data in the UK, finds no “recession push.” Another panel study on males in
Denmark concurs on the very different labor market transition patterns between natives and
immigrants, and finds strong differences among the immigrant groups; immigrants from less
developed countries are marginalized self-employed who use the self-employment option as a last
resort (Blume, Ejrnæs, Skyt Nielsen, and Würtz 2003).
Our paper is unique in that it uses a rich panel data set that allows following the
employment and unemployment paths of individuals and identifying their status over long enough
periods to capture business cycle effects. The data set employed is from the first 19 years of the
German Socio-Economic Panel with rich information on both natives and immigrants. The
perceived employment, self-employment and unemployment history, individual indicators of
economic performance and the macroeconomic conditions in general are used to determine the
status of forced self-employment. This is modeled against the genuine type of entrepreneur, who is
identified by ethnic status, parental entrepreneurial human capital, state-dependence, and individual
educational performance. We use GNP growth instead of macro unemployment rates to identify
business cycles because unemployment rates in Germany vary asymmetrically.

5
We concentrate on males who are in the active labor force. Hence, the core employment
states are employed, self-employed, or unemployed. Unlike most other studies, we include the
registered as unemployed as an empirically distinct state in the labor market.1 At any time, there is
a transition matrix describing the conditional probabilities of moving from the current to the next
period's state vector. We explore the short-run and the long-run versions of the transition
probability matrix that capture the core employment dynamics.2 We model the transition
probabilities using rich panel data that capture individual behavior and merged information on the
macro business cycle. We expect business cycles to generate adjustment processes that lead to
fluctuations between employment and self-employment, directly or through the unemployment
status. Migrants or ethnic groups are more likely to be sensitive to adjustment pressures than
natives, since they have less stable jobs and choose more often self-employment to avoid periods of
unemployment. Hence, we want to understand how ethnicity and business cycle effects act and
interact with the employment transition probabilities.
The paper is organized as follows: In Section 2 we outline the Markov modeling strategy of
transitions between the core employment states, namely employment, unemployment or self-
employment, and the empirical estimation of the respective transition probabilities through
multinomial logit models. In Section 3 we explain the data set, describe the construction of the
variables employed, and present the basic hypotheses for our empirical study. In Section 4 we
present the business cycle and self-employment trends over the last 20 years in Germany, the
characteristics of the sample used, and explore the cyclicality of the transition probabilities. Section
5 examines the econometric evidence on the dynamics between the core employment states. Lastly,
Section 6 summarizes the paper and concludes.
1 The registered as unemployed have a different behavior than the not employed, who are not attached to the labor
force. While there are significant transitions from unemployment to employment, the transition form no employment to employment is very low (Flinn and Heckman 1982).
2 Such a computable Markov chain model has recently been proposed and applied by Constant and Zimmermann (2003) to issues of circular migration in Germany.

6
2. Model Specification
2.1. A Markovian Modeling Framework
We model the movement of individuals between the employment states by a discrete-time discrete-
space Markov process. We assume that the employment status of the individual at any period t is
described by a stochastic process {Et} that takes values in a finite discrete state space S = {0, 1, 2}.
A Markov chain is a sequence of random values whose probabilities at a time interval depend upon
the value of the number at the previous time (Papoulis 1984). We embody the idea that if an
individual knows the current state, it is only this current state that influences the probabilities of the
future state. At each time, the Markov chain restarts anew using the current state as the new initial
state. We assume that this Markov chain has three states, 0, 1, and 2 indicating that an individual is
employed, unemployed or self-employed respectively. The vector containing the long-term
probabilities, denoted by π, is called the steady-state vector of the Markov chain.
The state probability (row) vector is:
[ ]210 ,, ππππ = (1)
where π0, π1, π2 are the probabilities that a person is in employment, unemployment, or self-
employment. Under the assumption that the system converges and is in steady-state, the state
probabilities do not depend on the year of observation. This is the stationary distribution of the
chain and satisfies the following equation:
Ρ= *ππ (2)
where
=Ρ
222120
121110
020100
ppppppppp
(3)
is the transition probability matrix with P00 + P01 + P02 = P10 + P11 + P12 = P20 + P21 + P22 = 1. P00 is
the probability that a person who is employed in the current year would tend to stay in this category
of employment in the next year, while P01 is the probability that a person who is employed in the
current year would tend to move to unemployment in the next year, and P02 is the probability that a

7
person who is employed in the current year would tend to move to self-employment in the next
year, and so on.
A transition probability is the commanding factor in a Markov chain. It is a conditional
probability that the system will move to state 0, 1 or 2 in the next time period, given that it is
currently in state 0; it will move to state 0, 1 or 2 in the next time period, given that it is currently in
state 1; and it will move to state 0, 1 or 2 in the next time period, given that it is currently in state 2.
The Markov chain obtains the much desired efficient estimates when the transition probabilities are
properly determined. Even if the system converges in the long run, the Markov chain equation does
not need to hold in the short run. However, if this equation is closely applicable with real data this
indicates that the Markov assumption is useful in describing reality.
We assume that individuals have a myopic but pragmatic foresight (taking it one step at a
time) and maximize their utility at every period given the state they are currently at. We assume a
discrete time process where a person's status is a random process in time. The Markov approach is,
then, an appropriate representation of the structure of the behavioral process of individuals who
move in between employment states. The key feature of this model is that the future state depends
solely on the current state.
Specifically, the transition probabilities of an individual m from one state to the other or to
the same state depend only on the current state, and the socioeconomic characteristics of the
individual, Xm. These independent variables are expected to affect the individual's probability of
being in a given state. We consider six distinct outcomes that describe the transitions. Transitions to
the same state, that is, from state 0 to 0, 1 to 1, or 2 to 2, are not considered here. This is convenient
since the summing-up restrictions of conditional probabilities allow us to exclude three conditional
probabilities, and we concentrate on transitions to different types of employment.

8
2.2. Modeling the Steady State Transition Probabilities
To estimate the transition probabilities as they are explained by the individual characteristics, X, we
employ three multinomial logits conventionally specified as:
∑∑= =
= 2
0
2
0
/
/
m n
x
x
ijtmn
tij
e
epβ
β
2,0 ≤≤ ji (4)
The idea is that individuals have three choices depending on the state there are in. We estimate a
multinomial logit on the probability to go into unemployment or self-employment, given that the
individual is currently in paid employment. Second, we estimate the probability to go into paid
employment or self-employment, given that the individual is currently in unemployment. Third, we
estimate the probability to go into paid employment or unemployment, given that the individual is
currently in self-employment.
The closed form for the probability that a person will move from one state to the other from
time t to t+1 is:
∑−
=
+== 1
01
)|( K
k
X
X
ik
ij
e
eXjYPβ
β
(5)
where i indexes the individuals, and j indexes the alternative transitions: j = 0, 1, 2, which are three
nominal, unordered outcomes. To identify the model, we impose the normalization β0 = 0. The
characteristics in X will help us explain how a person evolved into getting to that specific state and
how his choice is influenced for the next move. Lastly, we calculate the steady state probability
vector (π) to find the probability that an individual is in a certain state.
3. Data Source, Variables and Hypotheses
3.1. The GSOEP and Construction of the Sample
The German Socioeconomic Panel (GSOEP), administered by DIW Berlin, is a nationally
representative annual survey (see SOEP Group 2001) that started in 1984 in the former Federal
Republic of Germany with a sample of about 12,000 respondents, 3,000 of whom were legal

9
immigrants. The latter were those living in a household whose head was from Italy, Greece, Spain,
Yugoslavia, or Turkey - the migrants and descendants from the so-called guestworker regime. The
GSOEP is an ongoing longitudinal database that interviews all persons aged 16 or older. It contains
rich socioeconomic information on both native Germans and legal immigrants. The GSOEP
actually oversamples guestworkers and, additionally, provides excellent information on their pre-
immigration experiences. In this long-term analysis we do not include the collected data on East
Germany after unification and the other various refreshment samples created since then. We
concentrate on native West Germans and legal immigrants (or guestworkers) who have been living
side by side in the former West Germany for more than 30 years.
We use 19 waves of West German data during the period 1984 - 2002. We focus on the
male subsample because men are characterized by a strong labor market attachment, and their
employment transitions are more cleanly related to labor market structures and the business cycle.
Our sample contains all males over 16 years of age who were successfully interviewed and
available in a transition between two consecutive years in the states employed, unemployed or self-
employed. The upper cut-off age is 60 to avoid any spurious effects due to retirement decisions. We
also exclude those in the military, the students, and the civil servants. This longitudinal sample
contains 7,652 individuals, of whom 2,462 are immigrants and 5,190 are native West Germans.
Table 1 presents the yearly sample observations and the final longitudinal sample by ethnicity.
To implement the event history analysis we restructured the GSOEP data into “person-
years,” which became the effective unit of our analysis. A person-year is a one-year fraction of a
person’s life during which the event in question (a move to another employment status) may or may
not occur. Each yearly fraction of a person’s life is treated as a distinct observation. The person-
year file contains information about the occurrence or nonoccurrence of the event, as well as the
values of relevant independent micro- and macroeconomic variables (with or without temporal
variation); it is the life history of each person. However, it is not necessary that every person
experiences the event. In our analysis, however, we only consider complete transitions from one

10
state to the other. The Markov modeling rationale keeps those individuals who are out of the labor
force out of the analysis. This implies a two-stage decision process where a first stage models the
probability to enter the labor force, and a second stage deals with the probability to enter into one of
the three states (employment, unemployment and self-employment).
The person-year file has 62,780 observations, representing detailed longitudinal histories of
the individuals’ experiences and behavior from the moment they enter the sample until exit, death,
or the final survey date. The variables we employ in our analysis may either be fixed or time-
varying. The variables that change from year to year include age, years since first arrival in
Germany and GNP growth rates. We use GNP growth instead of macro unemployment rates as in
the literature to identify business cycles since unemployment rates in Germany vary asymmetrically
across the cycle. Those variables that are referring to fixed characteristics, such as education before
migration and ethnicity, remain constant over person-years.
To capture all transitions in the most accurate manner, we initially consider and keep the
individuals who are not in the labor force in any current state because they might change and go
into the labor force in the future state. After we calculate the complete transitions, we delete the not
employed and continue our analysis with those in the labor force. The final person year file has
47,961 observations with 32,880 native West Germans, and 15,081 immigrants.
3.2. Variables and Hypotheses
To effectively capture the cyclical dynamics of our transition probabilities we control for both
micro- and macroeconomic variables. First, we control for the standard forms of human capital,
family characteristics, intergenerational links, demographics, and ethnicity. We augment the model
with the GNP growth rates and an interaction variable between GNP and ethnicity.
The human capital variables are separated into schooling acquired in Germany and in the
home country for the immigrant group. Besides formal schooling we employ vocational training
(both pre- and post-migration) because this is a unique feature of the German educational system

11
and makes a difference in the labor market placement and opportunities. For formal schooling in
Germany we consider three categories: (i) no schooling degree, which is the reference category, (ii)
primary or lower secondary schooling, and (iii) high school and beyond. Graduating with
vocational training in Germany is a separate dummy variable.
For immigrants, we create two additional dummy variables for pre-migration formal
schooling and vocational training. We expect that individuals with more schooling and vocational
training will have lower chances in going into unemployment if they are working, and higher
chances in going into employment or self-employment when they are unemployed. As a proxy for
the health status of the individual (a vital form of human capital), we create a dummy variable from
the occupational disability question.
The age and years since migration variables capture experience, savvyness, and know-how
of the labor market; they are entered as quadratics. In principle, these variables should have a
differential impact on all three employment choices. For age, for example, we expect that older
individuals are more likely to go into self-employment from employment, because older workers
have more experience, know the market better and face lower liquidity constraints. For years since
migration, we expect that immigrants who are newcomers in Germany will be more likely to go
into unemployment because they are in a more precarious condition. On the other hand, the longer
immigrants are in Germany the more likely they are to go into self-employment or employment.
Marital status and young children in the household can also affect labor market choices and
sorting. Married men and men with young children, as income earners and household providers,
will be less likely to go into unemployment and more likely to stay employed either in paid- or self-
employment. Homeownership is expected to affect the employment transitions as well. Individuals
who own their house will be more likely to stay employed. The “father self-employed” variable
captures intergenerational links. Self-employed fathers can pass on to their children an invaluable
lore. According to the literature, there is a strong intergenerational link from fathers to sons,
especially in the self-employment sector (Dunn and Holtz-Eakin 2000). We expect that men whose

12
father is self-employed will be more likely to go into self-employment from other states, and to
choose self-employment as their steady absorbing state.
The next group of independent variables refers to the nationality status. We distinguish
individuals as native West Germans and immigrants. Within the immigrants we differentiate among
Turks, individuals from the former Yugoslavia, Greeks, Italians, and Spaniards. Because the low
number of observations of self-employed Spaniards rendered our model inestimable, we regrouped
the ethnicity variables of Greeks, Italians, and Spaniards into the “EU” variable, since all these
groups are part of the European Union for a long time and share a common legal status in Germany.
We expect that different nationalities have different paths in the labor market. Some groups for
example, may be more entrepreneurial than others, some have long traditions in self-employment,
and some may be more affected by structural changes. The reference category is native West
German men.
We lastly control for business cycle. Employment transitions could be pro- or
countercyclical, as they could also be acyclical. Unlike other studies, we employ the GNP growth
rates, as the capstone of the statistics on business cycle. For the analysis on the entire sample, we
also create an interaction variable between GNP growth rates and ethnicity to see whether the
business cycle affects immigrants differently. This variable also goes to the asymmetrical effects
created by the business cycle. We finally adjust the econometric model using robust standard errors.
Because immigrants may differ from natives, we repeat this exercise for immigrants only. In this
analysis, the reference ethnic group is the Turks. Empty cells problems forced us to exclude the
“disability” and “father self-employed” variables from the self-employment estimation.
4. Business Cycle, Sample Characteristics and Transition Probabilities
4.1. Self-employment Trends and the Business Cycle
All countries experience business cycles or economic fluctuations due to economic disturbances of
various sorts. In general, a business cycle has 4 phases: the downturn (recession or contraction), the

13
trough, the upturn (boom or expansion), and the peak. Contrary to the word “cycle” these phases
are not always regular in their periodicity, amplitude, duration and timing. While there is some
consensus on the effect of business cycles on employment (for example, during a recession
employment falls and unemployment rises while during expansion employment rises and
unemployment falls), the effect of business cycles on self-employment per se are not as clear-cut.
In general the arguments can be summarized as follows. Individuals can be either pushed or
pulled into self-employment depending on the phase of the business cycle. Those who are
unemployed or not employed and cannot easily find paid employment during a recession phase
could use the self-employment state as a means of circumventing unemployment and hardship in
the labor market. In that case one would expect self-employment rates to increase during the
downturn and individuals to be pushed into forced self-employment. However, the success and
longevity of a business is rather low during the downturn, which in turn, can also act as a deterrent
to self-employment start-ups.
During the expansion phase, individuals who are unemployed or not employed can easily
find paid employment. They may, thus, be more likely to choose the more “secure” avenue of paid
employment than self-employment. At the same time, self-employed individuals may also close
down their business3 and find a better and “secure” job by working for somebody else in the
expansion phase. It is possible, thus, that self-employment rates are lower during a boom. On the
other hand, many individuals can be pulled into self-employment during the expansion phase
because it is easier to establish or expand a business and increase profits. Self-employment
becomes less risky in this case. We would, thus, expect that self-employment rates increase with a
boom.
Using official statistics (Sachverstaendigenrat 2003) we calculate the growth rates for GNP
from 1983 – 2003, encompassing the entire period of our sample. Similarly, we calculate the
growth rates for self-employment in Germany during that same period. The results of these

14
aggregate statistics are plotted in Figure 1. This figure shows that GNP was on a downturn from
1984 to 1987, where it reached its trough. This downward trend was severely amplified in the self-
employment trend, which - after reaching its peak in 1984 - dipped to its lowest and negative level
in 1986. Self-employment increased dramatically, however, in 1987 although GNP was decreasing.
From 1987 to 1990 there was an overall uptrend and GNP was growing. The peak of the
German expansion phase occurred in 1990. The corresponding self-employment growth rates show
that they are closely following and matching the GNP growth rates but only when the latter follows
a sustained growth. For short period bumps and dips, self-employment rates exhibit a
countercyclical pattern. Nonetheless, self-employment growth rates stayed below GNP growth
rates.
After the German reunification in 1990, GNP started declining with a pronounced
precipitous and severe drop after 1991. GNP reached a trough with negative levels in 1993. While
self-employment rates match the precipitous decline of the GNP in the beginning, especially during
the period 1988-1992, and mimic every move of the GNP from below, they bounce back up in 1992
in a procyclical manner, overshooting the GNP growth rates.
The recovery period of the business cycle started after 1993, and GNP reached positive
levels again in 1994. With the exception of a small dip in 1996, GNP kept growing to reach another
peak in 2000. Up until 1998 of this recovery and expansionary period, self-employment rates
exhibit strong procyclical patterns, and stay at positive levels always from above of the GNP. After
2000 GNP starts its downturn, and self-employment follows the same route from below. As it can
be seen from Figure 1, the self-employment growth rates follow largely the GNP growth rates,
although not always closely.
3 If the business does not take off the way entrepreneurs want it, it is easier for them to close it down and move into
paid employment.

15
4.2. Characteristics of our Sample Population
In Table 2 we present the means of the relevant individual characteristics by employment state and
nationality. On average, the youngest workers are in paid employment, while the oldest workers are
in self-employment. The average self-employed German in our data set is 42 and the average
immigrant is 39 years old. For immigrants, we also report their length of stay in Germany. Overall,
for every state, immigrants have been living in Germany for more than 20 years. Table 2 shows that
the longer the immigrants are in the host country, the more likely they are to be in the self-
employment category, while the shorter time they have been in the host country the more likely
they are to be in paid employment.
When we compare the three groups of employed, unemployed and self-employed in the
entire sample, we find the largest share of individuals with no schooling degree among the
unemployed (15%). Those individuals have a much lower share among the employed (9%) and
among the self-employed (4%). Among the unemployed, more than a quarter of the immigrants
have no schooling degree in Germany. Since this variable is not conditional on age, the high non
schooling rates of immigrants could be due to their entry at an older age. The smallest share of
uneducated men is in the self-employment category (1%). For immigrants, we find almost equal
fractions of the individuals with high school and beyond in the self-employment (58%),
unemployment (51%) and employment categories (54%). For Germans, the fractions of individuals
with high school and beyond are 53% in the self-employed category, 41% among the employed and
25% in the unemployment category. Similarly, we find that individuals with vocational training in
Germany have a high presence in the work categories: 68% of the self-employed and 67% of those
in paid employment in the entire sample have a vocational training degree. Among the unemployed
immigrants, only 33% have vocational training, while more than 40% do have such a degree in the
employment and self-employment categories. Migrants with pre-migration schooling are more
equally dispersed across the categories; about 50% of the employed and the self-employed have
some schooling degree from their home countries, but only 48% of the group of the unemployed.
16
Similarly, 30% of the employed and the self-employed have vocational training in their home
country, but only 25% of those migrants who are unemployed.
We find that individuals with impaired health status have the strongest presence in the
unemployment category; their presence is lower among the employed men and lowest among the
self-employed. Overall, immigrants in all groups exhibit a lower share of individuals with a
disability status than Germans. Homeowners are strongest in the self-employment category (57% in
the entire sample, 63% of the natives and 25% of the immigrants). Among the employed, 49% of
the Germans own their home, but only 13% of the employed immigrants. Still 34% of the
unemployed Germans own a home, but only 8% of the unemployed immigrants are homeowners.
In Table 2 family characteristics are measured by marriage status and the presence of small
kids. Immigrants have more family presence among all three states than natives. In the
unemployment category, immigrants and Germans have lower shares of individuals with family
characteristics than in the other two states. These findings are consistent with the well-established
fact that being married and having small kids create a positive impact on economic performance for
men.
Looking at the ethnicity groups, we see that German men have the strongest presence in the
self-employment category; 84% of the entrepreneurs, but only 68% of the employed and 55%
among the unemployed are Germans. In contrast to Germans, immigrants have lower shares in self-
employment. Turks, have the highest share in the unemployment category (24%). Turks have also
the highest unemployment share among all immigrants (54%). While 12% of those in paid
employment are Turks, their share in the self-employment category is only 4%. In the group of the
self-employed, immigrants from the former Yugoslavia have a rate of 3%, their share being 7%
among the unemployed and those in paid employment. The three nationalities that compose the EU
immigrants exhibit a comparatively higher share among the self-employed than the other
immigrants (9%). About 14% of the immigrants in paid employment and unemployment nationals
are from the EU.
17
4.3. Transition and State Probabilities
In Table 3.1 we present the average transition probabilities calculated experimentally from the raw
data for the entire sample. This table shows that the relevant transition probabilities are P01 = 0.033,
P02 = 0.011, P10 = 0.329, P12 = 0.025, P20 = 0.071, P21 = 0.009. The probability of the transition
from employment to unemployment is 3%, while the transition to self-employment is at a low 1%.
The probability of the transition from unemployment to employment is a high 33%, while the move
from unemployment to self-employment is only 2.5%. Conditional on being unemployed the
transition probability into self-employment is 2.5 times higher than into being employed. The
probability to move from self-employment to employment is at a high 7%, while the transition
probability from self-employment to unemployment is at a very low 1%.
Next, we find that the average initial state distribution vector π - calculated from the raw
data - is π = [π0 π1 π2] = [0.837 0.066 0.096]. Applying the Markov chain equation the
calculated estimates of the steady state probabilities after the transition are: π* = [0.829 0.072
0.100]; this is nothing else than the average state probabilities from the raw data after the transition.
These numbers are sufficiently close to π to make us believe that the Markov chain specification is
an appropriate representation for our employment transition setting.
The average transition probabilities for immigrants are presented in Table 3.2. The numbers
along the diagonal show that the highest tendencies are to stay in employment, unemployment, and
self-employment from the respective current states. The transition from employment to self-
employment is the lowest (0.8%) indicating that immigrants are not moving into self-employment
often. The probability from self-employment to employment is high at 10%. That is, the exit
probabilities are 10 times higher than the entry ones. The probability from unemployment to
employment is 32% while the probability to self-employment is only 1%. The state probability
estimations for the immigrant sample are as follows: π = [π0 π1 π2] = [0.854 0.095 0.051] and
π* = [0.844 0.104 0.053]. We can safely say that π and π* are sufficiently close.

18
The average transition probabilities for Germans are presented in Table 3.3. When
compared to the transitions of the immigrants in Table 3.2, Germans move less strongly from
employment to unemployment. Their transition probabilities from unemployment to self-
employment are more than twice as large as those of the immigrants. And the transitions from self-
employment to employment and to unemployment are somewhat stronger for immigrants than for
Germans. The corresponding estimation of the state probabilities for the German sample is as
follows: π = [π0 π1 π2] = [0. 830 0. 053 0.117] and π* = [0.822 0.057 0.121]. Once again,
these numbers encourage us to believe that the Markov approach is good model for our data.
In Table 4 we present the correlation coefficients of the transition probabilities with the
business cycle and among themselves over time. This analysis examines how the transition
probabilities move over time with the ups and downs in the economy, and how they interact which
each other. The first row pertains to the entire sample, the lower triangle pertains to the immigrant
sample, and the upper triangle pertains to the German sample. Cleary, for the entire sample, the
highest positive correlation is between the business cycle (GNP) and the transition from
unemployment to paid employment (P10). This confirms the expected outcome that in an expansion
phase, workers go out of unemployment; however, their preferred state is in paid employment
rather than in self-employment, given that they are unemployed. Nevertheless, there is some
positive correlation between the business cycle and the transition from unemployment to self-
employment: the better the economic situation is, the more the unemployed are also willing to
become self-employed. The positive correlation between the business cycle and the transition from
self-employment to employment is high as well. This indicates that during the upswing, workers
leave self-employment for paid employment.
For immigrants specifically (lower triangle), we find a positive and very high correlation
between the upswing of the business cycle (GNP) and the transition from unemployment into paid
employment (P10). The positive high correlation between P20 and P10 suggests that immigrants
gravitate jointly into paid employment either when they come from unemployment or self-

19
employment. On the other hand, the correlation between P21 and P20 indicates that the transition
probabilities for immigrants from the self-employment state for paid employment or unemployment
move together over time. It is also interesting to see that the transition probabilities of moving from
employment to unemployment P01 and from employment to self-employment P02 are strongly and
positively correlated, which suggests that self-employment is an alternative to unemployment.
For German workers, we find a high correlation between GNP and P01. This correlation is
negative, suggesting that German workers are hit by the downturn of the business cycle and become
unemployed. Similar to immigrant workers, the correlation between P20 and P10 is high echoing
gravitation towards paid employment. Notable differences with immigrants go to the correlation
between P01 and P02 and between P02 and P10. The first indicates a strong transition out of
employment, while the latter indicates a transition out of unemployment into self-employment
through paid employment.
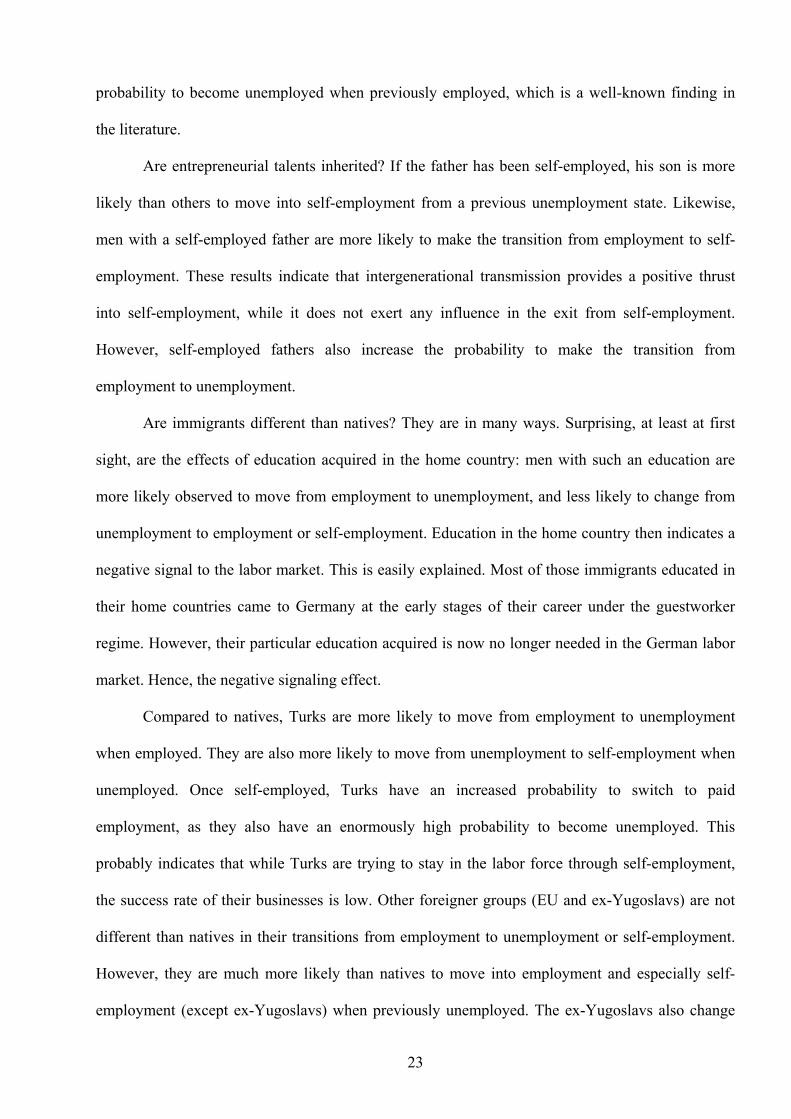
In Figures 2-4 we illustrate the key annual transition probabilities for the 1984 - 2001 period
for the entire sample. These figures are calculated from our microdata set. Figure 2 shows the
transitions from employment to both unemployment and self-employment. Clearly, there is not
much movement between employment and self-employment. Overall, this transition probability
remains low and hovers around 0.01, indicating that entry into self-employment from paid
employment is not the preferred route of our sample population. Compared to GNP growth rates in
Figure 1, this figure displays a rather acyclical pattern. However, the transition probability from
paid employment to unemployment exhibits a lot more variation and largely follows the business
cycle.
We display the transition probability from the state of unemployment to self-employment in
Figure 3. This probability is also low but it has an interesting pattern. While it stays rather flat until
1990, it exhibits many ups and downs after that. This indicates that our sample frequently uses the
self-employment option to exit unemployment. The transition probability from unemployment to
employment, however, exhibits sharp variations and a worrying pattern: the probability to go back
20
into paid employment from unemployment keeps decreasing over the years, alluding to the
increasing unemployment rates in Germany. Although there is significant entry and exit,
individuals in our sample tend to stay in unemployment rather than move to paid employment. In
fact, even during the booming years 1999-2000 this transition probability severely decreases.
The transition probabilities from self-employment to both unemployment and paid
employment are illustrated in Figure 4. These transitions show that there is considerable movement
between self-employment and paid employment, indicating that self-employment is an intermediate
state in the labor market. These transition probabilities hover around 0.08 in a zigzag, albeit
decreasing pattern. The transition probabilities from self-employment to unemployment remain low
and, in a way, they follow the ups and downs of the business cycle.
In Figures 5 - 7 we present the same transition probabilities for immigrants only, and in
Figures 8 - 10 those of the Germans for comparative purposes. Figures 5 and 8 clearly show that the
probabilities to move from paid employment to self-employment are very low and exhibit little
variation. In 1988, there were even no self-employment transitions for immigrants. The transitions
to self-employment are always somewhat higher for Germans than for immigrants throughout the
period of analysis. The probabilities to move from employment to unemployment are a lot higher,
and in the 1990s they increase to higher levels for the immigrants and become more varying for the
Germans. The observed rise in the transition probabilities is much stronger for the migrants. This
implies that the rise in the transitions from employment to unemployment is largely an issue of the
immigrants and not of the natives.
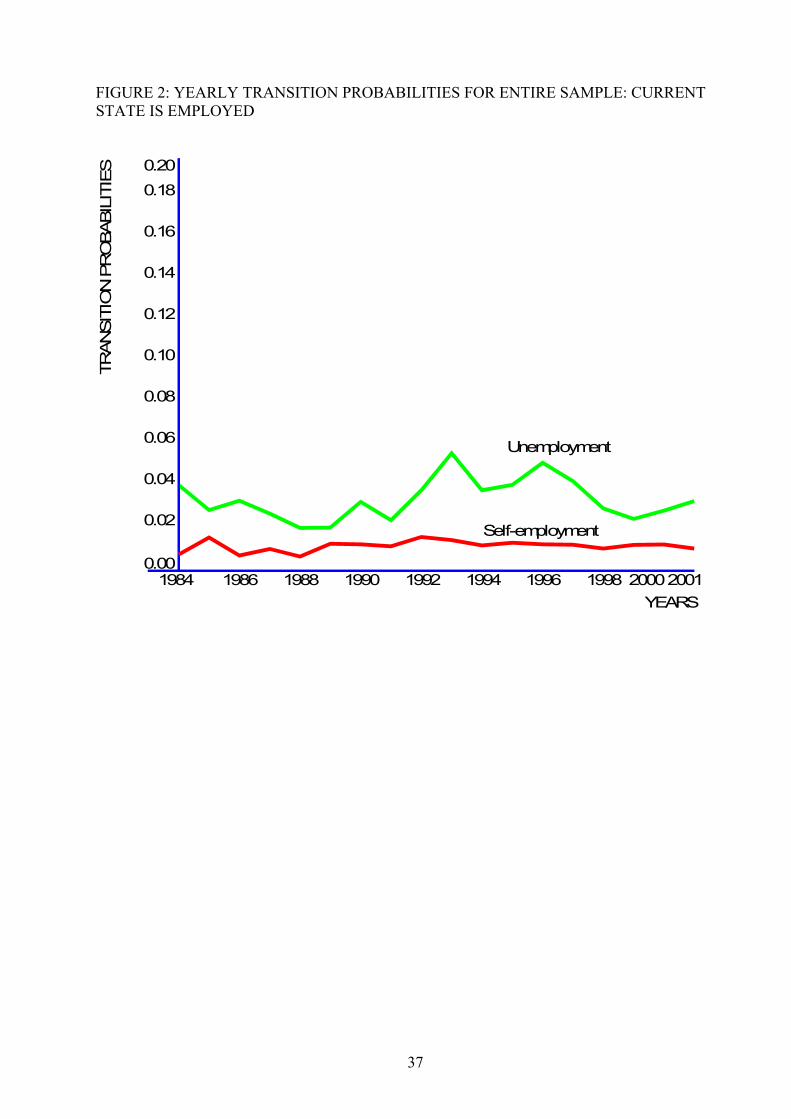
Figures 6 and 9 verify that, although there is some strong movement between
unemployment and employment, in the 1990s immigrants and Germans tend to enter employment
much less than in the 1980s. This tendency is even more marked for immigrants. With regards to
the transitions into self-employment, immigrants sometimes use self-employment as a way to
circumvent unemployment but do no stay in self-employment for long; a similar pattern can be
observed for the Germans, although at a higher level of activity. Figures 7 and 10 display the

21
transition probabilities from self-employment to both employment and unemployment. Once again,
there is pronounced entry and exit between self-employment and paid employment, although at a
very much higher level and amplitude for the immigrants than for the Germans. The intense zigzag
pattern shows that immigrants gladly exit self-employment to go into paid employment and stay for
longer periods in paid employment. While the zigzag pattern is also present in the native sample
(see Figure 10), the average size of the transition probability is much larger and the zigzag is much
more marked for the migrants than for the sample of the Germans. Overall, the transition
probabilities are, however, decreasing over the years. While the probabilities from self-employment
to unemployment are lower, Figures 7 and 10 show that there is movement between the two states
and immigrants fall into unemployment from self-employment more often than the Germans.
5. Econometric Results
The findings of our conditional logit models are presented in Table 5 for the employed, in Table 6
for the unemployed, and in Table 7 for the self-employed. The reference alternative in these
estimations is always the status of the individuals in the previous period. Hence, Table 5 contains
the results for the transitions from employment to unemployment and from employment to self-
employment, while the transition from employment to employment is the reference state. Table 6
provides the evidence of the transitions into employment and self-employment from the status of
being unemployed; staying unemployed is the reference state. The probabilities of moving from
self-employment to either employment or unemployment are presented in Table 7; staying in self-
employment from one period to the next is the reference state. All tables contain the parameter
estimates, the marginal effects, and the respective robust standard errors. The summary of our
findings below concentrates on those estimates that are statistically significant at conventional
levels. Further, note that the constants in the logit regressions represent the independent parts in the
transition probabilities. A negative coefficient suggests a small base transition probability, while a
positive coefficient represents a large base transition probability.

22
Age and age squared have a significant impact on most of the elements of the transition
matrix, and the findings are rather plausible. The inflow into unemployment from employment is
U-shaped, being high for lower and higher age levels, and increases with age out of employment
into self-employment, although at a declining rate. The outflow from unemployment into
employment or self-employment is increasing with age at a slowing speed. While older individuals
are more likely to move into employment or self-employment from unemployment, this increase
becomes smaller through time. However, the mobility from self-employment to employment is U-
shaped, implying that middle-age individuals are less likely to change from the self-employment
status to employment compared to the younger and older individuals. The transition from self-
employment into unemployment rises with age, although at a declining rate.
The impaired health status is significant only in the transitions from employment to
unemployment and back. Both cases show that men in Germany with some disability have a higher
probability to move into unemployment when they are working, and a lower probability to move
into employment when they are unemployed. This shows that men with disabilities are more likely
to become and remain unemployed. However, this does not affect the self-employment
probabilities.
Education in Germany exhibits only a rather limited impact on the transitions. Both
vocational training and higher education reduce the probability of moving out of employment and
into unemployment, a result that has been obtained often in similar ways in the literature.
Vocational training has also a positive impact on the probability to move back into employment
from the status of unemployment or self-employment. Finally, higher educated people are more
easily drawn into self-employment when they are unemployed.
Men who own their dwelling are less likely to move from employment to unemployment,
but are more likely to take up self-employment when they are unemployed. Family status and the
presence of young children are not of much relevance for the transitions. Being married reduces the
23
probability to become unemployed when previously employed, which is a well-known finding in
the literature.
Are entrepreneurial talents inherited? If the father has been self-employed, his son is more
likely than others to move into self-employment from a previous unemployment state. Likewise,
men with a self-employed father are more likely to make the transition from employment to self-
employment. These results indicate that intergenerational transmission provides a positive thrust
into self-employment, while it does not exert any influence in the exit from self-employment.
However, self-employed fathers also increase the probability to make the transition from
employment to unemployment.
Are immigrants different than natives? They are in many ways. Surprising, at least at first
sight, are the effects of education acquired in the home country: men with such an education are
more likely observed to move from employment to unemployment, and less likely to change from
unemployment to employment or self-employment. Education in the home country then indicates a
negative signal to the labor market. This is easily explained. Most of those immigrants educated in
their home countries came to Germany at the early stages of their career under the guestworker
regime. However, their particular education acquired is now no longer needed in the German labor
market. Hence, the negative signaling effect.
Compared to natives, Turks are more likely to move from employment to unemployment
when employed. They are also more likely to move from unemployment to self-employment when
unemployed. Once self-employed, Turks have an increased probability to switch to paid
employment, as they also have an enormously high probability to become unemployed. This
probably indicates that while Turks are trying to stay in the labor force through self-employment,
the success rate of their businesses is low. Other foreigner groups (EU and ex-Yugoslavs) are not
different than natives in their transitions from employment to unemployment or self-employment.
However, they are much more likely than natives to move into employment and especially self-
employment (except ex-Yugoslavs) when previously unemployed. The ex-Yugoslavs also change

24
more often from self-employment to employment than native Germans. Immigrants from other EU
countries move in a very strong way from self-employment to unemployment when compared to
natives. Hence, migrants take a significant part of the fluctuations observed between the various
employment states with Turks being hit the most, ex-Yugoslavs being in stable paid employment
end the EU migrants in between.
Years since immigration is of limited relevance, but nevertheless important. Migrants
escape from unemployment to move into self-employment the longer they have been in the country.
Furthermore, the relationship between years since immigration and a move from self-employment
into employment is also U-shaped: This implies that immigrants first start as self-employed, but
change soon into paid employment. Migrants with a longer stay in Germany first exhibit a decline
in the transition probability from self-employment to employment, which only rises again with
longer durations in the country.
The results further indicate that the employment state vector is moving considerably with
waves in the macro economy. Transitions from employment to unemployment are strongly reduced
in periods of high growth rates; in expansion periods the previously unemployed move strongly out
of unemployment into employment or self-employment; and a boom allows self-employed
individuals to move back into employment. Further, the increase in the movements from
unemployment to employment is substantially larger for immigrants than for natives during good
economic periods.
These findings are rather stable when the entire sample is split into the two subsamples of
the Germans and the immigrants, and the analysis is replicated. The respective estimates are
provided in the Appendix; there are hardly any marked differences when one compares Tables 5 - 7
to Tables 1A - 3A and Tables 1B - 3B. Simple χ2 - tests of sample separation suggest that the
parsimonious specifications in Tables 5 - 7 are not less powerful than the general specifications in
the Appendix. The interaction variable between GNP growth and the immigration dummy in Tables

25
5 - 7 mimic well the differences between immigrants and Germans in Tables 1A - 3A and Tables
1B - 3B respectively.
The few differences between both subgroups that are not evident from Tables 5 - 7 are:
Being married and having vocational training have a stronger moderating effect on the transition
from employment to unemployment for the Germans in comparison to the immigrants. Immigrants
with a self-employed father exhibit a larger transition probability from employment to
unemployment and self-employment than Germans. Children are also a deterrent to move to self-
employment from employment for immigrant men. The mobility from unemployment to self-
employment is positive and significant for those German men who's father is self-employed (and
negative and significant for disabled individuals), but these regressors are insignificant for the
immigrants. Once again, immigrant men with children are less likely to go into self-employment
from the unemployment state.
6. Summary and Conclusions
In this paper we use a unique data set constructed from 19 waves of the German Socio-economic
Panel to study transitions between the states of employment, unemployment and self-employment.
Unlike other studies, we provide a link between these transitions and the business cycle, as
measured by the GNP growth rates. We find that a Markovian modeling framework suits the data
well, and allows us to investigate the labor market dynamics. The transition probabilities are found
to be explained well by individual determinants like age, education, home ownership, family
characteristics, the self-employment status of the father, various measures to capture differences
between migrants and the natives and the business cycle. Self-employment is identified to be an
important channel to escape unemployment, and this is a relevant and applicable strategy especially
for migrants. However, the outflow out of unemployment is more marked the stronger the economy
grows. At the same time, there is a strong permanent outflow of people from self-employment into
paid employment. Here, migrants have a larger transition probability than natives. Finally, the

26
process to move from self-employment to employment is fueled by economic growth, suggesting
counter cyclical patterns. The self-employment probabilities of immigrants are rather a function of
non cyclical factors such as technological changes and increasing out-sourcing options.

27
REFERENCES
Aronson, Robert L., "Self-Employment: a Labor Market Perspective," Cornell University Press.
Cornell Studies in Industrial and Labor Relations 24 (1991). Audretsch, David B., "Entrepreneurship: A Survey of the Literature," Paper prepared for the
European Commission. Enterprise Directorate, mimeo, (2002). Audretsch, David B., Roy Thurik, Ingrid Verheul, and Sander Wennekers, Entrepreneurship:
Determinants and Policy in a European-U.S. Comparison (Boston: Kluwer Academic Publishers, 2002).
Blanchflower, David G., "Self-Employment: More May not be Better," National Bureau of
Economic Research. NBER Working Paper No. 10286 (2004). Blanchflower, David G., Andrew Oswald, and Alois Stutzer, "Latent Entrepreneurship Across
Nations," European Economic Review 45 (2001), 680-691. Blume, Kræn, Mette Ejrnæs, Helena Skyt Nielsen, and Allan Würtz, "Self-Employment among
Immigrants: A Last Resort?" University of Aarhus. Department of Economics. Working Paper No. 2003-13 (2003).
Borjas, George J., (1986) “The Self-Employment Experience of Immigrants,” The Journal of
Human Resources, 21, No. 4, 485-506. Carrasco, Raquel, "Transitions to and from Self-Employment in Spain: An Empirical Analysis,"
Oxford Bulletin of Economics and Statistics 61 (1999), No. 3, 315-341. Clark, Kenneth, and Stephen Drinkwater, "Ethnicity and Self-Employment in Britain," Oxford
Bulletin of Economics and Statistics 60 (1998), No. 3, 383-407. Constant, Amelie, and Klaus F. Zimmermann, "The Dynamics of Repeat Migration: A Markov
Chain Analysis," Institute for the Study of Labor. IZA Discussion Paper No. 885, (2003). Constant, Amelie, and Marie Louise Schultz-Nielsen, “Immigrant Self-employment and Economic
Performance,” in Migrants, Work, and the Welfare State, T. Tranæs and K.F. Zimmermann, editors, (Odense: University Press of Southern Denmark 2004), 213-243.
Constant, Amelie, Yochanan Shachmurove, and Klaus F. Zimmermann, "What Makes an
Entrepreneur and Does It Pay? Native Men, Turks, and Other Migrants in Germany," Institute for the Study of Labor. IZA Discussion Paper No. 940, (2003).
Dunn, Thomas, and Holtz-Eakin, Douglas, “Financial Capital, Human Capital, and the Transition to
Self-Employment: Evidence from Intergenerational Links,” Journal of Labor Economics, 18, (2000), No. 2, 282-305.
Evans David S., and Linda S. Leighton, “Some Empirical Aspects of Entrepreneurship,” The
American Economic Review, 79, (1989), No. 3, 519-535. Fairlie, Robert W., "The Absence of the African-American Owned Business: An Analysis of the
Dynamics of Self-Employment," Journal of Labor Economics 17 (1999), No. 1, 80-108.

28
Fairlie, Robert W., and Bruce D. Meyer, "Ethnic and Racial Self-employment Differences and
Possible Explanations," Journal of Human Resources 31 (1996), No. 4, 757-793. Flinn, Christopher J., and James J. Heckman, “Models for the Analysis of Labor Force Dynamics,”
in Advances in Econometrics, Rhodes, G., and Basmenn, R., editors (1982), JAI Press, London CT.
Le, Anh T., "Empirical Studies of Self-Employment," Journal of Economic Surveys 13 (1999), 381-
416. Moore, Carol, and Richard E. Mueller, "The Transition into Self-Employment in Canada: The
Importance of Involuntary Separation and Unemployment Duration," Applied Economics 34 (2002), No. 6, 791-801.
Papoulis, Athanasios, Probability, Random Variables, and Stochastic Processes, (New York: McGraw-Hill, 1984). Robson, Martin T., "The Rise in Self-Employment Amongst UK Males," Small Business Economics 10 (1998), 199-212. Sachverständigenrat, Staatsfinanzen konsolidieren - Steuersystem reformieren, (Berlin:
Heenemann, 2003). Soep Group, The German Socio-Economic Panel (GSOEP) after more than 15 years - Overview.
In: Elke Host, Dean R. Lillard, and Thomas A DiPrete (eds): Proceedings of the 2000 Fourth International Conferences of German Socio-Economic Panel Study Users (GSOEP2000), Vierteljahrshefte zur Wirtschaftsforschung 70 (2001), No. 1, 7-14.

29
TABLE 1: YEARLY OBSERVATIONS BY ETHNICITY
Wave Year Germans Immigrants Entire Sample 1 1984 2997 1558 4555 2 1985 2796 1325 4121 3 1986 2673 1292 3965 4 1987 2598 1291 3889 5 1988 2440 1195 3635 6 1989 2365 1157 3522 7 1990 2294 1172 3466 8 1991 2304 1120 3424 9 1992 2230 1136 3366
10 1993 2221 1109 3330 11 1994 2181 1055 3236 12 1995 2170 975 3145 13 1996 2154 930 3084 14 1997 2101 909 3010 15 1998 2021 836 2857 16 1999 1971 781 2752 17 2000 1883 728 2611 18 2001 1790 670 2460 19 2002 1732 620 2352 All 19 Waves (Individuals) 5190 2462 7652 Person Year Observations 42921 19859 62780
Source: Own Calculations from GSOEP 1984-2002

30
TABLE 2: SELECTED MEAN CHARACTERISTICS BY EMPLOYMENT STATE
Characteristics Employed Unemployed Self-Employed
Entire
Sample Immi-grants
Ger-mans
Entire
Sample Immi-grants
Ger-mans
Entire
Sample Immi-grants
Ger-mans
Age 38.925 38.566 39.095 39.868 40.036 39.731 41.714 39.419 42.167
Years since Migration1 - 20.598 - - 21.552 - - 22.934 -
No Schooling Degree in Germany 0.088 0.228 0.022 0.146 0.260 0.052 0.041 0.181 0.014
Primary/ Secondary School in Germany 0.464 0.231 0.564 0.492 0.236 0.701 0.422 0.247 0.456
High School and beyond in Germany 0.451 0.543 0.408 0.366 0.506 0.252 0.539 0.576 0.531
Vocational Training in Germany 0.671 0.431 0.784 0.520 0.331 0.675 0.683 0.452 0.728
Schooling in Home Country1 - 0.503 - - 0.476 - - 0.503 -
Vocational Training in Home Country1 - 0.301 - - 0.253 - - 0.353 -
Disability 0.063 0.046 0.071 0.150 0.078 0.177 0.043 0.026 0.046
Home Ownership 0.375 0.125 0.493 0.220 0.078 0.337 0.568 0.246 0.632
Married 0.739 0.808 0.707 0.631 0.741 0.542 0.764 0.820 0.753
Children <16 in Household 0.490 0.593 0.441 0.425 0.531 0.337 0.476 0.518 0.468
German 0.679 - 1.00 0.550 - 1.00 0.835 - 1.00
Turk 0.115 0.360 - 0.242 0.538 - 0.041 0.250 -
Ex-Yugoslav 0.065 0.202 - 0.072 0.159 - 0.030 0.180 -
EU 0.141 0.439 - 0.136 0.302 - 0.094 0.570 -
Number of Observations 40,162 12,890 27,272 3,180 1,430 1,750 4,619 761 3,858 1Based on immigrant observations only.
Note: these statistics are not weighted

31
TABLE 3.1: CALCULATED TRANSITION PROBABILITIES MATRIX: ENTIRE SAMPLE
State (t+1)
State (t) Employment Unemployment Self-employment
Employment 0.9555 0.0331 0.0114
Unemployment 0.3286 0.6469 0.0245
Self-employment 0.0706 0.0089 0.9206
Probabilities calculated from raw data, GSOEP 1984-2002
TABLE 3.2: CALCULATED TRANSITION PROBABILITIES MATRIX; IMMIGRANTS
State (t+1)
State (t) Employment Unemployment Self-employment
Employment 0.9460 0.0458 0.0082
Unemployment 0.3203 0.6664 0.0133
Self-employment 0.0958 0.0210 0.8832
Probabilities calculated from raw data, GSOEP 1984-2002
TABLE 3.3: CALCULATED TRANSITION PROBABILITIES MATRIX; GERMANS
State (t+1)
State (t) Employment Unemployment Self-employment
Employment 0.95996 0.0271 0.0129
Unemployment 0.3354 0.6309 0.0337
Self-employment 0.0656 0.0065 0.9279
Probabilities calculated from raw data, GSOEP 1984-2002

32
TABLE 4: PEARSON CORRELATION COEFFICIENTS
GNP P01 P02 P10 P12 P20 P21
GNP 1.00000 -0.38777 -0.00754 0.55530 0.18125 0.42447 -0.09621
GNP 1.00000 -0.47858 -0.07517 0.38641 0.35681 0.36716 -0.12551
P01 -0.22695 1.00000 0.60353 0.34152 0.14490 0.30775 0.29207
P02 0.18943 0.40892 1.00000 0.66261 0.26765 0.38033 0.11447
P10 0.61009 0.02692 0.19147 1.00000 0.24126 0.71724 0.05015
P12 -0.24981 0.37974 0.31085 -0.17529 1.00000 0.33850 -0.18625
P20 0.27511 0.09023 -0.19708 0.59638 -0.24379 1.00000 -0.04050
P21 -0.00678 0.10622 -0.19222 0.25742 -0.29328 0.63760 1.00000
The first row pertains to the entire sample. The upper triangle pertains to the German sample. The lower triangle pertains to the immigrant sample. Note: P01 is the transition from employment to unemployment P02 is the transition from employment to self-employment P10 is the transition from unemployment to employment P12 is the transition from unemployment to self-employment P20 is the transition from self-employment to employment P21 is the transition from self-employment to unemployment

33
TABLE 5: MULTINOMIAL LOGIT RESULTS ON THE EMPLOYED: ENTIRE SAMPLE
Transition from Employment to Unemployment
Transition from Employment to Self-Employment
Variables Coefficients (Standard Error)
Marginal Effects (Standard Error)
Coefficients (Standard Error)
Marginal Effects (Standard Error)
1.687* 0.045* -5.394* -0.054* Constant (0.418) (0.011) (0.811) (0.008)
-0.233* -0.006* 0.064 0.001 Age (0.022) (0.001) (0.040) (0.0004)
0.003* 0.0001* -0.001 -0.00001* Age2 (0.0002) (0.695E-05) (0.001) (0.505E-05)
0.529* 0.014* 0.104 0.001 Disability (0.098) (0.003) (0.219) (0.002) -0.212 -0.006 0.153 0.002 Primary/ Secondary
School in Germany (0.115) (0.003) (0.267) (0.003)
-0.758* -0.020* 0.378 0.004 High School and higher in Germany (0.127) (0.003) (0.276) (0.003)
-0.205* -0.005* 0.113 0.001 Vocational Training in Germany (0.069) (0.002) (0.116) (0.001)
-0.015 -0.0003 -0.267 -0.003 Vocational Training in Home Country (0.113) (0.003) (0.268) (0.003)
0.437* 0.011* -0.234 -0.002 Schooling in Home Country (0.124) (0.003) (0.254) (0.002) Home Ownership -0.473* -0.012* 0.110 0.001 (0.071) (0.002) (0.102) (0.001)
Married -0.468* -0.012* 0.045 0.001 (0.079) (0.002) (0.128) (0.001)
0.006 0.0002 -0.192 -0.002 Children <16 in Household (0.067) (0.002) (0.114) (0.001)
0.297* 0.007* 1.065* 0.010* Father is self-employed (0.108) (0.003) (0.120) (0.001)
Years since Migration -0.009 -0.0002 -0.021 -0.0002 (0.013) (0.0004) (0.026) (0.0003)
Years since Migration2 0.0001 0.507E-05 0.0003 0.327E-05 (0.0002) (0.768E-05) (0.001) (0.625E-05)
Turk 0.428* 0.011* 0.066 0.001 (0.197) (0.005) (0.374) (0.004)
Ex-Yugoslav 0.195 0.005 0.260 0.003 (0.215) (0.006) (0.412) (0.004)
EU -0.093 -0.002 0.218 0.002 (0.207) (0.005) (0.377) (0.004)
GNP -12.304* -0.320* -1.910 -0.016 (2.005) (0.052) (3.204) (0.032)
5.693 0.147 5.460 0.052 GNP*Ethnicity Interaction (3.163) (0.082) (6.666) (0.066)
LogLikelihood -7945.912 χ2 768.098 Number of Obs. 40,162 *p < 0.05. two-sided test Note: Reference category is stay in employment; standard errors are robust standard errors E+nn or E-nn means multiply by 10 to + or –nn power

34
TABLE 6: MULTINOMIAL LOGIT RESULTS ON THE UNEMPLOYED: ENTIRE SAMPLE
Transition from Unemployment to Employment
Transition from Unemployment to Self-Employment
Variables Coefficients (Standard Error)
Marginal Effects (Standard Error)
Coefficients (Standard Error)
Marginal Effects (Standard Error)
-1.685* -0.293* -13.802* -0.172* Constant (0.534) (0.108) (2.307) (0.028)
0.103* 0.019* 0.567* 0.007* Age (0.028) (0.006) (0.120) (0.001)
-0.002* -0.0004* -0.008* -0.0001* Age2 (0.0004) (0.0001) (0.002) (0.00002)
-0.854* -0.172* -0.769 -0.007 Disability (0.147) (0.029) (0.402) (0.005) -0.203 -0.043 0.485 0.007 Primary/ Secondary
School in Germany (0.151) (0.031) (0.598) (0.008)
-0.011 -0.008 1.518* 0.020* High School and higher in Germany (0.167) (0.034) (0.623) (0.008)
0.558* 0.113* 0.321 0.002 Vocational Training in Germany (0.099) (0.020) (0.269) (0.003)
-0.141 -0.029 0.030 0.001 Vocational Training in Home Country (0.182) (0.037) (0.724) (0.009)
-0.589* -0.114* -1.722* -0.020* Schooling in Home Country (0.181) (0.037) (0.770) (0.010)
0.009 -0.001 0.618* 0.008* Home Ownership (0.114) (0.023) (0.269) (0.003)
0.057 0.010 0.332 0.004 Married (0.110) (0.022) (0.309) (0.004)
-0.011 -0.001 -0.460 -0.006 Children <16 in Household (0.099) (0.020) (0.292) (0.004)
-0.061 -0.015 0.645* 0.009* Father is self-employed (0.173) (0.035) (0.328) (0.004)
Years since Migration -0.043 -0.009 -0.082* -0.001 (0.025) (0.005) (0.038) (0.001)
Years since Migration2 0.00001 -0.206E-05 0.001 0.00002 (0.001) (0.0001) (0.001) (0.00001)
0.474 0.091 1.529* 0.018* Turk (0.290) (0.059) (0.663) (0.009)
1.345* 0.269* 1.475 0.014 Ex-Yugoslav (0.332) (0.067) (0.930) (0.012)
1.064* 0.211* 1.791* 0.019 EU (0.310) (0.063) (0.830) (0.010)
14.134* 2.815* 19.834* 0.203 GNP (3.604) (0.731) (9.825) (0.127)
12.948* 2.720* -19.316 -0.298 GNP*Ethnicity Interaction (5.585) (1.135) (17.674) (0.229)
LogLikelihood -1994.322 χ2 707.872 Number of Obs. 3,180 *p < 0.05. two-sided test Note: Reference category is stay in unemployment; standard errors are robust standard errors E+nn or E-nn means multiply by 10 to + or –nn power

35
TABLE 7: MULTINOMIAL LOGIT RESULTS ON THE SELF-EMPLOYED: ENTIRE
SAMPLE
Transition from Self-Employment to Employment
Transition from Self-Employment to Unemployment
Variables Coefficients (Standard Error)
Marginal Effects (Standard Error)
Coefficients (Standard Error)
Marginal Effects (Standard Error)
2.466* 0.145* -14.153* -0.086* Constant
(0.974) (0.055) (4.702) (0.029)
-0.221* -0.013* 0.395* 0.002* Age (0.048) (0.003) (0.201) (0.001)
0.002* 0.0001* -0.004* -0.00003* Age2 (0.001) (0.00003) (0.002) (0.00001)
-0.696 -0.040 0.869 0.005 Disability (0.422) (0.024) (0.549) (0.003) 0.061 0.003 1.293 0.008 Primary/ Secondary
School in Germany (0.336) (0.019) (1.121) (0.007)
-0.152 -0.009 1.359 0.008 High School and higher in Germany (0.336) (0.019) (1.119) (0.007)
0.337* 0.019* -0.137 -0.001 Vocational Training in Germany (0.148) (0.008) (0.393) (0.002)
0.060 0.004 -0.805 -0.005 Vocational Training in Home Country (0.333) (0.019) (0.719) (0.004)
0.140 0.008 -0.814 -0.005 Schooling in Home Country (0.321) (0.018) (0.624) (0.004)
-0.259 -0.014 -0.681 -0.004 Home Ownership (0.138) (0.008) (0.383) (0.002)
-0.261 -0.015 0.276 0.002 Married (0.165) (0.009) (0.493) (0.003)
0.050 0.003 -0.289 -0.002 Children <16 in Household (0.144) (0.008) (0.377) (0.002)
-0.114 -0.006 -0.617 -0.004 Father is self-employed (0.138) (0.008) (0.455) (0.003)
Years since Migration -0.096* -0.005* 0.049 0.0003 (0.037) (0.002) (0.050) (0.0003) Years since Migration2 0.002* 0.0001* -0.002 -0.00002 (0.001) (0.00005) (0.002) (0.00001)
1.031* 0.058* 2.239* 0.013* Turk (0.523) (0.029) (0.723) (0.005)
1.244* 0.070* 1.001 0.006 Ex-Yugoslav (0.570) (0.032) (1.234) (0.007)
0.908 0.051 1.791* 0.010* EU (0.535) (0.030) (0.722) (0.004)
7.859* 0.447* -3.610 -0.025 GNP (3.743) (0.213) (8.847) (0.054)
7.431 0.419 7.972 0.045 GNP*Ethnicity Interaction (8.831) (0.501) (16.550) (0.101)
LogLikelihood -1325.053 χ2 169.804 Number of Obs. 4,619 *p < 0.05. two-sided test Note: Reference category is stay in self-employment; standard errors are robust standard errors E+nn or E-nn means multiply by 10 to + or –nn power

36
FIGURE 1: GNP AND SELF-EMPLOYMENT GROWTH RATES; AGGREGATE LEVELS
20031983 1985 1987 1989 1991 1993 1995 1997 1999 2001
0.06
-0.04
-0.03
-0.02
-0.01
-0.00
0.01
0.02
0.03
0.04
0.05
self-employmentself-employment
GNP
GNP
YEARS
GRO
WTH
RATE
S
37
FIGURE 2: YEARLY TRANSITION PROBABILITIES FOR ENTIRE SAMPLE: CURRENT STATE IS EMPLOYED
20011984 1986 1988 1990 1992 1994 1996 1998 2000
0.20
0.00
0.02
0.04
0.06
0.08
0.10
0.12
0.14
0.16
0.18
Unemployment
Self-employment
YEARS
TRANSIT
ION P
RO
BABI
LITI
ES

38
FIGURE 3: YEARLY TRANSITION PROBABILITIES FOR ENTIRE SAMPLE: CURRENT STATE IS UNEMPLOYED
20011984 1986 1988 1990 1992 1994 1996 1998 2000
0.50
0.00
0.05
0.10
0.15
0.20
0.25
0.30
0.35
0.40
0.45
TRANSIT
ION P
RO
B ABI
LITI
ES
YEARS
Self-employment
Employment

39
FIGURE 4: YEARLY TRANSITION PROBABILITIES FOR ENTIRE SAMPLE: CURRENT STATE IS SELF-EMPLOYED
20011984 1986 1988 1990 1992 1994 1996 1998
0.20
0.00
0.02
0.04
0.06
0.08
0.10
0.12
0.14
0.16
0.18
TRANSIT
ION P
RO
BABI
LITI
ES
YEARS
Employment
Unemployment
2000

40
FIGURE 5: YEARLY TRANSITION PROBABILITIES FOR IMMIGRANTS: CURRENT STATE IS EMPLOYED
20011984 1986 1988 1990 1992 1994 1996 1998 2000
0.20
0.00
0.02
0.04
0.06
0.08
0.10
0.12
0.14
0.16
0.18
TRANSIT
I ON P
RO
BAB I
LITI
ES
YEARS
Unemployment
Self-employment

41
FIGURE 6: YEARLY TRANSITION PROBABILITIES FOR IMMIGRANTS: CURRENT STATE IS UNEMPLOYED
20011984 1986 1988 1990 1992 1994 1996 1998 2000
0.50
0.00
0.05
0.10
0.15
0.20
0.25
0.30
0.35
0.40
0.45
TRANSIT
I ON
PRO
BABIL
ITIE
S
YEARS
Self-employment
Employment

42
FIGURE 7: YEARLY TRANSITION PROBABILITIES FOR IMMIGRANTS: CURRENT STATE IS SELF-EMPLOYED
20011984 1986 1988 1990 1992 1994 1996 1998 2000
0.20
0.00
0.02
0.04
0.06
0.08
0.10
0.12
0.14
0.16
0.18
TRANSIT
I ON P
RO
BAB I
LITI
ES
YEARS
Employment
Unemployment

43
FIGURE 8: YEARLY TRANSITION PROBABILITIES FOR GERMANS: CURRENT STATE IS EMPLOYED
20011984 1986 1988 1990 1992 1994 1996 1998 2000
0.20
0.00
0.02
0.04
0.06
0.08
0.10
0.12
0.14
0.16
0.18
TRANSI
TIO
N P
RO
BAB I
LITI
ES
Unemployment
Self-employment
YEARS
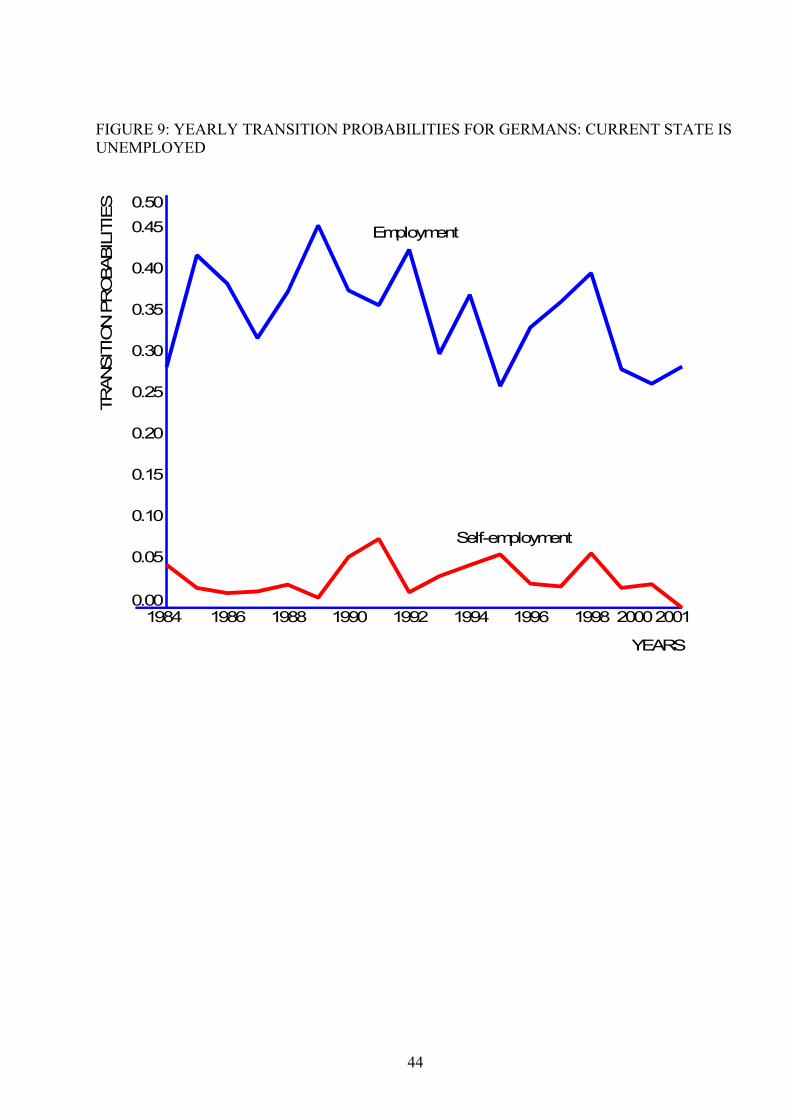
44
FIGURE 9: YEARLY TRANSITION PROBABILITIES FOR GERMANS: CURRENT STATE IS UNEMPLOYED
20011984 1986 1988 1990 1992 1994 1996 1998 2000
0.50
0.00
0.05
0.10
0.15
0.20
0.25
0.30
0.35
0.40
0.45
TRANSIT
ION P
RO
BABIL
ITIE
S
Employment
Self-employment
YEARS

45
FIGURE 10: YEARLY TRANSITION PROBABILITIES FOR GERMANS: CURRENT STATE IS SELF-EMPLOYED
20011984 1986 1988 1990 1992 1994 1996 1998 2000
0.20
0.00
0.02
0.04
0.06
0.08
0.10
0.12
0.14
0.16
0.18
TRANSI T
ION P
RO
BABI
LITI
E S
Unemployment
Employment
YEARS

46
APPENDIX
TABLE 1A: MULTINOMIAL LOGIT RESULTS ON THE EMPLOYED: IMMIGRANTS
Transition from Employment to Unemployment
Transition from Employment to Self-Employment
Variables Coefficients (Standard Error)
Marginal Effects (Standard Error)
Coefficients (Standard Error)
Marginal Effects (Standard Error)
2.601* 0.101* -5.642* -0.040* Constant (0.550) (0.020) (1.579) (0.011)
-0.254* -0.010* 0.054 0.0005 Age (0.033) (0.001) (0.094) (0.001)
0.003* 0.0001* -0.001 -0.00001 Age2 (0.0004) (0.00002) (0.001) (0.00001)
0.471* 0.018* 0.100 0.001 Disability (0.174) (0.007) (0.549) (0.004) -0.453* -0.017* 0.418 0.003 Primary/ Secondary
School in Germany (0.172) (0.007) (0.369) (0.003)
-0.392* -0.015* 0.247 0.002 High School and higher in Germany (0.193) (0.007) (0.455) (0.003)
-0.192 -0.007 -0.068 -0.0004 Vocational Training in Germany (0.107) (0.004) (0.243) (0.002)
-0.0003 0.00002 -0.110 -0.001 Vocational Training in Home Country (0.123) (0.005) (0.316) (0.002)
0.123 0.005 -0.015 -0.0001 Schooling in Home Country (0.173) (0.007) (0.398) (0.003)
-0.453* -0.017* -0.484 -0.003 Home Ownership (0.160) (0.006) (0.344) (0.002) -0.199 -0.008 0.480 0.003 Married (0.127) (0.005) (0.279) (0.002) -0.143 -0.005 -0.437* -0.003* Children <16 in
Household (0.097) (0.004) (0.219) (0.002) 0.913* 0.034* 1.684* 0.012* Father is self-employed (0.298) (0.011) (0.443) (0.003)
Years since Migration -0.008 -0.0003 0.010 0.0001 (0.018) (0.001) (0.039) (0.0003) Years since Migration2 0.0003 0.00001 0.0001 0.333E-06 (0.0003) (0.00001) (0.001) (0.00001)
-0.269* -0.010* 0.233 0.002 Ex-Yugoslav (0.131) (0.005) (0.323) (0.002) -0.546* -0.021* 0.173 0.001 EU (0.109) (0.004) (0.247) (0.002) -6.168* -0.237* 3.963 0.030 GNP (2.464) (0.094) (5.816) (0.041)
LogLikelihood -2891.697 χ2 236.793 Number of Obs. 12,890 *p < 0.05. two-sided test Note: Reference category is stay in employment; standard errors are robust standard errors E+nn or E-nn means multiply by 10 to + or –nn power

47
TABLE 2A: MULTINOMIAL LOGIT RESULTS ON THE UNEMPLOYED: IMMIGRANTS
Transition from Unemployment to Employment
Transition from Unemployment to Self-Employment
Variables Coefficients (Standard Error)
Marginal Effects (Standard Error)
Coefficients (Standard Error)
Marginal Effects (Standard Error)
-1.175 -0.207 -20.075* -0.066 Constant (0.789) (0.150) (4.011) (0.035)
0.106* 0.019* 1.004* 0.003* Age (0.047) (0.009) (0.246) (0.002)
-0.002* -0.0004* -0.014* -0.00005* Age2 (0.001) (0.0001) (0.003) (0.00002)
-0.930* -0.178* -0.040 0.001 Disability (0.281) (0.053) (0.708) (0.002) -0.314 -0.060 -0.081 0.000001 Primary/ Secondary
School in Germany (0.228) (0.043) (0.756) (0.003)
0.120 0.024 -0.693 -0.002 High School and higher in Germany (0.269) (0.051) (1.039) (0.003)
0.390* 0.074* 0.757 0.002 Vocational Training in Germany (0.164) (0.031) (0.500) (0.002)
-0.030 -0.006 0.016 0.00008 Vocational Training in Home Country (0.207) (0.039) (0.770) (0.003)
-0.686* -0.131* 0.111 0.001 Schooling in Home Country (0.262) (0.050) (1.087) (0.004)
0.249 0.047 1.085 0.003 Home Ownership (0.269) (0.051) (0.704) (0.003)
0.042 0.007 0.895 0.003 Married (0.195) (0.037) (0.697) (0.003)
-0.093 -0.017 -1.327* -0.004 Children <16 in Household (0.155) (0.030) (0.551) (0.003)
0.514 0.098 0.311 0.001 Father is self-employed (0.549) (0.105) (1.336) (0.005)
-0.032 -0.006 -0.021 -0.00004 Years since Migration (0.033) (0.006) (0.096) (0.0003)
-0.0002 -0.00004 0.001 0.000003 Years since Migration2 (0.001) (0.0002) (0.002) (0.00001)
0.854* 0.164* -0.199 -0.001 Ex-Yugoslav (0.195) (0.037) (0.965) (0.003)
0.576* 0.110* 0.329 0.001 EU (0.154) (0.029) (0.542) (0.002)
27.939* 5.343* 2.643 -0.015 GNP (4.376) (0.829) (15.421) (0.051)
LogLikelihood -794.505 χ2 393.465 Number of Obs. 1,430 *p < 0.05. two-sided test Note: Reference category is stay in unemployment; standard errors are robust standard errors E+nn or E-nn means multiply by 10 to + or –nn power

48
TABLE 3A: MULTINOMIAL LOGIT RESULTS ON THE SELF-EMPLOYED: IMMIGRANTS
Transition from Self-Employment to Employment
Transition from Self-Employment to Unemployment
Variables Coefficients (Standard Error)
Marginal Effects (Standard Error)
Coefficients (Standard Error)
Marginal Effects (Standard Error)
3.944* 0.317* -9.761 -0.116 Constant
(2.005) (0.152) (5.723) (0.072)
-0.269* -0.021* 0.078 0.001 Age (0.114) (0.009) (0.248) (0.003)
0.003* 0.0002* -0.0003 -0.00001 Age2 (0.001) (0.0001) (0.003) (0.00003)
0.118 0.009 0.212 0.002 Primary/ Secondary School in Germany (0.473) (0.037) (0.991) (0.012)
0.136 0.010 0.895 0.010 High School and higher in Germany (0.559) (0.044) (0.969) (0.012)
0.307 0.024 0.068 0.0005 Vocational Training in Germany (0.321) (0.025) (0.753) (0.009)
0.070 0.007 -1.195 -0.014 Vocational Training in Home Country (0.395) (0.031) (0.738) (0.009)
-0.027 -0.001 -0.886 -0.010 Schooling in Home Country (0.536) (0.042) (0.810) (0.010)
-0.251 -0.019 -0.679 -0.008 Home Ownership (0.348) (0.027) (0.829) (0.010)
0.276 0.021 0.053 0.0003 Married (0.425) (0.033) (1.197) (0.014)
-0.021 -0.002 0.400 0.005 Children <16 in Household (0.288) (0.022) (0.710) (0.008)
-0.094* -0.008* 0.416 0.005* Years since Migration (0.049) (0.004) (0.236) (0.002)
0.002* 0.0002* -0.010 -0.0001* Years since Migration2 (0.001) (0.0001) (0.006) (0.0001)
0.213 0.018 -1.172 -0.014 Ex-Yugoslav (0.430) (0.034) (1.076) (0.012)
-0.098 -0.007 -0.401 -0.005 EU (0.343) (0.027) (0.708) (0.008)
15.178 1.181 2.606 0.015 GNP (8.171) (0.633) (13.759) (0.158)
LogLikelihood -298.395 χ2 45.023 Number of Obs. 761 *p < 0.05. two-sided test Note: Reference category is stay in self-employment; standard errors are robust standard errors E+nn or E-nn means multiply by 10 to + or –nn power The variables disability and Father self-employed are omitted from the calculation

49
TABLE 1B: MULTINOMIAL LOGIT RESULTS ON THE EMPLOYED: GERMANS
Transition from Employment to Unemployment
Transition from Employment to Self-employment
Variables Coefficients (Standard Error)
Marginal Effects (Standard Error)
Coefficients (Standard Error)
Marginal Effects (Standard Error)
1.715* 0.037* -5.237* -0.059* Constant
(0.544) (0.011) (0.894) (0.010) -0.233* -0.005* 0.0654 0.001 Age (0.029) (0.001) (0.045) (0.001) 0.003* 0.00007* -0.001* -0.00001* Age2
(0.0004) (0.00001) (0.001) (0.00001) 0.527* 0.011* 0.0929 0.001 Disability (0.120) (0.003) (0.238) (0.003) -0.249 -0.005 -0.205 -0.002 Primary/ Secondary
School in Germany (0.209) (0.004) (0.399) (0.004) -0.975* -0.021* 0.104 0.001 High School and
higher in Germany (0.214) (0.004) (0.398) (0.004) -0.248* -0.005* 0.185 0.002 Vocational Training (0.092) (0.002) (0.135) (0.002) -0.499* -0.011* 0.179 0.002 Home Ownership (0.079) (0.002) (0.112) (0.001) -0.654* -0.014* -0.075 -0.001 Married (0.102) (0.002) (0.147) (0.002) 0.169 0.004 -0.099 -0.001 Children <16 in
Household (0.090) (0.002) (0.133) (0.001) 0.226 0.004 1.013* 0.011* Father is self-employed
(0.116) (0.002) (0.123) (0.001) -12.424* -0.261* -1.662 -0.016 GNP (2.015) (0.042) (3.221) (0.036)
LogLikelihood -5027.947 χ2 477.350 Number of Obs. 27,272 *p < 0.05. two-sided test Note: Reference category is stay in employment; standard errors are robust standard errors

50
TABLE 2B: MULTINOMIAL LOGIT RESULTS ON THE UNEMPLOYED: GERMANS
Transition from Unemployment to Employment
Transition from Unemployment to Self-employment
Variables Coefficients (Standard Error)
Marginal Effects (Standard Error)
Coefficients (Standard Error)
Marginal Effects (Standard Error)
-1.608* -0.265 -12.440* -0.242* Constant
(0.679) (0.145) (2.887) (0.046) 0.093* 0.017* 0.436* 0.008* Age (0.037) (0.008) (0.125) (0.002) -0.002* -0.0004* -0.006* -0.0001* Age2 (0.0005) (0.0001) (0.002) (0.00003) -0.822* -0.170* -0.929* -0.014 Disability (0.172) (0.036) (0.472) (0.010) -0.190 -0.049 1.329 0.028 Primary/ Secondary
School in Germany (0.248) (0.054) (1.455) (0.028) -0.082 -0.034 2.572 0.053 High School and
higher in Germany (0.260) (0.056) (1.450) (0.027) 0.650* 0.138* 0.217 0.0002 Vocational Training (0.125) (0.027) (0.294) (0.006) -0.019 -0.007 0.508 0.010 Home Ownership (0.125) (0.027) (0.279) (0.005) 0.035 0.007 0.119 0.002 Married
(0.134) (0.029) (0.364) (0.007) 0.078 0.018 -0.113 -0.003 Children <16 in
Household (0.131) (0.028) (0.342) (0.007) -0.112 -0.029 0.702* 0.015* Father is self-employed (0.186) (0.039) (0.339) (0.007) 13.482* 2.771* 19.223* 0.303 GNP (3.581) (0.760) (9.706) (0.194)
LogLikelihood -1193.024 χ2 312.682 Number of Obs. 1,750 *p < 0.05. two-sided test Note: Reference category is stay in unemployment; standard errors are robust standard errors
51
TABLE 3B: MULTINOMIAL LOGIT RESULTS ON THE SELF-EMPLOYED: GERMANS
Transition from Self-Employment to Employment
Transition from Self-Employment to Unemployment
Variables Coefficients (Standard Error)
Marginal Effects (Standard Error)
Coefficients (Standard Error)
Marginal Effects (Standard Error)
2.395* 0.134* -23.866* -0.099* Constant
(1.132) (0.060) (6.454) (0.027) -0.213* -0.012* 0.658* 0.003* Age (0.054) (0.003) (0.295) (0.001) 0.002* 0.0001* -0.008* -0.00003* Age2 (0.001) (0.00004) (0.003) (0.00001) -0.568 -0.030 -0.849 -0.003 Disability (0.423) (0.023) (0.650) (0.003) -0.011 -0.002 6.334* 0.026* Primary/ Secondary
School in Germany (0.500) (0.027) (1.994) (0.009) -0.263 -0.015 6.162* 0.025* High School and
higher in Germany (0.488) (0.026) (1.959) (0.009) 0.361* 0.019* -0.054 -0.0003 Vocational Training (0.171) (0.009) (0.495) (0.002) -0.224 -0.012 -0.632 -0.003 Home Ownership (0.152) (0.008) (0.434) (0.002) -0.342 -0.018 0.410 0.002 Married (0.179) (0.010) (0.544) (0.002) 0.056 0.003 -0.878 -0.004 Children <16 in
Household (0.164) (0.009) (0.483) (0.002) -0.141 -0.007 -0.732 -0.003 Father is self-employed (0.145) (0.008) (0.500) (0.002) 7.902* 0.423* -3.219 -0.015 GNP (3.740) (0.200) (8.951) (0.037)
LogLikelihood -1020.724 χ2 113.961 Number of Obs. 3,858 *p < 0.05. two-sided test Note: Reference category is stay in self-employment; standard errors are robust standard errors