Embed Size (px)
DESCRIPTION
Abu Dhabi Region Map
Citation preview

Abu Dhabi Real EstateMarket Forecasts

Abu Dhabi Real Estate Market Forecasts Abu Dhabi - Urban Planning Council April 2010
Disclaimer The information contained in this publication is intended and has been prepared for information only, such information are based on current and future assumptions together with the fast moving property market in Abu Dhabi and does not constitute an offer or commitment. This information does not constitute planning, investment, financial or any other form of advice. Attention is drawn to the fact that the UPC makes no warranty or representation, expressed or implied, as to the accuracy or completeness of the information hereto.
Copyright of the information, photos, statistics, studies, maps, layouts, network maps, scripts and intellectual property are solely held by Abu Dhabi Urban Planning Council (“UPC”). Any unauthorized copying, distribution or taking action in reliance of the contents of this publication is strictly prohibited and may be unlawful and further result in legal pursuit. UPC shall in no circumstances be liable for any loss or damage caused due to error, delay, omission or inaccuracy of any information contained hereto.

Abu Dhabi Real Estate Market Forecasts Abu Dhabi - Urban Planning Council April 2010
i
Executive Summary
This Abu Dhabi Real Estate Market Forecast presents an analysis of the future supply and demand for
residential, office, retail and hotel real estate within the Abu Dhabi metropolitan area from 2009 to 2013. These
findings comprise an extract from a more extensive research study undertaken by the project team, which
included the development of a new Macroeconomic & Demographic model as well as a Real Estate Supply &
Demand Model for Abu Dhabi to 2030.
In times of global and local economic transformations, the Abu Dhabi Real Estate Market Forecast is an
effort of the Abu Dhabi Urban Planning Council to plan and implement its urban structure framework plans in
accordance to key market indicators. It allows for the planned development across the city and the Emirate as
a whole to respond to the needs of the real estate market.
The following tables summarise the major findings of the study in respect of the next 4 years (2009 – 2013):
Key Macroeconomic & Demographic Indicators (2009 & 2013)
Indicator Unit of Measurement 2009 2013 % change (p.a.)
Real GDP AED million (AD Emirate) 314,000 398,100 6.1%
Population Persons (AD Metropolitan) 969,000 1,189,000 5.2%
Total Employment Persons (AD Metropolitan) 574,300 693,000 4.8%
Office Employment Persons (AD Metropolitan) 194,400 232,000 4.5%
Hotel Nights Room nights (AD Metropolitan) 4,936,800 7,182,000 9.8%
Retail spending AED million (AD Metropolitan) 18,915 23,300 5.4%
Source: Macroeconomic & Demographic Model
Key Real Estate Indicators (2009 & 2013)
Indicator Unit of Measurement 2009 2013 % change (p.a.)
Residential Supply Units (AD Metropolitan) 177,400 251,200 9.1%
Residential Demand Units (AD Metropolitan) 226,000 277,500 5.3%
Office Supply Sqm of GLA (AD Metropolitan) 1,810,000 3,559,000 18.4%
Office Demand Sqm of GLA (AD Metropolitan) 2,940,000 3,495,000 4.4%
Retail Supply Sqm of GLA (AD Metropolitan) 1,426,000 2,510,000 15.2%
Retail Demand Sqm of GLA (AD Metropolitan) 2,106,000 2,315,000 2.4%
Hotel Supply No of rooms (AD Metropolitan) 13,500 26,500 18.4%
Hotel Demand No of rooms (AD Metropolitan) 13,500 19,700 9.9%
Source: Real Estate Supply & Demand Model (based on discussions with UPC & developers for supply and Macroeconomic & Demographic Model for demand)

Abu Dhabi Real Estate Market Forecasts Abu Dhabi - Urban Planning Council April 2010
ii
Key findings of the Abu Dhabi Real Estate Forecast:
A MARKET CURRENTLY UNDER SUPPLIED: The Abu Dhabi real estate market is currently under-
supplied with the demand exceeding supply in three sectors of the market (residential office and retail)
in 2009 and with the hotel sector being relatively in balance.
ECONOMIC GROWTH AND DEMOGRAPHICS: Demand is expected to increase in all sectors of the
real estate market over the study period, being driven by the continued growth in the population and
economy of Abu Dhabi. The average economic growth in Abu Dhabi Emirate over the study period is at
6.1%, while the population is expected to increase by an average of 5.2% per annum in the Abu Dhabi
metropolitan area.
AN INCREASING DEMAND: Increases in the demand for real estate between 2009 and 2013 range
from 2.4% per annum in the retail sector to 9.9% per annum in the hotel sector of the market. In
addition to the growth in the underlying demographic and economic drivers, this increase reflects the
significant level of latent demand resulting from the inadequate availability of real estate stock in Abu
Dhabi.
AN INCREASING SUPPLY: The construction industry has responded to the current shortage of supply,
by proposing a large number of new projects, which are scheduled to complete over the next few years.
The fastest increases in supply will be recorded in the office, retail and hotel sectors that are forecast to
grow between 15 - 19% per annum from 2009 to 2013.
SHORTAGE DECREASING: Despite the significant levels of new supply expected to enter the market,
aggregate demand is expected to remain ahead of the total supply in the residential sector. The current
shortage of around 48,400 units is expected to decline to around 26,300 by 2013.
LINKS TO OTHER EMIRATES: Given their close physical proximity and increased economic
integration, future demand levels in Abu Dhabi will also be inextricably linked to trends in the Dubai
market. This is expected to be most closely felt in the residential sector, where continued declines in
residential rental levels in Dubai could shift the residential demand curve for the Abu Dhabi market in
2010/2011.
RENTALS: While not an explicit component of the real estate demand and supply model prepared for
this assignment, changes in real estate prices and rentals will have a critical impact upon future
demand. The expected fall in residential rentals in the Abu Dhabi market will unlock much of the current
latent demand that will contribute to the projected level of future demand.
OFFICE SECTOR: The supply for office space will increase at a faster rate than the demand. The
proposed supply will lead to a total stock of approximately 3.6 million sq.m by the end of 2013,
compared to a forecast demand of around 3.5 million sq. m.
RETAIL SECTOR: The retail sector is currently under supplied by approximately 700,000 sq.m. This
sector is forecast to move into a surplus situation as more than 1 million sq.m of new space enters the
market by 2013.
HOTEL SECTOR: The hotel sector is currently in balance but is expected to move into an oversupply
scenario, with a total of 26,500 rooms expected by 2013, compared to a demand for 19,700 rooms.

Abu Dhabi Real Estate Market Forecasts Abu Dhabi - Urban Planning Council April 2010
Contents
1 Introduction......................................................................................................................................... 1
1.1 Context, Aims & Objectives ................................................................................................................................. 1
1.2 Scope of Project .................................................................................................................................................. 1
2 Macroeconomic & Demographic Forecasts..................................................................................... 4
2.1 Headline Forecasts – Abu Dhabi Emirate ........................................................................................................... 4
2.2 Key Sectors ......................................................................................................................................................... 6
2.3 Demographic Characteristics .............................................................................................................................. 6
2.4 Tourism................................................................................................................................................................ 7
2.5 Incomes and Spending........................................................................................................................................ 8
2.6 Study Findings for Abu Dhabi Metropolitan Area .............................................................................................. 10
3 Residential Market ............................................................................................................................ 13
3.1 Introduction........................................................................................................................................................ 13
3.2 Current Residential Supply................................................................................................................................ 14
3.3 Future Residential Supply ................................................................................................................................. 14
3.4 Current Residential Demand ............................................................................................................................. 15
3.5 Future Residential Demand............................................................................................................................... 16
3.6 Residential Market Outlook ............................................................................................................................... 16
4 Office Market ..................................................................................................................................... 17
4.1 Introduction........................................................................................................................................................ 17
4.2 Current Office Supply ........................................................................................................................................ 17
4.3 Future Office Supply.......................................................................................................................................... 18
4.4 Current Office Demand...................................................................................................................................... 20
4.5 Future Office Demand ....................................................................................................................................... 20
4.6 Office Market Outlook........................................................................................................................................ 21
5 Retail Market ..................................................................................................................................... 22
5.1 Introduction........................................................................................................................................................ 22
5.2 Current Retail Supply ........................................................................................................................................ 22
5.3 Future Retail Supply .......................................................................................................................................... 23
5.4 Current Retail Demand...................................................................................................................................... 24
5.5 Future Retail Demand ....................................................................................................................................... 24
5.6 Retail Market Outlook ........................................................................................................................................ 24
6 Hotel Market ...................................................................................................................................... 26
6.1 Introduction........................................................................................................................................................ 26
6.2 Current Hotel Supply ......................................................................................................................................... 26
6.3 Future Hotel Supply........................................................................................................................................... 27
6.4 Current Hotel Demand....................................................................................................................................... 28
6.5 Future Hotel Demand ........................................................................................................................................ 28
6.6 Hotel Market Outlook......................................................................................................................................... 28

Abu Dhabi Real Estate Market Forecasts Abu Dhabi - Urban Planning Council April 2010
7 Inferences and Critical Catalysts for Future Growth..................................................................... 30
7.1 Inferences.......................................................................................................................................................... 30
7.2 Understanding Critical Catalysts beyond the Projections.................................................................................. 30
Appendix A - Technical Report of Macroeconomic & Demographic Model.......................................... 33
Appendix B - Technical Report of Real Estate Demand Model .............................................................. 38
Appendix C - Technical Report of Real Estate Supply Model ................................................................ 43

Abu Dhabi Real Estate Market Forecasts Abu Dhabi - Urban Planning Council April 2010
1
1 Introduction
1.1 Context, Aims & Objectives
Over the past five years, Abu Dhabi has witnessed strong economic development, with a growth rate
averaging over 9% per year. Urban growth challenges, resulting from demographic and population shifts, need to be addressed in due time through the development a clear and transparent framework. The current global
and regional economic conditions ask for governments and regulatory authorities to take a more active role in
creating a framework that can rectify and solve real estate issues.
In rapidly changing global and local economic conditions, the Abu Dhabi Urban Planning Council (UPC) is committed to responding to the current urban growth challenges by developing a more transparent framework.
This commitment is at the origin of the Abu Dhabi Real Estate Forecast with primary aim to follow the needs,
challenges and opportunities of the real estate sector in Abu Dhabi. With the Forecast, the UPC contributes to the strengthening and more transparent regulatory environment.
The objectives of the Abu Dhabi Real Estate Forecast are:
- To ascertain the current balance between the supply and demand for real estate across four sectors of the
Abu Dhabi metropolitan area (Office, Residential, Retail and Hotel);
- To assess how this balance is likely to change over the short term (2009 – 2013). This analysis of the short-
term supply and demand is extracted from a more extensive supply and demand study, which covered the
period from 2008 to 2030.;
- To allow the UPC to plan and implement its urban structure framework plans in accordance to key market
indicators.
1.2 Scope of Project
There were two models developed under the purview of the present research effort.
( i ) Macroeconomic & Demographic Model
The Project Team has prepared a new top-down model to project both employment and population for
the Abu Dhabi metropolitan area from 2008 to 2030. This model has been developed using published
data together with extensive primary data collection.
The main characteristics and assumptions of the model are as follows:
Non-oil GDP by sector increases in line with world demand, capacity and, in some cases, domestic
intermediate demand and population.
Nominal investment demand depends on nominal GDP and is therefore sensitive to the oil price.
Employment growth is related to real GDP growth.

Abu Dhabi Real Estate Market Forecasts Abu Dhabi - Urban Planning Council April 2010
2
Non-citizens (expatriate) population is equal to non-citizens employment plus non-employed non-
citizens. The latter is assumed to move in line with the number of employed non-citizens.
Therefore, there is a strong relationship between employment growth and population growth.
Tourist nights grow in line with world demand, along with the improved tourism offer and increased
capacity in Abu Dhabi
Retail spending is the sum of spending by residents and tourists. Residents spending increases in
line with residents’ incomes and tourist spending is linked to tourist nights.
The following outputs of the Model form key inputs into the real estate supply and demand model
developed for this project.
Population (expatriates and nationals) - residential market
Office-based employment – office market
Retail sales (residents and tourists) – retail market
Hotel night demand (tourists) – hotel market
( ii ) Real Estate Supply & Demand Model
The Project Team has also prepared a new Real Estate Supply & Demand model for the Abu Dhabi
metropolitan area for the period from 2008 -2030, including a shorter term analysis for the period 2009
to 2013 as covered by this report.
Supply: A detailed assessment of the potential future supply of real estate in Abu Dhabi has been
undertaken. Projections of future supply from 2009 to 2013 are based on a detailed ‘project by project’
review of all announced projects, making adjustments to reflect the likely delivery dates and phasing of
these projects.
The projected supply was broken down into a total of 30 areas in the research study. For the purpose of
this summary report, these have been grouped together into the following 6 broader regions.

Abu Dhabi Real Estate Market Forecasts Abu Dhabi - Urban Planning Council April 2010
3
Allocation of Supply by Region
Mainland North Abu Dhabi Island North Abu Dhabi Island
Al Shahama Abu Dhabi Island Al Meena
Al Rahba Grand Mosque District CBD
New Port City Marina Village
Ghantoot + Desert Finger
Mainland South Mainland Central Islands
Shamkhah Al Falah Al Reem
Capital District Khalifa City A Al Suwwah
Bani Yas Airport District + Al Reef Lulu Island
Desert Villages Bain Al Jesrain Inner Islands
MBZ City Al Raha Yas Island
Mussafah Saadiyat Island
Maffraq Lefeenah Island
Khalifa City B Hudaryiat Island
Source: Project Team
Source: Project Team. UPC (GIS department)
Demand: Based on the outputs of the Macroeconomic & Demographic model, annual forecasts of demand
for each of the four asset classes (residential, office, retail and hotels) have been prepared from 2009 to
2013

Abu Dhabi Real Estate Market Forecasts Abu Dhabi - Urban Planning Council April 2010
4
2 Macroeconomic & Demographic Forecasts
2.1 Headline Forecasts – Abu Dhabi Emirate
Abu Dhabi is by far the largest of the seven emirates of the United Arab Emirates (UAE) both in terms of land
area and in terms of economic activity, accounting for over 50% of total UAE GDP (though only a third of non-
oil GDP).
The discovery of oil in the 1960s has transformed the economy of the United Arab Emirates over the past 50
years with the Emirates’ massive oil based revenues being progressively re-invested into diversification with a
particular focus on healthcare, education, industry and infrastructure. While there are ambitious plans to
diversify towards the non-oil sector of the economy, the non-oil sector accounted for only 38% of total GDP in
2008. The Economic Vision 2030 is the long-term plan of the Government of Abu Dhabi for the diversification
of the Emirate’s economy and its transformation into a sustainable economy.
In the last decade, Abu Dhabi has grown at an exceptional pace. Between 2001 and 2009, the total GDP
growth averaged 9% per annum in real terms1, dominated by the rapid growth in the oil and gas sector. Over
the same period (2001-2009), non-oil GDP grew at an average of 3.6% each year. With growth in the oil sector
outstripping the rest of the economy and with rising oil prices, the non-oil share of the economy declined
rapidly until 2008.
Real GDP Growth (2002-2013) – Abu Dhabi Emirate
Source: Macroeconomic & Demographic Model (based on nominal GDP historic data (2002 – 2008) from Ministry of Economy)
In 2009, the economy was hit by the impact of falling oil prices and output, a decline in real estate markets, the
lack of bank lending and diminishing economic confidence. The combination of these factors more than offset
any fiscal and monetary stimulus, resulting in a decline of 7% in real GDP for Abu Dhabi in 2009.
1 All growth rates are quoted in real terms (adjusted for inflation) while all GDP shares are in nominal terms unless otherwise stated.

Abu Dhabi Real Estate Market Forecasts Abu Dhabi - Urban Planning Council April 2010
5
Despite continued weakness in the global economy in the first half of 2010, the Abu Dhabi economy is
predicted to rebound strongly, with a positive real growth of GDP of 6.7% forecasted for this year.
Total real GDP is envisaged to increase by an average of 6.1% per annum between 2009 and 2013. Although
non-oil GDP growth is expected to out-strip growth in the oil sector as the economy diversifies, the easing of
production quotas allowing a recovery in oil production will ensure that the oil sector continues to dominate the
economy (accounting for 66% of total real GDP in 2013).
Investment has been skewed towards non-oil sectors in recent years. Gross fixed domestic capital formation
increased by an average of 3.5% per annum between 2001 and 2008, driven by investment in the real estate
and business services sector which averaged an impressive growth of 14.4% per annum.
Total Real Investment Growth (2002-2013) – Abu Dhabi Emirate
Source: Macroeconomic & Demographic Model (based on historic data (2002 – 2008) from Statistics Centre Abu Dhabi)
Investment is expected to bounce back following a decline in 2009 and is expected to post double digit
average annual growth rates over the four years to 2013.
As the economy has expanded briskly in recent years, so has employment. Between 2001 and 2009, total
employment increased by an average of 6.0% per annum. Over the same time, employment in construction
has increased by over 10% per annum, and by 2009 26% of the employed workforce was in this sector
although this was down from nearly 29% in 2008.

Abu Dhabi Real Estate Market Forecasts Abu Dhabi - Urban Planning Council April 2010
6
Total Employment Growth (2002 – 2013)
Source: Macroeconomic & Demographic Model (based on historic data (2002 – 2008) from Statistics
Centre Abu Dhabi)
2.2 Key Sectors
Abu Dhabi is the largest oil producer in the UAE, controlling more than 85% of the UAE’s total oil output
capacity and over 90% of its crude reserves – equivalent to over 8% of the world's oil reserves. It is therefore
not surprising that oil and gas production has been the mainstay of the economy and it is anticipated to remain
a major contributor to the GDP, due to the vast hydrocarbon reserves at the Emirate’s disposal.
As the world economy recovers, trends in the oil price will be supportive of relatively strong growth from next
year, and will assist to increase the share of the oil sector in nominal terms in the short term. Oil prices are
expected to grow to an average of USD 74 per barrel in 2010, a 22% increase from the USD 61 per barrel
figure for 2009 (which was a drop of 37% from 2008).
The rise in employment in the services sectors will drive demand for office space. The number of office
workers is forecast to increase by 4.5% per annum between 2009 and 2013. Hotels and restaurants are
expected to witness the most rapid rise in employment (over 8% per annum) as this sector benefits from the
projected growth in visitor arrivals.
2.3 Demographic Characteristics
Population growth in Abu Dhabi reflects a mixture of the natural increase in the citizen’s population and the
expansion of the non-citizen (or expatriate) population in response to changing employment opportunities.
Abu Dhabi’s citizen population has increased at a steady pace, growing by around 4% per annum between
2001 and 2009. Having seen higher natural growth rates in the 1990’s the composition of the citizen population
in 2009 was dominated by the under-15 category (which accounted for 42% of the total population), while the
working age population (15-64 year olds) accounted for 55% of the total. This age mix and a relatively high
birth rate will drive the projected growth of the citizen population (above 3% per annum) between 2009 and
2013.

Abu Dhabi Real Estate Market Forecasts Abu Dhabi - Urban Planning Council April 2010
7
However, growth in the citizen population has been, and will continue to be, outstripped by the increase in the
expatriate (non-citizens) population of Abu Dhabi. Between 2001 and 2009, the non-citizen population is
estimated to have grown by an average of almost 4% per annum despite a fall in 2009 as a result of the recent
economic downturn. The previous growth rate is expected to be maintained between 2009 and 2013. This will
lead to the number of expatriates rising from 1.2 million in 2009 to 1.4 million in 2013.
Total Population (citizen & non citizen) 2009 - 2013 (Abu Dhabi Emirate)
Source: Macroeconomic & Demographic Model
A critical demographic driver for non citizen population in Abu Dhabi is the ratio of dependents per employed
person, which currently stands at a 0.31. This relatively low figure is due to a large number of single workers
with no dependents in the Emirate and the absence of a large number of retired expatriates.
There is scope for an increase in the ratio of dependents per employed person as the relative importance of
the more transient construction workers diminishes and as the expatriate community becomes generally more
prosperous and more settled. Consequently, it is assumed that the non-employed to employed ratio for
expatriates will increase gradually in the future, further contributing to the growth in the total expatriate
population.
2.4 Tourism
There has been a concerted effort by the Abu Dhabi authorities to boost tourism in recent years, with
measures including government training schemes to improve the quality of services in the hotel industry, a
prominent marketing campaign, the establishment of Abu Dhabi Tourism Authority (ADTA), the development of
major new tourist attractions and the hosting of a range of sporting and cultural events. As part of its strategic
diversification, the Emirate is targeting the luxury tourism market, and has put art and culture at the heart of its
economic plans, with projects including the development of a number of landmark attractions such as the new
Louvre and Guggenheim museums.
As a result of these initiatives, the total number of visitors in Abu Dhabi is forecast to increase from 1.5 million
in 2009 to more than 2.1 million by 2013 (an increase of around 10% per annum). International leisure would
be the fastest growing market segment, with an anticipated increase from 500,000 visitors in 2009 to more
than 832,000 visitors in 2013 (an increase of almost 17% per annum).

Abu Dhabi Real Estate Market Forecasts Abu Dhabi - Urban Planning Council April 2010
8
Growth in Visitors Arrivals (2009 – 2013) Abu Dhabi Emirate
Source: Macroeconomic & Demographic Model
As a result of the robust growth in international leisure visitors, it is anticipated that the share of international
leisure hotel nights will rise from 51% (2.5 million visitor nights) in 2008 to 58% (4.3 million visitors) by 2013.
Hotel Nights by Purpose 2009 Hotel Nights by Purpose 2013
Source: Macroeconomic & Demographic Model (data relates to Abu Dhabi Emirate)
A consequence of the rise in visitors, particularly leisure visitors, will be increased demand for hotels and
restaurants and for the retail sector, all of which are expected to see above average employment growth over
the next four years.
2.5 Incomes and Spending
Total household income in Abu Dhabi in 2009 is estimated at AED76 billion (AED27 billion for citizens and
AED49 billion for non-citizen households), with wages and salaries being the main source of
income. Employment generated income for non-citizens is around 2.4 times that of citizens, with citizens being
relatively more reliant on property income and transfers.

Abu Dhabi Real Estate Market Forecasts Abu Dhabi - Urban Planning Council April 2010
9
While the aggregate income of non-citizen households did not experience growth during 2009, employment
and earnings prospects are expected to improve again from 2010. This is predicted to result in real aggregate
household incomes for non-citizens increasing by an average of over 6% per annum between 2009 and 2013.
Retail spending in Abu Dhabi Emirate is expected to equal AED18.9 billion (in 2008 prices) in 2009. Expatriate
residents comprise the largest share of this total (49%), compared with 43% of retail spending from citizens
and the remaining 8% of this total spend derived from tourists. Although non-citizen total household incomes
far outweighs that of citizens, non citizens spend a much lower proportion of their income on retail purchases
than citizens (18% compared to 30%) which reflects a higher savings rate by non-citizens and a much higher
proportion of expatriates’ income being spent on accommodation or sent abroad.
Retail Spend by Group (2009) AED Bn (Abu Dhabi Emirate)
Source: Macroeconomic & Demographic Model
Growth of Retail Spending by Group (2009-13) Abu Dhabi Emirate
Source: Macroeconomic & Demographic Model
Retail spending by citizens and expatriate residents is expected to grow in line with income between 2009 and
2013. Much stronger growth is expected in retail spending by tourists, reflecting both the increased visitor

Abu Dhabi Real Estate Market Forecasts Abu Dhabi - Urban Planning Council April 2010
10
nights and increased spending per night. Overall, retail spending by residents is forecasted to increase at an
average annual rate of 4.5% per annum between 2009 and 2013, while the average increase in tourists' retail
spending of 14.4% per annum will push the aggregate growth rate of retail spending up to 5.4% per annum.
Spending on hotels and restaurants is heavily dependent on tourism, which accounts for around 75% of total
spending. Driven by the strong growth in tourist arrivals, aggregate spending on hotels and restaurants is
forecast to increase by a very robust 8.5% per annum from 2009 to 2013.
Growth in Hotel and Restaurant Spending (2009-2013) – Abu Dhabi Emirate
Source: Macroeconomic & Demographic Model
2.6 Study Findings for Abu Dhabi Metropolitan Area
The population of the Abu Dhabi metropolitan area is perceived to be 969,000 or around 60% of the Abu Dhabi
Emirate population at the end of 2009. There is a greater concentration of expatriates in the Abu Dhabi
Metropolitan (which accounts for around 65% of all the expatriates living in the Emirate) while over half of all
the Emiraties reside within the Abu Dhabi metropolitan area.
After flattening off in 2009 as a result of the economic slowdown, the non-citizens population is forecast to
grow at a solid pace of 5.7% per annum between 2009 and 2013. Combined with the projected increase of
3.4% in the citizen population, the total population of the Abu Dhabi metropolitan area is forecast to increase
by 5% per annum between 2009 and 2013.

Abu Dhabi Real Estate Market Forecasts Abu Dhabi - Urban Planning Council April 2010
11
Composition of Abu Dhabi Emirate Population (2009)
Source: Macroeconomic & Demographic Model
Abu Dhabi Metropolitan Area Population Change 2009-2013
Source: Macroeconomic & Demographic Model
The Abu Dhabi metropolitan area accounted for 59% of the Emirates total employment in 2009. The
construction and distribution (including retail) sectors were the largest employers, constituting 29% and 21% of
total employment in the Metropolitan respectively in 2009.
The global economic downturn resulted in a contraction in employment in those sectors sensitive to the
external environment in 2009 included the oil, manufacturing, finance and construction sectors. Most sectors
are expected to rebound strongly from 2010 and total employment is forecast to post an average growth of
4.8% per annum between 2009 and 2013. The strongest growing sectors between 2009 and 2013 are forecast
to be restaurants and hotels (8.4%), real estate and business services (8.0%), construction (6.0%), distribution
(5%) and financial services (5%).
Over 65% of all office jobs in Abu Dhabi Emirate are located in the Metropolitan area. This ratio is even higher
in many sectors of the economy (e.g. 90% of all office jobs in the finance sector in Abu Dhabi Emirate are
located in the metropolitan area). Office-based jobs are expected to grow at a slightly slower rate of growth

Abu Dhabi Real Estate Market Forecasts Abu Dhabi - Urban Planning Council April 2010
12
than total employment between 2009 and 2013 as the rapidly growing construction, hotels and restaurants and
distribution sectors have a considerably smaller proportion of office based staff.

Abu Dhabi Real Estate Market Forecasts Abu Dhabi - Urban Planning Council April 2010
13
3 Residential Market
3.1 Introduction
The Abu Dhabi residential market is currently experiencing a shortage of supply, with insufficient units to meet
the demands of the current population particularly for the lower income brackets. This has resulted in a
significant degree of sharing of housing units, in the form of both shared villas and multiple family occupancy of
apartments.
While the construction industry has responded to the current shortage with the announcement of many new
projects over the past 2 to 3 years, much of this announced supply has been delayed or placed on hold due to
the effects of the market downturn, the tightening of liquidity and developers being previously overly reliant on
pre-sales for fund development.
The residential market is expected to remain undersupplied throughout the study period, although the current
shortage of around 48,400 units is expected to reduce to around 26,300 units by 2013.
The recent speculative boom saw residential sales prices peak in 2008, before declining dramatically in 2009.
The rental market has also seen rents adjust downwards in 2009 across almost all sub sectors particularly for
lower grade and upper market product, although rents still remain relatively high compared to neighbouring
Dubai, due to the continued shortage of supply.
Residential rents might continue to decline in Abu Dhabi, due to a number of factors including the impact of
rent decline in Dubai and increasing supply. This adjustment in Abu Dhabi rentals will be a key to unlocking
the current latent demand owing to a reduction in the propensity for multiple households to share a single
residential unit. As Abu Dhabi’s rental premium over Dubai residential rentals reduces then the level of
commuting from Dubai to Abu Dhabi will reduce, further unlocking latent demand.
With more new supply becoming available and as rents decline, residential tenants will have more choice. As a
result, many tenants are expected to trade-up from shared accommodation into single occupancy units,
creating a price driven increase in demand.
There remains a mismatch between the positioning of the current supply (much of which was planned to target
speculators and higher end product) and the majority of end user demand (which is greatest in the lower and
mid market segments).
While many developers are currently reviewing and re-positioning their project pipeline to increase the supply
of lower and mid market product for end users, there is expected to be a continued shortage of lower and mid-
market housing stock for the next three to four years.
The upscale market will witness significant levels of additional new supply in 2010 and 2011, with the
completion of the first projects at Reem Island and Raha Beach.
Abu Dhabi Real Estate Market Forecasts Abu Dhabi - Urban Planning Council April 2010
14
3.2 Current Residential Supply
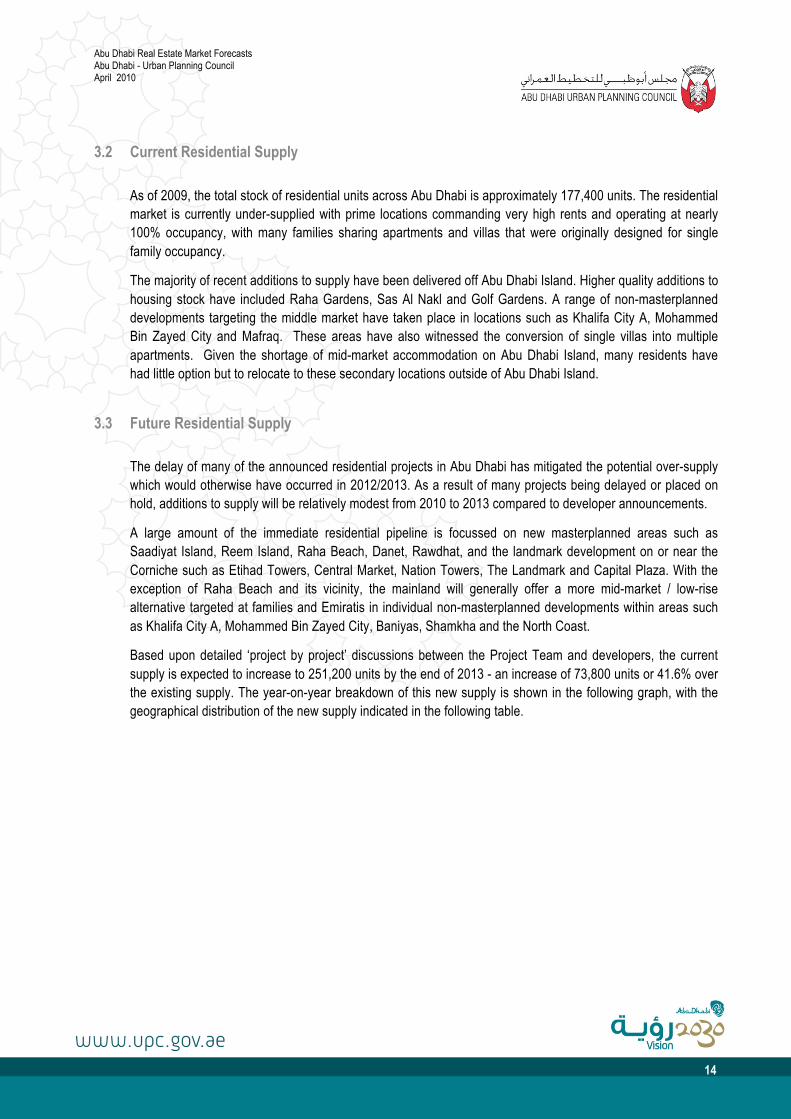
As of 2009, the total stock of residential units across Abu Dhabi is approximately 177,400 units. The residential
market is currently under-supplied with prime locations commanding very high rents and operating at nearly
100% occupancy, with many families sharing apartments and villas that were originally designed for single
family occupancy.
The majority of recent additions to supply have been delivered off Abu Dhabi Island. Higher quality additions to
housing stock have included Raha Gardens, Sas Al Nakl and Golf Gardens. A range of non-masterplanned
developments targeting the middle market have taken place in locations such as Khalifa City A, Mohammed
Bin Zayed City and Mafraq. These areas have also witnessed the conversion of single villas into multiple
apartments. Given the shortage of mid-market accommodation on Abu Dhabi Island, many residents have
had little option but to relocate to these secondary locations outside of Abu Dhabi Island.
3.3 Future Residential Supply
The delay of many of the announced residential projects in Abu Dhabi has mitigated the potential over-supply
which would otherwise have occurred in 2012/2013. As a result of many projects being delayed or placed on
hold, additions to supply will be relatively modest from 2010 to 2013 compared to developer announcements.
A large amount of the immediate residential pipeline is focussed on new masterplanned areas such as
Saadiyat Island, Reem Island, Raha Beach, Danet, Rawdhat, and the landmark development on or near the
Corniche such as Etihad Towers, Central Market, Nation Towers, The Landmark and Capital Plaza. With the
exception of Raha Beach and its vicinity, the mainland will generally offer a more mid-market / low-rise
alternative targeted at families and Emiratis in individual non-masterplanned developments within areas such
as Khalifa City A, Mohammed Bin Zayed City, Baniyas, Shamkha and the North Coast.
Based upon detailed ‘project by project’ discussions between the Project Team and developers, the current
supply is expected to increase to 251,200 units by the end of 2013 - an increase of 73,800 units or 41.6% over
the existing supply. The year-on-year breakdown of this new supply is shown in the following graph, with the
geographical distribution of the new supply indicated in the following table.

Abu Dhabi Real Estate Market Forecasts Abu Dhabi - Urban Planning Council April 2010
15
Future Residential Supply (number of units) 2009-2013
2009 2010 2011 2012 2013
Total (yearly upcoming supply) 5,916 16,584 16,147 18,486 22,595
Total Supply (units) 177,416 194,000 210,147 228,633 251,228
Source: Real Estate Supply and Demand Model based on discussions with UPC and developers
Residential Supply (units) by Area (2009-2013)
2008 2009 2010 2011 2012 2013
Mainland North 250 500 500 482 840
AD Island 940 1,498 4,162 2,110 1,463
North AD Island 600 605 650 1,319 150
Mainland South 1,318 2,309 2,885 2,801 2,913
Mainland Central 2,270 4,083 6481 5,694 5,818
Islands - 6,081 - 4,400 9,357
@10% of Supply Addition
(Beyond UPC Purview) 538 1508 1469 1680 2054
Total (yearly upcoming supply) 5,916 16,584 16,147 18,486 22,595
Total Supply (units) 171,500 177,416 194,000 210,147 228,633 251,228
Source: Real Estate Supply and Demand Model based on discussions with UPC and developers
3.4 Current Residential Demand
Rapid economic growth and employment creation has resulted in an unprecedented population boom in Abu
Dhabi in recent years. While the resident population of the Abu Dhabi metropolitan area (969,000 in 2009)
remains low compared to other prominent regional and global cities, the population has been increasing at a
relatively rapid rate (4% pa between 2001 and 2009).
The average household size in Abu Dhabi is estimated to be 4.3 (based on averages of 3.5 for expats and 6.5
for nationals). This results in demand for around 226,000 units in Abu Dhabi metropolitan area. Given the
number of households exceeds the total supply; there is currently more than one household per unit across
Abu Dhabi. This has resulted in the multi occupancy of villas (with many single family villas being converted
into shared accommodation) and the situation where several families are currently sharing a single apartment.

Abu Dhabi Real Estate Market Forecasts Abu Dhabi - Urban Planning Council April 2010
16
3.5 Future Residential Demand
There are three major drivers to the potential future demand for residential units in Abu Dhabi:
Total population
Average household size
Propensity to share ratio
Based on these factors, the total demand for residential units is forecast to reach 278,000 by 2013 – an
increase of approximately 52,000 units from 2009. This figure is still higher than the anticipated supply by
2013, which is forecast at 250,700 units, illustrating a deficit of approximately 26,300 units.
3.6 Residential Market Outlook
The residential sector for end-users is currently under-supplied particularly for lower and mid market income
brackets. Whilst there was a large amount of residential product launched in the boom years of 2007 to 2008,
the majority of this space targeted speculative investors rather than end-users and many of these projects
have since been put on hold.
Given the limited new supply that will actually materialise over the next few years and the additional demand
that is expected to be realised as rents decline, the residential market is expected to remain undersupplied
between 2009 and 2013.
Balance of Residential Supply/Demand 2009-2013
2009 2010 2011 2012 2013
Supply (units) 177,416 194,000 210,147 228,633 251,228
Demand (units) 225,837 226,159 241,937 259,143 277,516
Balance (units) -48,421 -32,159 -31,790 -30,510 -26,288
Source: Real Estate Supply & Demand Model (based on inputs from UPC for supply and Macroeconomic & Demographic Model for demand)
Residential Supply & Demand Analysis (2009-2013)
Source: Real Estate Supply & Demand Model (based on inputs from UPC for supply and Macroeconomic & Demographic Model for demand)

Abu Dhabi Real Estate Market Forecasts Abu Dhabi - Urban Planning Council April 2010
17
4 Office Market
4.1 Introduction
Currently there is a limited supply of office space in Abu Dhabi, particularly for international quality,
professionally managed Grade A office space. As a result, the office markets are operating at maximum
occupancy rates and rents are high in relation to the quality of space offered and compared to other regional
markets. Many tenants have adjusted to these tight market conditions by:
Functioning out of villas or other buildings originally designed for residential purposes;
Operating at unsustainably high space densities;
Maintaining a relatively minor presence in Abu Dhabi, while servicing the market from other cities in the
region.
The supply situation is poised to change significantly over the next 4 years, with significant levels of new
supply coming on line. The current shortage of space is, therefore, likely to be addressed and a more balanced
situation is likely to emerge over the period to 2013.
Rental values peaked in early 2009 and are now falling due to upcoming supply. Many existing tenants that
have been present in Abu Dhabi for a number of years are benefiting from h0istoric rent caps and are
therefore not inclined to move and the comparatively high costs of doing business in Abu Dhabi are
constraining the level of new entrants to the market.
As more office space becomes available, average rents are expected to decline, which in turn will help to
stimulate market absorption rates in a flight to quality, as tenants relocate to occupy higher quality product at a
similar cost. As a result, poorer quality space will face severe vacancies and rental declines, with residential
conversions reverting to residential usage.
Demand is currently focused on large scale requirements from the government, state-owned enterprises and
domestic banks, with most of these sectors being typically owner occupiers rather than being active in the
private rental market.
With the exception of a few foreign companies involved in the oil and gas and financial services sectors,
professional services is the most active private sector. However, most requirements remain relatively small,
with many firms choosing to operate satellite offices in Abu Dhabi.
4.2 Current Office Supply
Abu Dhabi’s office market is currently substantially under-developed in terms of both the quantity and quality of
space for a city of its size and economic importance. There are only a few buildings that offer international
quality Grade A quality space (e.g.: ADIA, Al Mamoura, Aldar’s HQ, Baniyas Towers) and these buildings are
typically occupied by government-related groups and are not easily available to private sector tenants.
Abu Dhabi had a total office stock of approximately 1.8 million sqm floor space (Grade A,B &,C), as at the end
of 2009, with an even more limited stock of around 298,000 sqm of Grade A space. This is an extremely low
level of office space per capita, just 1.9 sq.m of space per person, (compared to nearly 3.0 sqm per capita in
Dubai).

Abu Dhabi Real Estate Market Forecasts Abu Dhabi - Urban Planning Council April 2010
18
In addition to this stock, there is approximately 160,000 sqm of Grade D buildings, which are mainly poor
quality residential conversions. These include buildings with mezzanine office space or a limited number of
office floors in primarily residential towers, public buildings which were originally constructed for public sector
usage and villas currently being utilised for office purposes.
Existing Office Stock by Grade
Source: The Project Team
The majority of the current supply of quality office space is located on Abu Dhabi Island, where a number of
principal office districts can be identified. These include:-
Central Business District – focused on the area surrounding Hamdan Street and extending to
surrounding areas along the Corniche, within the Tourist Club Area and to Al Dhafrah. This area has a
current stock of approximately 800,000 sqm.
Midtown largely comprising Airport Road and Muroor Road corridors – a large number of Grade B/C
buildings, often residential conversions. This area also includes the prime Al Mamoura complex, which
has attracted occupiers seeking to be close to major government entities such as Mubadala, Executive
Affairs Authority and the UPC. The total stock in this area is around 550,000 sqm.
Other current submarkets on Abu Dhabi Island such as Al Bateen and Khalifa Park, where there are a
limited number of modern office buildings. Most of the stock in these areas comprises clusters of grade
B/C buildings (reasonable quality, albeit residential conversions) which have attracted professional
services and investment firms and public sector groups due to the current absence of higher quality
stock.
Outside of the Abu Dhabi Island, the most significant current stock of office space is located in the Mussafah
area, which is estimated to provide around 200,000 sqm of office premises, and Raha where Aldar have
developed their new HQ building.
4.3 Future Office Supply
Based upon the detailed (risk-adjusted project by project) analysis of future supply undertaken by the Project
Team, it is estimated that the total supply of office space across the Abu Dhabi metropolitan area will almost
double from its current level of 1.8 million sqm to approximately 3.6 million sqm by the end of 2013. The
following graph provides the annual supply estimates, with the geographic location of this new supply being
highlighted in the table below.

Abu Dhabi Real Estate Market Forecasts Abu Dhabi - Urban Planning Council April 2010
19
Future Office Supply –GLA (sqm) (2009 – 2013)
2009 2010 2011 2012 2013
Total (yearly upcoming supply) 129,000 536,245 469,102 366,458 377,974
Total Supply (units) 1,809,500 2,345,745 2,814,847 3,181,305 3,559,278
Source: Real Estate Supply & Demand Model based on discussions with UPC and developers
Office Supply (GLA/m2) by Location (2009-2013)
2008 2009 2010 2011 2012 2013
Mainland North - - - 1,030 -
AD Island 79,500 178,320 160,450 130,740 115,406
North AD Island 19,500 107,000 60,000 107,128 90,193
Mainland South 12,000 92,667 42,962 42,667 51,668
Mainland Central 18,000 53,500 21,500 74,894 45,307
Islands - 104,758 184,190 10,000 75,400
Total (yearly upcoming supply) 129,000 536,245 469,102 366,458 377,974
Total Supply (GLA/m2) 1,680,500 1,809,500 2,345,745 2,814,847 3,181,305 3,559,278
Source: Real Estate Supply & Demand Model based on discussions with UPC and developers
While there are instances of projects being placed on hold due to recessionary effects, there remains a
substantial amount of development in the pipeline. Major projects expected to be completed within the
Corniche and Central Business District area over the next four years include Sowwah Square, Etihad Towers,
Capital Plaza, Central Market, The Landmark Corniche and Nation Towers.
The boundaries of the CBD are being extended outside of Abu Dhabi Island to include Al Sowwah Island
(prime office development including the new Stock Exchange building), together with surrounding projects on
Reem Island and at Mina Zayed.
The Grand Mosque District and surrounding area will also offer new office supply over the next four years
upon the completion of the first phases of the major master developments at the Capital Centre (adjacent to
ADNEC), Danet and Rawdhat.
There will also be a limited amount of Grade A office space being completed on the mainland over the next
few years, following Aldar’s HQ building at Raha Beach. Examples include TDIC/ADTA’s HQ building and
Masdar City.

Abu Dhabi Real Estate Market Forecasts Abu Dhabi - Urban Planning Council April 2010
20
4.4 Current Office Demand
Abu Dhabi’s office market is currently dominated by large-scale state-owned enterprises (such as Etihad
Etisalat, ADWEA, ADNOC), the domestic banking sector (e.g. National Bank of Abu Dhabi, Abu Dhabi
Commercial Bank, Abu Dhabi Islamic Bank, First Gulf Bank) and federal and local government entities.
Beyond the large-scale entities, office occupiers are typically small-scale, with most being found in the oil-and
gas industry and the professional services sector. These users predominantly occupy units under 1,000 sqm
with only a small number of occupiers in excess of over 5,000 sqm.
Aside from larger scale government-backed entities, the majority of private sector lettings over the past 12 to
24 months have been to companies in sectors such as professional services (law firms, management
consultants, architects, engineers etc.), with the typical floor space requirements of occupiers being relatively
small (typically 100-500 sqm).
Due to a combination of the low vacancy rates, the relatively high market rents and the limited amount of
modern space available, there is currently limited turnover (churn) of office tenants, with most companies
tending to remain in their current lower grade space on short-term commitments rather than to relocate.
Given the shortage of available space, many companies are currently operating from unusually low levels of
office space per employee, with surveys suggesting this currently ranges from 7 – 10 sqm per person in
private sector organisations in Abu Dhabi. This is well below the typical occupancy standards seen overseas,
which currently range from 12 – 22 sqm per employee. For estimating latent demand, an international best
practice average of 15 sq.m per person has been assumed. Applying this assumption, results in a current
demand of around 2.9 million sqm across the Abu Dhabi metropolitan area.
This suggests that the lack of competitively priced and good quality office space is artificially constraining the
demand for office space, and resulting in about 1.1 million sqm of deficit for office space in Abu Dhabi.
4.5 Future Office Demand
With employment in office based industries increasing and enhanced availability of office space, demand for
office space in Abu Dhabi is expected to increase to around 3.5 million sqm by the end of 2013. Some of the
demand for new space will be generated by existing occupiers upgrading their office space but the majority of
new office space will need to be occupied by new demand from companies expanding their Abu Dhabi base
and new entrants to the Abu Dhabi market.
The major sectors that will drive office demand from 2009 – 2013 will be financial services, professional
services (lawyers, accountants, and consultants), corporate HQs (dominant sectors such as oil and gas,
consumer goods, IT and Communications), real estate development (construction, developers and
consultants) and most significantly the government sector. The dominant office occupiers will continue to be
government and state-owned enterprises.

Abu Dhabi Real Estate Market Forecasts Abu Dhabi - Urban Planning Council April 2010
21
4.6 Office Market Outlook
The supply for office space will increase at a faster rate than the demand. This differential in the growth rate
over the short term would allow for addressing the existing deficit of approximately 1.1 million sqm as well as
for emerging demand in the future. As a result, the Abu Dhabi Markets would achieve supply-demand
equilibrium by 2013. The occupancy rates are expected to be high during the period 2009 – 2013.
Office Supply & Demand Analysis (2009 – 2013)
Source: Real Estate Supply & Demand Model (based on inputs from UPC for supply and Macroeconomic & Demographic Model for demand)
Office Supply/Demand Analysis 2009-2013
2009 2010 2011 2012 2013
Supply (GLA sqm) 1,809,500 2,345,745 2,814,847 3,181,305 3,559,273
Demand (GLA sqm) 2,940,339 2,997,463 3,127,192 3,296,864 3,495,464
Balance (GLA sqm) -1,130,839 -651,718 -312,345 -115,558 +63,810
Source: Real Estate Supply & Demand Model (based on inputs from UPC for supply and Macroeconomic & Demographic Model for demand)

Abu Dhabi Real Estate Market Forecasts Abu Dhabi - Urban Planning Council April 2010
22
5 Retail Market
5.1 Introduction
The retail market has many of the same characteristics as the office market in Abu Dhabi. These include a
current shortage of international quality projects and an undersupply of retail floor space relative to the
potential demand. As with the office market, the current lack of retail space has resulted in a loss of spending
for Abu Dhabi, with some residents opting to travel to other major regional and global cities.
Increased spending by both residents and tourists, combined with the existing below average per capita
provision of retail space, will provide a favourable outlook for the Abu Dhabi retail sector over the next four
years.
5.2 Current Retail Supply
The total retail supply in Abu Dhabi equates to approximately 1.4 million sq.m of GLA. A distinctive
characteristic of the Abu Dhabi market is that the majority of this space is in non mall retail formats (e.g. street
shops); with only 36% of the total GLA being in enclosed malls or shopping centres, of which Marina Mall and
Abu Dhabi Mall are the largest.
Breakdown of Retail by Type (2009)
Source: Project Team Analysis

Abu Dhabi Real Estate Market Forecasts Abu Dhabi - Urban Planning Council April 2010
23
Retail Type, Area & Required Supporting Population
Type of Centre Range of GLA (m2) Minimum Support Population Required
Convenience Less than 3,000 < 5,000
Neighbourhood 3,000-10,000 5,000-40,000
Community 10,000-30,000 40,000-150,000
Regional 30,000-90,000 150,000+
Super Regional 50,000-150,000 300,000+
Source: The Project Team based upon retail classification by the Urban Land Institute
There is a significant shortage of available retail space including high end street retail at present and the
existing shopping malls are currently experiencing high occupancy rates (above 95%). There is also a waiting
list for retail space within many of the existing malls, which is an indication of the lack of options available to
retailers in the current market.
5.3 Future Retail Supply
The present stock of 1.4 million sq.m (GLA) of retail space within the Abu Dhabi metropolitan area is poised to
grow to around 1.9 million sqm by 2011 and 2.5 million sq.m by 2013 with the addition of a number of major
new centres. The major additions to retail supply over the short term include the Yas Mall in Yas Island,
Paragon Mall in Reem Island, the Souk and Emporium at Central Market, Mushrif Mall, Capital Plaza and Al
Wahda City Extension.
The following graph provides a summary of the future retail supply in Abu Dhabi, with its geographical
distribution indicated in the table below:
Retail Short Term Future Supply (GLA sqm) (2009-2013)
2009 2010 2011 2012 2013
Total (yearly upcoming supply) 6,000 375,952 113,217 523,567 70,885
Total Supply (units) 1,426,361 1,802,313 1,915,530 2,439,097 2,509,982
Source: Real Estate Supply & Demand Model based on discussions with UPC and developers

Abu Dhabi Real Estate Market Forecasts Abu Dhabi - Urban Planning Council April 2010
24
Distribution of Retail Supply (GLA/m2) - 2009-2013
2008 2009 2010 2011 2012 2013
Mainland North - 1,000 1,000 74,380 1,000
AD Island - 187,233 21,372 64,484 17,806
North AD Island - 55,471 4,500 61,714 4,500
Mainland South - 90,600 81,114 20,665 8,905
Mainland Central 6,000 1,500 5,231 6,324 17,948
Islands - 40,148 - 296,000 20,726
Total (yearly upcoming supply) 6,000 375,952 113,217 523,567 70,885
Total Supply (GLA/m2) 1,420,361 1,426,361 1,802,313 1,915,530 2,439,097 2,509,982
Source: Real Estate Supply & Demand Model based on discussions with UPC and developers
5.4 Current Retail Demand
Based upon the level of spending available from the resident population and visitors to Abu Dhabi, it is
estimated that the market could support a total of 2.1 million sqm (GLA), which suggests that Abu Dhabi is
currently under supplied with retail space of approximately 700,000 sq.m.
The current retail demand is dominated by residents of the city, with tourists comprising just 9% of the total
estimated retail spending in Abu Dhabi in 2009.
5.5 Future Retail Demand
The demand for retail space in Abu Dhabi is expected to increase up to 2013, being driven by increased
spending by residents and higher tourist levels with demand increasing from 2.1 million sq.m (GLA) in 2009 to
2.3 million sq.m (GLA) by 2013.
Opportunities are expected to arise for further retail space to support the new master planned residential
communities outside of the main Abu Dhabi Island (where most of the current stock of retail floor space is
located).
Abu Dhabi currently experiences a significant divergence of retail spending to Dubai, as residents are attracted
to the wider range of retail centres available in the Emirates northern neighbour. As new centres offering new
retail formats and experiences are completed in Abu Dhabi, much of this local demand will be retained within
Abu Dhabi.
The emergence of Abu Dhabi as an international tourist destination will also support the future growth of the
city’s retail sector. It is projected that tourist spending will increase to more than 11% of the total retail
spending in Abu Dhabi by 2013.
5.6 Retail Market Outlook
Given the growing resident population, the abundance of private wealth and the increasing level of tourists
visiting Abu Dhabi, there is demand to support additional retail floor space in the city over the next few years.
Abu Dhabi Real Estate Market Forecasts Abu Dhabi - Urban Planning Council April 2010
25
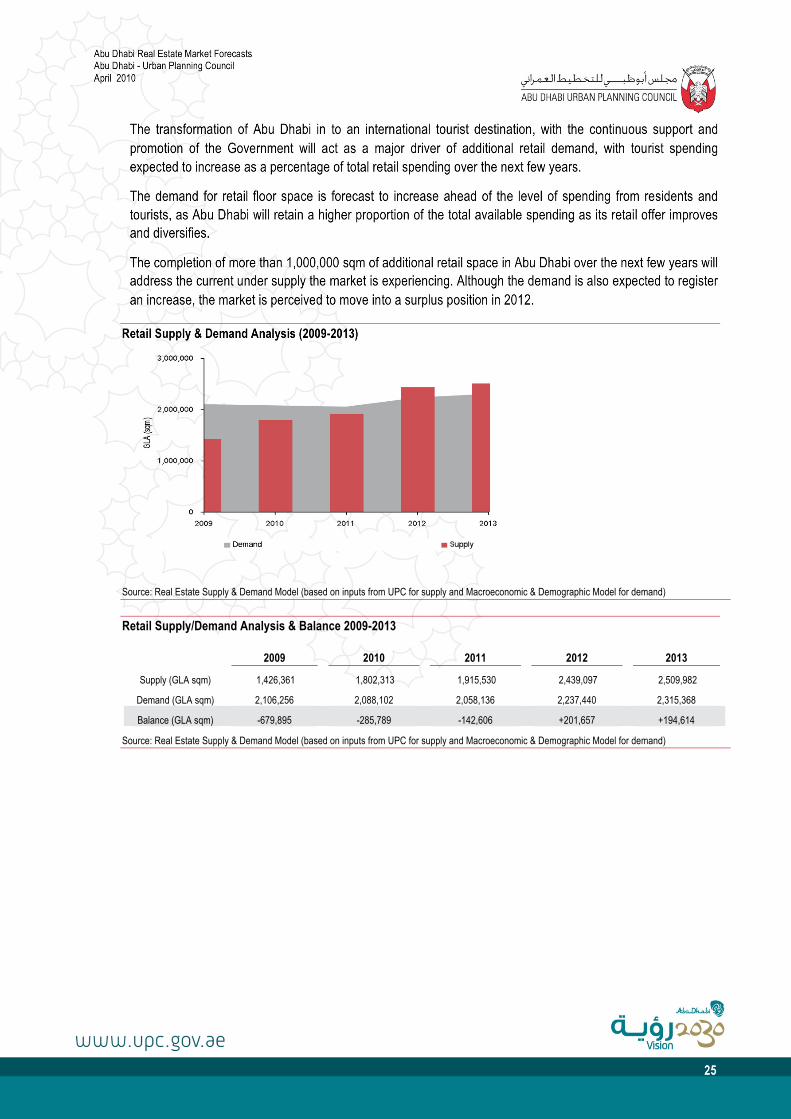
The transformation of Abu Dhabi in to an international tourist destination, with the continuous support and
promotion of the Government will act as a major driver of additional retail demand, with tourist spending
expected to increase as a percentage of total retail spending over the next few years.
The demand for retail floor space is forecast to increase ahead of the level of spending from residents and
tourists, as Abu Dhabi will retain a higher proportion of the total available spending as its retail offer improves
and diversifies.
The completion of more than 1,000,000 sqm of additional retail space in Abu Dhabi over the next few years will
address the current under supply the market is experiencing. Although the demand is also expected to register
an increase, the market is perceived to move into a surplus position in 2012.
Retail Supply & Demand Analysis (2009-2013)
Source: Real Estate Supply & Demand Model (based on inputs from UPC for supply and Macroeconomic & Demographic Model for demand)
Retail Supply/Demand Analysis & Balance 2009-2013
2009 2010 2011 2012 2013
Supply (GLA sqm) 1,426,361 1,802,313 1,915,530 2,439,097 2,509,982
Demand (GLA sqm) 2,106,256 2,088,102 2,058,136 2,237,440 2,315,368
Balance (GLA sqm) -679,895 -285,789 -142,606 +201,657 +194,614
Source: Real Estate Supply & Demand Model (based on inputs from UPC for supply and Macroeconomic & Demographic Model for demand)

Abu Dhabi Real Estate Market Forecasts Abu Dhabi - Urban Planning Council April 2010
26
6 Hotel Market
6.1 Introduction
Abu Dhabi has embarked on an active campaign to improve its tourism and leisure offering. Abu Dhabi’s
various government entities have been investing in large scale masterplanned projects such as Saadiyat
Island and Yas Island that include major visitor attractions and event venues along with luxurious hospitality
developments introducing international hotel brands.
In addition to Saadiyat Island and Yas Island, large scale developments related to tourism include a plan to
transform the entire coastline, including the Al Raha masterplanned area to create a new boardwalk, together
with a wide range of new quality hotel offerings across the city.
Recent trends in the development of the Abu Dhabi hotel market can be summarised as follows:-
Limited additions to supply from 2000 to 2008, although 2009 saw a significant level of new room
inventory, particularly at Yas Island and the Grand Mosque District.
High occupancy levels and room rates – with Abu Dhabi being the strongest performing hotel market in
MENA region in 2008.
While occupancies and room rates have both fallen in 2009, Abu Dhabi has continued to out perform
other regional markets.
Abu Dhabi’s hotel sector has been less impacted by the global financial crises than other regional
markets given its strong focus on the corporate and government sectors.
Leisure travel is currently under represented although this situation is expected to change with
increased leisure offerings over the next 2 – 3 years. The hosting of the first Abu Dhabi F1 Grand Prix
at the newly constructed circuit on Yas Island represents the first of a number of major initiatives aimed
at propelling the city as an increasingly viable leisure travel destination.
The continued expansion of the national airline (Etihad) and the Abu Dhabi airport have increased
demand and supported the growth of the hotel market in Abu Dhabi.
The development and expansion of the Abu Dhabi National Exhibition Centre (ADNEC) has enabled
the emirate to generate further hotel demand specifically within the MICE (Meetings, Incentives,
Conferences and Exhibitions) segment of the market.
6.2 Current Hotel Supply
Based on data from the Abu Dhabi Tourism Authority (ADTA), the total stock of hotel rooms (including rest
houses and serviced apartments) at the end of 2009 was approximately 13,500.
Approximately 60% of the total quality hotel supply is managed by international management companies
(Accor, Hilton, InterContinental Hotel Group, Kempinski, Shangri-La, Millenium, Starwood and Wyndham). A
further 18% of the quality supply is managed by regional management companies.

Abu Dhabi Real Estate Market Forecasts Abu Dhabi - Urban Planning Council April 2010
27
6.3 Future Hotel Supply
With the government’s objective of developing the hospitality sector, strengthening the corporate market and
developing the leisure segment, hotel supply is expected to continue to increase significantly over the next few
years. Based on a ‘project by project’ assessment of known developments, it is estimated that the total supply
of hotel rooms in Abu Dhabi will double, from its current level of 13,500 rooms to approximately 26,500 rooms
by the end of 2013. Large scale tourism projects such as Saadiyat Island, Yas Island and Al Raha Beach will
noticeably transform and rejuvenate the hotel market over time.
Hotel Supply (rooms) (2009-2013)
2009 2010 2011 2012 2013
Total (yearly upcoming supply) 2,620 2,908 2,687 3,458 4,063
Total Supply (units) 13,502 16,381 19,041 22,464 26,486
Source: Real Estate Supply & Demand Model based on discussions with UPC and developers
This supply is broken down by area in the following table.
Hotel Supply (rooms) by Area (2009-2013)
2008 2009 2010 2011 2012 2013
Mainland North - - - - -
AD Island 281 1,630 1,448 1,904 840
North AD Island - 421 1,091 584 378
Mainland South - - - 90 450
Mainland Central 473 - 148 - 1,009
Islands 1,866 857 - 880 1,386
Total (yearly upcoming supply) 2,620 2,908 2,687 3,458 4,063
Total Supply (rooms) 11,018 13,502 16,381 19,041 22,464 26,486
Source: Real Estate Supply & Demand Model based on discussions with UPC and developers

Abu Dhabi Real Estate Market Forecasts Abu Dhabi - Urban Planning Council April 2010
28
6.4 Current Hotel Demand
Abu Dhabi has been one of the strongest performing hotel markets in the world over the past few years as the
number of hotel visitors to the city has doubled from around 800,000 in 2002 to more than 1.5 million in 2009.
The corporate sector is the strongest component of the Abu Dhabi market, with the business and MICE
sectors accounting for over 60% of all visitors to the city in 2009.
This demand has been translated into very strong growth in average daily room rates (ADRs). Abu Dhabi had
one of the lowest ADRs in the region in 2004 (AED 286/USD 78). Since then, the market has experienced a
remarkable average growth rate of 40%, with ADRs reaching AED 1,076 (USD 293) in 2009.
6.5 Future Hotel Demand
Based on the Real Estate Supply & Demand model prepared for this assignment, there is a current demand
for some 13,500 hotel rooms in Abu Dhabi. By 2013 the demand for hotel rooms is expected to reach close to
20,000 rooms (an increase of approximately 45%) riding on the back of strong economic growth and the
continued expansion of the tourist industry.
6.6 Hotel Market Outlook
Despite mismatches in certain locations and types of property, the overall demand and supply conditions are
currently relatively balanced in the Abu Dhabi hotel market. Despite the continued growth in demand the
significant level of planned supply of new hotel rooms is expected to shift the market into a situation of
oversupply from 2010 onwards. By the end of 2013, there is forecast to be 26,500 hotel rooms in the
Metropolitan, as opposed to a demand for around 19,700 rooms.
Hotel Supply & Demand (2009 – 2013)
Source: Real Estate Supply & Demand Model (based on inputs from UPC for supply and Macroeconomic & Demographic Model for demand)

Abu Dhabi Real Estate Market Forecasts Abu Dhabi - Urban Planning Council April 2010
29
Hotel Supply & Demand (2009-2013
2009 2010 2011 2012 2013
Supply (rooms) 13,502 16,381 19,041 22,464 26,486
Demand (rooms) 13,525 14,702 16,079 17,770 19,677
Balance (rooms) -23 +1,679 +2,962 +4,694 +6,809
Source: Real Estate Supply & Demand Model (based on inputs from UPC for supply and Macroeconomic & Demographic Model for demand)

Abu Dhabi Real Estate Market Forecasts Abu Dhabi - Urban Planning Council April 2010
30
7 Inferences and Critical Catalysts for Future Growth
7.1 Inferences
The real estate market in Abu Dhabi is currently under supplied in relation to the demand for residential, office
and retail premises, with the hotel market experiencing a rough balance between current demand and supply
levels.
These shortages have resulted in very low vacancy rates and rental / sale prices that are higher than for
competing space in other regional markets. This situation is negatively impacting the Abu Dhabi economy,
resulting in a significant loss of potential employment, spending and investment.
The real estate industry has responded to the ongoing shortages of quality product, with a large number of
new projects being announced in recent years, since the relaxation of land ownership laws, the publication of
the Abu Dhabi Plan 2030 and the release of major new development areas.
The market peaked in 2008 and entered into downturn in 2009 in line with the wider global economic
slowdown. As a result of the slowdown, many projects in the UAE have been delayed or cancelled due to a fall
in price and investor demand and lack of project funding due to an over reliance on pre-sales and the
reduction in debt financing. In spite of these delays and cancellations, significant levels of new supply are
expected to enter all sectors of the market between 2010 and 2013.
The retail and hotel markets would move into a potential surplus situation over the next three years. The office
market is expected to achieve a balance between supply and demand while the residential sector is expected
to remain undersupplied especially in the lower and mid market segments, with a shortfall of around 26,300
units remaining, by 2013.
7.2 Understanding Critical Catalysts beyond the Projections
The expected increase in employment, population and economic activity on which the demand projections
outlined in this study are based, are dependent on the successful implementation of a number of the initiatives
outlined in the Abu Dhabi Economic Vision 2030. These include the following:
Growing Abu Dhabi’s Employment & Population Base
It should be recognised that currently Abu Dhabi’s clear strength is derived from its oil and gas based economy
and its abundant private wealth. Abu Dhabi currently has a relatively small pool of labour and a developing
skills base. The success of initiatives to up-skill the Emirati population and attract expatriates that can
contribute to the development of the economy will be an essential pre-requisite for the continued growth of real
estate demand.
The economy will continue to rely on the continual influx of expatriates. Current restrictions on residency
permits and visas, and restrictions on homeownership are prohibitive and not conducive to the long term
retention of a skilled expatriate workforce. A relaxation of these current restrictions would provide a major
boost to real estate demand.

Abu Dhabi Real Estate Market Forecasts Abu Dhabi - Urban Planning Council April 2010
31
Promoting Company Start-up and Growth
Achieving the rapid economic development of high-growth sectors of the economy also requires substantial
developments to the regulatory framework. Abu Dhabi currently has limited free zones (where companies are
able to have full corporate ownership and control) and the process for starting up new businesses is
complicated and often bureaucratic. For companies engaged in the knowledge-based industries that the
Government is targeting there also needs to be developments to ensure the protection of intellectual property
rights.
The Government is taking active steps to develop new industries through university science parks and through
the activities of Government entities such as Mubadala and Zones Corp. In spite of these initiatives, the
process of setting up a new business in Abu Dhabi remains challenging and this needs to be addressed to
stimulate inward investment.
Regulatory Reform
Related to the point above, Abu Dhabi needs to establish a business and legal environment comparable to
other developed economies. Central themes of the Government’s policy agenda include establishing a
dynamic open economy, a large empowered private sector, a sustainable knowledge-based economy and a
transparent regulatory environment.
Progress is being made to establish a legal regime that will sustain high levels of foreign investment and
improving market transparency.
For the real estate sector specifically, proposals are in place for new legislation relating to strata law, trust
account / escrow law, the creation of a real estate regulator, obligation to obtain permits and title prior to pre-
sale and mortgage law. These reforms are required urgently in order to ensure greater regulation and control
over the real estate sector.
Transparency
As real estate markets become more global, the relative openness or transparency of different markets has
emerged as an increasingly important consideration for investors, occupiers and other real estate
stakeholders. Markets benefiting from improved transparency and greater openness tend to be those in which
it is easier to conduct business.
While the government of Abu Dhabi is making great efforts to substantially improve the transparency of the
real estate sector and other sectors of the economy, it is clear that more needs to be done to bring Abu Dhabi
in line with other leading markets internationally.
Land Registry
One of the main elements that define transparent real estate markets is the operation of an accurate and
publically accessibility land and property registry system. The Abu Dhabi government is considering options for
improving the operation of the current land and property registry system. Improvements in this area are
another essential component in stimulating the additional demand for real estate assumed in this study.
Abu Dhabi Real Estate Market Forecasts Abu Dhabi - Urban Planning Council April 2010
32
Technical Appendices
Appendix A - Technical Report of Macroeconomic & Demographic Model.......................................... 33
I. Introduction........................................................................................................................................................ 33
II. GDP................................................................................................................................................................... 33
III. Investment ......................................................................................................................................................... 34
IV. Employment....................................................................................................................................................... 34
V. Incomes and Spending...................................................................................................................................... 36
VI. Tourism.............................................................................................................................................................. 37
VII. Demographics ................................................................................................................................................... 37
Appendix B - Technical Report of Real Estate Demand Model .............................................................. 38
VIII. Approach ........................................................................................................................................................... 38
IX. Residential Sector ............................................................................................................................................. 38
X. Office Sector...................................................................................................................................................... 39
XI. Retail Sector ...................................................................................................................................................... 40
XII. Hotel Sector....................................................................................................................................................... 42
Appendix C - Technical Report of Real Estate Supply Model ................................................................ 43
XIII. Current Supply................................................................................................................................................... 43
XIV. Future Supply .................................................................................................................................................... 43
XV. Stock Withdrawals ............................................................................................................................................. 44

Abu Dhabi Real Estate Market Forecasts Abu Dhabi - Urban Planning Council April 2010
33
Appendix A - Technical Report of Macroeconomic & Demographic Model
I. Introduction
This document describes the Macroeconomic & Demographic model developed for the current study. This
model has been used to generate the baseline forecasts of demand for each sector of the real estate market
(employment, population, tourist numbers, retail spending) in a theoretically consistent fashion. These
forecasts have then been used as an input into the real estate supply and demand model.
In most cases the historical data is taken from Abu Dhabi sources with little estimation based on other
countries. The coefficients used in forecasting are also based on Abu Dhabi data wherever possible but data
shortages and the need for theoretical robustness has required data from other markets to be used in
calibrating the model in a number of areas.
The main characteristics of the model are:
A sector breakdown of GDP and employment.
GDP growth has been based on increases in world demand, capacity and domestic population and
demand.
Nominal investment demand depends on nominal GDP and hence, is sensitive to the oil price.
Employment growth is driven by real GDP growth.
Given the low dependency ratio of the non-citizen (expat) population, there is a strong relationship
between employment growth and population growth.
Tourism is forecast to grow in line with world demand and increases in capacity in Abu Dhabi.
Retail spending is the sum of spending by residents and tourists. Residents’ spending increases in line
with residents’ incomes and tourist spending in line with tourist nights.
The latest official data on Abu Dhabi is for 2008, which has been used as the base year for this model. While
the model has been developed for the period 2008-2030, this report is confined to the findings over the shorter
timeframe (2008 – 2013).
II. GDP
The Macroeconomic & Demographic model captures the key features of growth in the Abu Dhabi economy
and the linkages between Abu Dhabi’s GDP and world demand. The model reflects the extent to which each
sector is dependent on the world economy and capacity augmentation within Abu Dhabi.
For some sectors (e.g.: manufacturing and financial services), GDP in Abu Dhabi is sensitive to world demand
but will increase as the local capacity (defined as the capital stock by sector) builds up. Other sectors (e.g.:
transport, storage and communications; real estate and business services) are more dependent on cross
sectoral demand within Abu Dhabi. The construction sector is largely driven by investment levels.

Abu Dhabi Real Estate Market Forecasts Abu Dhabi - Urban Planning Council April 2010
34
Given the lack of available time series data for Abu Dhabi GDP, time series estimation techniques can not be
utilised to calibrate the model. As an alternative, coefficients have been derived to reflect each sectors
dependency upon world demand, capital stock formation, and Gross Value Added (GVA) in other sectors.
The Model also identifies nominal GDP with a broad two-sector breakdown – oil and non-oil. Prices in the oil
sector are linked to world oil prices and the non-oil prices are driven by the world price of manufactured goods.
The real GDP estimates used in this study were obtained by taking the current price estimates by broad sector
from the Ministry of the Economy and deflating them by sector level implicit price deflators for the UAE as a
whole (also taken from the Ministry of the Economy). Estimated real GDP for Abu Dhabi as a whole is the sum
of the sector estimates. This estimate is not consistent with the aggregate estimate of real GDP in Abu Dhabi
produced by the Ministry of the Economy (between 2001 and 2008 the GDP estimate used here increases at
an average annual rate of 11.6% per annum compared to 10% per annum in the Ministry of the Economy
estimate). The study uses the alternative estimate because disaggregated sector level estimates were needed
to inform the projections of employment and economic activity that underpin the projections of space
requirements. The inconsistency implies that the assumption of constant sector level price deflators across
Abu Dhabi as a whole is not valid. The simple alternative of constraining the initial set of sector level real GDP
estimates to sum to the Ministry of the Economy's estimates was not used as this implies that the discrepancy
was shared equally across sectors and this is not necessarily true. Investigation of the discrepancy, in fact,
implies that most of the difference between the two GDP estimates lies in the oil sector and that the two
estimates of non-oil GDP are likely to be much closer.
The historical discrepancy in aggregate GDP estimates has little impact on the projections of employment and
space needs. GDP in the oil sector is assumed to increase in line with oil production in the future and this
assumption would not change with a revision to the historical estimates and employment in the oil sector
assumes a relationship with production that would still hold with the new data. More importantly, GDP (and
employment) in the non-oil sectors is not likely to be significantly different to the levels and growth rates implicit
in the Ministry of the Economy's aggregate GDP figures.
III. Investment
Nominal (or current price) investment is determined by an equation which links it to lagged nominal GDP which
is taken as a measure of affordability and demand.
Aggregate fixed investment is another important factor in the model as it determines the total amount of
investment available for sector level capacity building. It also provides a link between oil prices, affordability
and investment, as higher oil prices increase nominal GDP which, in turn, will increase nominal investment.
IV. Employment
The model provides forecasts of both employment and labour productivity in Abu Dhabi Emirate; this provides
the basis for estimates of office-based employment in Abu Dhabi Metropolitan.
Employment in Abu Dhabi Emirate
Employment growth in the Emirate is linked to GDP by sector and to exogenous, labour augmenting,
productivity trends. All sectors (except agriculture and domestic services), are assumed to show positive
labour productivity growth (with productivity in agriculture and domestic services assumed to be flat).

Abu Dhabi Real Estate Market Forecasts Abu Dhabi - Urban Planning Council April 2010
35
Labour productivity growth is modest in most sectors, averaging 1.6 per cent per annum for non-oil GDP
growth for the 2008-2013 period. The exception is manufacturing where the estimates are an average of 3.9
per cent per annum. While this is much more rapid than experienced in Abu Dhabi in the past it is not
particularly rapid in comparison with the experience of many other countries with developing manufacturing
sectors.
Office-Based Employment
Figure 1 provides an analysis of the proportion of total employment undertaken in offices. This is derived from
an analysis of the occupational mix of employment in the household survey and an assessment of the
proportion of office-based occupations actually working in office premises undertaken by the Project Team.
Office-based workers are defined as workers in the following occupations:
Legislators, senior officials & managers
Professionals
Technicians and associate professionals
Clerks
Figure 1: Derivation of Office-Based Employment Coefficients
Percentage of
Employment in
Mainly Office-based
occupations Office-adjustment Final Coefficient
Agriculture, Live stock and Fishing 4.9 0.90 4.4
Mining and Quarrying :
- Crude oil and Natural Gas 71.2 0.90 64.1
- Quarrying 71.2 0.90 64.1
Manufacturing Industries 47.6 0.90 42.9
Electricity, Gas and water 58.4 0.90 52.5
Construction 43.3 0.50 21.7
Wholesale Retail Trade and Repairing Services 35.7 0.60 21.4
Restaurants and Hotels 20.1 0.60 12.0
Transports, Storage and Communication 51.3 0.90 46.1
Real Estate and business Services 63.9 1.00 63.9
Social and Personal Services 55.3 0.95 52.6
The Financial Corporations Sector 97.3 1.00 97.3
Government Services Sector 37.9 1.00 37.9
Explanation: The final coefficient is equal to the percentage of Employment in Mainly Office-based occupations multiplied by the office adjustment (which is the
proportion of those occupation groups who actually work in offices). For example, 20.1% of people working in Restaurants and Hotels are estimated to work in one
of the mainly office based occupations (Legislators, senior officials & managers, Professionals, Technicians and associate professionals and Clerks) but only 60 per
cent of these are estimated to actually work in offices (as opposed to working on site) giving a final coefficient of 12%.
Source: Employment in office-based occupations from Abu Dhabi Household Survey (2007/08); Project Team Analysis

Abu Dhabi Real Estate Market Forecasts Abu Dhabi - Urban Planning Council April 2010
36
Employment in Abu Dhabi Metropolitan
Figure 2 shows recent estimates of employment in Abu Dhabi Metropolitan as a percentage of that in the
Emirate as a whole.
Figure 2: Employment in Abu Dhabi Metropolitan
Source: 2007/8 Household Survey
Employment in Financial services has the biggest concentration in the city followed by mining (including oil and
gas). These ratios are assumed to remain constant from 2008 to 2013.
V. Incomes and Spending
Given the lack of time series data on incomes and spending in Abu Dhabi, forecasts have been created using
simple economic relationships such as spending increases in line with incomes rather than attempts to do
more sophisticated analysis (e.g.: examining the impact of changes in personal wealth on spending patterns).
The key inputs of income are taken from the 2007/08 Household Survey, which provides data on the make up
of household income (split by citizens’ and non-citizens’ households). These estimates have been adjusted to
reflect the estimated population and households in the population and census data and the total value of
income from employment from the National Accounts.
Total income from employment is equal to average earnings multiplied by total employment. The other
components of income are:
Income from self-employment – assumed to grow in line with income from employment
Property and rental Income – assumed to grow in line with real non-oil GDP.
Transfers – assumed to grow in line with population.
It is to be noted that the make up of income is very different for citizens and non-citizens households.
The proportion of total income spent on retail goods split by citizens and non-citizens households is taken from
the Household Survey. Estimates of tourist spending are added to spending by residents to give total retail
spending and total spending on hotels and restaurants.

Abu Dhabi Real Estate Market Forecasts Abu Dhabi - Urban Planning Council April 2010
37
VI. Tourism
The model forecasts total hotel nights based on an equation relating hotel night demand to world GDP as well
as capacity growth in the Abu Dhabi hotels and restaurants sector.
Estimates of total spend on accommodation (including food and other facilities) are taken from Abu Dhabi
Tourist Authority data, while spending per night has been based on estimates from Jones Lang LaSalle Hotels
for Dubai, as no comparable information is available in respect of Abu Dhabi.
Hotel night demand is divided into Meetings, Incentives, Conventions and Exhibitions (MICE), other Business,
Domestic and International Leisure.
VII. Demographics
The main linkages at the Emirate level are illustrated in the following flowchart:
The Citizens (Emirati) population is driven by an analysis of birth and death rates.
Citizens employment is determined by population and employment rates.
Non-citizens (or expat) Employment is equal to total employment less citizens’ employment.
Non-employed non-citizens are determined by an exogenous ratio of non-citizen non-employment to
non-citizen employment (the non-citizen’s dependency ratio).
Total population equals the citizens’ population plus the non-citizens population.
Figure 3: Main Linkages in the Demographic Model
Source: The Project Team
Population in Abu Dhabi Metropolitan
The most recent estimate of the Abu Dhabi District population is 969,000 as at 2009 (as per Statistics Centre
Abu Dhabi). This figure has been considered as the Abu Dhabi Metropolitan baseline for the Macroeconomic
and Demographic Model and the Real Estate Forecast Model.

Abu Dhabi Real Estate Market Forecasts Abu Dhabi - Urban Planning Council April 2010
38
Appendix B - Technical Report of Real Estate Demand Model
VIII. Approach
The demand assumptions undertaken are based on the Project Team’s in-depth knowledge of the Abu Dhabi
real estate market obtained through day to day interaction with major developers, occupiers and investors, as
well as macroeconomic and demographic forecasts from the Macroeconomic & Demographic Model (as
discussed in Appendix A above).
IX. Residential Sector
Assumptions
The Macroeconomic & Demographic model provides a forecast for the growth of the total population of
residents within the Abu Dhabi metropolitan area (broken down from the emirate level) as well as the split
between citizens (nationals) and non-nationals (expatriates).
Using this data as an input, forecasts of the demand for residential units in Abu Dhabi have been prepared,
based on the following key assumptions:
Household Size (nationals/non-nationals)
Household Size Breakdown by Nationals/Non-Nationals
2009 2010 2011 2012 2013
Avg. household size - Nationals 6.4 6.4 6.3 6.2 6.2
Avg. household size - Expatriates 3.5 3.4 3.4 3.4 3.3
Source: Abu Dhabi Household Income & Expenditure Survey (2008), Project Team Analysis
It must be stressed that the estimates of current and future residential demand contained within this report are
extremely sensitive to assumptions in respect of the average household size. The project team has estimated
current and projected future household size from a review of the current published data and its experience of
the Abu Dhabi real estate market, with no detailed surveys of average household size being undertaken for
this project. There is a need for more detailed empirical research on this subject and the proposed population
census to be undertaken in 2010 may provide valuable additional data which can be used to refine and adjust
the average household size and consequently the future demand for residential units in Abu Dhabi.
Income Breakdown by population

Abu Dhabi Real Estate Market Forecasts Abu Dhabi - Urban Planning Council April 2010
39
Income Breakdown by population
Income
Groups
Monthly
Income USD
Yearly Income
USD
A - -
B 8,992< 107,902<
C 8,991-6,540 107,901-78,474
D 6,538-4087 78,473-49,046
E 4,086-1,635 49,045-19,619
F 1,634> 19,618>
Source: Abu Dhabi Household Income & Expenditure Survey (2008), Project Team Analysis
Propensity to Share
Nationals / Expatriates, Propensity to Share
Dwelling type
Households
per dwelling
Studio apartments 1.0
1 bedroom apartments 1.0
2 bedroom apartments 1.3
3 bedroom apartments 2.0
Single Villas 1.0
Source: Project Team Assumptions
The other major factor influencing future residential demand is the extent to which the current latent demand (from
those families that now share villas and units) will be converted to actual demand. The expected fall in residential
rentals in the Abu Dhabi market will lead to many of those families currently sharing units being able to afford their
own accommodation, thereby unlocking latent demand
X. Office Sector
Assumptions
The Statistics Centre – Abu Dhabi provides a breakdown of workers by economic sector. This has further been
broken down at the level of the Abu Dhabi metropolitan area by the Project Team and the forecast number of
workers from present to 2013 has been ascertained by economic sector.

Abu Dhabi Real Estate Market Forecasts Abu Dhabi - Urban Planning Council April 2010
40
Office Workers by Sector (% share)
Business Sectors
Agriculture , Live stock and Fishing 4%
Mining and Quarrying 64%
Manufacturing Industries 43%
Electricity , Gas and water 53%
Construction 22%
Wholesale Retail Trade and Repairing Services 21%
Restaurants and Hotels 12%
Transports , Storage and Communication 46%
Real Estate and Business Services 64%
Social and Personal Services 53%
The Financial Corporations Sector 97%
Government Services Sector 38%
Source: Macroeconomic & Demographic Model, Project Team Assumptions
Floor Space Ratio (m2 per employee)
Based upon physical surveys of office space on Abu Dhabi Island, international benchmarks and local
knowledge of the space standards of major corporate occupiers, the average office space per employee has
been calculated to be approximately 15 sqm.
This office space per employee has been kept constant going forward with the assumption that these ratios will
remain the same even with the addition of newer quality office supply.
XI. Retail Sector
Assumptions
The most important assumptions in respect of the retail sector relate to the allocation of retail spending to
different retail formats and the level of turnover (retail spending per sq.m) that can be achieved in respect of
each retail format.
These assumptions have been derived from the following sources:-
Retail spending has been allocated to different retail formats in line with the breakdown of existing and
future supply in each of these formats.
Estimates of retail turnover (sales per sq.m of retail space) are not generally available within Abu
Dhabi. Estimates have therefore been made, based upon the Project Team’s knowledge of turnover
levels in Dubai.

Abu Dhabi Real Estate Market Forecasts Abu Dhabi - Urban Planning Council April 2010
41
Spending Behaviour by Mall Type, Residents
2009 2010 2011 2012 2013
Super Regional Mall 10% 10% 15% 15% 20%
Regional Mall 25% 25% 30% 30% 30%
Neighbourhood Mall 10% 15% 15% 15% 15%
Convenience Mall 5% 10% 10% 10% 10%
Non Malls 50% 40% 30% 30% 25%
Source: Project Team Assumptions
Spending Behaviour by Mall Type, Tourists
2009 2010 2011 2012 2013
Super Regional Mall 10% 15% 20% 20% 25%
Regional Mall 25% 25% 30% 30% 30%
Neighbourhood Mall 10% 10% 10% 10% 10%
Convenience Mall 5% 5% 5% 5% 5%
Non Malls 50% 45% 35% 35% 30%
Source: Project Team Assumptions
Retail Turnover (AED/p.a.)
2009 2010 2011 2012 2013
Super Regional Mall 11,550 12,128 12,734 13,371 14,039
Regional Mall 11,025 11,576 12,155 12,763 13,401
Neighbourhood Mall 9,975 10,474 10,997 11,547 12,125
Convenience Store 8,925 9,371 9,840 10,332 10,848
Non Malls 7,875 8,269 8,682 9,116 9,572
Source: Project Team Assumptions
There is very little available data on retail turnover (sales per sq.m) levels in Abu Dhabi. The project team has
therefore derived the above estimates based on its knowledge of centres in Dubai and elsewhere. The
forecasts of future retail demand are very sensitive to the assumed level of retail turnover in different retail
formats and changes in these assumptions could therefore have a significant impact on the actual demand for
additional retail floor space from 2010 to 2013.

Abu Dhabi Real Estate Market Forecasts Abu Dhabi - Urban Planning Council April 2010
42
XII. Hotel Sector
Assumptions
Forecasts of total visitor arrivals, average length of stay and total room night demand have been taken from
the economic and population model.
This total demand has been allocated across different types of hotel product based on research on the Abu
Dhabi market undertaken by in-house hotel specialists. The assumptions by hotel star have been undertaken
based on future additional upcoming supply year-on-year by grade as well the occupancy rate split up to 2013.
The breakup of demand by hotel type is shown in the following table.
Share of Hotel Nights by Hotel Type
2009 2013
1*- Economy 1% 0%
2*- Budget 3% 5%
3*- Midscale 27% 19%
4*- Upscale 30% 27%
5*- Upper Upscale 36% 43%
5*- Super Luxury 4% 5%
Source: Project Team Assumptions

Abu Dhabi Real Estate Market Forecasts Abu Dhabi - Urban Planning Council April 2010
43
Appendix C - Technical Report of Real Estate Supply Model
XIII. Current Supply
The current supply represents the total existing supply in 2008 plus the upcoming supply till end of 2009 and is
reflected as follows:
Residential Sector: This current residential stock at the end of 2009 is estimated to be 177,400 units.
This figure has been derived from data from the Abu Dhabi Distribution Company (ADDC) which shows
a total of 155,854 residential electricity connections across the Abu Dhabi metropolitan area as at
November 2008. This figure has been inflated to allow for new completions during 2009 and an
allowance for shared villas (a proportion of which operate from a single meter).
Office Sector: the current office supply has been provided according to an in-house survey conducted
in the Abu Dhabi metropolitan area.
Retail Sector: The current retail supply has been provided according to an in-house survey conducted
in September 2009 covering the retail market (malls and disorganised retail outlets) in the Abu Dhabi
metropolitan area.
Hotel Sector: The total number of hotel rooms (including serviced apartments) in the Abu Dhabi
metropolitan area is currently approximately 13,500 rooms based on data from Abu Dhabi Tourism
Authority (ADTA) and primary surveys conducted by Project Team.
XIV. Future Supply
Supply Forecasts
Estimates of short term future supply have been prepared on a project by project basis from 2008 to 2013.
This process has involved the following:
Data on individual projects has been compiled from various sources including the UPC’s own database on
both master developments and other potential projects. The Project Team has supplemented the list with data
from other market sources and its own future supply pipeline. An additional allowance has also been made for
extra floor space supply (2010 – 2013) from permits from the ADM. Any data obtained from developers has
been verified by the Project Team with site surveys / physical inspection of projects currently “under
construction” being undertaken where appropriate.
The Project Team has worked closely with the UPC and developers during this process. The objective has
been to reconcile differing data and agree a common set of assumptions and the resulting phasing and
materialisation from each individual project from 2010 to 2013.
As a result of the above process, an agreed future supply pipeline has been developed for the period 2010 to
2013. This comprises the basis of the short term supply forecasts presented in this report.
The residential supply is presented by number of units,
The office and retail supply by GLA (sqm) and
The hotel supply by number of rooms.

Abu Dhabi Real Estate Market Forecasts Abu Dhabi - Urban Planning Council April 2010
44
In cases where only GFA is provided, specific calculations were used to obtain the requested unit depending
on the sector and are defined as follows:
Office GLA (sqm) = Office GFA (sqm)*80%
Residential Number of units = Residential GFA*80% /125 sqm for apartments
Retail GLA (sqm) = Retail GFA (sqm)*60%
Hotel number of rooms = Hotel GFA (sqm)/100
The future supply has been phased on case by case development bases, which reflects the current situation of
each project. The phasing of each project was obtained through 3 stages:
1st Stage: UPC phasing sentiment - defined through meetings with UPC projects leaders
2nd Stage: Developers phasing sentiment – defined through meetings and discussions with the main
developers
3rd Stage: In-house phasing sentiment and market analysis
XV. Stock Withdrawals
Given the current under-supplied nature of the real estate market in Abu Dhabi, there is little incentive for
owners to withdraw older buildings for refurbishment or to clear the site for alternative uses. As the market
matures and becomes increasingly competitive in the future, it is assumed that some space will be withdrawn
(demolished) as it completes its lifecycle.
A withdrawal rate of 1% of the existing stock is therefore applied in each of our future supply forecasts. This
withdrawal is only applies in those years where supply exceeds demand as it is assumed that there will be no
incentive to withdraw or upgrade premises in those years where demand exceeds supply in that sector of the
market.

Abu Dhabi Real Estate Market Forecasts Abu Dhabi - Urban Planning Council April 2010
45
The UPC developed the Abu Dhabi Real Estate Forecasts in association with Jones Lang LaSalle – Middle
East and North Africa and Oxford Economics Ltd. - United Kingdom
We acknowledge the below organizations for their valuable feedback on the draft Real Estate Market
Forecasts:
Abu Dhabi Council for Economic Development
Statistical Centre Abu Dhabi

Abu Dhabi Urban Planning CouncilP.O.Box 62221Abu Dhabi, United Arab Emirates
مجلس أبوظبي للتخطيط العمراني ص.ب 62221
أبوظبي، اإلمارات العربية المتحدة
Tel: +971 2 409 6000Fax: +971 2 443 9443
www.upc.gov.ae