Embed Size (px)
Citation preview

SREE Spring 2013 Conference Abstract Template
Abstract Title Page Not included in page count.
Title: Academic Achievement and School-Wide Positive Behavior Interventions and Supports Authors and Affiliations: Nicholas A. Gage, Ph.D University of Connecticut George Sugai, Ph.D. University of Connecticut Timothy J. Lewis, Ph.D. University of Missouri
SREE Spring 2013 Conference Abstract Template A-1
Abstract Body Limit 4 pages single-spaced.
Background / Context: Description of prior research and its intellectual context.
Turning around chronically low-performing schools requires a multifaceted school-wide, systematic effort that includes strong leadership and data-based decision making (Herman, Dawson, Dee, Greene, Maynard, & Redding, 2008). School-wide efforts to turn-around low-performing schools should address the academic, social, and behavioral needs of all students (Borman, Hewes, Overman, & Brown, 2003). One evidence-based, systematic school-wide approach for addressing social and behavioral concerns in schools and, distally, increasing students’ access to academic instruction, is school-wide positive behavior interventions and supports (SWPBIS; Horner, Sugai, & Anderson, 2010). SWPBIS is associated with increased positive school climate (e.g., Bradshaw, Koth, Thornton, & Leaf, 2009), increased teacher self-efficacy (Kelm & McIntosh, 2012), decreased problem behaviors for the whole school (e.g., Bradshaw, Mitchell, & Leaf, 2010), and, potentially, increased academic achievement (Algozzine & Algozzine, 2009). SWPBIS is designed to improve learning environments by increasing (a) the amount of time students are in school (e.g., decreased out-of-school suspensions), (b) the proportion of minutes students are engaged in instruction, and (c) the level of academic engagement of students during instruction (Horner, Sugai, Smolkowski, Eber, Nakasato, Todd, & Esperanza, 2009). The underlying assumption is that by improving social behavior, schools have more time and ability to deliver effective curriculum and instruction (Putnam, Horner, & Algozzine, 2006). For students exhibiting problem behaviors, reducing discipline problems should increase exposure to classroom instruction and, in turn, facilitate academic skill acquisition (Luiselli, Putnam, Handler, & Feinberg, 2005; Walker & Shinn, 2002). However, to-date, this assumption has not been fully investigated. Sailor, Zuna, Cjoi, Thomas, McCart, and Rogers (2006) contend “understanding the explicit impact of SWPBS on academic behavior represents the next frontier of SWPBS” (p. 20). Review of SWPBIS and Academic Achievement
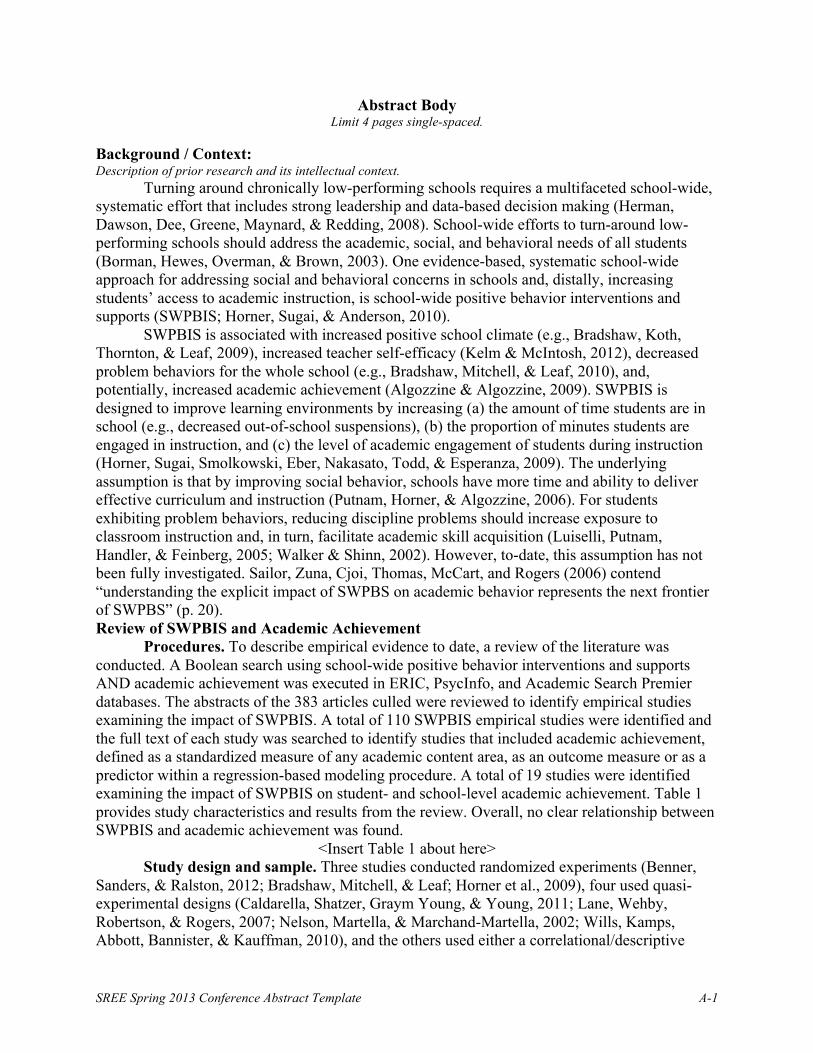
Procedures. To describe empirical evidence to date, a review of the literature was conducted. A Boolean search using school-wide positive behavior interventions and supports AND academic achievement was executed in ERIC, PsycInfo, and Academic Search Premier databases. The abstracts of the 383 articles culled were reviewed to identify empirical studies examining the impact of SWPBIS. A total of 110 SWPBIS empirical studies were identified and the full text of each study was searched to identify studies that included academic achievement, defined as a standardized measure of any academic content area, as an outcome measure or as a predictor within a regression-based modeling procedure. A total of 19 studies were identified examining the impact of SWPBIS on student- and school-level academic achievement. Table 1 provides study characteristics and results from the review. Overall, no clear relationship between SWPBIS and academic achievement was found.
<Insert Table 1 about here> Study design and sample. Three studies conducted randomized experiments (Benner,
Sanders, & Ralston, 2012; Bradshaw, Mitchell, & Leaf; Horner et al., 2009), four used quasi-experimental designs (Caldarella, Shatzer, Graym Young, & Young, 2011; Lane, Wehby, Robertson, & Rogers, 2007; Nelson, Martella, & Marchand-Martella, 2002; Wills, Kamps, Abbott, Bannister, & Kauffman, 2010), and the others used either a correlational/descriptive

SREE Spring 2013 Conference Abstract Template A-2
design (e.g., Simonsen, Eber, Black, Lewandowski, Sims, & Meyers, 2012) or case study (e.g., Sadler & Sugai, 2009). Seven of the 19 studies focused on schools as the unit of analysis, while the other focused on either all students within the schools or a sub-sample of students (e.g., high risk for behavior problems). Statewide examinations were conducted in Florida, Illinois, Maryland, and North Carolina.
Type/Level of SWPBIS Implementation. In order to fully describe the level of SWPBIS examined within each study, the independent variables were examined. Thirteen of the studies examined the impact of universal supports (i.e., tier 1) only; one study examined universal and secondary supports (Lane & Menzies, 2003); four studies examined the effects of schools implementing all three levels of the continuum (i.e., tier 1, 2 & 3) (McIntosh et al., 2006; Nelson et al., 2002; Sadler & Sugai, 2009; Sailor et al., 2006); and one study did not define levels of SWPBIS support implemented (LaFrance, 2009). To support inferences about implementation, most studies included at-least one measure of SWPBIS fidelity of implementation. Nine studies used the Schoolwide Evaluation Tool (SET; Horner, Todd, Lewis-Palmer, Irvin, Sugai, & Boland, 2004), one study used the Benchmarks of Quality (BoQ; Cohen, Kincaid, & Childs, 2007), one study used the Implementation Phases Inventory (IPI; Bradshaw, Debnam, Koth, & Leaf, 2009), one study used the Effective Behavior Support Survey (EBS; Safran, 2006)), five studies used a study-specific checklist or direct observation measure, and three studies did not report a fidelity of implementation measure (Caldarella et al., 2011; Luiselli et al., 2005; Nelson et al., 2002).
Measurement of academic achievement. Standardized achievement measures were used in only six studies, including the Woodcock-Johnson III Tests of Achievement (WJ-III) and the Woodcock-Johnson Tests of Achievement-Revised (WJ-R), Stanford Achievement Test (SAT-9), Metropolitan Achievement Test (MAT-7), Comprehensive Test of Basic Skills, and the Woodcock Reading Mastery Test (WRMT). Four studies utilized progress-monitoring assessments, including the Dynamic Indicators of Basic Early Literacy Skills (DIBELS) and one study used a non-standardized Curriculum-Based Measure in reading (CBM-R; Lane & Menzies, 2003). Eleven studies utilized state high-stakes tests from California, Florida, Hawaii, Illinois, Kansas, Maryland, New Hampshire, North Carolina, Oregon, and Washington. Two studies used grade point average (GPA) and one study used a district multiple measure that included the Scholastic Comprehension Test and the Harcourt Brace Reading Comprehension Tests. Across all studies, only seven used standard scores with continuous scaling, while most used either the percentage of students at or above basic performance on high stakes state assessments or as measured by standard measures (e.g., DIBELS). One study (LaFrance, 2009) used school mean standard scores on the Florida state assessment, but combined all grades together.
Findings for Reading. A number of studies examined reading and SWPBIS. Reading achievement was associated with the likelihood a school began implementing SWPBIS (Bradshaw & Pas, 2011), yet the only evidence suggesting positive effects on reading were Lane & Menzies (2003) who found small pre-post gains for students in a single elementary school, Luiselli, Putnam, Handler, and Feinberg (2005) who found moderate pre-post percentile rank increases in a single elementary school, and Sailor, Zuna, Choi, Thomas, McCart & Rogers (2006) who found moderate increases in the percentage of students at or above proficient on the California high stakes test for students attending three middle schools. Studies that examined SWPBIS and targeted reading programs together found limited evidence of reading gains, with Nelson, Martella, and Marchand-Martella (2002) finding mean percentile gains between treatment and control schools and Wills, Kamps, Abbott, Bannister, & Kauffman (2010) finding

SREE Spring 2013 Conference Abstract Template A-3
significant gains on Dynamic Indicators of Basic Early Literacy Skills (DIBELS), but minimal differences on the Woodcock Reading Mastery Test.
Findings for Math. Although no study individually targeted math as a single outcome measure, most of the studies included a measure of math achievement. Results were similar to reading for two case studies, which identified within-school increases in math achievement (Luiselli et al., 2005; Sailor et al., 2006). Differences from reading were found in Lassen, Steele, & Sailor’s (2006) and Muscott, Mann, and LeBrun’s (2008) case studies that found greater increases in math than in reading and Simonsen, Eber, Black, Sugai, lewandowski, Sims, and Meyers (2012) found significant positive differences for schools implementing SWPBIS with fidelity and those not implementing with fidelity. However, none of these studies included a control group. Of all the studies and outcomes, LeFrance’s (2009) dissertation did find statistically significant school-level differences between SWPBIS elementary schools and a sample of control elementary schools.
Overall findings. Starting with studies with the strongest validity for causal inference (Shadish, Cook, & Campbell, 2002), the experimental studies found no statistically significant differences between treatment schools (i.e., implementing SWPBIS) and control schools. The quasi-experimental studies also did not find many differences between treatment and control schools except for studies that also included an additional academic reading intervention along with SWPBIS. Descriptive results for within schools demonstrated academic achievement gains, but no differences when examining schools implementing with high fidelity and low fidelity. Purpose / Objective / Research Question / Focus of Study: Description of the focus of the research. The goal of this paper is to explicitly examine the impact of SWPBIS on school-wide academic achievement. First, a review of the SWPBIS literature was conducted to determine the impact of SWPBIS on academic achievement. Then, a longitudinal sate-level analysis of schools implementing SWPBIS and propensity score matched control schools was conducted to identify differential effects. Specific research questions were: R1. Are there significant differences between schools implementing SWPBIS with fidelity and schools not implementing with fidelity in mean school-level achievement? R2. Are there significant differences in mean school-level academic achievement SWPBIS schools and matched controlled schools? Setting: Description of the research location. This study included all schools in the state of Connecticut Population / Participants / Subjects: Description of the participants in the study: who, how many, key features, or characteristics. The state of Connecticut had a total of 1,157 schools with publicly available high stakes state assessment data from the Connecticut Department of Education and school characteristics data from the National Center for Educational Statistics (NCES) Common Core of Data in 2009-2010. A total sample of 936 schools had both high stakes state assessment data and school-level characteristics available from 2007 to 2011. Based on data from the Connecticut State Education Resource Center (SERC), 150 of the final sample schools implemented SWPBIS between 2007

SREE Spring 2013 Conference Abstract Template A-4
and 2011 and had both years of implementation and School-wide Evaluation Tool (SET) data available. Table 2 provides descriptive statistics for the sample.
<insert Table 2 about here> Intervention / Program / Practice: Description of the intervention, program, or practice, including details of administration and duration. School-wide Positive Behavior Interventions and Supports is a tiered model of prevention to reduce problem behaviors school-wide. The study included schools that (1) received professional development training on SWPBIS from CT’s State Education Resource Center (SERC), (2) had been implementing SWPBIS at the Universal level for at least 1-year, and (3) had an available fidelity of implementation measure. Research Design: Description of the research design. This study used a quasi-experimental design with schools as the unit of analysis. Control schools were identified from the CT population of public schools using propensity score matching. Data Collection and Analysis: Description of the methods for collecting and analyzing data. Data was collected from the CT State Department of Education and the U.S. Department of Education’s Common Core of Data. Academic achievement. Each year, all students in Connecticut are assessed in reading, mathematics, and writing using the Connecticut Mastery Test (CMT) for grades 3 through 8 and the Connecticut Academic Performance Test (CAPT) for grade 10, each providing a level of academic performance. These assessments are the state’s high stakes annual summative test. No academic achievement level was available for grades 9, 11 and 12. The reading test included two reading tests, the Degrees of Reading Power and a Reading Comprehension test. The mathematics test assessed student mastery of grade specific mathematics skills and concepts, and the writing tests included two tests, the Direct Assessment of Writing and the Editing and the Revising and editing tests. Both the CMT and the CAPT provide a grade-specific level of performance for each student in each academic content area (reading, mathematics, and writing). The levels include: Level 1 Below Basic, Level 2 Basic, Level 3 Proficient, Level 4 Goal, and Level 5 Advanced. The percentage of students within each school meeting each of the performance levels was included in the study. In addition, school-level scale scores by grade were also available and used in this study. The scale scores are grade specific and, unlike the levels, are not comparable across grades. Therefore, all modeling of scales scores was conducted at the individual grade level. School-level Characteristics. Using school-level data from the NCES Common Core of Data, school characteristics were matched to all included schools (n = 936). The school level of each school included: elementary (PK-3rd to 12th), middle (4th – 7th, 4th – 9th), high (7th – 12th to just 12th), and other (included any other configuration of grades within a school). The school’s urbanacity, which was defined as the census-based population density of the school’s district and used in the Common Core database, was included with values ranging form 1-8. A value of “1” represented a mid-size city (population > 100,000 and < 250,000) and a value of “8” represented a distant rural town (5 miles but less than or equal to 25 miles from an urbanized area).

SREE Spring 2013 Conference Abstract Template A-5
Other characteristics included whether or not the school was Title I, the size of the school (based on the number of students), the percentage of students receiving free and reduced lunch, and the percentage of students from diverse backgrounds (e.g. percentage of African-American students). Findings / Results: Description of the main findings with specific details. SWPBIS Within Group Differences by Fidelity of Implementation We examined treatment schools’ fidelity of implementation before examining differences between treatment and control schools. Fidelity of implementation was defined as an overall SET score 80%. Although an 80/80 rule is recommended (Horner et al., 2004), our approach is congruent with other experimental studies of SWPBIS using the SET as the measure of fidelity (e.g., Horner, et al., 2010). We coded SWPBIS schools that received an overall 80% SET score during any year of implementation as implementing with fidelity; all other schools were coded as not meeting fidelity criteria. Forty-six percent of the SWPBIS schools (N = 150) did not meet the fidelity criterion. The overall mean years of implementation was 3.11 (SD = .88) and a range of 2 years to 4 years. The mean years of implementation for schools implementing with fidelity was 3.53 (SD = .69) and the mean for schools not meeting the fidelity criteria was 2.62 (SD = .82). The primary outcome of interest was school-level academic achievement. First, we examined differences in the proportion of students at or above proficient on the CMT or the CAPT assessments across all three academic content areas (Reading, Math, and Writing) across all five school years. According to Table 3, the proportion of students at or above proficient for schools implementing with fidelity were not statistically significantly different across all academic content areas for all included years. To further assess differences, grade-level mean scale scores for all academic content areas in the 2010-2011 school year were assessed. Table 4 provides grade-level descriptive statistics, g scores, and statistically significant differences between SWPBIS schools implementing with fidelity and those not implementing with fidelity. For all SWPBIS schools, those not implementing with fidelity performed better on all 2010-2011 academic achievement measures. Four grade-level differences between SWPBIS schools implementing with fidelity and those not implementing with fidelity were statistically significant.
<Insert Table 3 about here> <Insert Table 4 about here>
Equivalence To increase the reliability and generalizability of study result, PSM control schools were identified from the population of available schools in Connecticut. Table 2 provides descriptive data for the treatment schools, all control schools, and the PSM control schools. As noted above, WWC defines equivalence as < .25 standard deviations between treatment and control groups. The g values between the treatment and all control schools indicates that equivalence is not established because the treatment group included more Title I schools, less schools from small cities, more mid-sized suburban schools, and had greater percentages of student with free/reduced lunch. The most important group differences were on the baseline academic measure, which serve as the outcome measure in this study. Overall, all control schools in Connecticut performed better than the treatment schools on all baseline academic measures. Therefore, no further comparisons are made between these two groups. Equivalence is established for the treatment and PSM control schools, with all variables, including the baseline academic achievement measures, with g values < .25. Estimates of Treatment Effects

SREE Spring 2013 Conference Abstract Template A-6
To maintain our treatment sample size, we did not remove treatment schools for not meeting the fidelity of implementation criterion. This decision based on the lack of differences in the proportion of students at or above proficiency and the high achievement of the treatment schools not meeting the fidelity criterion. First, we examined the proportion of students within treatment and control schools at or above proficient on the CMT and CAPT assessments. Table 5 provides the grade-level proportion of students across all included years. No statistically significant differences in proportions of students at or above proficient were identified. Although schools were matched during the baseline school year, equivalence was maintained. However, for all 2010-2011 content areas, control schools proportions were greater than treatment schools
<Insert Table 5 about here> Next, we focused on academic outcomes for the 2010-2011 school year. Table 6 provides
descriptive statistics, g, and statistically significant differences between treatments and control schools on mean grade-level scale scores. Across all grade-levels and content areas, there were no statistically significant differences between treatment and control schools. Fifteen of the twenty-one comparisons resulted in negative effect sizes, indicating the PSM control schools mean grade-level scale scores were higher than treatment schools, although only 6th grade math had an effect size considered substantively important by the WWC. Because no statistically significant differences were found between treatment and control schools on the last measurement period, grade-specific slopes were not modeled. Conclusions: Description of conclusions, recommendations, and limitations based on findings. The goal of this study was to confirm the findings from the SWPBIS and academic achievement literature and utilize a more sophisticated approach. Based on the literature review, no school-level differences between schools implementing SWPBIS with or without fidelity and control schools were found for academic achievement, including reading and math. The results of the state-level longitudinal study confirm these findings. The results of this study suggest that SWPBIS alone does not affect school-level academic achievement as measured by summative state high stakes tests. Fidelity of Implementation Before assessing school-level differences between treatment and control schools, we wanted to assess whether or not differential school-level outcomes were present for those implementing with fidelity and those not implementing with fidelity. It is important to note that the measure used only assessed fidelity at the primary, or universal, level. Based on the results in Table 3, it was clear that schools not implementing with fidelity consistently had more students at or above proficient on the CMT and CAPT. During the 2010-2011 school year, schools not meeting fidelity performed better across all grade levels, with significant differences found in 5th grade. These results suggest that, in Connecticut, fidelity of implementation does not impact academic achievement, and, when it does, those not implementing with fidelity perform higher in reading, math and writing. Treatment Effects We used PSM control schools to assess school-level academic achievement differences with treatment schools. Table 2 indicated that comparing all control schools, which effectively represent the population of potential comparison schools, was a biased comparison because of the lack of equivalence. The PSM approach created an equitable control group for causal

SREE Spring 2013 Conference Abstract Template A-7
inference within a quasi-experimental design. Across all measures and all grades, no statistically significant differences between groups were found. These results suggest that SWPBIS does not affect school-level academic achievement. Limitations Although the study findings are robust, a few limitations necessitate highlighting. First, this study used two sources of existing data and did not conduct a randomized experiment. All school-level information was collected from publicly available data and the SET scores, which also indicated which schools were trained in and implementing SWPBIS, were made available by SERC. Because we used PSM control schools, similar to the recommendations in Forston, Verbitsky-Savitz, Kopa, and Gleason (2012), the study was a well-executed quasi-experimental design. Nonetheless, until confirmed by an RCT, the findings are tenuous. Second, we had some concerns about the reliability of the SET scores based on the patterns of scores (i.e., meeting criteria one year and not the next). We chose to use them for three reasons: (a) because they were the state sanctioned and reported scores by the state agency conducting all SWPBIS training in Connecticut, (b) because there was no way to independently verify the reliability of the scores, and (c) because all SET scores were collected by staff trained by a team lead by a local university with SWPBIS expertise. Although we would have preferred to independently assess fidelity, we could not within the scope of this study. Lastly, we had hoped to apply more sophisticated longitudinal random effects models, but chose not to. Our decision was based on the descriptive findings that indicated no slope effects would have been present. Future studies should apply more robust statistical models. Implications for Research SWPBIS is a systematic evidence-based approach for addressing problem behaviors school-wide, but the results of this study suggest SWPBIS alone does not affect school-level academic achievement. Although these results may appear concerning, they need to be interpreted with caution for two reasons. First, the goal of the study was to examine school-level academic achievement because it is typically used as the metric for both policy/practice (Annual Yearly Progress) and research (school turnaround). School-level academic achievement is a single score, specifically; a school’s mean grade-level scale score or the proportion of students at or above a criterion (i.e., at or above proficient). These measures are not sensitive to the distributional characteristics of scale scores and are not sensitive to small increases in student achievement. If SWPBIS positively affected the academic achievement of the students with the greatest problem behaviors (~5% of students), increases in their summative assessments may not significantly increase the school-level mean academic achievement or the proportion of students at or above proficient.
Second, although SWPBIS increases students’ access to instruction, SWPBIS does not directly impact instruction. If instruction is not effective, increasing access to it will not increase student success. The literature review indicated that when SWPBIS was paired with academic interventions, increases were found. By pairing effective interventions with effective behavior support, increases across both outcomes are found. Research should examine whether or not academic interventions with and without SWPBIS have differential effects on school-level academic achievement.
Although we hoped to find statistically significant effects, we feel that these findings are important and should be highlighted. The analyses conducted used mostly publicly available data, with the only exception being SET scores. Therefore, any research team could have conducted this study and the results could be misinterpreted. SWPBIS alone does not

SREE Spring 2013 Conference Abstract Template A-8
significantly impact school-level academic achievement, but, as noted above, this finding should be expected based on who SWPBIS targets and the outcomes it focuses on. Conclusions SWPBIS is an evidence-based practice for addressing school-wide problem behavior. However, SWPBIS alone does not change school-level academic achievement. This contradictor findings in this study suggests that research and practice should work to combine academic and behavioral models to increase the likelihood of increasing school-level academic achievement.
Appendices
Not included in page count. Appendix A. References References are to be in APA version 6 format. Algozzine, B., & Algozzine, K. (2009). Facilitating academic achievement through schoolwide
positive behavior support. In W. Sailor, G. Dunlap, G. Sugai, & R. Horner (Eds.). Handbook of positive behavior support (pp. 521-550). New York, NY: Springer.
*Benner, G. J., Nelson, J. R., Sanders, E. A., & Ralston, N. C. (2012). Behavior intervention for
students with externalizing behavior problems: Primary-level standard protocol. Exceptional Children, 78(2), 181-198.
Borman, G. D., Hewes, G. M., Overman, L. T., & Brown, S. (2003). Comprehensive school
reform and achievement: A meta-analysis. Review of Educational Research, 73(2), 125-230. doi:10.3102/00346543073002125
Bradshaw, C. P., Debnam, K, J., Koth, C., & Leaf, P. J. (2009). Preliminary validation of the
Implementation Phases Inventory for assessing fidelity of school-wide positive behavior supports. Journal of Positive Behavior Interventions, 11, 145-169
Bradshaw, C. P., Leaf, C. W., Thornton, L. A., & Leaf, P. J. (2009). Alteraing school climate through school-wide positive behavioral interventions and supports: Findings from a group-randomized effectiveness trial. Prevention Science, 10, 100-115. doi: 10.1007/s11121-008-0114-9
*Bradshaw, C. P., Mitchell, M. M., & Leaf, P. J. (2010). Examining the effects of schoolwide
positive behavioral interventions and supports on student outcomes: Results from a randomized controlled effectiveness trial in elementary schools. Journal of Positive Behavior Interventions, 12(3), 133-148. doi: 10.1177/1098300709334798
*Bradshaw, C. P., & Pas, E. T. (2011). A statewide scale up of positive behavioral interventions
and supports: A description of the development of systems of support and analysis of adoption and implementation. School Psychology Review, 40(4), 530-548.
*Caldarella, P., Shatzer, R. H., Gray, K. M., Young, K. R., & Young, E. L. (2011). The effects of
school-wide positive behavior support on middle school climate and student outcomes. Research in Middle Level Education Online, 35(4), 1-14.

SREE Spring 2013 Conference Abstract Template A-9
Cohen, R., Kincaid, D., & Childs, K. E. (2007). Measuring school-wide positive behavior
support implementation: Development and validation of the Benchmarks of Quality. Journal of Positive Behavior Interventions, 9, 203-213.
*Ervin, R. A., Schaughency, E., Goodman, S. D., McGlinchey, M. T., & Matthews, A. (2006).
Merging research and practice agendas to address reading and behavior school-wide. School Psychology Review, 35(2), 198-223.
Fortson, K., Verbitsky-Savitz, N., Kopa, E., & Gleason, P. Using an experimental
evaluation of charter schools to test whether nonexperimental comparison group smethods can replicate experimental impact estimates. NCEE Technical Methods Report 2012- 4019. Washington, DC: National Center for Education Evaluation and Regional Assistance, Institute of Education Sciences, U.S. Department of Education, 2012.
Herman, R., Dawson, P., Dee, T., Greene, J., Maynard, R., Redding, S., and Darwin, M.
(2008). Turning Around Chronically Low-Performing Schools: A practice guide (NCEE #2008-4020). Washington, DC: National Center for Education Evaluation and Regional Assistance, Institute of Education Sciences, U.S. Department of Education. Retrieved from http:// ies.ed.gov/ncee/wwc/practiceguides.
Horner, R. H., Sugai, G., & Anderson, C. M. (2010). Examining the evidence base for school-
wide positive behavior support. Focus on Exceptional Children, 42(8), 1-15. *Horner, R. H., Sugai, G., Smolkowski, K., Eber, L., Nakasato, J., Todd, A. W., & Esperanza, J.
(2009). A randomized, wait-list controlled effectiveness trial assessing school-wide positive behavior support in elementary schools. Journal of Positive Behavior Interventions, 11(3), 133-144.
Horner, R. H., Todd, A. W., Lewis-Palmer, T., Irvin, L. K., Sugai, G., & Boland, J. B. (2004).
The School-wide Evaluation Tool (SET): A research instrument for assessing school-wide positive behavior support. Journal of Positive behavior Interventions, 6(1), 3-12.
*Lafrance, J. A. (2010). Examination of the fidelity of school-wide positive behavior support
implementation and its relationship to academic and behavioral outcomes in Florida. 70, ProQuest Information & Learning, US. Retrieved from http://ezproxy.lib.uconn.edu/login?url=http://search.ebscohost.com/login.aspx?direct=true&db=psyh&AN=2010-99090-466&site=ehost-live&scope=site Available from EBSCOhost psyh database.
*Lane, K. L., & Menzies, H. M. (2003). A school-wide intervention with primary and secondary
levels of support for elementary students: Outcomes and considerations. Education and Treatment of Children, 26(4), 431-451.
*Lane, K. L., Wehby, J. H., Robertson, E. J., & Rogers, L. A. (2007). How do different types of
high school students respond to schoolwide positive behavior suport programs?

SREE Spring 2013 Conference Abstract Template A-10
Characteristics and responsiveness of teacher-identified students. Journal of Emotional & Behavioral Disorders, 15(1), 3-20. doi: 10.1177/10634266070150010201
*Lassen, S. R., Steele, M. M., & Sailor, W. (2006). The relationship of school-wide positive
behavior support to academic achievement in an urban school. Psychology in the Schools, 43(6), 701-712. doi: 10.1002/pits.20177
*Luiselli, J. K., Putnam, R. F., Handler, M. W., & Fieinberg, A. B. (2005). Whole-school
positive behaviour support: Effects on student discipline problems and academic performance. Educational Psychology, 25(2-3182-198). doi: 10.1080/0144341042000301265
Kelm, J. L., & McIntosh, K. (2012). Effects of school-wide positive behavior support on teacher
self-efficacy. Psychology in the Schools, 49(2), 137-147. doi: 10.1002/pits.20624 *McIntosh, K., Chard, D. J., Boland, J. B., & Horner, R. H. (2006). Demonstration of combined
efforts in school-wide academic and behavioral systems and incidence of reading and beahvior challenegs in early elementary grades. Journal of Positive Behavior Interventions, 8(3), 146-154. doi: 10.1177/10983007060080030301
*Muscott, H. S., Mann, E. L., & LeBrun, M. R. (2008). Positive behavioral interventions and
suppors in New Hampshire: Effetcs of large scale implementation of schoolwide positive behavior support on student discipline and academic achievement. Journal of Positive Behavior Interventions, 10(3), 190-205. doi: 10.1177/1098300708316258
*Nelson, J. R., Martella, R. M., & Marchand-Martella, N. E. (2002). Maximizing student
learning: The effects of a comprehensive school-based program for preventing problem behaviors. Journal of Emotional & Behavioral Disorders, 10(3), 136-148. doi: 10.1177/10634266020100030201
Putnam, R., Horner, R. H., & Algozzine, R. (2006). Academic achievement and the
implementation of school-wide behavior support. Positive Behavior Interventions and Supports Newsletter, 3(1). Available from http://www.pbis.org/news/New/Newsletters/ Newsletter1.aspx
Rosenbaum, P. R., & Rubin, D. B. (1984). Reducing bias in observational studies using
subclassification on the propensity score. Journal of the American Statistical Association, 79, 516-524.
*Sadler, C., & Sugai, G. (2009). Effective behavior and instructional support: A district model
for early identification and prevention of reading and behavior problems. Journal of Positive Behavior Interventions, 11(1), 35-46. doi: 10.1177/1098300708322444
Safran, S. P. (2006). Using the Effective Behavior Supports Survey to guide development of
schoolwide positive behavior support. Jounral of Positive Behavior Support, 8, 3-9.

SREE Spring 2013 Conference Abstract Template A-11
*Sailor, W., Zuna, N., Choi, J. H., Thomas, J., McCart, A., & Roger, B. (2006). Anchoring schoolwide positive behavior support in strutural school reform. Research & Practice for Persons with Severe Disabilities, 31(1), 18-30. doi: 10.2511/rpsd.31.1.18
*Simonsen, B., Eber, L., Black, A. C., Sugai, G., Lewandowski, H., Sims, B., & Myers, D.
(2012). Illinois statewide positive behavioral interventions and supports: Evolution and impact on student outcomes across years. Journal of Positive Behavior Interventions, 14(1), 5-16. doi: 10.1177/1098300711412601
Shadish, W. R., Cook, T. D., & Campbell, D. T. (2002). Experimental and quasi-
experimental designs for generalized causal inference. Belmont, CA: Wadsworth, Cengage Learning.
Sugai, G., Lewis-Palmer, T., Todd, A. W., & Horner, R. H. (2001). School-wide
Evaluation Tool (SET). Eugene, OR: University of Oregon. Walker, H. M., & Shinn, M. R. (2002). Structuring school-based interventions to achieve
integrated primary, secondary, and tertiary prevention goals for safe and effective schools. In M. R. Shinn, G. Stoner, & H. M. Walker (Eds.), Interventions for academic and behavior problems: Prevention and remedial approaches (pp. 1-26). Silver Springs, MD: National Association for School Psychologists.
*Wasilewski, Y., Gifford, B., Bonneau, K., & Duke University, C. f. C. a. F. P. (2008).
Evaluation of the school-wide positive behavioral support program in eight North Carolina elementary schools: Center for Child and Family Policy, Duke University.
*Wills, H., Kamps, D., Abbott, M., Bannister, H., & Kaufman, J. (2010). Classroom
observations and effects of reading interventions for students at risk for emotional and behavioral disorders. Behavioral Disorders, 35(2), 103-119.
Woodcock, R. W, McGrew, K. S, & Mather, N. (2001). Woodcock-Johnson III tests of achievement. Itasca, IL: Riverside.

SREE Spring 2013 Conference Abstract Template B-1
Appendix B. Tables and Figures Not included in page count. Table 1. Studies Examining the Effects of SWPBIS on Academic Achievement
Study
Research Design
Sample Size
Academic Area(s)
Measures
Results
Benner, Nelson, Sanders, & Ralston, 2012*
Experimental 44 treatment and 26 control elementary students (K-3) from 14 elementary schools with an average population of 469 students All in Pacific Northwest
Letter-Word Identification, Spelling, and Calculations
Woodcock-Johnson III Tests of Achievement (standard scores)
No statistically significant effect between the treatment and control schools was found. In fact, the control students performed moderately better than the treatment students (d = -.58)
Bradshaw, Mitchell, & Leaf, 2010
Experimental 37 elementary schools; 21 treatment schools and 16 controls schools with an average population of 489 students All in Maryland
Math and Reading
Gains in the % of students at or above proficient on Maryland School Assessment
No statistically significant gains were found for math or reading between the treatment and control schools
Bradshaw & Pas, 2011
Correlational Descriptive
807 elementary schools with an average student population of 458 students and subset of 227 elementary schools with a fidelity measure and an average population of 473 students All in Maryland
Reading % of students proficient or advanced on the Maryland Student Assessment in reading
For all schools, reading achievement was statistically significantly related to the likelihood a school received SWPBIS training (lower % of students at proficient or above, greater likelihood of SWPBIS training) The % of students at or above proficient in reading was not a

SREE Spring 2013 Conference Abstract Template B-2
statistically significant predictor of fidelity of implementation
Caldarella, Shatzer, Gray, Young, & Young, 2011
Quasi- Experimental
Two middle schools, 1 treatment and 1 control, with an average population of 1197 students Both in Utah
Not delineated Grade Point Average (GPA)
No statistically significant differences were found for GPA between the treatment and control schools
Ervin, Schaughency, Goodman, McGlinchey, & Mathews, 2006
Case Study Four elementary schools with an average population of 334 students All in Michigan
Reading % of students at reading benchmarks on the Dynamic Indicators of Basic Early Literacy Skills (DIBELS)
No relationship was evident between increases in Schoolwide Evaluation Tool (SET) scores and annual % of student at-risk or at benchmark
Horner, Sugai, Smolkowski, Eber, Nakasato, Todd, & Esperanza, 2009
Experimental 30 treatment and 30 control elementary schools with an average enrollment of 471 students Schools from Hawaii and Illinois
Reading % of 3rd graders meeting or exceeding state reading standards (based on Hawaii and Illinois state high stakes assessments)
No statistically significant differences between treatment and control groups were found on the proportion of 3rd graders meeting state reading standards
LaFrance, 2009** Correlational Descriptive
30 high BoQ and 10 low BOQ elementary schools and 14 high BoQ and 14 low BoQ middle schools actively using SWPBIS 30 elementary schools
Math and Reading
Florida Comprehensive Achievement Test (average school scale score across all grades)
Elementary schools: No statistically significant differences between groups (including those with high fidelity) on the state reading assessment were found. A statistically significant

SREE Spring 2013 Conference Abstract Template B-3
and 14 middle schools served as control schools (control schools randomly chosen) All in Florida
difference was found between SWPBIS and not-SWPBIS schools on math. No differences were found between high and low fidelity schools on math Middle schools: No statistically significant differences between groups on the state reading and math assessment found
Lane & Menzies, 2003
Correlational Descriptive
210 students in one elementary school with a population of 372 PK-6th grades students The school was in California
Reading District Multiple Measures (DMM; levels of proficiency) Curriculum Based Measures-Reading (CBM-R; % correct), Stanford Achievement Test (SAT-9; standard score)
Statistically significant increases in reading were found on the DMM from the beginning to the end of the year, however, the effect sizes were small (e.g. d = .25 & .31) Statistically significant gains were identified for primary-level students (grades 1st - 3rd) on the CBM-R, but not for upper elementary students (grades 4th - 6th) No statistically significant differences or gains were identified for reading as measured by the SAT-9
Lane, Wehby, Robertson, & Rogers, 2007
Quasi- Experimental
178 students in two high schools with an average population of
Not delineated GPA No statistically significant interactions for GPA were found between groups of

SREE Spring 2013 Conference Abstract Template B-4
1172 students Both in Tennessee
students (externalizing, internalizing, comorbid, typical and high incidence disabilities) and years of SWPBIS implementation
Lassen, Steele, & Sailor, 2006
Case Study 1 middle school with a population of 623 students The school was in Kansas
Math and Reading
7th graders completed the Kansas State Assessment for reading 8th graders completed the Kansas State Assessment for math (standard scores)
No statistically significant differences were found across time for reading Statistically significant differences across time were found for math indicting significant within-school growth in math
Luiselli, Putnam, Handler, & Feinberg, 2005
Case Study 1 elementary school with an average of 563 students The school was in Massachusetts
Math and Reading
Student percentile ranks on the Metropolitan Achievement Test (MAT-7)
The school average percentile rank in reading and mathematics increased from pre-intervention year to intervention year, with an average increase of 18% points in reading and 25% points in math. However, the student population tested in year 1 was much higher than in year 2, therefore, any inference should be cautioned
McIntosh, Chard, Boland, & Horner, 2006***
Correlational Descriptive
1,653 K-3 students from six elementary schools with one school district
Reading % of students proficient readers based on DIBELS
97% of students were considered proficient readers by the end of 3rd grade, compared to national norms of
SREE Spring 2013 Conference Abstract Template B-5
All schools in Pacific Northwest
60% proficient by the end of 3rd grade
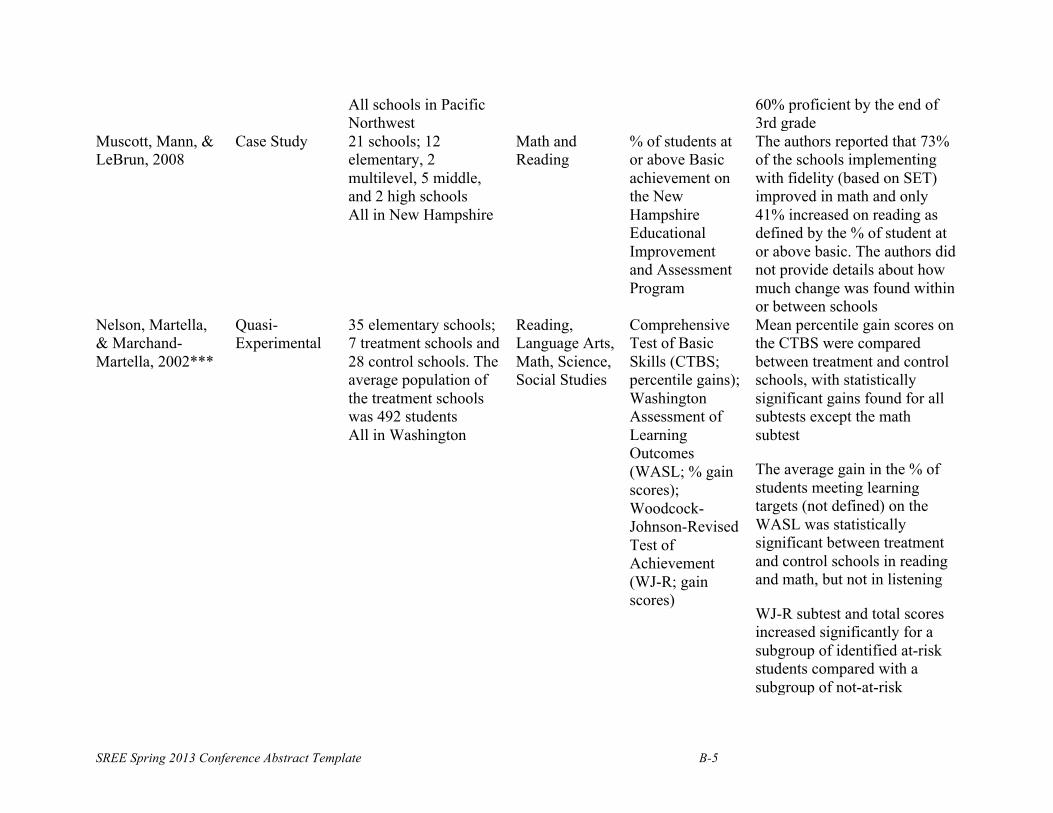
Muscott, Mann, & LeBrun, 2008
Case Study 21 schools; 12 elementary, 2 multilevel, 5 middle, and 2 high schools All in New Hampshire
Math and Reading
% of students at or above Basic achievement on the New Hampshire Educational Improvement and Assessment Program
The authors reported that 73% of the schools implementing with fidelity (based on SET) improved in math and only 41% increased on reading as defined by the % of student at or above basic. The authors did not provide details about how much change was found within or between schools
Nelson, Martella, & Marchand-Martella, 2002***
Quasi-Experimental
35 elementary schools; 7 treatment schools and 28 control schools. The average population of the treatment schools was 492 students All in Washington
Reading, Language Arts, Math, Science, Social Studies
Comprehensive Test of Basic Skills (CTBS; percentile gains); Washington Assessment of Learning Outcomes (WASL; % gain scores); Woodcock-Johnson-Revised Test of Achievement (WJ-R; gain scores)
Mean percentile gain scores on the CTBS were compared between treatment and control schools, with statistically significant gains found for all subtests except the math subtest
The average gain in the % of students meeting learning targets (not defined) on the WASL was statistically significant between treatment and control schools in reading and math, but not in listening
WJ-R subtest and total scores increased significantly for a subgroup of identified at-risk students compared with a subgroup of not-at-risk

SREE Spring 2013 Conference Abstract Template B-6
students
Sadler & Sugai, 2009***
Case Study 10 elementary schools from one school district serving 12,000 students All in Oregon
Reading DIBELS Phonemic Segmentation and ORF (% of students emerging and established); Oregon state assessment of reading (standard scores)
Across 5-years of implementation, the % of students in the deficit range on Phonemic Segmentation and the ORF decreased from 8% to 3% for K and 21% to 10% for 1st grade
Sailor, Zuna, Choi, Thomas, McCart, & Roger, 2006
Case Study 3 Middle Schools, total student population was 1303 students All in California
Math and English
California Standardized Test (math and English combined; standard score)
5th grade: ~7% of students above proficiency-level in 2003 and 2004 and increased to ~16% in 2005 6th grade: No discernable change evident 7th grade: ~4% of students above proficiency-level in 2003, ~7% in 2004, and ~21% in 2005 8th grade: ~3% of student above proficiency-level in 2003, 6% in 2004, and 11% in 2005
Simonsen, Eber, Black, Sugai, Lewandowski, Sims, & Meyers, 2012
Correlational Descriptive
428 school; 274 elementary, 46 K-8, 91 middle, and 17 high schools All in Illinois
Math and Reading
% of students meeting or exceeding grade level mastery on the Illinois State Achievement Test
Statistically significant positive differences were identified for math achievement between schools implementing with fidelity compared with those not implementing with fidelity. No statistically significant

SREE Spring 2013 Conference Abstract Template B-7
differences were found for reading between schools implementing the fidelity and schools not implementing with fidelity
Wasilewski, Gifford, & Bonneau, 2008
Correlational Descriptive
8 elementary schools implementing SWPBIS with fidelity 264 elementary schools that had ever implemented SWPBIS (no fidelity) All in North Carolina
Math, Reading, Composite
State Assessment Reading State Assessment Math State Assessment Composite (% of students at or above grade level on the end of grade and end of course tests)
No statistically significant effects in academic achievement (math, reading, or composite) for 8 schools implementing SWPBIS with fidelity No statistically significant effects in reading and math achievement for 264 schools implementing SWPBS. A significant effect was present for the composite measure after the 1st year of SWPBIS implementation, but effect was not significant after the 1st year
Wills, Kamps, Abbott, Bannister, & Kaufman, 2010***
Quasi- Experimental
8 elementary schools; 4 treatment and 4 control elementary schools with an average population of 372 students All in Kansas City
Reading DIBELS NWF and ORF (DIBELS scores), Woodcock Reading Mastery Test (WRMT; standard scores)
Statistically significant gains in DIBELS NWF were found for 1st grade students between the treatment and control schools Statistically significant gains in DIBELS ORF were found for grades 1 and 3, but not for grade 2 Minimal differences were
SREE Spring 2013 Conference Abstract Template B-8
found between the treatment and control schools on the WRMT
Note. *This study used Think Time Strategy (Nelson & Carr, 2000) within a universal prevention model; **this study was a dissertation; ***these four studies examined the effect of SWPBIS and a targeted reading intervention program.

SREE Spring 2013 Conference Abstract Template B-9
Table 2 Characteristics of Schools Variables
Treatment Schools (n = 150)
All Control Schools (n =
786)
g
PSM Control Schools (n =
150)
g
School Level Elementary 64% 61% 0.08 63% .03 Middle 21% 19% 0.07 24% -.09 High 14% 19% -0.18 12% .07 Other 0.7% 0.5% - 0% - Title I 32% 16% 0.54 29% .10 Urbanicity City: mid-size 15% 14% 0.08 15% .03 City: small 6% 15% -0.54 5% .23 Suburban: Large
35% 43% -0.19 38% -.07
Suburban: mid- size
19% 9% 0.53 19% -.02
Town: Fringe 2% 4% - 1% - Town: Distant 2% 0.4% - 0.7% - Rural: Fringe 15% 14% 0.04 16.0 -.06 Rural: Distant 5% 1% - 5% - M SD M SD g M SD g # of Students 555.7 304.1 561.7 346.1 -0.02 546.4 328.3 0.03 Free/Reduc Lunch 41% 25 32% 23 0.39 39% 26 0.08 Asian 4% 3 4% 3 - 4% 3 - African-American 18% 23 14% 18 0.21 18% 21 0.00 Hispanic 19% 21 16% 18 0.16 17% 18 0.10 White 59% 33 66% 31 -0.22 62% 34 -0.09 Male 51% 3 52% 4 -0.26 51% 3 0.00 Proficient- Math 75% 18 81% 16 -0.39 75% 17 -0.03 Proficient- Read 67% 21 75% 18 -0.42 67% 19 -0.03 Proficient- Write 79% 15 84% 13 -0.32 79% 14 .00 Note. Elementary (PK-3rd to PK to 8th), Middle (4th – 7th, 4th – 9th), High (7th -12th to just 12th) and Other is any other configuration of grades within a school.

SREE Spring 2013 Conference Abstract Template B-10
Table 3 Proportion of Students Within Schools At or Above Proficient on the CMT and CAPT Assessments
SWPBIS with Fidelity SWPBIS No Fidelity
Academic Achievement n M SD n M SD Math 2006-2007 80 71.94 17.99 68 79.43 17.86 Math 2007-2008 79 75.33 15.68 67 81.04 16.08 Math 2008-2009 77 76.65 15.73 67 81.64 16.26 Math 2009-2010 78 77.18 16.04 66 82.65 15.91 Math 2010-2011 73 77.50 16.11 64 82.33 16.80 Reading 2006-2007 80 62.32 20.23 68 72.28 21.46 Reading 2007-2008 79 64.89 18.52 67 74.05 19.44 Reading 2008-2009 78 66.04 18.58 67 75.83 19.63 Reading 2009-2010 78 66.91 17.88 66 76.43 18.72 Reading 2010-2011 73 68.40 17.32 64 77.77 18.05 Writing 2006-2007 80 77.22 15.70 68 82.48 15.28 Writing 2007-2008 79 78.60 13.63 67 84.22 13.57 Writing 2008-2009 78 78.35 13.35 67 83.47 14.43 Writing 2009-2010 78 77.07 14.32 66 82.29 15.10 Writing 2010-2011 74 79.13 12.55 64 82.86 15.54
Note. No proportional differences were statistically significant based on two-sample Z-tests for proportions.

SREE Spring 2013 Conference Abstract Template B-11
Table 4 SWPBIS Schools Implementing with Fidelity and Schools Not Implementing with Fidelity Based on SET Scores in the 2010-2011 School Year
Academic Achievement
Fidelity Mean Fidelity SD Fidelity n
No Fidelity Mean
No Fidelity SD
No Fidelity n Pooled SD g
3rd Math 246.02 19.54 50 254.29 31.29 36 25.14 -0.33 3rd Reading 230.55 16.83 50 238.54 23.92 36 20.11 -0.40 3rd Writing 241.62 18.55 50 249.65 24.18 36 21.06 -0.38 4th Math 250.98 19.95 50 262.16 28.57 38 24.06 -0.46* 4th Reading 242.07 18.12 50 249.49 24.63 38 21.18 -0.35 4th Writing 240.78 16.14 50 247.24 23.15 38 19.45 -0.33 5th Math 257.47 22.43 48 269.75 28.93 38 25.51 -0.48* 5th Reading 228.33 19.54 48 238.57 26.39 38 22.82 -0.45* 5th Writing 244.11 19.15 49 258.30 24.63 38 21.71 -0.65** 6th Math 250.48 25.26 25 256.02 28.08 27 26.76 -0.21 6th Reading 253.38 22.37 25 256.00 28.29 27 25.62 -0.10 6th Writing 244.47 20.99 25 245.44 22.97 27 22.04 -0.04 7th Math 254.05 23.24 22 257.55 29.66 25 26.85 -0.13 7th Reading 244.03 21.21 22 245.58 31.56 25 27.21 -0.06 7th Writing 236.50 19.82 23 237.17 27.19 26 24.01 -0.03 8th Math 246.72 24.51 23 251.89 30.91 24 27.96 -0.18 8th Reading 246.43 21.68 23 250.71 30.47 24 26.53 -0.16 8th Writing 238.08 23.54 23 237.53 30.52 24 27.33 0.02 10th Math 233.18 30.13 9 250.55 24.30 11 27.08 -0.64 10th Reading 228.07 27.23 9 239.95 18.17 11 22.70 -0.52 10th Writing 245.03 23.59 9 260.85 18.38 11 20.89 -0.76 Note. Negative effect sizes indicate that the No Fidelity schools did better than schools implementing with Fidelity. Hedges g interpretation: effect size > .25 considered substantively important based on WWC criteria. *p < .05, **p < .01

SREE Spring 2013 Conference Abstract Template B-12
Table 5 Proportion of Students Within Schools At or Above Proficient on the CMT and CAPT Assessments
Treatment Control
Academic Achievement n M SD n M SD Math 2006-2007 150 75.32 17.45 150 75.38 18.26 Math 2007-2008 143 76.16 17.11 146 77.95 16.07 Math 2008-2009 139 78.77 17.54 144 78.97 16.12 Math 2009-2010 137 81.11 16.49 144 79.69 16.16 Math 2010-2011 130 81.76 15.47 137 79.76 16.56 Reading 2006-2007 150 66.95 19.60 150 66.90 21.32 Reading 2007-2008 143 67.87 19.52 146 69.09 19.43 Reading 2008-2009 139 71.46 18.95 145 70.57 19.63 Reading 2009-2010 137 73.36 18.42 144 71.27 18.82 Reading 2010-2011 130 75.10 17.47 137 72.78 18.22 Writing 2006-2007 150 79.28 13.97 150 79.64 15.68 Writing 2007-2008 143 79.61 15.09 146 81.18 13.84 Writing 2008-2009 139 80.37 14.99 145 80.72 14.05 Writing 2009-2010 137 80.59 14.03 144 79.47 14.86 Writing 2010-2011 130 81.90 13.05 138 80.86 14.09
Note. No proportional differences were statistically significant based on two-sample Z-tests for proportions.

SREE Spring 2013 Conference Abstract Template B-13
Table 6 Treatment and Control Scale Score Differences by Grade Level for the 2010-2011 School Year Academic Achievement
Treatment Mean
Treatment SD
Treatment n
PSM Control Mean
PSM Control SD
PSM Control n
Pooled SD g
3rd Math 249.48 25.30 86 249.38 25.38 80 25.34 0.00 3rd Reading 233.90 20.36 86 233.98 19.80 80 20.10 0.00 3rd Writing 244.94 21.30 87 244.08 20.59 80 20.96 0.04 4th Math 255.81 24.54 88 258.04 24.15 81 24.36 -0.09 4th Reading 245.28 21.37 88 248.28 19.95 81 20.70 -0.15 4th Writing 243.54 19.59 89 247.05 18.77 81 19.21 -0.18 5th Math 262.90 26.08 86 258.25 25.15 68 25.67 0.18 5th Reading 232.85 23.25 86 232.04 21.16 68 22.35 0.04 5th Writing 250.31 22.71 87 247.59 20.92 68 21.94 0.12 6th Math 253.36 26.65 52 259.56 22.74 54 24.74 -0.25 6th Reading 254.74 25.41 52 258.44 22.21 54 23.83 -0.16 6th Writing 244.98 21.83 52 250.00 22.36 54 22.10 -0.23 7th Math 255.91 26.62 47 259.71 23.90 45 25.33 -0.15 7th Reading 244.85 26.94 47 247.34 23.14 44 25.17 -0.10 7th Writing 236.85 23.77 49 238.63 21.56 45 22.74 -0.08 8th Math 249.36 27.78 47 254.83 25.35 43 26.65 -0.21 8th Reading 248.62 26.33 47 252.60 23.70 43 25.11 -0.16 8th Writing 237.80 27.04 47 243.06 24.36 43 25.79 -0.20 10th Math 242.73 27.77 20 246.02 24.01 18 26.06 -0.13 10th Reading 234.60 22.86 20 235.29 21.53 18 22.24 -0.03 10th Writing 253.73 21.85 20 257.45 22.49 18 22.15 -0.17 Note. None of the variables were statistically significantly different at p < .05. Hedges g interpretation: effect size > .25 considered substantively important based on WWC criteria. Negative effect sizes indicate that the control group