Embed Size (px)
Citation preview
ABSTRACT
The dose distribution around brachytherapy (BT) sources is characterized by steep dose
gradients and an energy spectrum varying rapidly with depth in water around the source.
These two properties make experimental verification of the dose distribution difficult,
and put high demands on the dosimetry system in use regarding precision, size and
energy dependence. The American Association of Physicists in Medicine (AAPM)
recommends lithium fluoride (LiF) thermoluminescence dosimetry (TLD) to be used for
verification measurements, as it is the only dosimetry system meeting the requirements,
but still the total combined uncertainty in dose-rate determination is as high as 7-9 % (1
σ). Lithium formate is a new dosimetry material that is less energy dependent than LiF,
but more sensitive than the most common EPR (electron paramagnetic resonance)
dosimetry material, alanine. In order to evaluate lithium formate EPR for BT dosimetry,
dosimeters were produced for experimental dose determination around BT source 192Ir.
The dosimeters were calibrated against an ionization chamber in a high energy photon
beam. Dose to water was determined at 1, 3 and 5 cm radial distance from the source,
which was stepped along a straight line in a PMMA phantom. The experiments were
performed twice using 4 dosimeters per distance and experiment. Methods to correct for
energy dependence were developed and evaluated. The uncertainty in measured dose was
estimated. The experimental dose values agreed with the values from the treatment
planning system with a maximum deviation of 3.3 %, and an average 1 σ uncertainty of 3
% at 3 and 5 cm and 5 % at 1cm. Uncertainty in radial distance from the source as well as
source calibration were the dominating contributions to the total combined uncertainty.
Lithium formate EPR has been shown to be a promising alternative to LiF TLD for BT
dosimetry.

2
3
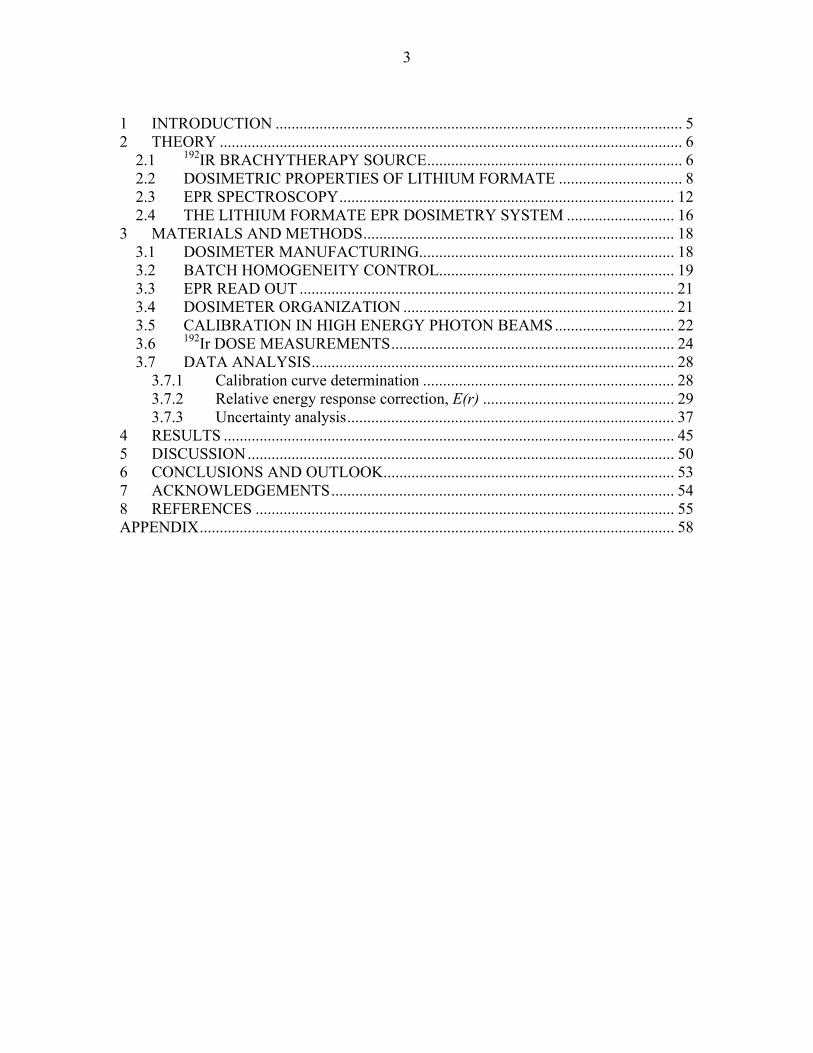
1 INTRODUCTION ...................................................................................................... 5 2 THEORY .................................................................................................................... 6
2.1 192IR BRACHYTHERAPY SOURCE................................................................ 6 2.2 DOSIMETRIC PROPERTIES OF LITHIUM FORMATE ............................... 8 2.3 EPR SPECTROSCOPY.................................................................................... 12 2.4 THE LITHIUM FORMATE EPR DOSIMETRY SYSTEM ........................... 16
3 MATERIALS AND METHODS.............................................................................. 18 3.1 DOSIMETER MANUFACTURING................................................................ 18 3.2 BATCH HOMOGENEITY CONTROL........................................................... 19 3.3 EPR READ OUT .............................................................................................. 21 3.4 DOSIMETER ORGANIZATION .................................................................... 21 3.5 CALIBRATION IN HIGH ENERGY PHOTON BEAMS.............................. 22 3.6 192Ir DOSE MEASUREMENTS....................................................................... 24 3.7 DATA ANALYSIS........................................................................................... 28
3.7.1 Calibration curve determination ............................................................... 28 3.7.2 Relative energy response correction, E(r) ................................................ 29 3.7.3 Uncertainty analysis.................................................................................. 37
4 RESULTS ................................................................................................................. 45 5 DISCUSSION........................................................................................................... 50 6 CONCLUSIONS AND OUTLOOK......................................................................... 53 7 ACKNOWLEDGEMENTS...................................................................................... 54 8 REFERENCES ......................................................................................................... 55 APPENDIX....................................................................................................................... 58

4
5
1 INTRODUCTION
Before a new brachytherapy (BT) source model can be used clinically, its dose
distribution must be well characterized, both experimentally and by Monte Carlo (MC)
calculations. The American Association of Physicists in Medicine (AAPM) recommends
the BT dose calculation formalism presented in the Task Group 43 (TG-43) report
(Rivard et al 2004) to be used in all treatment planning systems (TPS). The report gives
instructions how to measure the dose-rate in water around BT sources together with a
formalism for dose calculation and data sets of parameters determining dose distribution
derived from a combination of MC calculations and experimental results. The parameters
are entered into TPS.
The derivation of experimental data in BT dosimetry is equipped with some difficulties.
Steep dose gradients, a wide range of doses, low photon energies (20-800 keV) and a
wide energy spectrum, which changes with depth, are some characteristics that
complicate dose measurements and put high demands on the dosimetry system in use.
Typically the combined 1 σ uncertainty (k = 1, 67 % confidence index) in the
experimental data lies around 8 % (Thomadsen et al 2005). It would be of great interest
to reduce this uncertainty.
The uncertainty can be held low by accurate detector positioning and by minimizing
detector dose-rate dependence, dose response nonlinearity, energy dependence,
volumetric averaging, temporal stability of readings and calibration coefficients (Rivard
et al 2004). Among the methodological recommendation of the TG-43 report the detector
used for measurements of BT dosimetry parameters should be small enough for effects of
volume averaging to be negligible or accurately corrected for, a well-characterized
energy-response function and sufficient precision and reproducibility to allow dose-rate
estimation with 1 σ Type A uncertainties ≤ 5%, and 1 σ Type B uncertainties < 7%
(Rivard et al 2004).
6
Lithium fluoride (LiF) thermoluminescence dosimetry (TLD) is currently the
recommended method for experimental determination of the dose distribution around BT
sources. It is the only dosimetry system that has been convincingly demonstrated to be
suitable for this purpose, thanks to its high sensitivity (Rivard et al 2004).
Lithium formate is a material that can be employed for dosimetry by using electron
paramagnetic resonance (EPR) spectroscopy for signal read out. Studies have recently
shown that lithium formate has dosimetric properties that could match the requirements
of a detector for measurements around BT sources. It has a higher sensitivity than the
most commonly used EPR dosimetry material, alanine, low energy dependence and
absorption characteristics similar to water, which is the recommended reference material
by the TG-43.
192Ir is a common BT source, used in the treatment of several forms of cancer. Its dose
distribution is rather complicated to measure, since it possesses most of the typical
characteristics of a BT source mentioned above. It is therefore a suitable source for the
evaluation of a new dosimetry system such as lithium formate EPR.
The aim of this work was to evaluate the lithium formate EPR dosimetry system for
measurements around 192Ir BT source qualitatively and experimentally, by measuring
dose at three different distances from the source and comparing the results with values
given by the TPS. As the type of dosimeters used in this work never had been used for
BT dosimetry before, methods to estimate and correct for energy dependence had to be
developed.
2 THEORY
2.1 192IR BRACHYTHERAPY SOURCE
192Ir is one of the most commonly used BT sources. With a half-life of 73.8 d and mean
energy of approximately 350 keV it is suitable for the treatment of many cancer types
using the afterloading technique for dose delivery to the tumor. The experimental
characterization of the dose distribution around the source can be problematic though,
7
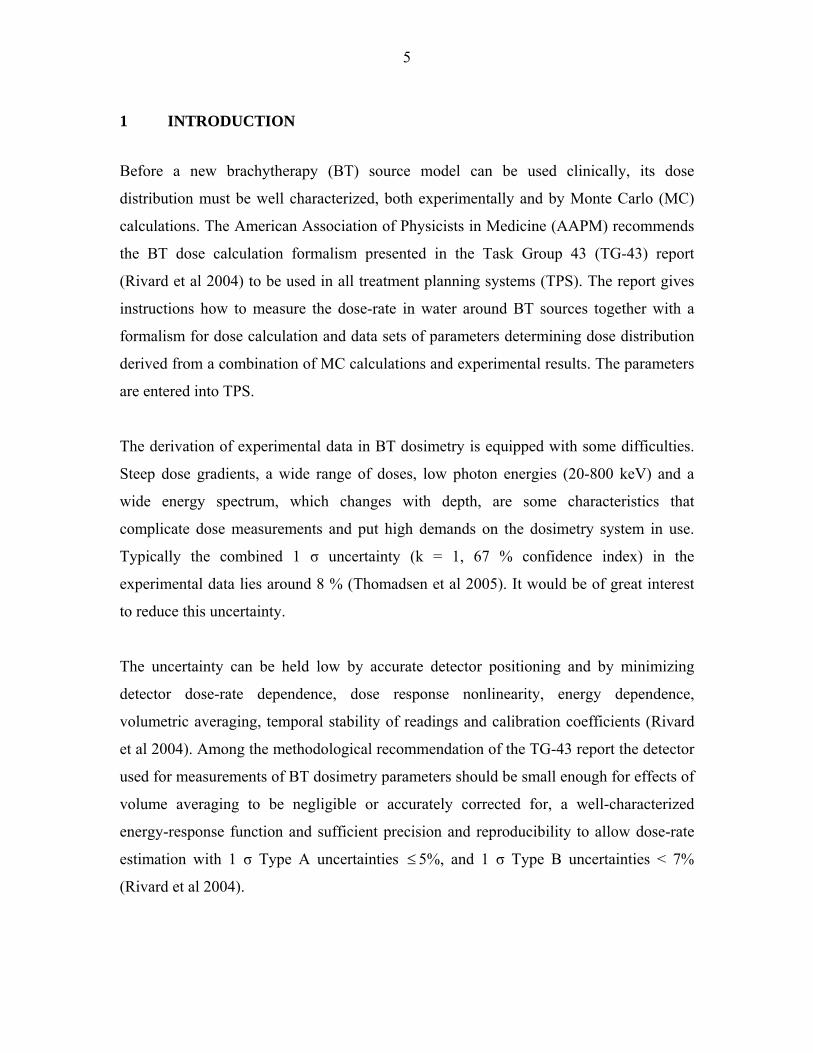
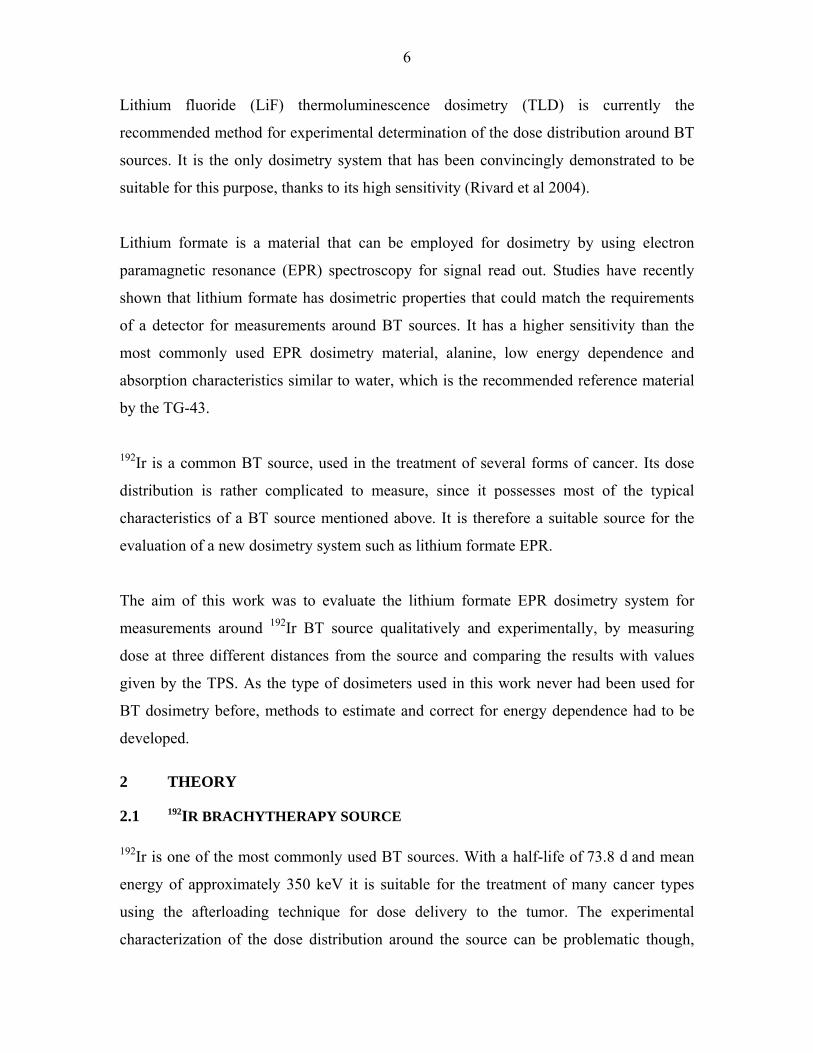
due to some of its properties. It has a wide spectrum of photon energies, ranging from
0.136 to 0.885 MeV. Photons of lower and higher energies than those in the stated
interval are emitted by the radioisotope, but can be neglected in this context. This
spectrum changes rapidly with distance from the source in water (Figure 1). The demands
on the detector to be as energy independent as possible are thus high. Electrons are
stopped in the encapsulation of the source and do not contribute to the dose to the patient.
0 0.5 10
0.05
0.1
0.15
0.2
0.25
0.3
0.351 cm from the source
Energy (MeV)
Nor
mal
ized
pho
ton
fluen
ce
0 0.5 10
0.02
0.04
0.06
0.08
0.1
0.125 cm from the source
Energy (MeV)0 0.5 1
0
0.01
0.02
0.03
0.04
0.05
0.06
0.0710 cm from the source
Energy (MeV) Figure 1 192Ir photon energy spectrum in water at 1, 5 and 10 cm radial distance from the source. The spectra have been derived by EGS4 MC simulations in conjunction with calculations around a mHDR-classic 192Ir source (Carlsson Tedgren , personal communication).

8
2.2 DOSIMETRIC PROPERTIES OF LITHIUM FORMATE
When lithium formate monohydrate (HCO2 Li H2O) is irradiated by ionizing radiation,
free radicals of two types are produced (Vestad et al 2004 a). The amount of produced
radicals corresponds to a certain dose and can be measured using the technique of EPR
spectroscopy.
A free radical is an atom, molecule or ion with an unpaired electron. The production of
the dominating radical produced in lithium formate, 2CO- , is described by the following
equations + +
2 2+ + +
2 2
HCO Li HCO Li + e
HCO Li CO Li + H
hν⎯⎯→
⎯⎯→
- -
-
where the dot indicates a free radical (Vestad et al 2004 a).
Fading. In most materials free radicals are very reactive. In lithium formate, the radicals
are prohibited from further reactions, due to the crystalline structure of the material. This
property makes it possible to measure the radiation dose a long time after irradiation. The
free radicals are not entirely stable though, and signal fading is a possible result if the
dosimeters are stored for a long time between irradiation and read out. According to a
recent study the EPR signal of lithium formate remains unchanged one week after
irradiation to 10 Gy, if the irradiated samples are stored under normal environmental
conditions (Vestad et al 2003). The fading characteristics of lithium formate must be
investigated systematically though.
Dose response linearity. Lithium formate exhibits no zero-dose signal and shows a linear
dose response between 0.2 to 1000 Gy (Vestad et al 2003). This is an advantage
compared to LiF that is supralinear above a certain dose level (Vestad et al 2004 b).
Corrections for supralinearity add some uncertainty to the dose calculations and should
be avoided if possible.
9
Sensitivity. Compared to alanine, which is the standard EPR dosimetry material, lithium
formate is stated to be 2-7 times as sensitive (Vestad et al 2003). This property makes it
possible to produce small dosimeters that are required in the steep dose gradients around
BT sources. High sensitivity is also crucial for the precision in dose determination.
Water equivalence. Since the TG-43 recommends water as reference material for BT
treatment planning, it is advisable that the dosimetry material is as water equivalent as
possible. One aspect of water equivalence is the effective atomic number, Zeff, which for
lithium formate is closer to water than both alanine and LiF (Table 1). The density of the
active material lithium formate is 1.48 g/cm3 compared to water that has a density of 1.00
g/cm3, while LiF has a higher density than lithium formate (Table 1). The dosimeters used
in this work contain 10 % paraffin which gives a dosimeter density of 1.27 g/cm3. See
Section 3.1. The equivalence to solid phantom materials, such as polymethyl
methacrylate (PMMA), that are often used to substitute water for the sake of positional
accuracy in experiments, is a related requirement which lithium formate meets well as
PMMA has a density of 1.19 g/cm2. The similarity in density highly reduces dosimeter
perturbation effects in the phantom.
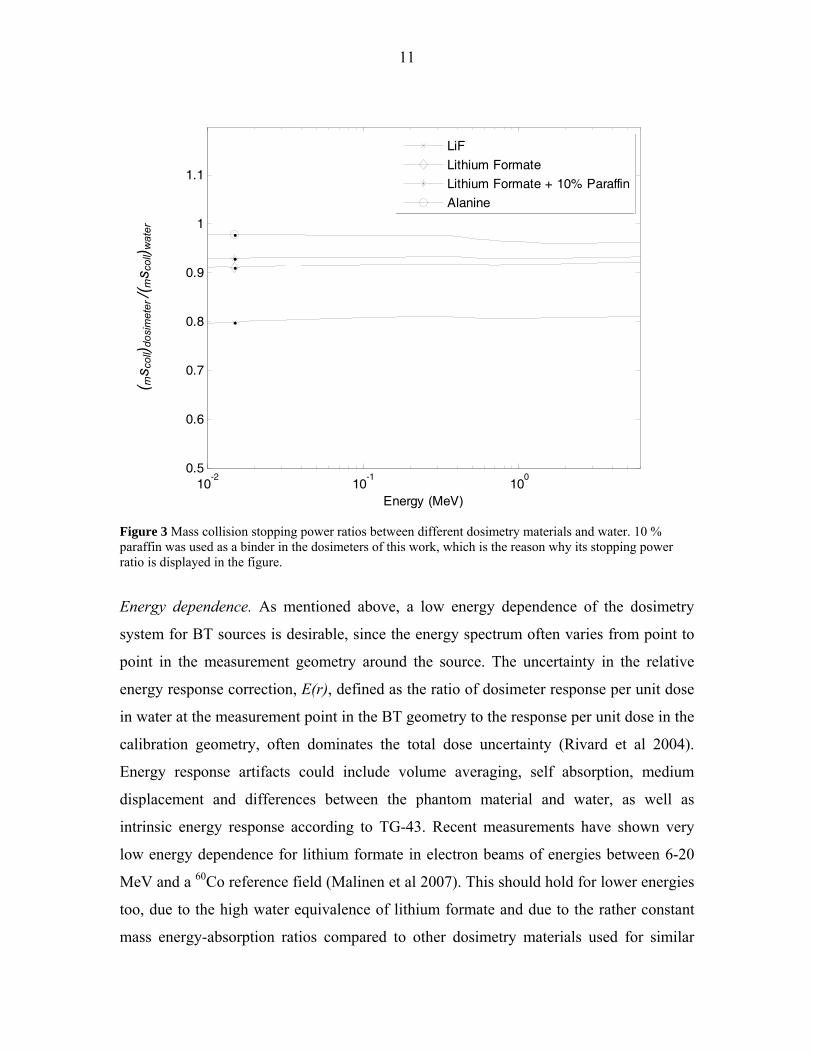
Table 1 Effective atomic number and density of water and the dosimetry materials lithium fluoride, alanine and lithium formate. (Vestad 2004) Water LiF Alanine Lithium
formate
Effective atomic number
Density (g/cm3)
7.5
1.00
8.3
2.64
6.8
1.45
7.3
1.48
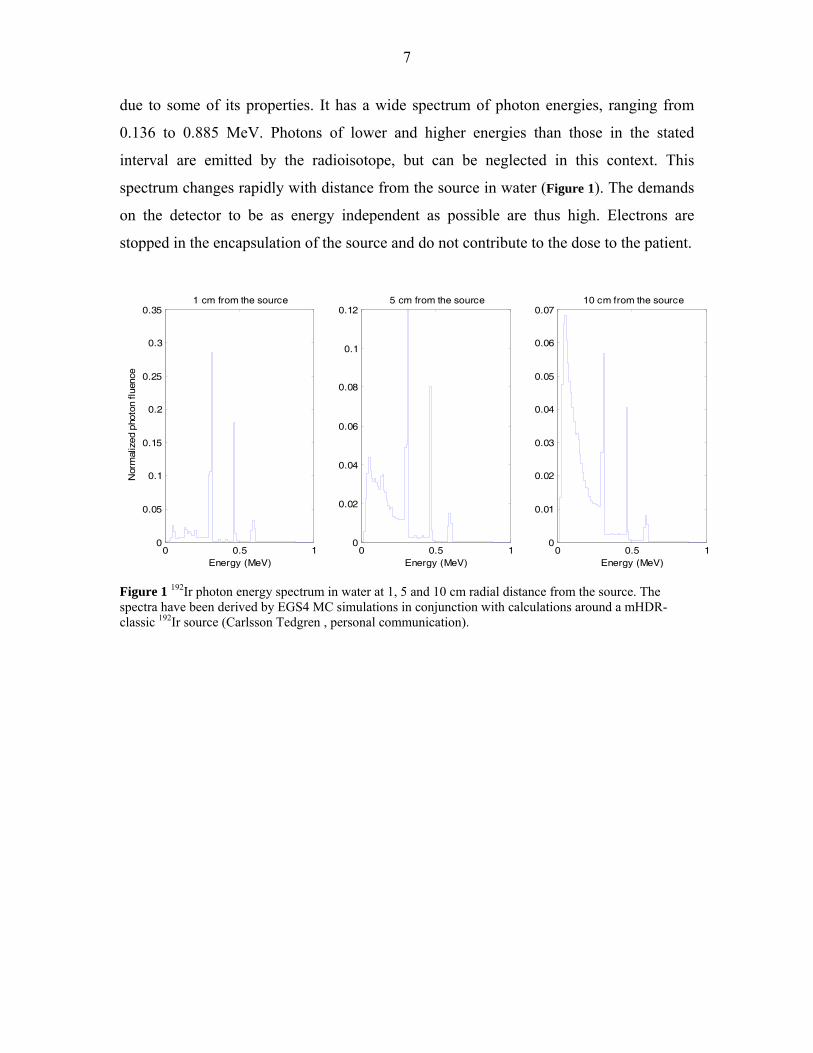
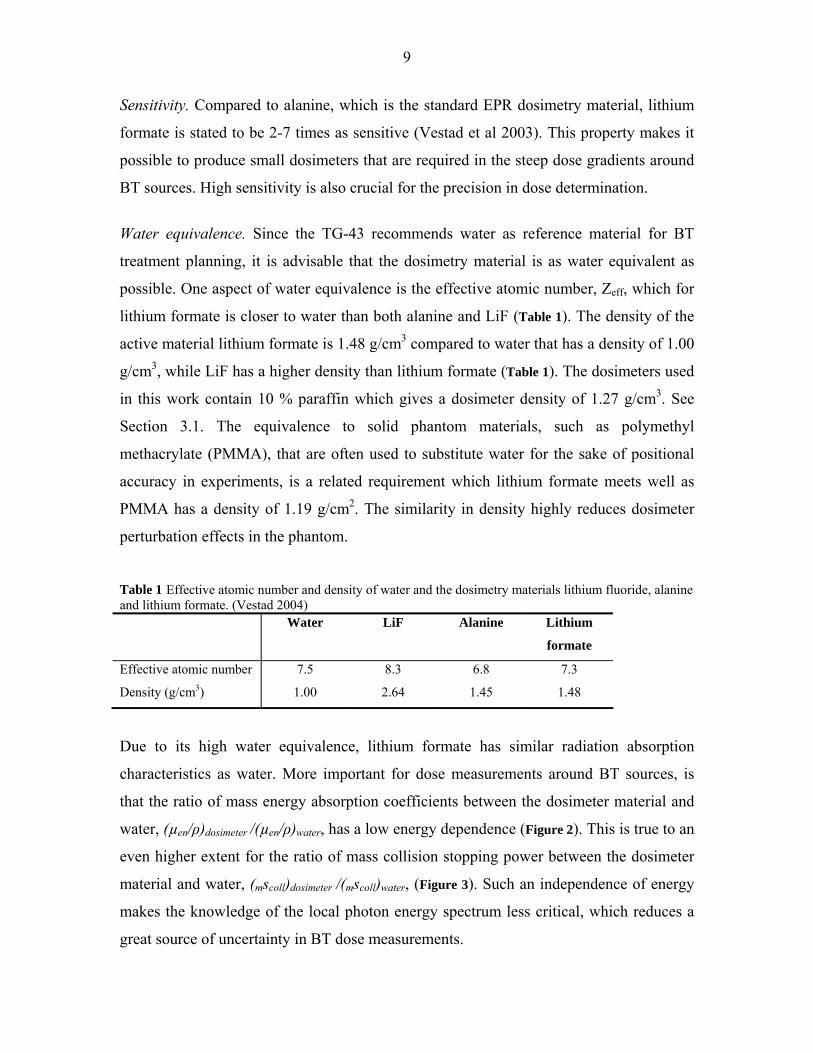
Due to its high water equivalence, lithium formate has similar radiation absorption
characteristics as water. More important for dose measurements around BT sources, is
that the ratio of mass energy absorption coefficients between the dosimeter material and
water, (µen/ρ)dosimeter /(µen/ρ)water, has a low energy dependence (Figure 2). This is true to an
even higher extent for the ratio of mass collision stopping power between the dosimeter
material and water, (mscoll)dosimeter /(mscoll)water, (Figure 3). Such an independence of energy
makes the knowledge of the local photon energy spectrum less critical, which reduces a
great source of uncertainty in BT dose measurements.

10
10
-210
-110
00.5
0.6
0.7
0.8
0.9
1
1.1
Energy (MeV)
mye
n /
mye
n(w
ater
)
Mass attenuation coefficient ratios
LiF
Lithium FormateLithium Formate + 10% Paraffin
Alanine
Figure 2 Mass energy-absorption coefficient ratios between different dosimetry materials and water. 10 % paraffin was used as a binder in the dosimeters of this work, which is the reason why its absorption coefficient ratio is displayed in the figure.
(µen
/ρ) d
osim
eter
/(µ e
n/ρ) w
ater
11
10
-210
-110
00.5
0.6
0.7
0.8
0.9
1
1.1
Energy (MeV)
LiF
Lithium Formate
Lithium Formate + 10% Paraffin
Alanine
Figure 3 Mass collision stopping power ratios between different dosimetry materials and water. 10 % paraffin was used as a binder in the dosimeters of this work, which is the reason why its stopping power ratio is displayed in the figure.
Energy dependence. As mentioned above, a low energy dependence of the dosimetry
system for BT sources is desirable, since the energy spectrum often varies from point to
point in the measurement geometry around the source. The uncertainty in the relative
energy response correction, E(r), defined as the ratio of dosimeter response per unit dose
in water at the measurement point in the BT geometry to the response per unit dose in the
calibration geometry, often dominates the total dose uncertainty (Rivard et al 2004).
Energy response artifacts could include volume averaging, self absorption, medium
displacement and differences between the phantom material and water, as well as
intrinsic energy response according to TG-43. Recent measurements have shown very
low energy dependence for lithium formate in electron beams of energies between 6-20
MeV and a 60Co reference field (Malinen et al 2007). This should hold for lower energies
too, due to the high water equivalence of lithium formate and due to the rather constant
mass energy-absorption ratios compared to other dosimetry materials used for similar
( ms c
oll) d
osim
eter
/(ms c
oll) w
ater
12
applications. Dose response measurements in X-ray qualities (60 kV - 220 kV) compared
to 60Co by Vestad et al (2003) confirm the assumption of low energy dependence.
Because of the high sensitivity of lithium formate compared to alanine, relatively small
dosimeters can be produced, which reduces the effects of volume averaging.
These properties all make lithium formate a good candidate for dose measurements
around BT sources.
2.3 EPR SPECTROSCOPY
Spectroscopy is the measurement and interpretation of energy differences between
different atomic or molecular states. The following section will give a brief introduction
to the basic physics, on which the EPR measurement of radicals depends and a short
comparison of the EPR read-out technique with the TLD read-out technique.
All electrons have a magnetic moment, μ, and a spin quantum number, 1/ 2S = . In an
external magnetic field, B0, the magnetic moment aligns itself either parallel or anti-
parallel to the field, giving rise to two possible energy states, 1/ 2sm = ± . The parallel
state ( 1/ 2sm = − ) is of lower energy, and the anti-parallel state ( 1/ 2sm = + ) is of higher
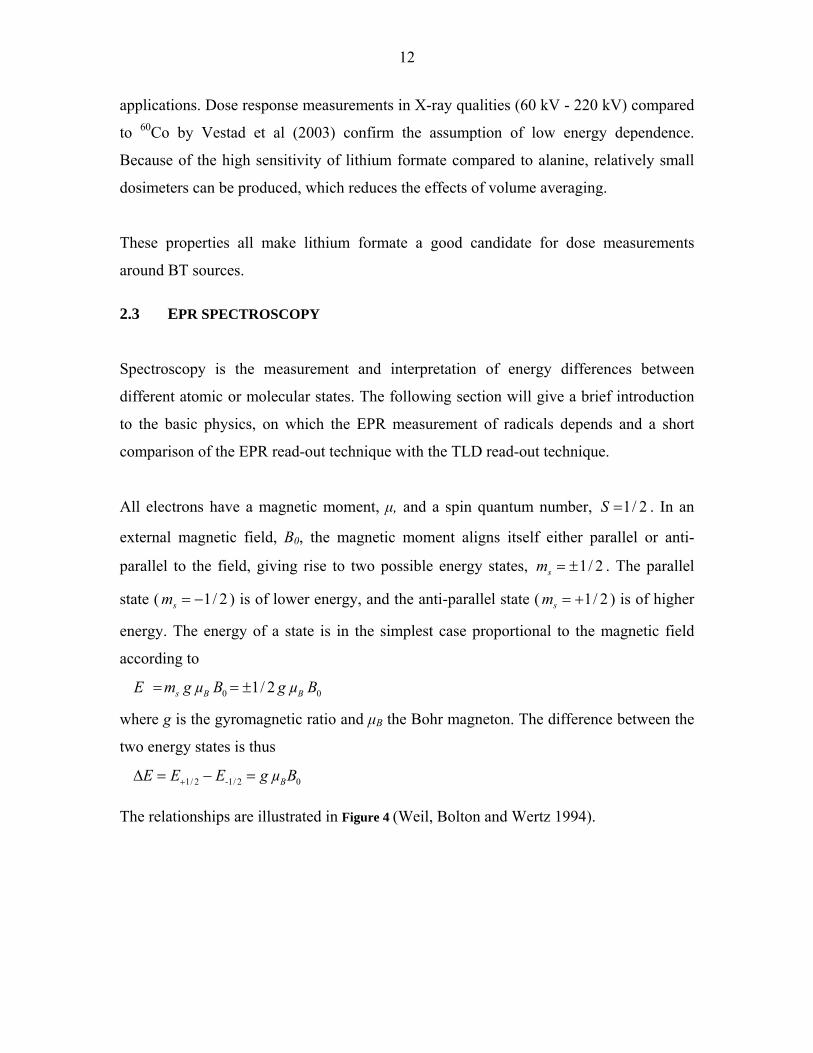
energy. The energy of a state is in the simplest case proportional to the magnetic field
according to
0 0 1/ 2 s B BE m g µ B g µ B= = ±
where g is the gyromagnetic ratio and μB the Bohr magneton. The difference between the
two energy states is thus
1/ 2 -1/ 2 0 BE E E g µ B+Δ = − =
The relationships are illustrated in Figure 4 (Weil, Bolton and Wertz 1994).
13
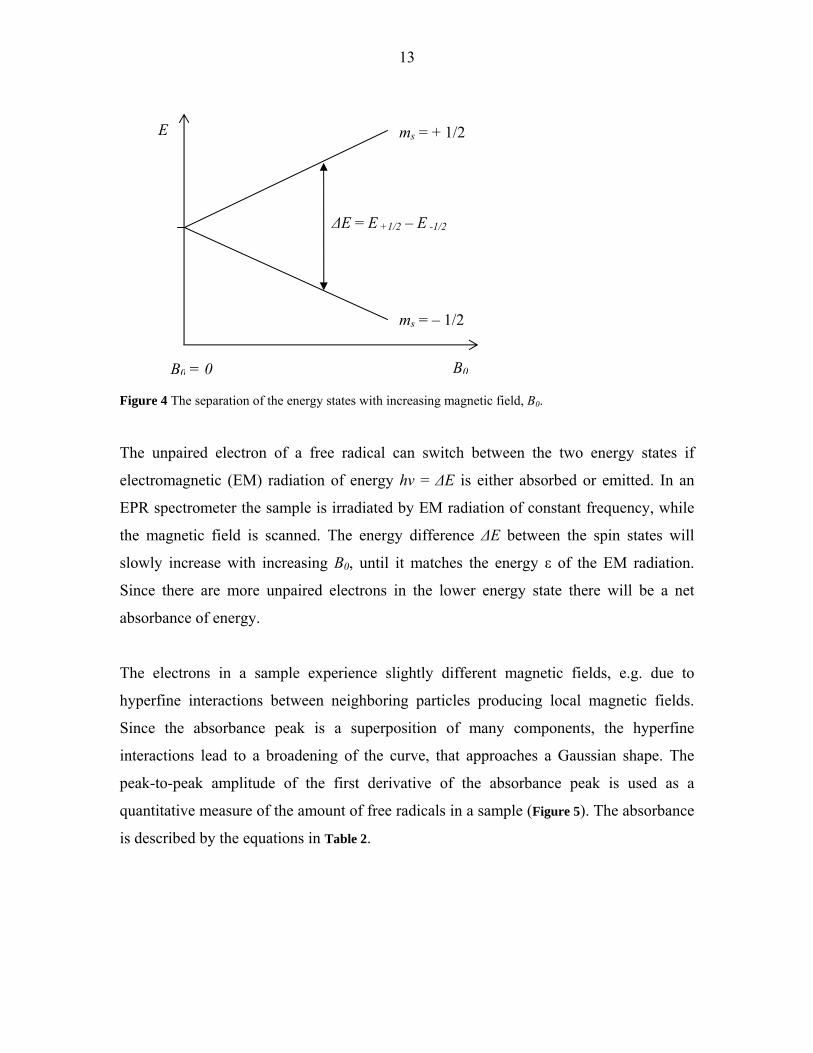
Figure 4 The separation of the energy states with increasing magnetic field, B0.
The unpaired electron of a free radical can switch between the two energy states if
electromagnetic (EM) radiation of energy hv = ΔE is either absorbed or emitted. In an
EPR spectrometer the sample is irradiated by EM radiation of constant frequency, while
the magnetic field is scanned. The energy difference ΔE between the spin states will
slowly increase with increasing B0, until it matches the energy ε of the EM radiation.
Since there are more unpaired electrons in the lower energy state there will be a net
absorbance of energy.
The electrons in a sample experience slightly different magnetic fields, e.g. due to
hyperfine interactions between neighboring particles producing local magnetic fields.
Since the absorbance peak is a superposition of many components, the hyperfine
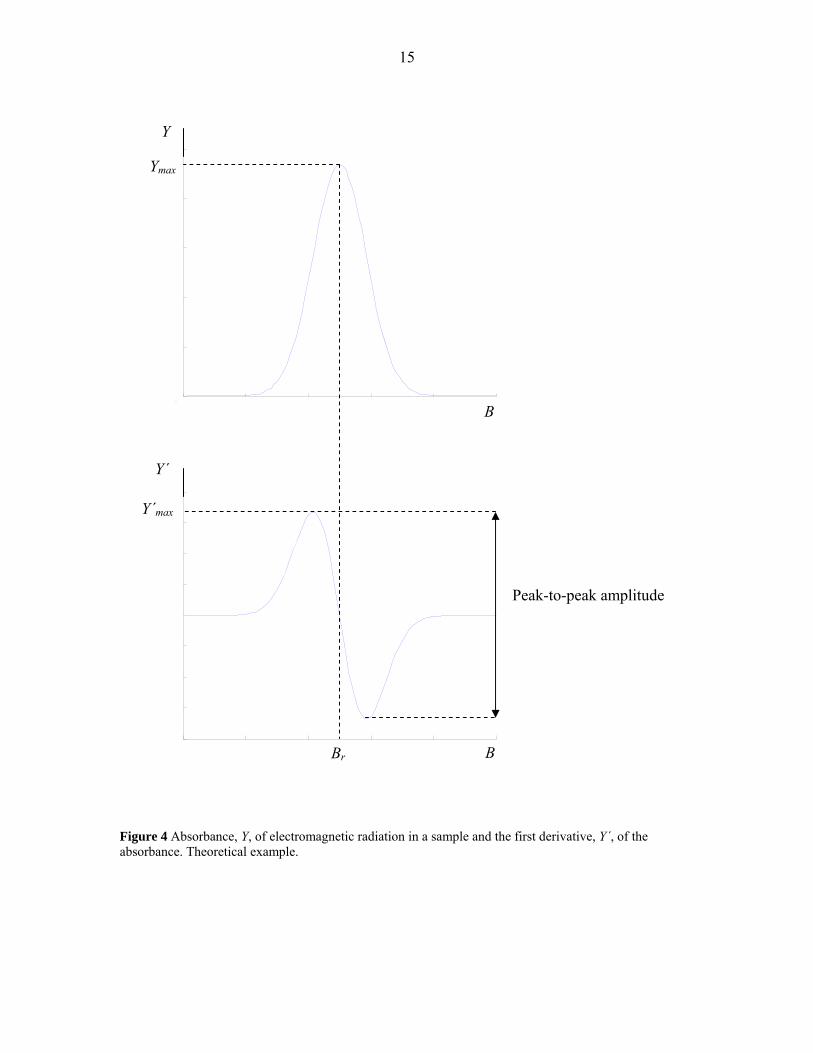
interactions lead to a broadening of the curve, that approaches a Gaussian shape. The
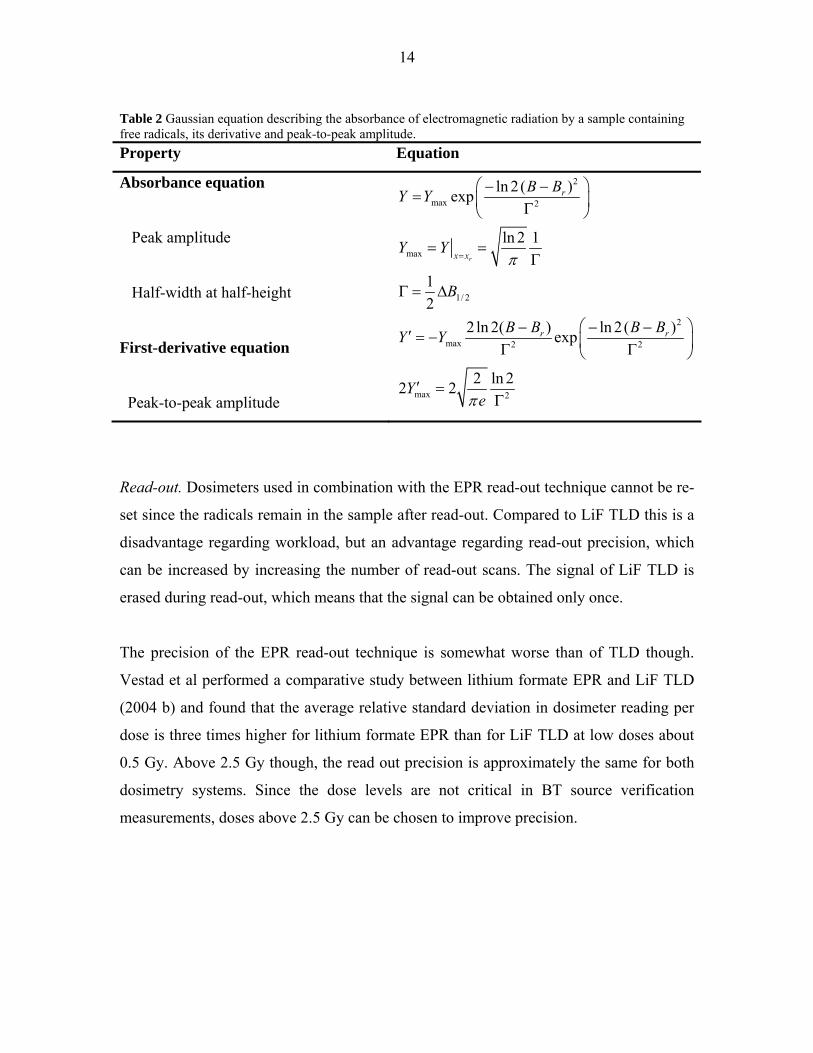
peak-to-peak amplitude of the first derivative of the absorbance peak is used as a
quantitative measure of the amount of free radicals in a sample (Figure 5). The absorbance
is described by the equations in Table 2.
B0
E
ΔE = E +1/2 – E -1/2
ms = + 1/2
ms = – 1/2
B0 = 0
14
Table 2 Gaussian equation describing the absorbance of electromagnetic radiation by a sample containing free radicals, its derivative and peak-to-peak amplitude. Property Equation
Absorbance equation
Peak amplitude
Half-width at half-height
First-derivative equation
Peak-to-peak amplitude
2
max 2
max
1/ 2
2
max 2 2
max 2
ln 2( )exp
ln 2 1
12
2ln 2( ) ln 2( )exp
2 ln 22 2
r
r
x x
r r
B BY Y
Y Y
B
B B B BY Y
Ye
π
π
=
⎛ ⎞− −= ⎜ ⎟Γ⎝ ⎠
= =Γ
Γ = Δ
⎛ ⎞− − −′ = − ⎜ ⎟Γ Γ⎝ ⎠
′ =Γ
Read-out. Dosimeters used in combination with the EPR read-out technique cannot be re-
set since the radicals remain in the sample after read-out. Compared to LiF TLD this is a
disadvantage regarding workload, but an advantage regarding read-out precision, which
can be increased by increasing the number of read-out scans. The signal of LiF TLD is
erased during read-out, which means that the signal can be obtained only once.
The precision of the EPR read-out technique is somewhat worse than of TLD though.
Vestad et al performed a comparative study between lithium formate EPR and LiF TLD
(2004 b) and found that the average relative standard deviation in dosimeter reading per
dose is three times higher for lithium formate EPR than for LiF TLD at low doses about
0.5 Gy. Above 2.5 Gy though, the read out precision is approximately the same for both
dosimetry systems. Since the dose levels are not critical in BT source verification
measurements, doses above 2.5 Gy can be chosen to improve precision.
15
0 20 40 60 80 1000
0.01
0.02
0.03
0.04
0.05
0 20 40 60 80 100-4
-3
-2
-1
0
1
2
3
4x 10
-3
Figure 4 Absorbance, Y, of electromagnetic radiation in a sample and the first derivative, Y´, of the absorbance. Theoretical example.
Peak-to-peak amplitude
B
B
Y
Y´
Br
Ymax
Y´max
16
2.4 THE LITHIUM FORMATE EPR DOSIMETRY SYSTEM
The dose determination procedure using lithium formate EPR is based on the general
EPR dosimetry method described by Bergstrand et al (1998). Gustafsson (2008) has
adapted the method to lithium formate EPR dosimetry. It is a secondary dosimetry
method, since the dosimeters must be calibrated against a reference detector, but it is used
for absolute dose determinations.
To measure dose with lithium formate, a whole batch of dosimeters is required,
consisting of typically 20 dosimeters from the same production. The homogeneity of the
batch is controlled by irradiating all dosimeters to the same dose, D0’. The resulting
signal should have a certain maximum spread for the batch to be accepted. The EPR
signal, lw, is defined as the peak-to-peak amplitude of the first derivative of the
absorbance peak l (see Section 2.3) divided by the dosimeter mass, w. The batch is
divided into a minimum of three groups; two for calibration curve determination and one
for dose measurements.
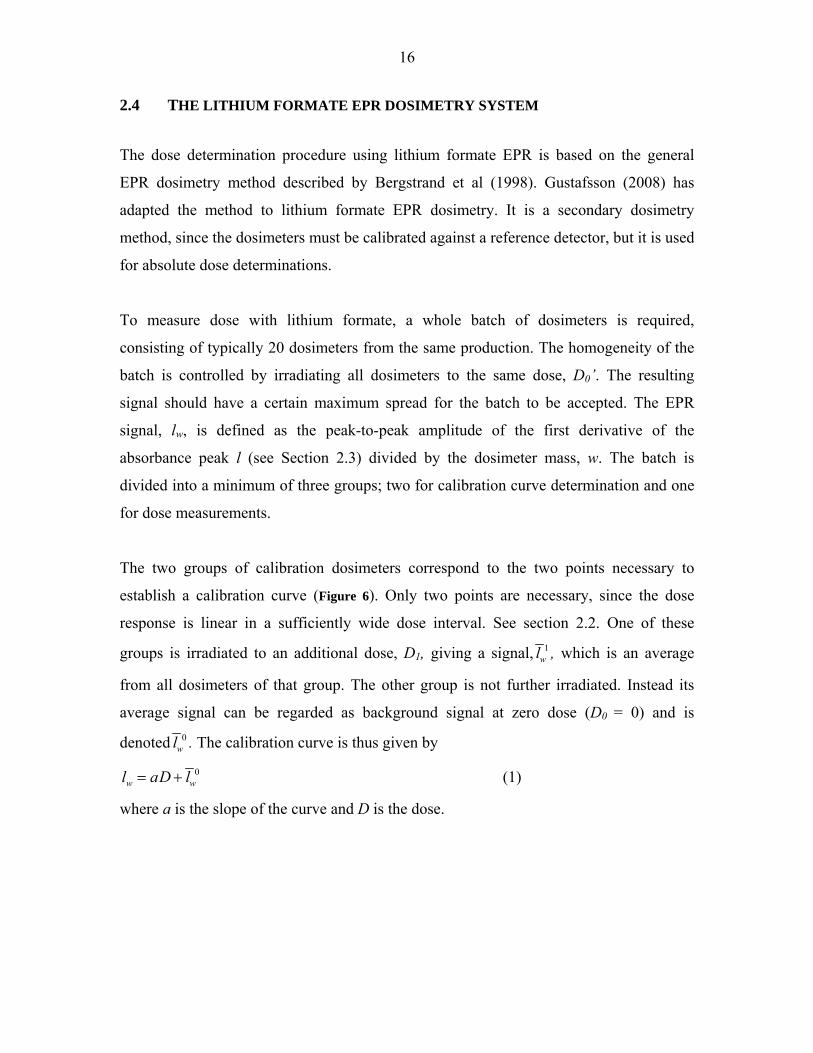
The two groups of calibration dosimeters correspond to the two points necessary to
establish a calibration curve (Figure 6). Only two points are necessary, since the dose
response is linear in a sufficiently wide dose interval. See section 2.2. One of these
groups is irradiated to an additional dose, D1, giving a signal, 1wl , which is an average
from all dosimeters of that group. The other group is not further irradiated. Instead its
average signal can be regarded as background signal at zero dose (D0 = 0) and is
denoted 0wl . The calibration curve is thus given by
0w wl aD l= + (1)
where a is the slope of the curve and D is the dose.
17
Figure 5 The calibration curve. The primes indicate that the symbols correspond to the former coordinate system. The symbols with no primes correspond to the new coordinate system in which the pre-irradiation dose, D0’, has been set to zero.
The remaining dosimeters of the batch can be used for dose measurements. To achieve
optimal accuracy it is important that the dose, D1, given to the calibration dosimeters, is
higher than the dose, DM, given to the measurement dosimeters. DM is given by the
following equation, which is a simple re-write of equation 1 with an additional correction
term adapted to the measurement situation in this work,
0 1( )M w w jj
D l l ka
= − ∏ (2)
where the ki’s are the correction factors that account for differences between the
calibration situation and the dose measurement situation. The quantitative assessment of
these factors is described in section 3.7.2. The mathematical treatment of the calibration
curve is described in detail in section 3.7.1 and the uncertainty analysis in section 3.7.3.
Dose (Gy)
Signal (1/mg)
1wl
0wl
D1 D0 = 0 Gy
lw
b D0’
lw’
18
3 MATERIALS AND METHODS
3.1 DOSIMETER MANUFACTURING
Gustafsson (2008) has developed a method of manufacturing lithium formate dosimeters
for use in high energy photon beams. In the beginning of the present work an attempt to
produce dosimeters smaller than the standard size was made, but resulted in very fragile
dosimeters. In order to strengthen the dosimeters an increased amount of binding material
was added, which reduced the sensitivity to levels that would require unreasonably long
irradiation times. Thus the relatively large standard dosimeter size (5 mm height) was
used for the measurements around 192Ir, even though low BT energies require smaller
dosimeters.
Polycrystalline lithium formate monohydrate (98 %) (HCO2 Li H2O) from Aldrich is the
active dosimetry material. Solid paraffin (CnH2n+2, n = 20 - 40) from Carbona AB is used
as a binder. The dosimeters consist of lithium formate to 90 % of their weight and of
paraffin to 10 %.
To achieve a lithium formate crystal grain size appropriate for dose measurements, two
strainers are used (Endecotts MINOR) with grid sizes of 180 and 500 μm. The remaining
powder is weighted to determine the amount of paraffin to be added. The two
components are put together in a beaker. The beaker is heated in an oven to a temperature
well below the melting point of lithium formate (94° C), but above the melting point of
paraffin (54° - 56° C); so that the binder melts before lithium formate crystals are
damaged. When the paraffin is completely molten, the two components are mixed
thoroughly. The heating and mixing is repeated twice, whereupon the mixture is cooled
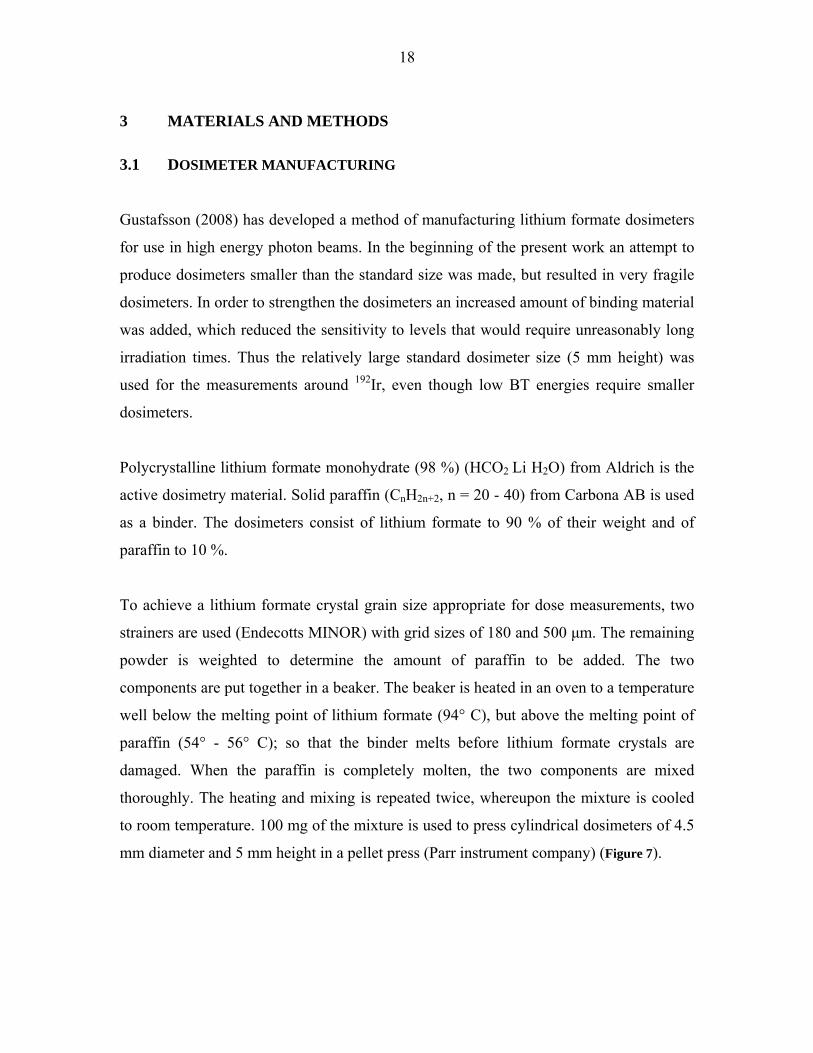
to room temperature. 100 mg of the mixture is used to press cylindrical dosimeters of 4.5
mm diameter and 5 mm height in a pellet press (Parr instrument company) (Figure 7).
19
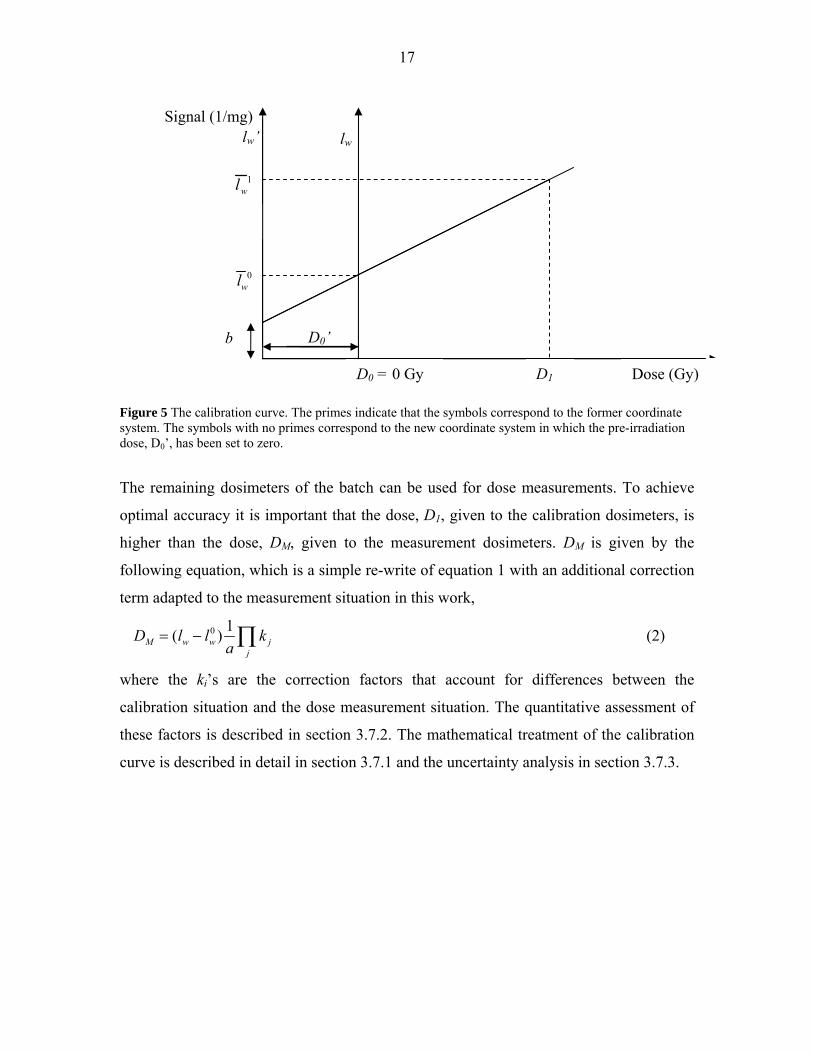
Figure 6 Four dosimeters constituting a typical group.
The dosimeters are weighted after being pressed. Dosimeters of the same mixture are
regarded as belonging to one batch and are used together in the following experiments. A
maximum mass difference of ± 2 mg was tolerated. Dosimeters outside these mass limits
were excluded from the batch. The dosimeters are identified by being labeled in the
following order: aI-aV, bI-bV, …, LI-LV. The dosimeters of one batch are all stored
under the same environmental conditions to avoid EPR signal differences caused by other
sources than ionizing irradiation.
3.2 BATCH HOMOGENEITY CONTROL
It is important that the dosimeters respond equally to irradiation. Since the dosimeters are
handmade, variations in relative amount of lithium formate versus paraffin are possible
and could affect sensitivity. The homogeneity of a batch was controlled by pre-irradiating
all dosimeters to the same dose, D0’. To achieve sufficient precision, it is important that
the dosimeters are given a dose above 2.5 Gy (Vestad et al 2004). It is not critical though
exactly which dose they are given, as long as all dosimeters get the same, since the signal
lw0 will correspond to zero-dose.
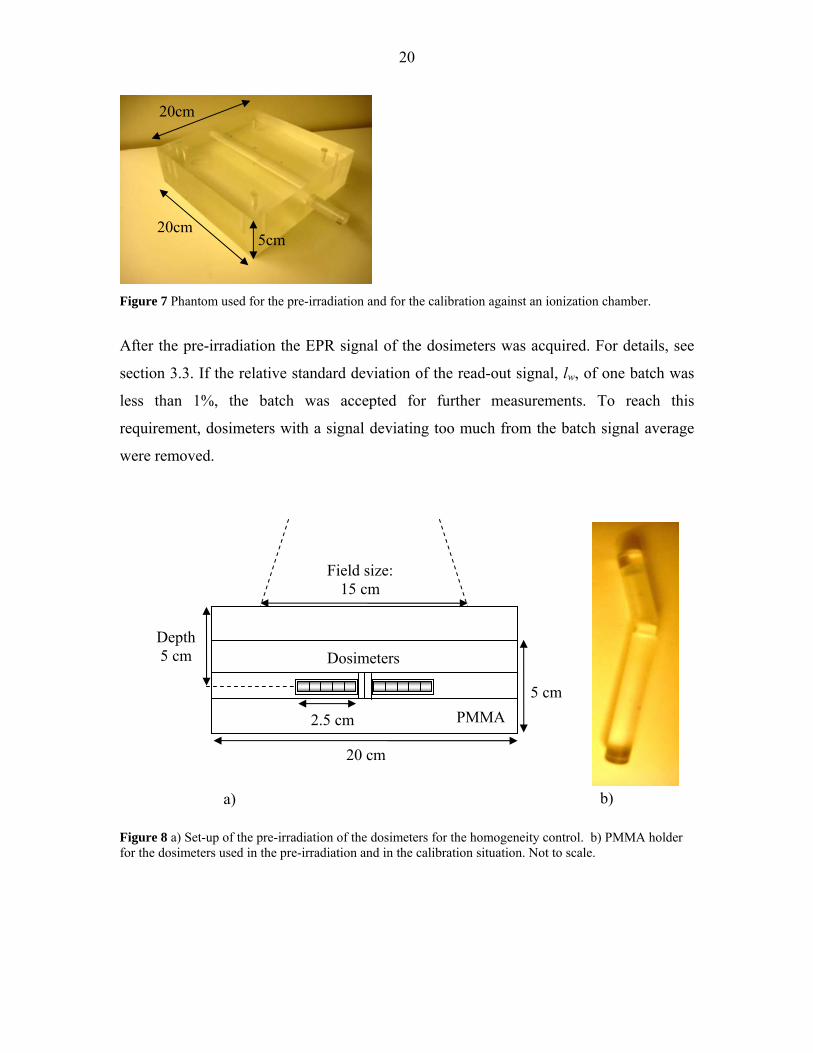
A plastic phantom of 5x20x20 cm3 was used (Figure 8). Ten dosimeters were irradiated
simultaneously to D0’ = 3 Gy at 5 cm depth in a field of 15x15 cm2 and Source to Skin
Distance (SSD) of 100 cm by 6 MV photons (Figure 9). To achieve a depth of 5 cm,
additional slabs of PMMA were placed on top of the phantom.
20
Figure 7 Phantom used for the pre-irradiation and for the calibration against an ionization chamber.
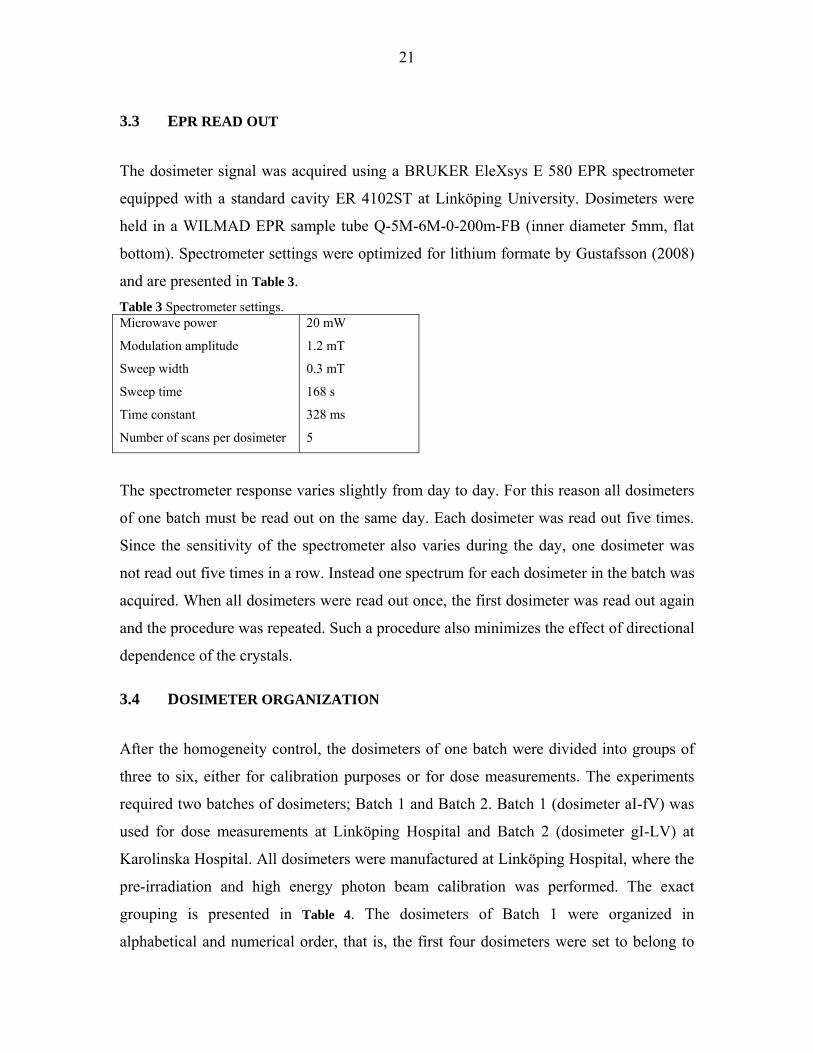
After the pre-irradiation the EPR signal of the dosimeters was acquired. For details, see
section 3.3. If the relative standard deviation of the read-out signal, lw, of one batch was
less than 1%, the batch was accepted for further measurements. To reach this
requirement, dosimeters with a signal deviating too much from the batch signal average
were removed.
Figure 8 a) Set-up of the pre-irradiation of the dosimeters for the homogeneity control. b) PMMA holder for the dosimeters used in the pre-irradiation and in the calibration situation. Not to scale.
Field size: 15 cm
20 cm
Dosimeters
5 cm
a) b)
Depth 5 cm
PMMA 2.5 cm
20cm
20cm 5cm
21
3.3 EPR READ OUT
The dosimeter signal was acquired using a BRUKER EleXsys E 580 EPR spectrometer
equipped with a standard cavity ER 4102ST at Linköping University. Dosimeters were
held in a WILMAD EPR sample tube Q-5M-6M-0-200m-FB (inner diameter 5mm, flat
bottom). Spectrometer settings were optimized for lithium formate by Gustafsson (2008)
and are presented in Table 3. Table 3 Spectrometer settings. Microwave power
Modulation amplitude
Sweep width
Sweep time
Time constant
Number of scans per dosimeter
20 mW
1.2 mT
0.3 mT
168 s
328 ms
5
The spectrometer response varies slightly from day to day. For this reason all dosimeters
of one batch must be read out on the same day. Each dosimeter was read out five times.
Since the sensitivity of the spectrometer also varies during the day, one dosimeter was
not read out five times in a row. Instead one spectrum for each dosimeter in the batch was
acquired. When all dosimeters were read out once, the first dosimeter was read out again
and the procedure was repeated. Such a procedure also minimizes the effect of directional
dependence of the crystals.
3.4 DOSIMETER ORGANIZATION
After the homogeneity control, the dosimeters of one batch were divided into groups of
three to six, either for calibration purposes or for dose measurements. The experiments
required two batches of dosimeters; Batch 1 and Batch 2. Batch 1 (dosimeter aI-fV) was
used for dose measurements at Linköping Hospital and Batch 2 (dosimeter gI-LV) at
Karolinska Hospital. All dosimeters were manufactured at Linköping Hospital, where the
pre-irradiation and high energy photon beam calibration was performed. The exact
grouping is presented in Table 4. The dosimeters of Batch 1 were organized in
alphabetical and numerical order, that is, the first four dosimeters were set to belong to
22
one group, the next four to another group and so on. When the dosimeters of Batch 2
were to be divided, consideration was paid to the mean signal of each dosimeter from the
homogeneity control. Ideally all groups of dosimeters should have the same signal
average and standard deviation, in order to achieve maximum calibration accuracy.
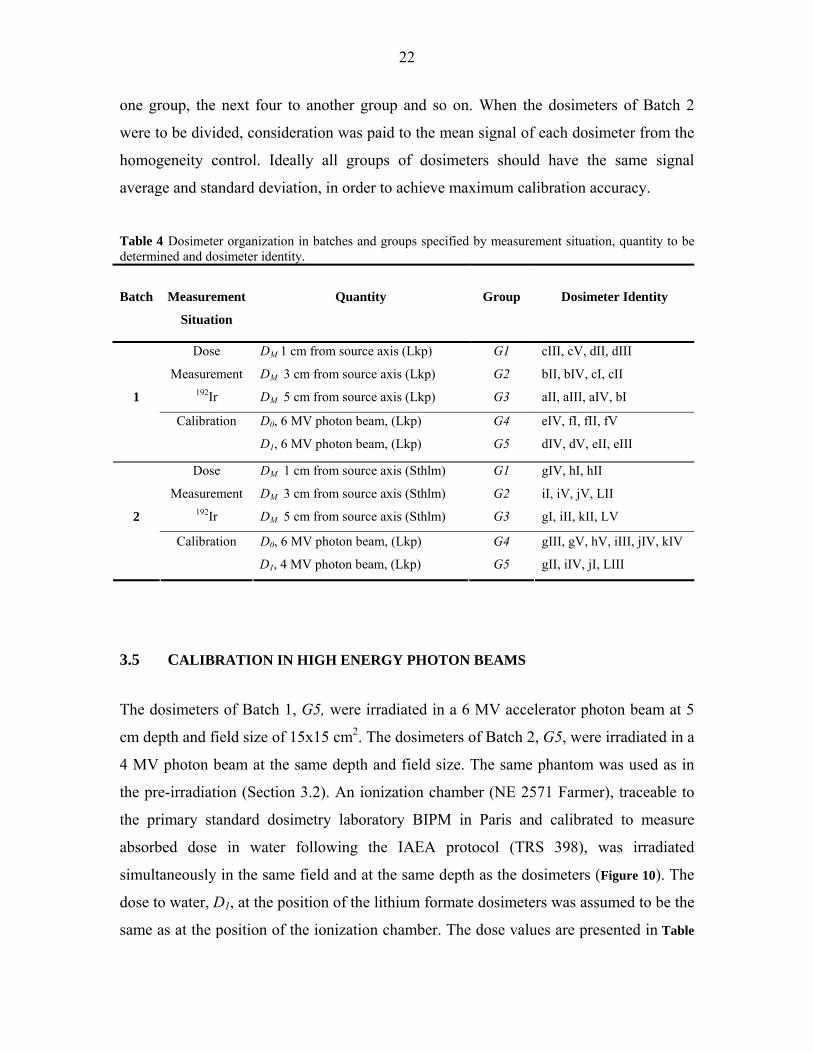
Table 4 Dosimeter organization in batches and groups specified by measurement situation, quantity to be determined and dosimeter identity.
Batch
Measurement
Situation
Quantity
Group
Dosimeter Identity
Dose
Measurement 192Ir
DM 1 cm from source axis (Lkp)
DM 3 cm from source axis (Lkp)
DM 5 cm from source axis (Lkp)
G1
G2
G3
cIII, cV, dII, dIII
bII, bIV, cI, cII
aII, aIII, aIV, bI
1
Calibration D0, 6 MV photon beam, (Lkp)
D1, 6 MV photon beam, (Lkp)
G4
G5
eIV, fI, fII, fV
dIV, dV, eII, eIII
Dose
Measurement 192Ir
DM 1 cm from source axis (Sthlm)
DM 3 cm from source axis (Sthlm)
DM 5 cm from source axis (Sthlm)
G1
G2
G3
gIV, hI, hII
iI, iV, jV, LII
gI, iII, kII, LV
2
Calibration D0, 6 MV photon beam, (Lkp)
D1, 4 MV photon beam, (Lkp)
G4
G5
gIII, gV, hV, iIII, jIV, kIV
gII, iIV, jI, LIII
3.5 CALIBRATION IN HIGH ENERGY PHOTON BEAMS
The dosimeters of Batch 1, G5, were irradiated in a 6 MV accelerator photon beam at 5
cm depth and field size of 15x15 cm2. The dosimeters of Batch 2, G5, were irradiated in a
4 MV photon beam at the same depth and field size. The same phantom was used as in
the pre-irradiation (Section 3.2). An ionization chamber (NE 2571 Farmer), traceable to
the primary standard dosimetry laboratory BIPM in Paris and calibrated to measure
absorbed dose in water following the IAEA protocol (TRS 398), was irradiated
simultaneously in the same field and at the same depth as the dosimeters (Figure 10). The
dose to water, D1, at the position of the lithium formate dosimeters was assumed to be the
same as at the position of the ionization chamber. The dose values are presented in Table
23
5. Dose profiles were studied in order to control field homogeneity. Corrections for
measuring absorbed dose to water under non-reference conditions were not performed,
but judged to be negligible compared to the inhomogeneity of the field. That is, dose to a
small Bragg Gray cavity at the position of the ionization chamber in the PMMA phantom
and a field size of 15 x 15 cm2 was assumed to be the same as dose to water in water and
a field size of 10 x 10 cm2, which are the reference conditions. The conversion from dose
to water to dose to lithium formate is described in Section 3.7.2.
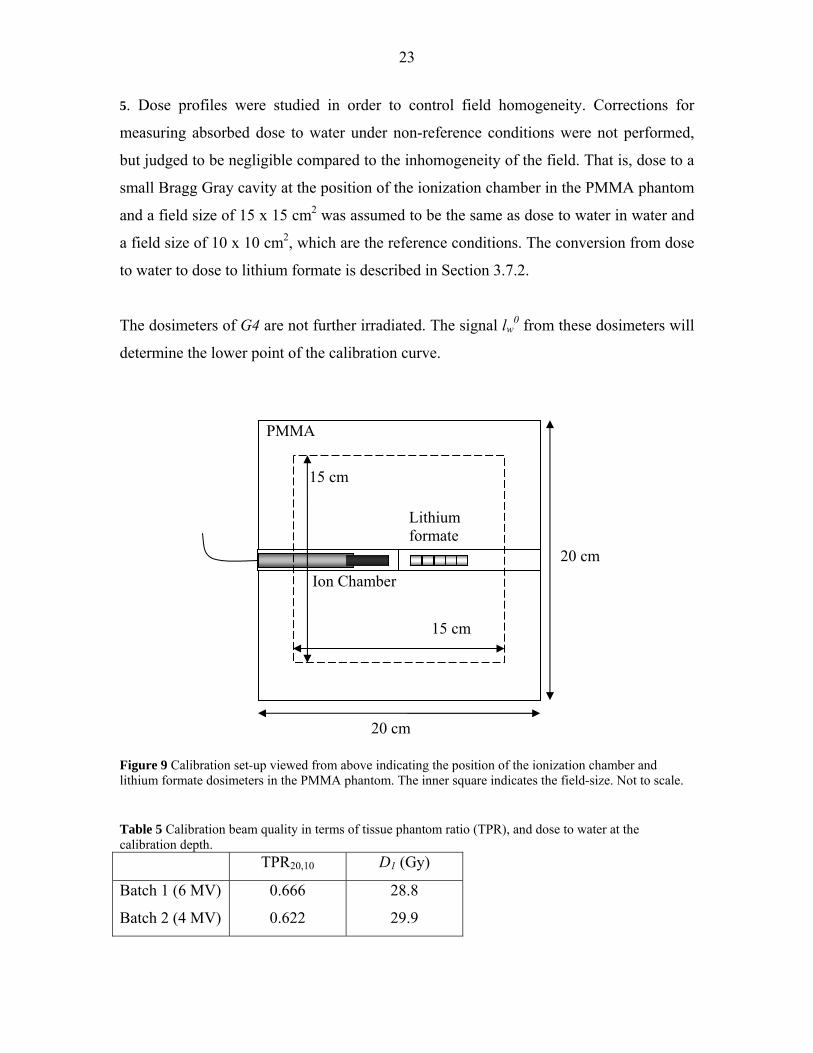
The dosimeters of G4 are not further irradiated. The signal lw0 from these dosimeters will
determine the lower point of the calibration curve.
Figure 9 Calibration set-up viewed from above indicating the position of the ionization chamber and lithium formate dosimeters in the PMMA phantom. The inner square indicates the field-size. Not to scale. Table 5 Calibration beam quality in terms of tissue phantom ratio (TPR), and dose to water at the calibration depth. TPR20,10 D1 (Gy)
Batch 1 (6 MV)
Batch 2 (4 MV)
0.666
0.622
28.8
29.9
20 cm
15 cm
20 cm
15 cm
Lithium formate
Ion Chamber
PMMA
24
3.6 192Ir DOSE MEASUREMENTS Since the fading characteristics of lithium formate are not properly investigated yet, it
was important that the dosimeter irradiation by 192Ir and by high energy photons for
calibration was performed in temporal proximity. Both irradiations of Batch 1 were
carried out on the same day, while there was a separation of approximately 48 h between
the 192Ir irradiation at Karolinska Hospital and the calibration in Linköping of Batch 2.
The irradiation was performed in a PMMA phantom using the afterloading technique.
The source used in Linköping (Batch 1) is of model Gamma Med Plus HDR
(Mallinckrodt Medical B.V.) while source model Microselectron-HDR Classic
(Mallinckrodt Medical B.V.) was used at Karolinska (Batch 2). The two sources are
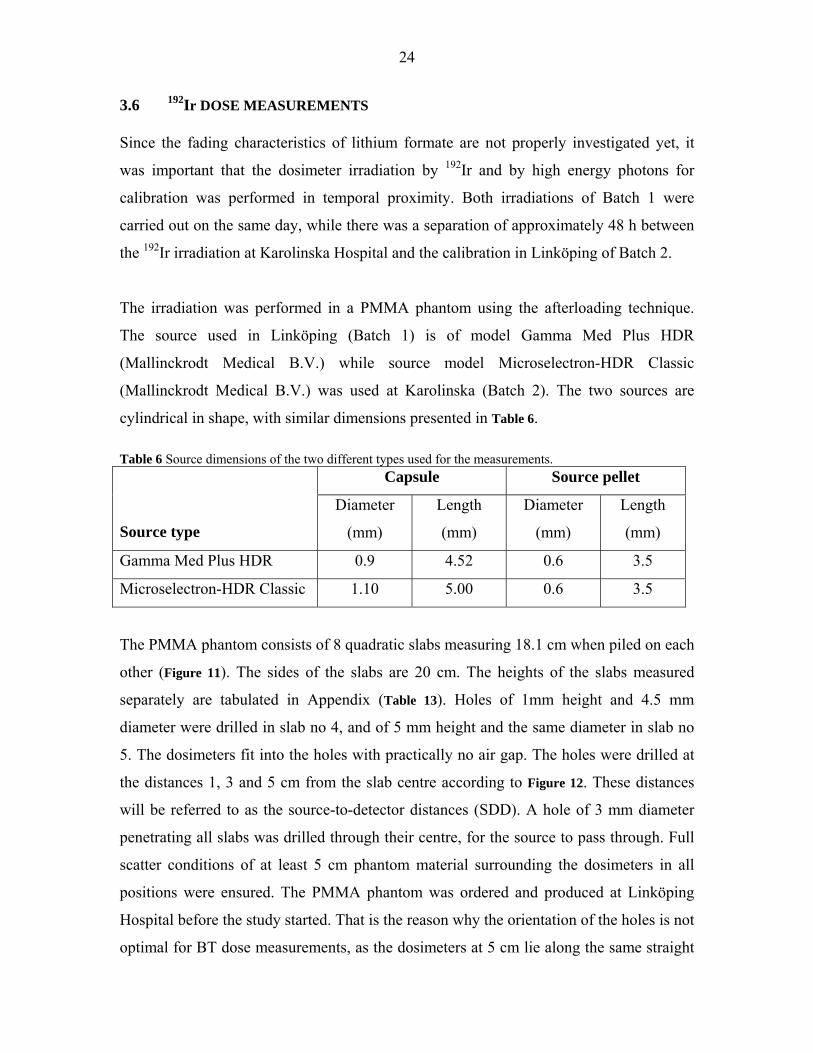
cylindrical in shape, with similar dimensions presented in Table 6. Table 6 Source dimensions of the two different types used for the measurements.
Capsule Source pellet
Source type
Diameter
(mm)
Length
(mm)
Diameter
(mm)
Length
(mm)
Gamma Med Plus HDR 0.9 4.52 0.6 3.5
Microselectron-HDR Classic 1.10 5.00 0.6 3.5
The PMMA phantom consists of 8 quadratic slabs measuring 18.1 cm when piled on each
other (Figure 11). The sides of the slabs are 20 cm. The heights of the slabs measured
separately are tabulated in Appendix (Table 13). Holes of 1mm height and 4.5 mm
diameter were drilled in slab no 4, and of 5 mm height and the same diameter in slab no
5. The dosimeters fit into the holes with practically no air gap. The holes were drilled at
the distances 1, 3 and 5 cm from the slab centre according to Figure 12. These distances
will be referred to as the source-to-detector distances (SDD). A hole of 3 mm diameter
penetrating all slabs was drilled through their centre, for the source to pass through. Full
scatter conditions of at least 5 cm phantom material surrounding the dosimeters in all
positions were ensured. The PMMA phantom was ordered and produced at Linköping
Hospital before the study started. That is the reason why the orientation of the holes is not
optimal for BT dose measurements, as the dosimeters at 5 cm lie along the same straight
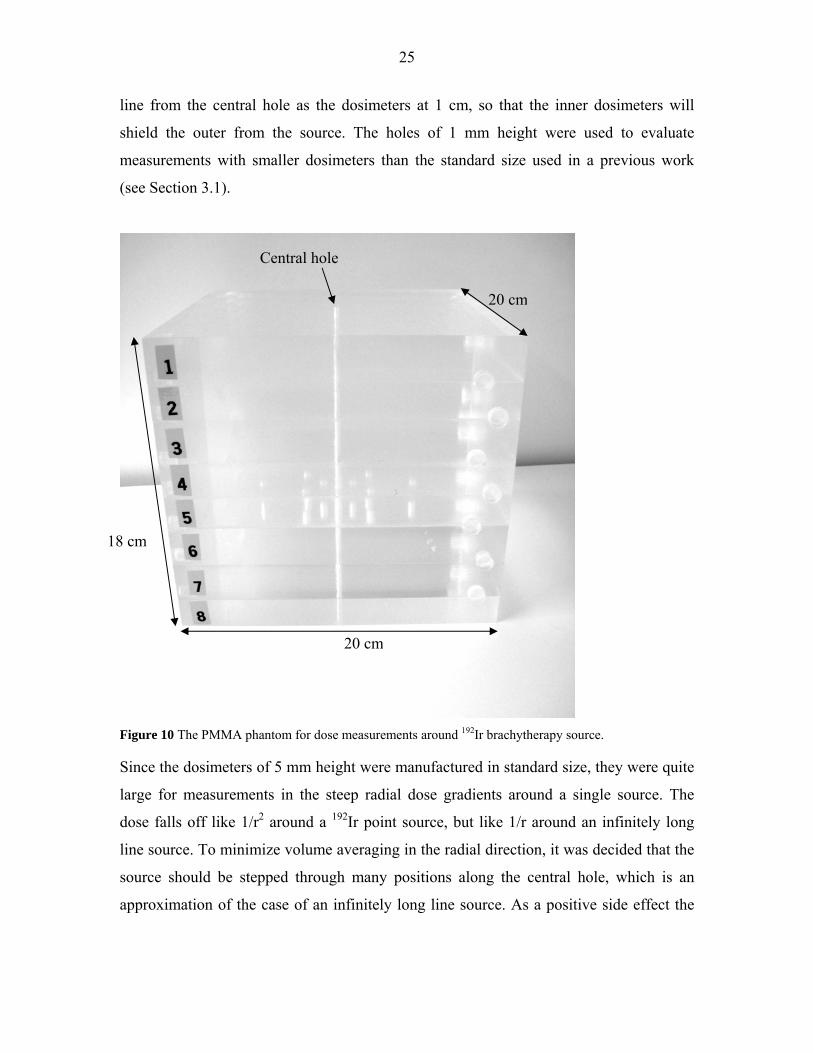
25
line from the central hole as the dosimeters at 1 cm, so that the inner dosimeters will
shield the outer from the source. The holes of 1 mm height were used to evaluate
measurements with smaller dosimeters than the standard size used in a previous work
(see Section 3.1).
Figure 10 The PMMA phantom for dose measurements around 192Ir brachytherapy source. Since the dosimeters of 5 mm height were manufactured in standard size, they were quite
large for measurements in the steep radial dose gradients around a single source. The
dose falls off like 1/r2 around a 192Ir point source, but like 1/r around an infinitely long
line source. To minimize volume averaging in the radial direction, it was decided that the
source should be stepped through many positions along the central hole, which is an
approximation of the case of an infinitely long line source. As a positive side effect the
20 cm
20 cm
18 cm
Central hole
26
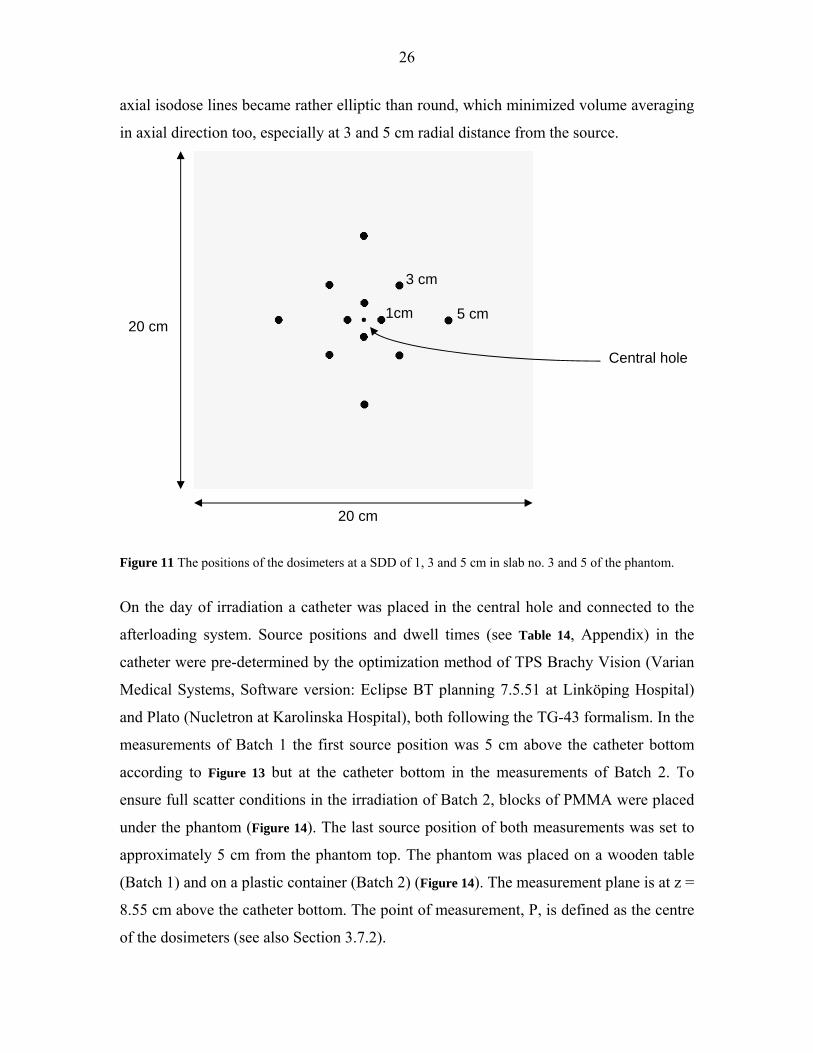
axial isodose lines became rather elliptic than round, which minimized volume averaging
in axial direction too, especially at 3 and 5 cm radial distance from the source.
Figure 11 The positions of the dosimeters at a SDD of 1, 3 and 5 cm in slab no. 3 and 5 of the phantom.
On the day of irradiation a catheter was placed in the central hole and connected to the
afterloading system. Source positions and dwell times (see Table 14, Appendix) in the
catheter were pre-determined by the optimization method of TPS Brachy Vision (Varian
Medical Systems, Software version: Eclipse BT planning 7.5.51 at Linköping Hospital)
and Plato (Nucletron at Karolinska Hospital), both following the TG-43 formalism. In the
measurements of Batch 1 the first source position was 5 cm above the catheter bottom
according to Figure 13 but at the catheter bottom in the measurements of Batch 2. To
ensure full scatter conditions in the irradiation of Batch 2, blocks of PMMA were placed
under the phantom (Figure 14). The last source position of both measurements was set to
approximately 5 cm from the phantom top. The phantom was placed on a wooden table
(Batch 1) and on a plastic container (Batch 2) (Figure 14). The measurement plane is at z =
8.55 cm above the catheter bottom. The point of measurement, P, is defined as the centre
of the dosimeters (see also Section 3.7.2).
1cm
3 cm
5 cm 20 cm
20 cm
Central hole

27
Figure 12 The experimental set-up of the dose measurement around 192Ir brachytherapy source with the dosimeters of Batch 1 at Linköping Hospital. Not to scale.
a) b) Figure 13 Set-up of the dose measurement around 192Ir brachytherapy source with the dosimeters of Batch 1 at Linköping Hospital (a) and Batch 2 at Karolinska Hospital (b).
Measurement plane
1 cm 5 cm
Dosimeters
Catheter
Catheter bottom
7
6
5
8
First source position
5cm
z = 8.55
z
28
3.7 DATA ANALYSIS
3.7.1 Calibration curve determination
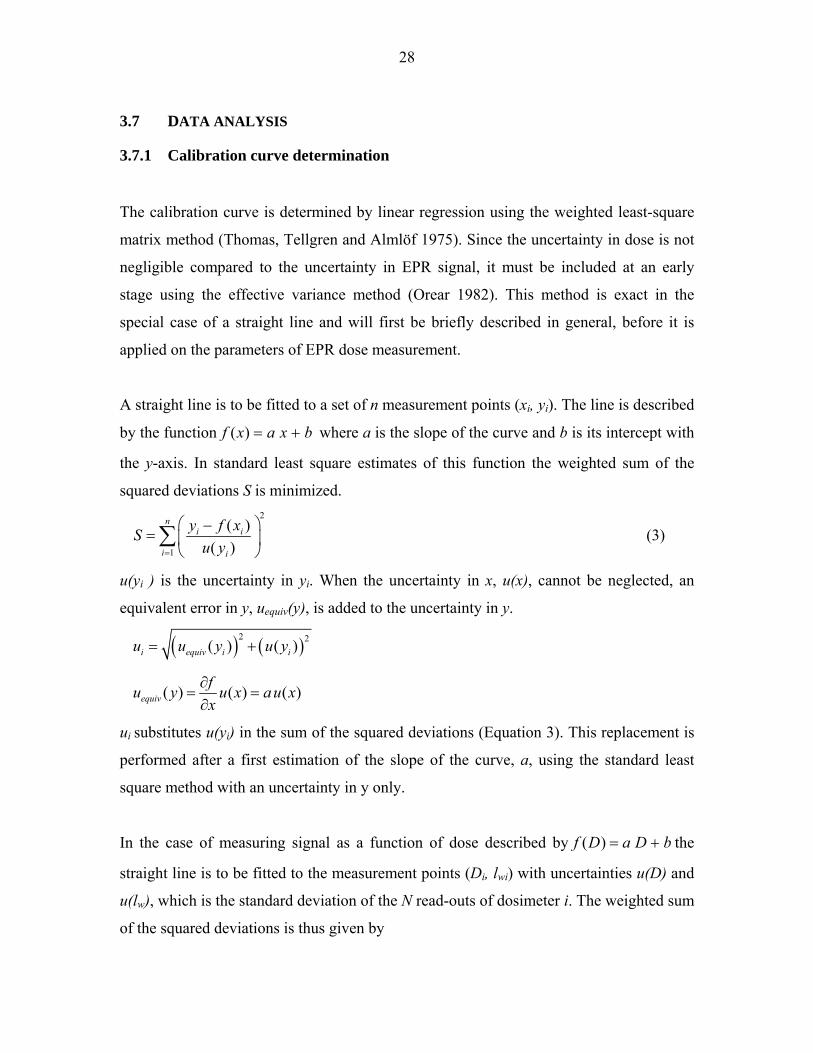
The calibration curve is determined by linear regression using the weighted least-square
matrix method (Thomas, Tellgren and Almlöf 1975). Since the uncertainty in dose is not
negligible compared to the uncertainty in EPR signal, it must be included at an early
stage using the effective variance method (Orear 1982). This method is exact in the
special case of a straight line and will first be briefly described in general, before it is
applied on the parameters of EPR dose measurement.
A straight line is to be fitted to a set of n measurement points (xi, yi). The line is described
by the function bxaxf +=)( where a is the slope of the curve and b is its intercept with
the y-axis. In standard least square estimates of this function the weighted sum of the
squared deviations S is minimized. 2
1
( )( )
ni i
i i
y f xSu y=
⎛ ⎞−= ⎜ ⎟
⎝ ⎠∑ (3)
u(yi ) is the uncertainty in yi. When the uncertainty in x, u(x), cannot be neglected, an
equivalent error in y, uequiv(y), is added to the uncertainty in y.
( ) ( )2 2( ) ( )i equiv i iu u y u y= +
( ) ( ) ( )equivfu y u x au xx∂
= =∂
ui substitutes u(yi) in the sum of the squared deviations (Equation 3). This replacement is
performed after a first estimation of the slope of the curve, a, using the standard least
square method with an uncertainty in y only.
In the case of measuring signal as a function of dose described by ( )f D a D b= + the
straight line is to be fitted to the measurement points (Di, lwi) with uncertainties u(D) and
u(lw), which is the standard deviation of the N read-outs of dosimeter i. The weighted sum
of the squared deviations is thus given by
29
2
1
( )nwi i
i i
l f DSu=
⎛ ⎞−= ⎜ ⎟
⎝ ⎠∑ (4)
where ( ) ( )2 2, ,( ) ( )i equiv w i w iu u l u l= + and ( ) ( )equiv wu l au D= .
This method might seem to be unnecessarily complicated to use, as a straight line is
simply determined by the two points (D0, 0wl ) and (D1, 1
wl ), but the main purpose of the
method is to obtain the resulting variance and covariance of a and b needed for the
uncertainty analysis (see Section 3.7.3). b will substitute 0wl in equation 2
1( )M w jj
D l b ka
= − ∏ (5)
3.7.2 Relative energy response correction, E(r)
The correction term in equation 2 and 5 can be referred to as the relative energy response
correction, E(r), previously defined in Section 2.2 as the ratio of dosimeter response per
unit dose in water at the measurement point, P, in the BT source geometry (lw / D)P , to
the response per unit dose in the calibration geometry, (lw / D)cal, (Rivard et al 2004).
Equation 5 can thus be written as
( ) 1 ( )M wD l b E ra
= −
where ( )( )
/( )
/w P
jjw cal
l DE r k
l D= =∏
E(r), excluding corrections for volume averaging, could be estimated by free-air
measurements, irradiating the dosimeters to a known dose by X-rays matching the energy
spectrum of 192Ir. Such measurements are difficult to perform; e.g. there is no X-ray beam
quality obtainable at the Swedish secondary standard dosimetry laboratory, SSI, matching
the 192Ir spectrum in water at 1, 3 and 5 cm from the source. Even if a spectrum could be
substituted by an effective energy, irradiation times would be unreasonably long to
achieve doses high enough for sufficient read-out precision. On top of that the uncertainty
of ionization chamber dosimetry is large in the BT energy range (Rivard et al 2004).
30
Instead of an experimental determination of the correction, it was evaluated by
calculations and by a qualitative analysis. Such an evaluation does not give any
information about the intrinsic energy dependence. The dosimeters were assumed to be
intrinsically linear, which means that the response is a linear function of the energy
imparted.
The following corrections constitute E(r); conversion from dose to water to dose to the
dosimeters in the calibration situation, k1, conversion from dose to the dosimeters to dose
to water in the 192Ir irradiation situation, k2, and correction for volume averaging, k3. The
effects of using PMMA instead of water as phantom material will be discussed briefly. In
the same context the effects of detector-self-absorption and medium displacement are
mentioned.
Dose to dosimeter conversion, k1 The dose to water in PMMA, Dw,PMMA, at the point of the ionization chamber in the
calibration situation needed to be converted to dose to lithium formate in PMMA
DLiFo,PMMA. As a first step Dw,PMMA was converted to dose to PMMA in PMMA,
DPMMA,PMMA, by use of Bragg Gray cavity theory, since the ionization chamber is regarded
as a small cavity within the phantom material (Attix, 1986).
, ,PMMA
w PMMA PMMA PMMA m wD D s=
As a second step DPMMA,PMMA was converted to DLiFo,PMMA. Since the electron range in
PMMA irradiated by 4 and 6 MV photons (1 - 10 mm) is approximately the size of the
dosimeters (4.5 - 5mm), the dosimeters were regarded as medium size. Transient charged
particle equilibrium (TCPE) was assumed throughout the dosimeter volume since the
dosimetry material has absorption properties similar to the phantom material. In this
situation Burlin cavity theory (Burlin, 1968) was applied for the conversion. The
correction factor is given by
( ) ( ),
,
1LiFormate
LiFo PMMA LiFormate enB m PMMA
PMMA PMMA PMMA
Df d s d
Dμρ
⎛ ⎞= = + − ⎜ ⎟
⎝ ⎠ (6)
31
where DLiFo,PMMA is the dose to the dosimeters, DPMMA,PMMA is the dose to PMMA, LiFom PMMAs
is the ratio of mass collision stopping powers for lithium formate and water, averaged
over the spectrum of secondary electrons at the measurement point, ( )/ LiFoen PMMA
μ ρ is the
ratio of mass energy-absorption coefficients for lithium formate and water, averaged over
the photon spectrum, and d is a parameter related to the cavity size. It is given by the
following equations
1 gedg
β
β
−−=
SVg 4
=
1.40max
16.0( 0.030)E
β =−
where g is the mean chord length, V is the dosimeter volume, S the dosimeter surface
area, β is the effective attenuation coefficient for electrons in the cavity material and Emax
is the maximum electron energy.
For simplicity Emax was set to correspond to the accelerator voltage (4 and 6 MeV
respectively), since small changes in Emax give negligible changes in k1. ( / )enμ ρ was
weighted over the photon energy spectrum in air produced by 4 and 6 MV accelerators
(Mohan et al, 1985), where the photon energy fluence is used as weighting factor. mscoll was weighted over the corresponding electron energy spectrum with electron fluence as
weighting factor. The photon fluence of the spectrum was multiplied by the Compton
cross-section of PMMA to obtain the electron fluence (XCOM, Berger et al 2005), since
Compton is the dominating interaction process in the energy interval. The fact, that
photons in a discrete energy interval produce electrons of a range of energies, was
assumed to have minimal effect on k1, since the stopping power ratio is extremely stable
over the energy range in question. Instead the average Compton electron energy was used
for values of mscoll.
32
The single crystals of lithium formate are quite large (< 500 μm) before being pressed to
dosimeters together with paraffin, and it might questioned whether they can be regarded
as homogenously mixed with the binder. An alternative approach is to regard the
dosimeters as being composed of lithium formate only, which is the active material,
while paraffin has no dosimetric function. The final value of fB was thus set to be the
average of the factor calculated for pure lithium formate and the factor calculated for a
mixture between lithium formate and paraffin. Mass energy absorption coefficients were
obtained by adding the coefficients of the atomic constituents by Bragg’s additivity law.
Values were obtained from the National Institute of Standards and Technology (NIST)
(Hubbell and Seltzer 2004).
Mass collision Stopping Powers were obtained by use of the ESTAR program at NIST
(Berger et al 2005).
The total correction factor, k1 , is given by
1PMMA
m w Bk s f=
The correction factor was extracted before the linear regression and included directly into
equation 5.
Dose to water conversion, k2 The dose to the dosimeters irradiated by 192Ir needed to be converted to dose to water.
The range of the electrons (0.05 mm) is much shorter than in the calibration situation.
The dosimeters were therefore regarded as big cavities and CPE was assumed throughout
the whole volume. The second correction term was given by the ratio of the mass energy
absorption coefficients weighted over the photon energy spectrum of 192Ir with the energy
fluence, ψ(hv), as weighting factor according to the following equation (Burlin, 1968)
2
( )( )
( )( )
en ii
iWater Water
LiFormate en ii
i LiFormate
hhDk
D hh
μ νψ νρ
μ νψ νρ
⎛ ⎞⎜ ⎟⎝ ⎠= =
⎛ ⎞⎜ ⎟⎝ ⎠
∑
∑
33
Values of ( / )enμ ρ were only obtainable for specific energies at the NIST database
(Hubbell and Seltzer, 2004). Therefore logarithmic interpolation to the energies in the
spectrum of 192Ir in water at 1, 3 and 5 cm radial distance from the source axis was
performed by Carlsson-Tedgren (personal communication). The spectra at 1 and 5 cm
were derived by EGS4 MC simulations in conjunction with calculations around a mHDR-
classic 192Ir source (Carlsson Tedgren personal communication). The spectrum at 3 cm
was obtained by linear interpolation between the spectra at 1 and 5 cm. The resulting
correction factor, k2, was set to be the average of the factor calculated for pure lithium
formate and the factor calculated for a mixture between lithium formate and paraffin.
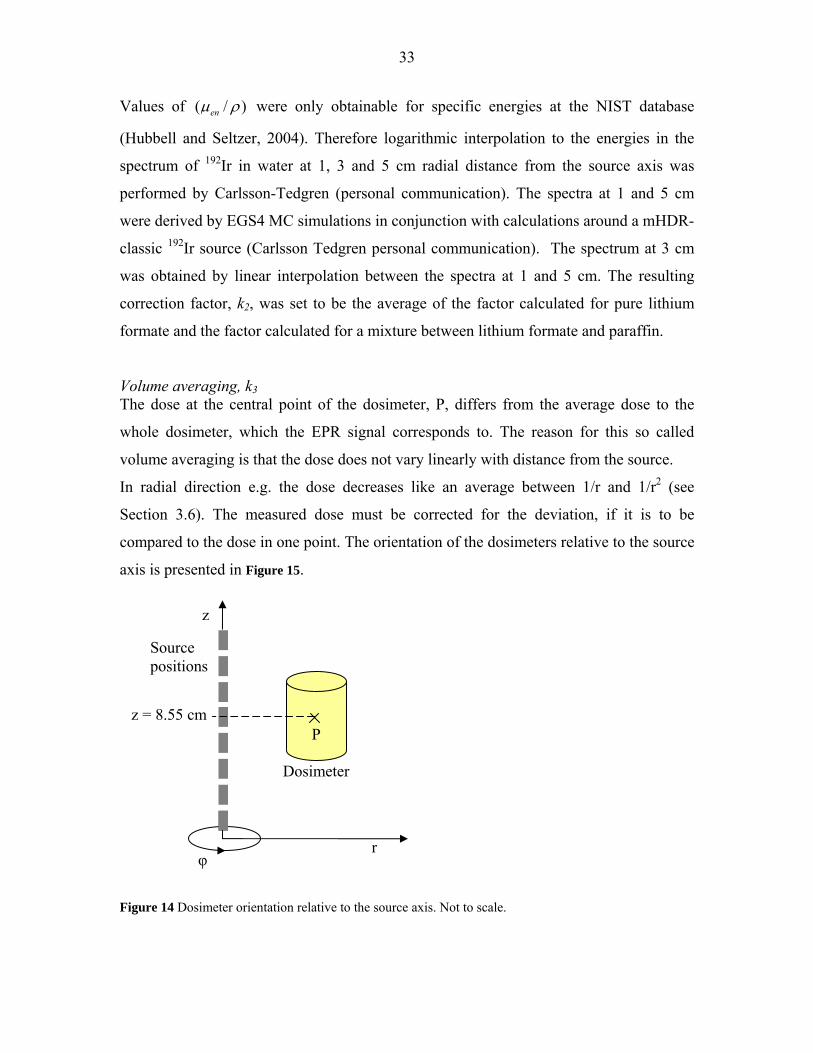
Volume averaging, k3 The dose at the central point of the dosimeter, P, differs from the average dose to the
whole dosimeter, which the EPR signal corresponds to. The reason for this so called
volume averaging is that the dose does not vary linearly with distance from the source.
In radial direction e.g. the dose decreases like an average between 1/r and 1/r2 (see
Section 3.6). The measured dose must be corrected for the deviation, if it is to be
compared to the dose in one point. The orientation of the dosimeters relative to the source
axis is presented in Figure 15.
Figure 14 Dosimeter orientation relative to the source axis. Not to scale.
z
φ r
Source positions
Dosimeter
P z = 8.55 cm
34
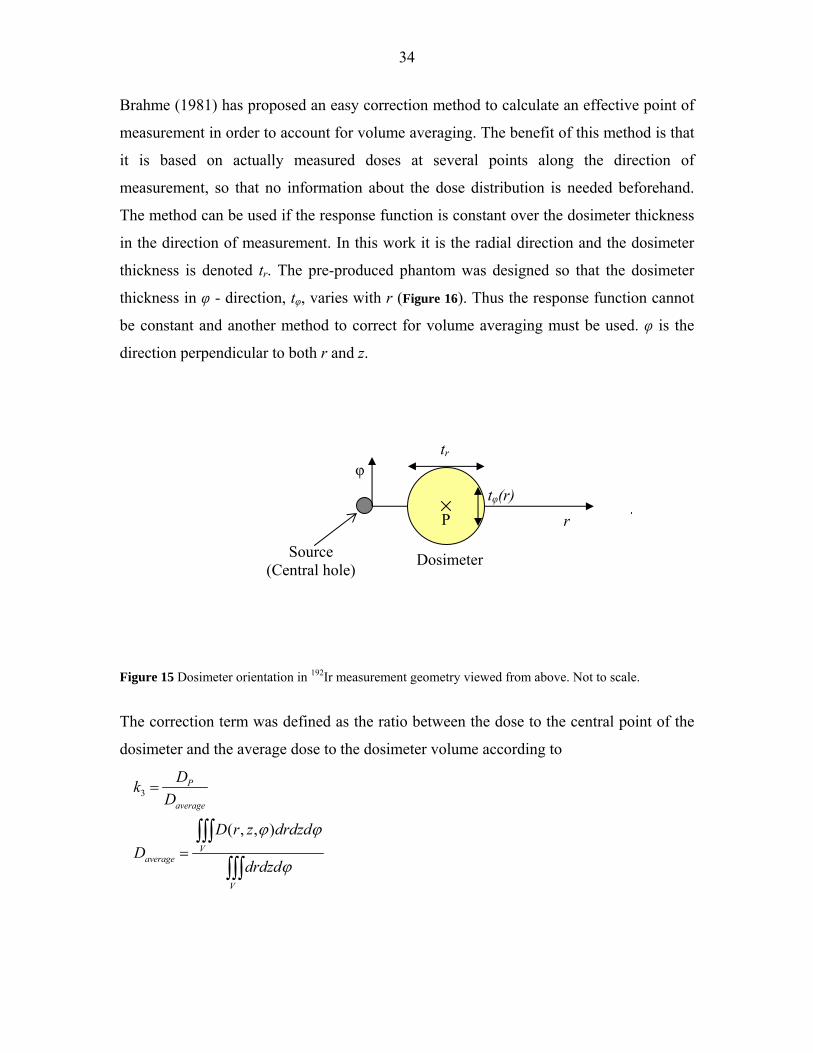
Brahme (1981) has proposed an easy correction method to calculate an effective point of
measurement in order to account for volume averaging. The benefit of this method is that
it is based on actually measured doses at several points along the direction of
measurement, so that no information about the dose distribution is needed beforehand.
The method can be used if the response function is constant over the dosimeter thickness
in the direction of measurement. In this work it is the radial direction and the dosimeter
thickness is denoted tr. The pre-produced phantom was designed so that the dosimeter
thickness in φ - direction, tφ, varies with r (Figure 16). Thus the response function cannot
be constant and another method to correct for volume averaging must be used. φ is the
direction perpendicular to both r and z.
Figure 15 Dosimeter orientation in 192Ir measurement geometry viewed from above. Not to scale.
The correction term was defined as the ratio between the dose to the central point of the
dosimeter and the average dose to the dosimeter volume according to
3
( , , )
P
average
Vaverage
V
DkD
D r z drdzdD
drdzd
ϕ ϕ
ϕ
=
=∫∫∫
∫∫∫
Source (Central hole)
r P
Dosimeter
tφ(r)
tr
φ
35
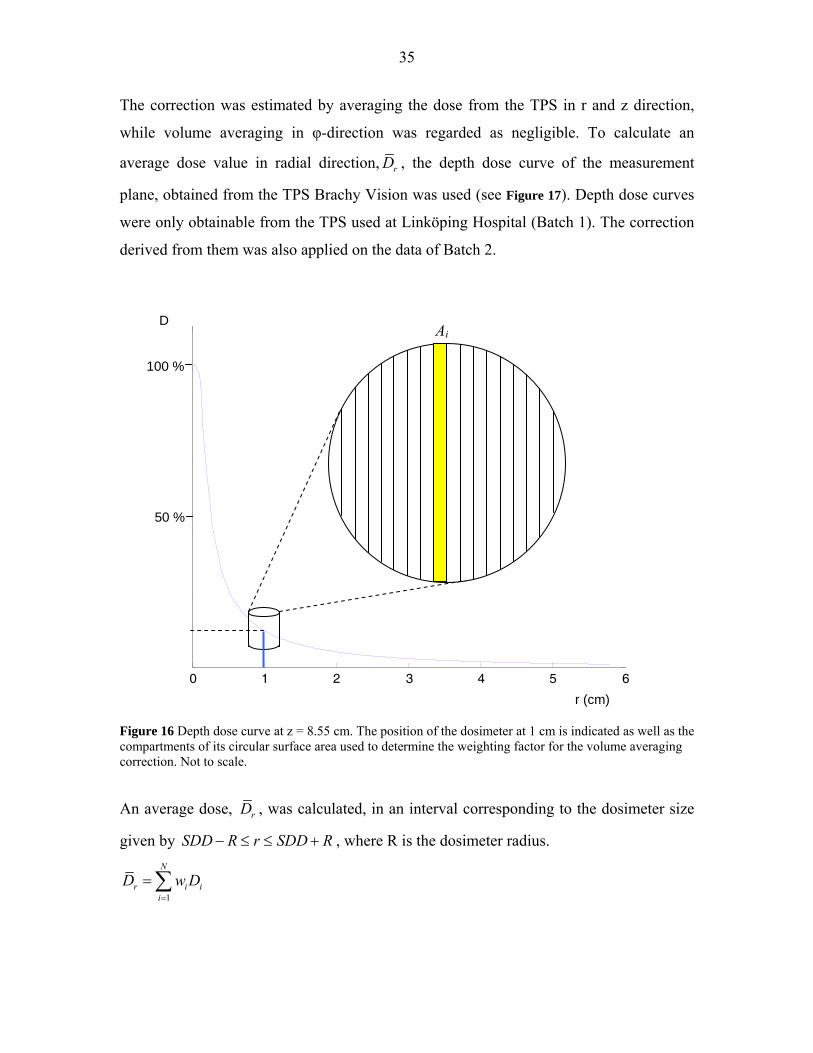
The correction was estimated by averaging the dose from the TPS in r and z direction,
while volume averaging in φ-direction was regarded as negligible. To calculate an
average dose value in radial direction, rD , the depth dose curve of the measurement
plane, obtained from the TPS Brachy Vision was used (see Figure 17). Depth dose curves
were only obtainable from the TPS used at Linköping Hospital (Batch 1). The correction
derived from them was also applied on the data of Batch 2.
0 1 2 3 4 5 60
50
100
150
200
250
Radial distance from the source (cm)
Dos
e (G
y)
Dosprofile z = 85.5 mm
Figure 16 Depth dose curve at z = 8.55 cm. The position of the dosimeter at 1 cm is indicated as well as the compartments of its circular surface area used to determine the weighting factor for the volume averaging correction. Not to scale.
An average dose, rD , was calculated, in an interval corresponding to the dosimeter size
given by SDD R r SDD R− ≤ ≤ + , where R is the dosimeter radius.
1
N
r i ii
D w D=
=∑
r (cm)
Ai D 100 %
50 %

36
The weighting factor, wi, was obtained by dividing the circular area, A, of the dosimeters
into N compartments according to Figure 17.
ii
AwA
=
where Ai the area of compartment i given by
2 ( )i iRA t r
N ϕ=
2R/N is the compartment thickness and ( )it rϕ is the dosimeter thickness at ri, the centre of
compartment i. The number of compartments was set to N = 18 in order to match the data
intervals of the dose profiles.
A radial dose average was calculated for 7 different positions along the z-axis (z = 82.5,
83.5, 84.5, 85.5 86.4, 87.4, 88.4). The dose from the TPS corresponding to point P was
now divided by the total average of these 7 values to obtain an estimation of k3. This was
done for all three measurement points; 1, 3 and 5 cm radial distance from the source.
An estimation of the size of the correction in radial direction k3,r was obtained from the
radial average at z = 85.5. An axial correction factor, k3,a , was obtained by an average of
the dose at r = 1, 3 and 5 cm respectively in the 7 different rφ-planes.
Effects of measurement medium and phantom size on absorbed dose, k4
According to TG-43 the energy response also depends on detector self-absorption,
medium displacement, and conversion from the measurement medium to liquid water
(Rivard et al 2004). A study on the choice of phantom material for dosimetry of 192Ir
sources supports the use of PMMA as phantom material instead of water under full
scatter conditions, as it is quite water equivalent (Meli et al 1988). See Section 2.2.
Compton scattering is the dominating interaction process at the energies of 192Ir. The
faster absorption of primary photons in PMMA, due to a higher density than water, is
thus compensated for by faster build up of secondary photons. The same reasoning can be
applied on the effects of detector-self absorption and medium displacement, as lithium
formate also resembles water to a high degree, but has a higher density. Furthermore the
dosimeters are much smaller than the distances that the photons have to travel in the
Di
37
PMMA, why deviations from the model should have little effect on the dose to the
dosimeters. A correction factor accounting for detector self-absorption, medium
displacement, and conversion from the measurement medium to liquid water is set to
unity.
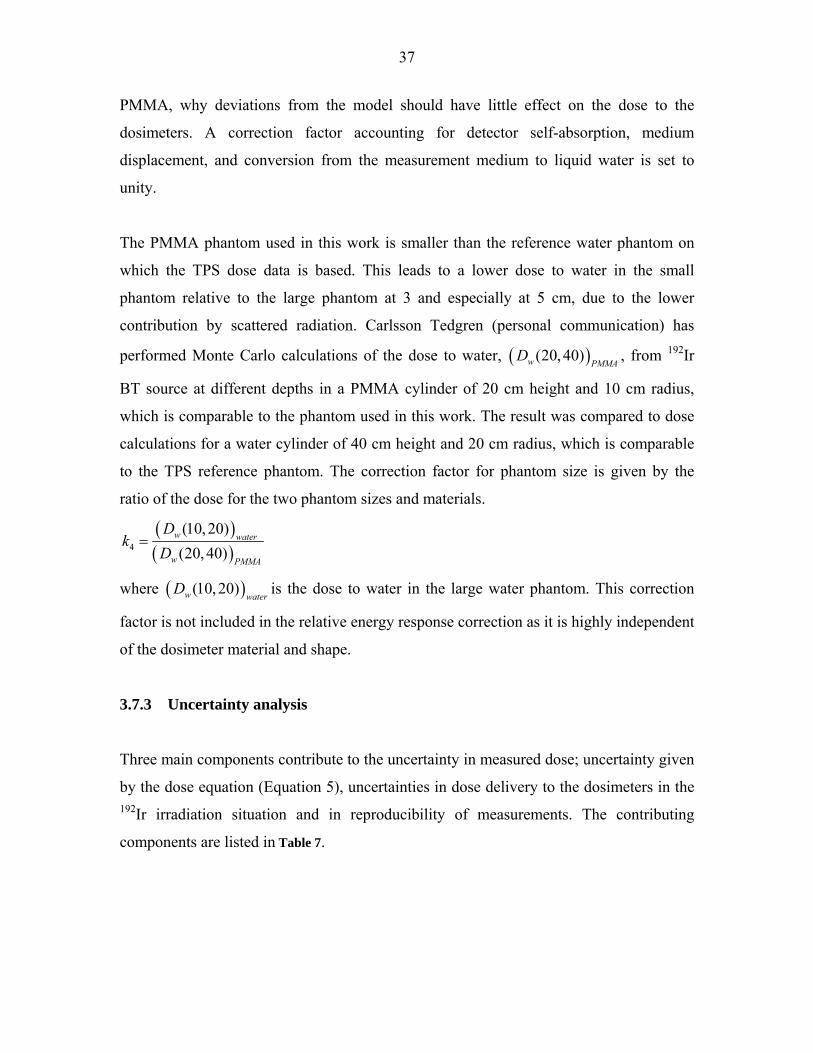
The PMMA phantom used in this work is smaller than the reference water phantom on
which the TPS dose data is based. This leads to a lower dose to water in the small
phantom relative to the large phantom at 3 and especially at 5 cm, due to the lower
contribution by scattered radiation. Carlsson Tedgren (personal communication) has
performed Monte Carlo calculations of the dose to water, ( )(20, 40)w PMMAD , from 192Ir
BT source at different depths in a PMMA cylinder of 20 cm height and 10 cm radius,
which is comparable to the phantom used in this work. The result was compared to dose
calculations for a water cylinder of 40 cm height and 20 cm radius, which is comparable
to the TPS reference phantom. The correction factor for phantom size is given by the
ratio of the dose for the two phantom sizes and materials.
( )( )4
(10, 20)(20, 40)
= w water
w PMMA
Dk
D
where ( )(10, 20)w waterD is the dose to water in the large water phantom. This correction
factor is not included in the relative energy response correction as it is highly independent
of the dosimeter material and shape.
3.7.3 Uncertainty analysis
Three main components contribute to the uncertainty in measured dose; uncertainty given
by the dose equation (Equation 5), uncertainties in dose delivery to the dosimeters in the 192Ir irradiation situation and in reproducibility of measurements. The contributing
components are listed in Table 7.

38
Table 7 List of uncertainty components, notation and type.
Component
Notation
Type
Dose equation:
EPR signal corresponding to measured dose
Calibration:
Slope of the curve
Curve intercept with signal axis
Covariance of a and b
Correction factors:
Dose to dosimeter conversion factor
Dose to medium conversion factor
Volume averaging correction factor
Phantom material substituting water
u(lw)
u(a)
u(b)
u(a, b)
u(k1)
u(k2)
u(k3)
u(k4)
A
A+B
A+B
A+B
B
B
B
A+B 192Ir dose delivery system:
Source positioning in radial direction
Source positioning in axial direction
Source calibration
u(D)
pos,r
u(D)pos,z
u(D)cal
B
B
A+B
Uncertainty given by the dose equation.
The total combined uncertainty in measured dose obtained by the dose equation (5),
u(DM), was estimated by adding the uncertainties of its parameters according to the law
of propagation (ISO 1995). 22 2 2
2 ( ) ( ) ( ) ( ) 2 ( , ) ( )M w jjw j
D D D D D Du D u l u a u b u a b u kl a b a b k
⎛ ⎞⎛ ⎞∂ ∂ ∂ ∂ ∂ ∂⎛ ⎞ ⎛ ⎞= + + + + ⎜ ⎟⎜ ⎟ ⎜ ⎟ ⎜ ⎟ ⎜ ⎟∂ ∂ ∂ ∂ ∂ ∂⎝ ⎠ ⎝ ⎠⎝ ⎠ ⎝ ⎠∑
The uncertainty in lw, u(lw), is given by the standard deviation of the signal mean from the
different read-outs of one dosimeter and by the uncertainty due to the inhomogeneous
39
dose response of the dosimeters given by the relative standard deviation of the batch
signal (1%) obtained by the homogeneity control .
( ) 0.01σ
= +wlw wu l l
n
The uncertainty of the parameters of the calibration curve, a and b, is given by the
covariance matrix obtained by linear regression. It depends on the uncertainties of the
input parameters D0 and D1 and their corresponding signals. See Section 2.4. The relative
uncertainty in calibration dose, u(D1)/D1, is the relative uncertainty in the calibration
factor, u(ND,w)/ ND,w, (± 0.5 %, k = 1) added to the relative uncertainty due to field
homogeneity imperfection, (u(D1)/D1)field. The latter was determined by assuming a
normal distribution around the value D1, obtained by the ionization chamber
measurement, and by estimating a probability of 0.5 that the dose at the position of the
dosimeters lay in the interval D1 ± 0.0025 D1. According to the Guide to the expression of
uncertainties in measurement (GUM) the uncertainty can then be set to 1.48 of half that
interval (ISO 1995). The relative uncertainty in dose due to field homogeneity
imperfection is thus 0.37%. The addition is performed as follows
( ) ( ) ( )22 21 1 , , 1 1( ) / ( ) / ( ) /D w D w field
u D D u N N u D D= +
The uncertainty in D0 is assumed to be the relative uncertainty in D1 multiplied by the
pre-irradiation dose, 0D′ .
The uncertainty in correction factor k1 was estimated by analyzing how several different
parameters affected the size of it. The parameters causing the largest change in the Burlin
equation (6) are Emax and d. It can be discussed whether the lithium formate crystals are
homogenously mixed with the paraffin or if they should be regarded as small cavities
within the binding material. The value of k1 is somewhat lower calculated for pure
lithium formate than for a mixture of the two materials. These three parameters are
combined to give the highest and lowest possible value of k1 within reasonable limits.
These limits are generously set and presented in Table 8. It can also be discussed whether
the dosimeters are to be regarded as medium size cavities, which is assumed in this work.
40
The uncertainty due to this assumption was estimated by comparing the size of the mass
collision stopping power ratio, LiFom PMMAs , and the mass energy absorption coefficient
ratio ( )/ LiFoen PMMA
μ ρ with the resulting correction factor k1. The uncertainty due to the
assumption of an equal photon energy spectrum in air and in PMMA at 5 cm depth is
regarded as negligible, since small differences affect the absorption ratios very little. The
uncertainties in stopping powers and absorption coefficients are assumed to cancel in the
ratios between different materials. The uncertainty due to incomplete CPE is regarded as
negligible compared to the other factors contributing to the uncertainty in k1.
Table 8 Maxiumum and minimum limits of the parameters giving maximum and minimum correction factor k1.
Composition Emax h d k1
100% lithium formate Max:
6 and 4 MeV resp.
Min:
4.5 mm
Max Min
90% lithium formate
10% Paraffin
Min:
5 resp. 3 MeV
Max:
5.5 mm
Min Max
The uncertainty in correction factor u(k2) is estimated in a similar way, with the exception
that there is no factor d to vary. The uncertainty is thus only based on the uncertainty due
to the composition of the dosimeters and the uncertainty in which cavity theory should be
applied.
The maximum and minimum values of kx (x = 1, 2), maxxk and min
xk respectively, were
used for an estimation of a numerical value of u(kx). The calculation was divided in two
different cases; the uncertainty due to the composition of the dosimeters and the variables
of the Burlin equation, uA(kx) , and the uncertainty in applied cavity theory, uB(kx).
A triangular distribution between maxxk and min
xk was assumed with a probability of 100%
that the true value lay in the interval. According to GUM the uncertainty in kx for the
different cases i, is then given by:
41
max min
( ) , 1, 2, ,2 6
x xi x
k ku k x i A B−= = =
(ISO 1995)
The total combined uncertainty of kx was calculated as follows:
( ) ( )2 2( ) ( ) ( )x A x B xu k u k u k= +
The uncertainty in the volume averaging factor was estimated by studying what effect the
uncertainty in positioning has on the factor.
The uncertainty in the correction factor for phantom size, u(k4), is estimated to be 0.5 %
(Carlsson Tedgren personal communication).
Uncertainty in dose delivery.
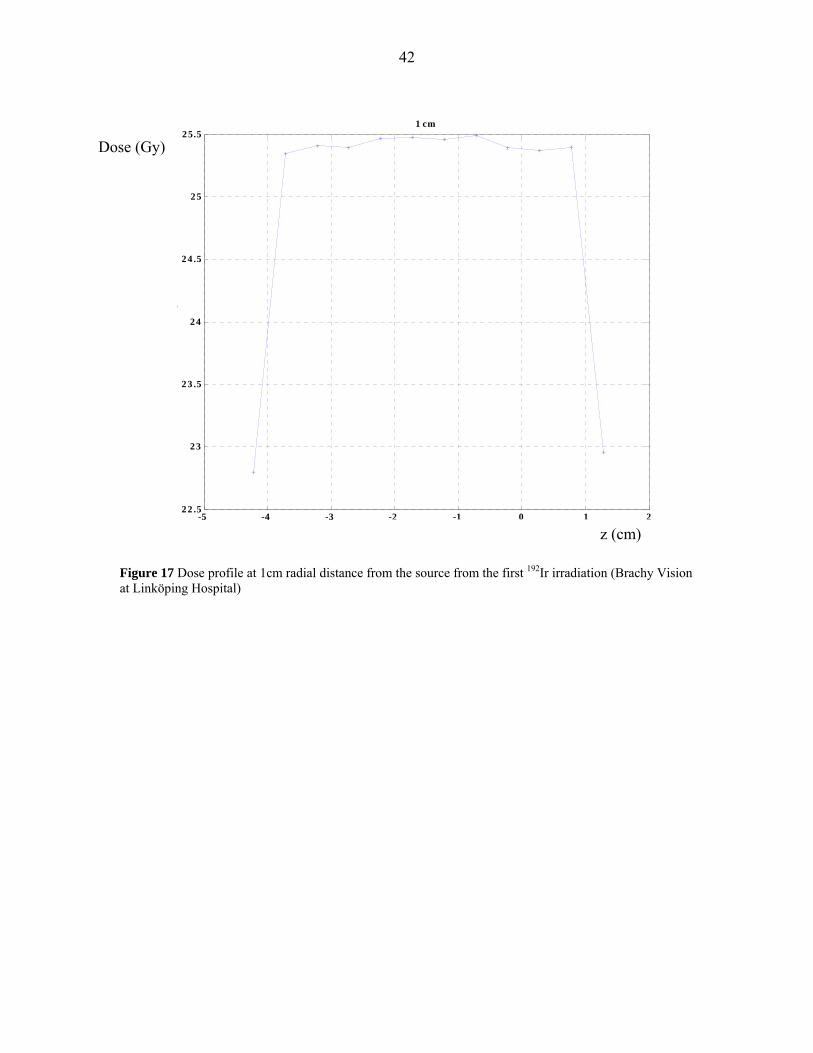
The uncertainty in source positioning in axial direction of ± 1 mm (k = 2) is stated by the
vendor and is used to determine the corresponding uncertainty in dose, u(D)pos,z. A
numerical value is set to be equal the change in TPS dose with a change in position
corresponding to ± 1 mm, at 1, 3 and 5 cm radial distance from the source central axis
according to Figure 18, 19 and 20.
The uncertainty in source positioning in radial direction is estimated to be ± 1 mm as
well, and u(D)pos,r is estimated the same way as u(D)pos,z. It accounts for the air gap
between the catheter and the central hole of the phantom, the extent to which the source
can move within the catheter and any possible unevenness of the dosimeter surface. Since
no dose profiles were obtainable from the TPS used at Karolinska Hospital the same
positioning uncertainty is used for both batches. The certificate for the 192Ir source stated
the uncertainty in source calibration to be +- 5% of the Reference Air Kerma Rate at a
confidence level of 99.7%, which gives one standard uncertainty of approximately 2 %.
Thus u(D)cal = 0.02 DM
42
Figure 17 Dose profile at 1cm radial distance from the source from the first 192Ir irradiation (Brachy Vision at Linköping Hospital)
-5 -4 -3 -2 -1 0 1 222.5
23
23.5
24
24.5
25
25.5
Source position [cm]
Do
se [
Gy
]
1 cm
z (cm)
Dose (Gy)
43
-5 -4 -3 -2 -1 0 1 24.2
4.4
4.6
4.8
5
5.2
5.4
5.6
5.8
6
6.2
Source position [cm]
Do
se [
Gy
]
3 cm
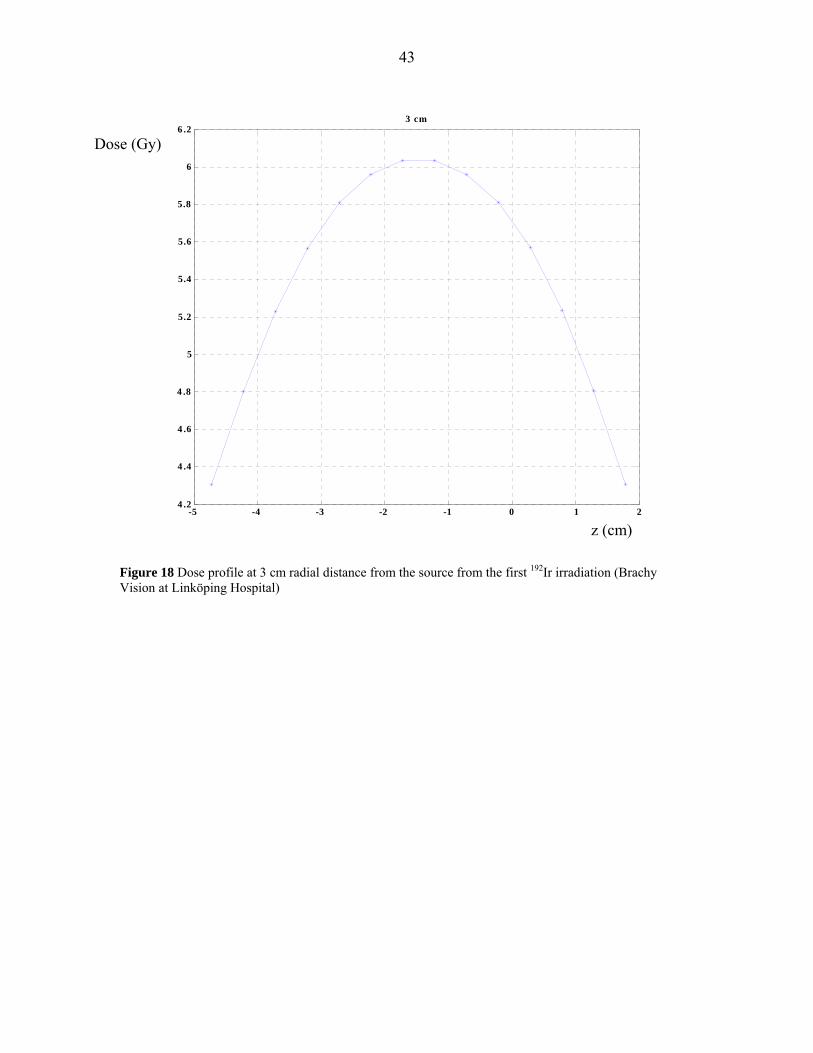
Figure 18 Dose profile at 3 cm radial distance from the source from the first 192Ir irradiation (Brachy Vision at Linköping Hospital)
Dose (Gy)
z (cm)
44
-5 -4 -3 -2 -1 0 1 22
2.1
2.2
2.3
2.4
2.5
2.6
2.7
Source position [cm]
Do
se [
Gy
]
5 cm
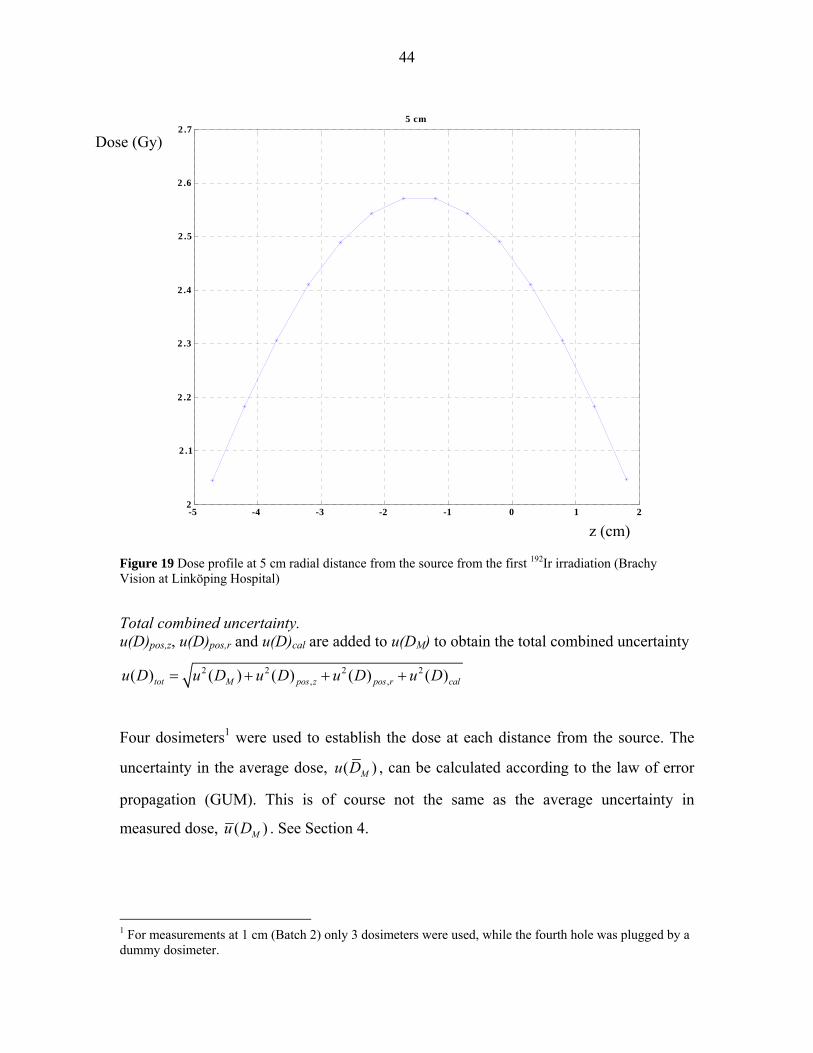
Figure 19 Dose profile at 5 cm radial distance from the source from the first 192Ir irradiation (Brachy Vision at Linköping Hospital)
Total combined uncertainty. u(D)pos,z, u(D)pos,r and u(D)cal are added to u(DM) to obtain the total combined uncertainty
2 2 2 2, ,( ) ( ) ( ) ( ) ( )tot M pos z pos r calu D u D u D u D u D= + + +
Four dosimeters1 were used to establish the dose at each distance from the source. The
uncertainty in the average dose, ( )Mu D , can be calculated according to the law of error
propagation (GUM). This is of course not the same as the average uncertainty in
measured dose, ( )Mu D . See Section 4.
1 For measurements at 1 cm (Batch 2) only 3 dosimeters were used, while the fourth hole was plugged by a dummy dosimeter.
z (cm)
Dose (Gy)
45
Uncertainty in TPS dose values
Generic values of Monte Carlo uncertainties stated by the TG 43 report (Rivard et al
2004) are used as an estimate of ( )TPSu D . The uncertainty is 2.5 % at 1 cm radial distance
from a point source and 5% at 5 cm. The average of these two values is used as
uncertainty at 3 cm.
4 RESULTS
The conversion factor, k1, is 0.924 for both the 4 and 6 MV calibrations. The conversion
from dose to lithium formate to dose to water is 1.0799, 1.0818 and 1.0848 at 1, 3 and 5
cm from the source respectively. The volume averaging correction factor, k3, is 0.9885 at
1 cm, 1.0015 at 3 cm and 1.0031 at 5 cm from the source. The correction for a
measurement phantom differing from the reference phantom of the TPS, k4, increases
with distance from 1.007 at 3 cm to 1.028 at 5 cm distance from the source and is
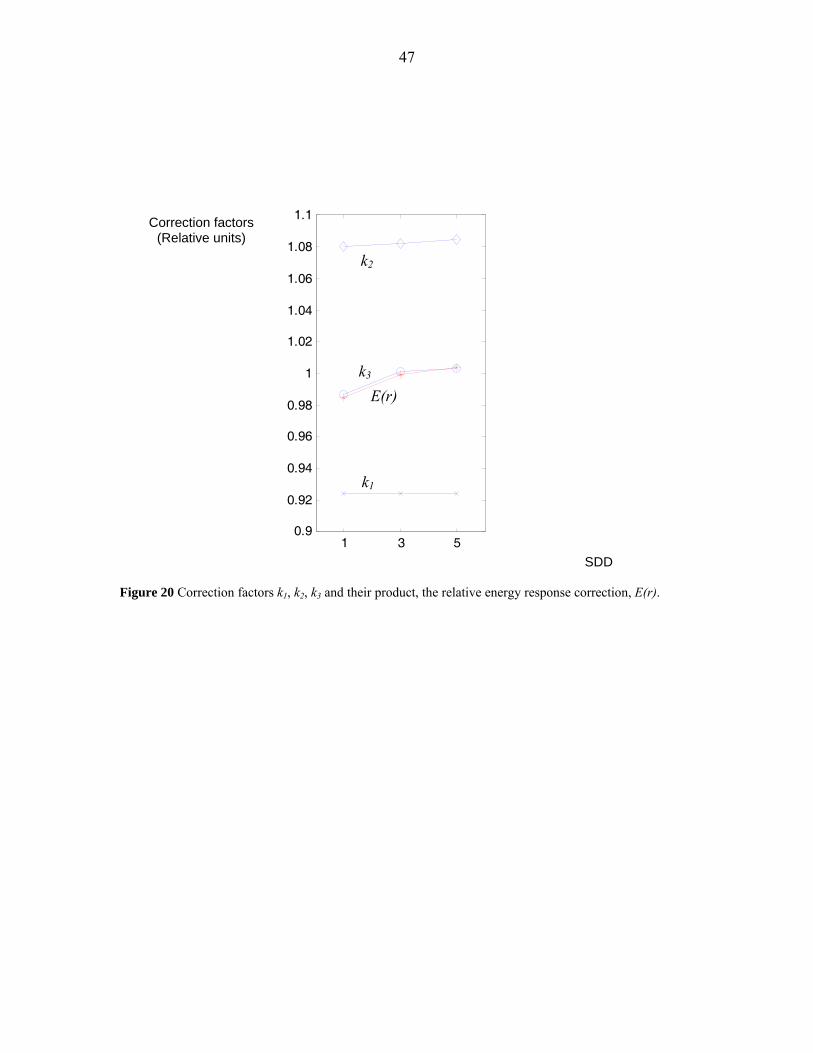
negligible at 1 cm. The correction factors k1 - k3 are presented in Table 9 and Figure 21.
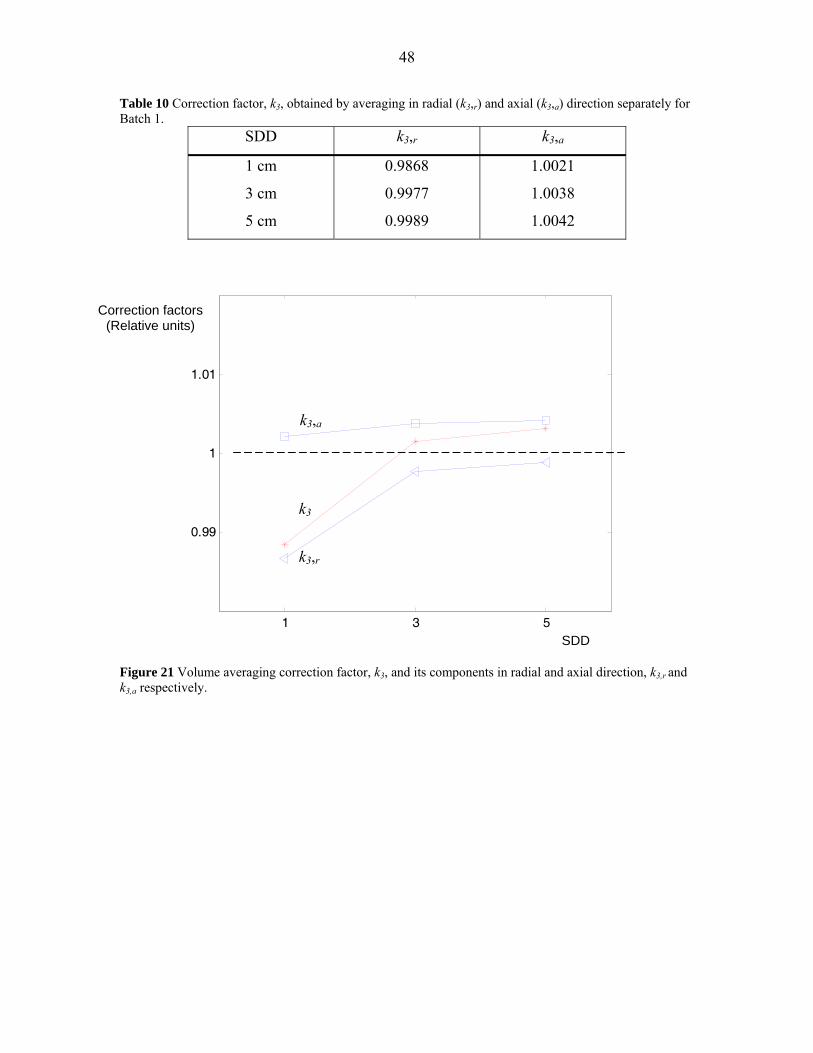
The correction for volume averaging in radial direction, k3,r, is smaller than one at all
distances from the source, with the largest deviation from unity at 1 cm form the source.
The correction in axial direction, k3,a, is larger than one at all distances, with the largest
deviation at 5 cm from the source. The values are presented in Table 10 and Figure 22.
These tendencies can easily be realized by studying dose profiles and depth dose curves
of the source stepping sequence used in this work (see Figure 17-20), since the
application of a line source is less applicable at large distances from the source and dose
gradients are flatter outwards.
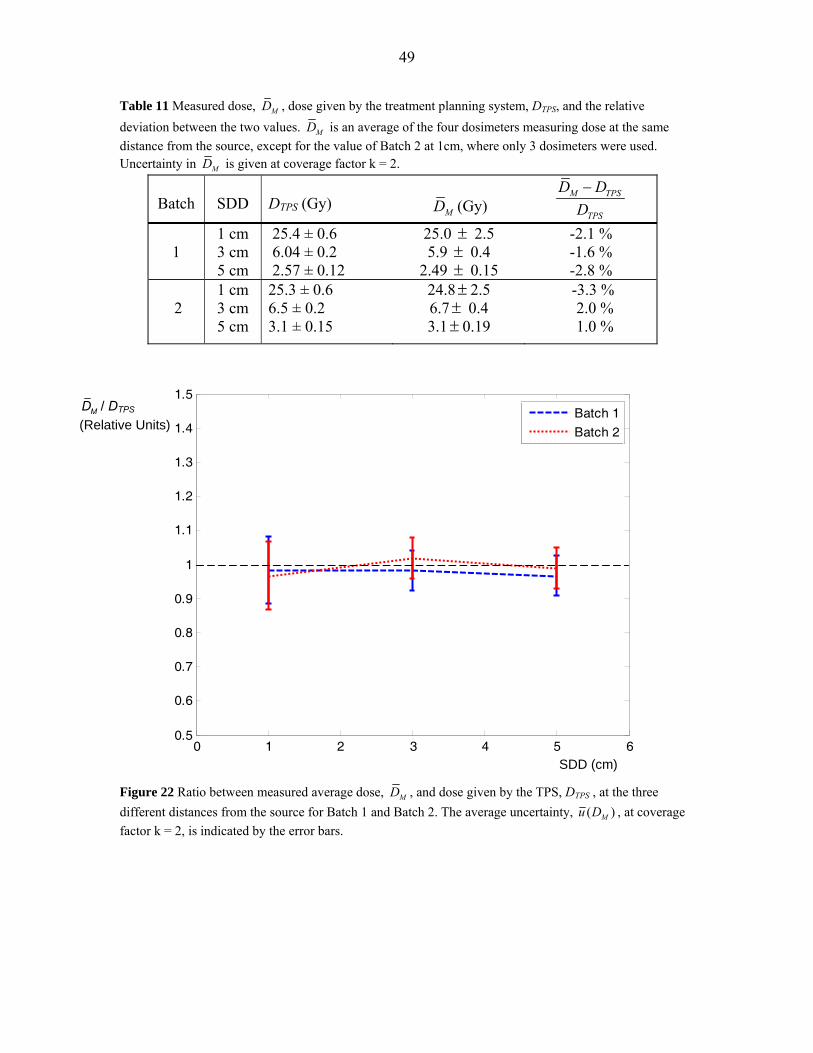
The dose given by the TPS, DTPS, is presented in Table 11 together with the measured
dose, MD , calculated as an average of the four dosimeters at each distance from the
source. The average absolute uncertainty in dose, ( )Mu D , and the relative deviation
( ) /M TPS TPSD D D− are presented in the same table. The relative standard deviation in
measured dose ( /MD MDσ ) was 0.3 - 3 %.
46
When comparing measured dose values with those given by the TPS for Batch 2, it was
found that the TPS value at 1 cm must have been misread. For this reason the experiment
was simulated by Carlsson Tedgren Å (personal communication). New values for
comparison were calculated and for simplicity referred to as DTPS. This was done by the
MC program EGS4 and the geometry described in section 3.6 was used for input. Since
the correct phantom size is used for these calculations correction factor, k4, is not applied
on the measured dose values for Batch 2.
The absolute dose values range from approximately 2.5 Gy at 5 cm from the source to 25
Gy at 1 cm from the source. The minimum and maximum relative deviation between
measured dose and dose given by the TPS (or calculated dose) is 1.4 % and 3.2 %
respectively.
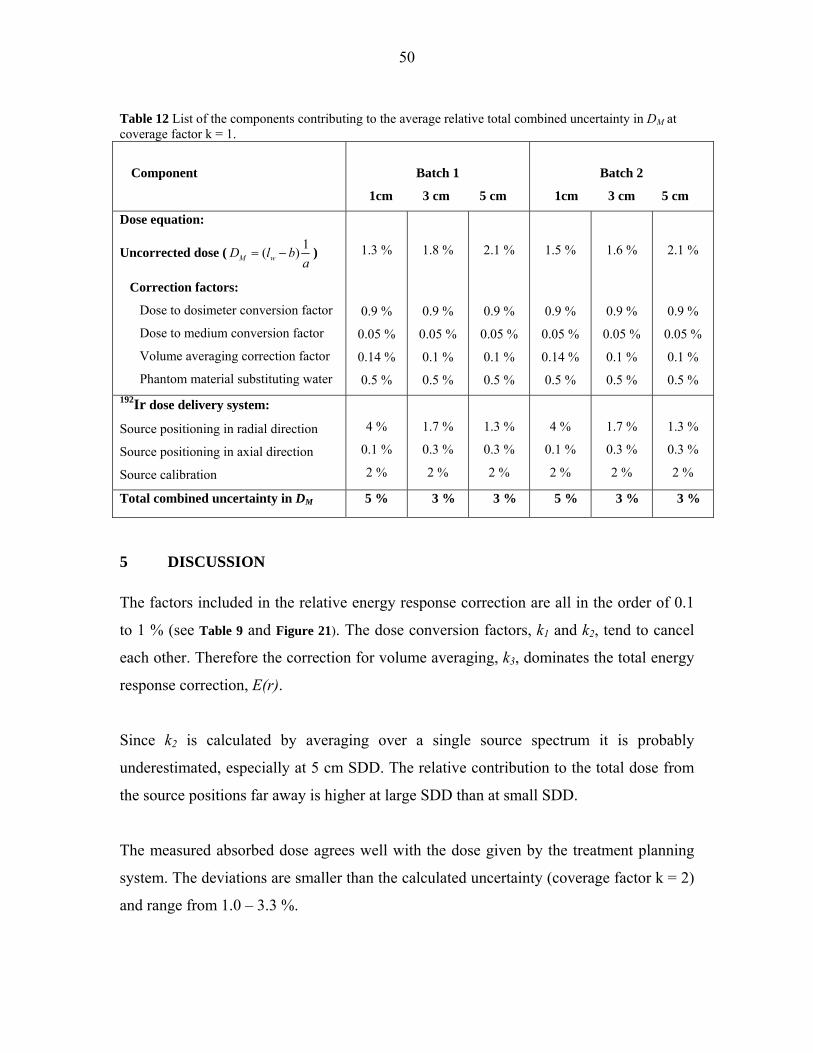
The components contributing to the total combined uncertainty in dose, ( )Mu D , are
presented in Table 12. The total combined uncertainty at coverage factor k = 1 is 5 % at 1
cm distance from the source and 3 % at 3 and 5 cm from the source.
Table 9 The values of the individual correction factors, k1 - k3 and the relative energy response correction E(r).
SDD
k1
k2
k3
E(r) = 3
ii
k∏
1 cm 3 cm 5 cm
0.9242 0.9242 0.9242
1.0799 1.0818 1.0848
0.9885 1.0015 1.0031
0.9849 0.9996 1.0039
47
1 3 50.9
0.92
0.94
0.96
0.98
1
1.02
1.04
1.06
1.08
1.1
Figure 20 Correction factors k1, k2, k3 and their product, the relative energy response correction, E(r).
k1
k2
E(r) k3
SDD
Correction factors (Relative units)
48
Table 10 Correction factor, k3, obtained by averaging in radial (k3,r) and axial (k3,a) direction separately for Batch 1.
SDD k3,r k3,a
1 cm
3 cm
5 cm
0.9868
0.9977
0.9989
1.0021
1.0038
1.0042
1 3 5
0.99
1
1.01
Figure 21 Volume averaging correction factor, k3, and its components in radial and axial direction, k3,r and k3,a respectively.
k3,a
k3
k3,r
SDD
Correction factors (Relative units)
49
Table 11 Measured dose, MD , dose given by the treatment planning system, DTPS, and the relative deviation between the two values. MD is an average of the four dosimeters measuring dose at the same distance from the source, except for the value of Batch 2 at 1cm, where only 3 dosimeters were used. Uncertainty in MD is given at coverage factor k = 2.
Batch
SDD
DTPS (Gy)
MD (Gy)
M TPS
TPS
D DD−
1
1 cm 3 cm 5 cm
25.4 ± 0.6 6.04 ± 0.2 2.57 ± 0.12
25.0 ± 2.5 5.9 ± 0.4
2.49 ± 0.15
-2.1 % -1.6 % -2.8 %
2
1 cm 3 cm 5 cm
25.3 ± 0.6 6.5 ± 0.2 3.1 ± 0.15
24.8± 2.5 6.7± 0.4 3.1± 0.19
-3.3 % 2.0 % 1.0 %
0 1 2 3 4 5 60.5
0.6
0.7
0.8
0.9
1
1.1
1.2
1.3
1.4
1.5
Distance from the source (cm)
Batch 1
Batch 2
Figure 22 Ratio between measured average dose, MD , and dose given by the TPS, DTPS , at the three different distances from the source for Batch 1 and Batch 2. The average uncertainty, ( )Mu D , at coverage factor k = 2, is indicated by the error bars.
MD / DTPS
(Relative Units)
SDD (cm)
50
Table 12 List of the components contributing to the average relative total combined uncertainty in DM at coverage factor k = 1.
Component
Batch 1
1cm 3 cm 5 cm
Batch 2
1cm 3 cm 5 cm
Dose equation:
Uncorrected dose ( 1( )M wD l ba
= − )
Correction factors:
Dose to dosimeter conversion factor
Dose to medium conversion factor
Volume averaging correction factor
Phantom material substituting water
1.3 %
0.9 %
0.05 %
0.14 %
0.5 %
1.8 %
0.9 %
0.05 %
0.1 %
0.5 %
2.1 %
0.9 %
0.05 %
0.1 %
0.5 %
1.5 %
0.9 %
0.05 %
0.14 %
0.5 %
1.6 %
0.9 %
0.05 %
0.1 %
0.5 %
2.1 %
0.9 %
0.05 %
0.1 %
0.5 % 192Ir dose delivery system:
Source positioning in radial direction
Source positioning in axial direction
Source calibration
4 %
0.1 %
2 %
1.7 %
0.3 %
2 %
1.3 %
0.3 %
2 %
4 %
0.1 %
2 %
1.7 %
0.3 %
2 %
1.3 %
0.3 %
2 %
Total combined uncertainty in DM 5 % 3 % 3 % 5 % 3 % 3 %
5 DISCUSSION The factors included in the relative energy response correction are all in the order of 0.1
to 1 % (see Table 9 and Figure 21). The dose conversion factors, k1 and k2, tend to cancel
each other. Therefore the correction for volume averaging, k3, dominates the total energy
response correction, E(r).
Since k2 is calculated by averaging over a single source spectrum it is probably
underestimated, especially at 5 cm SDD. The relative contribution to the total dose from
the source positions far away is higher at large SDD than at small SDD.
The measured absorbed dose agrees well with the dose given by the treatment planning
system. The deviations are smaller than the calculated uncertainty (coverage factor k = 2)
and range from 1.0 – 3.3 %.
51
The average relative 1 σ total combined uncertainty in DM, is 3 % for the measurements
at 3 and 5 cm from the source, but 5 % for the measurements at 1 cm. The component
causing this large difference is the uncertainty in source positioning in radial direction
(Table 12). This difference as well as the absolute size of the uncertainty at all three SDD
would be even larger if the measurements were performed with the source in one position
only, since dose gradients would be steeper. The uncertainty should be much smaller
though if the dose is determined by an average of the four dosimeter positions at one
SDD, since an increase in dose at one side leads to a decrease at the opposite side. The
size of the uncertainty in source positioning in axial direction and in the volume
averaging correction factor would also be larger in the single source case.
Interestingly the uncertainty in uncorrected dose, which is of statistical kind, is as low as
1.3 – 1.5 % for the high doses of about 25 Gy at 1 cm. If an individual sensitivity factor
were applied, defined as the individual dosimeter dose response divided by the average
dose response of the batch, this uncertainty could possibly be further reduced. The dose
response stability of lithium formate detectors must be investigated before such an
application can be performed.
As mentioned above the dose to water conversion factor, k2, is probably underestimated.
This has not been accounted for in the uncertainty analysis.
It can be questioned whether it is relevant to compare the measured doses to values of the
TPS. Since ionization chamber measurements have large uncertainties at BT energies,
TPS was regarded as the most reliable source for comparison, as uncertainties in dose
delivery are accounted for.
The size of the total combined 1 σ uncertainty in dose (3-5 %) is comparable to the
uncertainty in dose rate of 7-9 % for the LiF TLD single source dosimetry system stated
by TG-43. Of course some uncertainty components are larger for the latter case, since
dose gradients are steeper around a single source, and a fair comparison between the
systems can only be performed if experiments are equivalent.
52
An obvious advantage of the lithium formate dosimetry system compared to LiF TLD is
the larger dynamic range in absorbed dose. The LiF dosimeter has an upper dose limit of
approximately 1 Gy before supralinearity becomes a source of uncertainty. Since the
transit dose from sources of clinically relevant HDR 192Ir sources may be significant but
not properly corrected for by most TPS, it could give a high contribution to the total dose
to LiF dosimeters according to several authors (Guzman Calcina et al 2005, Wong et al
2001, Bastin et al 1993 and Houdek et al 1992). Therefore, measurements using LiF
dosimeters are often performed after the source has decayed to levels below those used
clinically, so as to limit the transit dose to contribute a small fraction to the total absorbed
dose. Using the lithium formate dosimetry system, this problem can be avoided simply by
giving high enough doses for the transit dose to become negligible and measurements can
be made using sources with clinically relevant activities.
A possible drawback of the study might be that some important dosimetric properties of
lithium formate, such as dose rate dependence, fading characteristics intrinsic energy
response and dose response stability should have been examined separately, before an
application study such as this was performed. The dose rate of single accelerator pulses is
much higher than the dose rate of radioactive sources. In recent studies the response of
lithium formate irradiated by accelerator photon beams of 6-20 MV has been compared
to the response to 60Co irradiation (Malinen et al 2007, and Vestad et al 2003). The
results were analyzed in terms of energy dependence, and showed a smaller energy
response for lithium formate than for LiF. The results can also be used as an indication
that the high accelerator dose rate does not essentially affect the response compared to
radioactive sources. This study should be regarded as a feasibility study, and the results
show that it is well worth spending time on investigating the mentioned dosimetric
properties.
53
6 CONCLUSIONS AND OUTLOOK
Lithium formate EPR has been shown to have a large potential for dosimetry in the
energy range of BT source 192Ir.
If the dosimeters are given high enough doses (preferably > 20 Gy), the precision of the
dosimetry system should be comparable to LiF TLD. The precision of the latter system
cannot be enhanced by increasing doses, since its supralinearity above a certain dose
level reduces precision.
Due to the low energy dependence of lithium formate it is especially promising for use in
situations where the energy spectrum is unknown. A possible field of application could
be the verification of multi source treatment plans in BT.
Before the dosimetry system can be used for experimental verification of the dose
distribution around single sources or other situations where dose gradients are steeper
than in the present work, methods to produce smaller and less fragile dosimeters must be
developed, since positional accuracy and low volume averaging are crucial for accurate
dose determinations.
A comparative study between lithium formate EPR and LiF TLD, with experiments of
equal set-up for both materials should give better information about the suitability of
lithium formate for experimental determination of the dose distribution around BT
sources.

54
7 ACKNOWLEDGEMENTS This study was initiated by Håkan Gustafsson, Åsa Carlsson Tedgren and Eva Lund. Åsa
Carlsson Tedgren was my supervisor and helped me steering the project in the right
direction. I am very grateful for her kind supportiveness and accessibility. Special thanks
to Håkan Gustafsson for all the time he spent introducing me to the world of lithium
formate EPR dosimetry. Thanks also to the hospital physicists at Linköping Hospital;
Sara Olsson, Håkan Hedtjärn, Peter Larsson as well as Emil Bengtsson at Karolinska
University Hospital. Without their assistance and practical tips this study would not have
been possible. Bengt Frost produced the phantom for the 192Ir source. I am also grateful
to Gudrun Alm Carlsson for sharing parts of her vast dosimetry knowledge with me.
Finally I would like to thank Axel Israelsson for his interest in discussing stylistic aspects
of my work.
55
8 REFERENCES ATTIX FH, Introduction to radiological physics and radiation dosimetry, Wiley-VCH, 1986 BASTIN KT, PODGORSAK MB and THOMADSEN BR: Transit dose component of high dose rate brachytherapy: Direct measurements and clinical implications, Int. J. Radiation Oncology Biol. Phys. 26, 695-702, 1993 BERGER MJ, COURSEY JS, ZUCKER MA and CHANG J: ESTAR, PSTAR, and ASTAR: Computer Programs for Calculating Stopping-Power and Range Tables for Electrons, Protons, and Helium Ions (version 1.2.3). [Online] Available: http://physics.nist.gov/Star [2008, March 19]. National Institute of Standards and Technology, Gaithersburg, MD, 2005 BERGER MJ, HUBBELL JH SELTZER SM, CHANG J, COURSEY JS, SUKUMAR R and ZUCKER DS XCOM: Photon Cross Section Database (version 1.3). [Online] Available: http://physics.nist.gov/xcom [2008, March 19]. National Institute of Standards and Technology, Gaithersburg, MD, 2005 BERGSTRAND ES, HOLE EO and SAGSTUEN E: A Simple Method for Estimating Dose Uncertainty in ESR/Alanine Dosimetry, Appl. Radiat. Isot. Vol. 49, No. 7, 845-854, 1998 BRAHME A: Correction of a measured distribution for the finite extension of the detector, Strahlentherapie 157, 258-259, 1981 BURLIN TE: in ATTIX FH, Radiation dosimetry, Academic Press, 1968 CARLSSON TEDGREN Å: personal communication FRODESEN AG, SKJEGGESTAD O and TOFTE H: Probability and statistics in particle physics, Universitetsforlaget, 1979 GUZMAN CALCINA CS, DE ALMEIDA A, OLIVEIRA ROCHA JR, CHEN ABREGO F and BAFFA O: Ir-192 HDR transit dose and radial dose function determination using alanine/EPR dosimetry, Phys. Med. Biol. 50, 1109-1117, 2005 GUSTAFSSON H: Development of Sensitive EPR Dosimetry Methods, Linköping University Medical Dissertations, No. 1044, 2008 HOUDEK PV, SCHWADE JG, WU X, PISCIOTTA V, FIEDLER JA, SERAGO CF, MARKOE AM, ABITBOL AA, LEWIN AA, BRAUNSCHWEIGER PG and SKLAR MD: Dose determinationo in high dose-rate brachytherapy, Int. J. Radiation Oncology Biol. Phys. 24, 795-801, 1992
56
HUBBELL JH and SELTZER SM Tables of X-Ray Mass Attenuation Coefficients and Mass Energy-Absorption Coefficients (version 1.4). [Online] Available: http://physics.nist.gov/xaamdi [2008, March 19]. National Institute of Standards and Technology, Gaithersburg, MD, 2004 IAEA 2000 Absorbed Dose Determination in External Beam Radiotherapy: An International Code of Practice for Dosimetry based on Standards of Absorbed Dose to Water (Technical Report Series No 398), 2000 ISO 1995 Guide to the expression of uncertainites in measurement (Geneva: ISO), 1995 MALINEN E, WALDELAND E, HOLE EO and SAGSTUEN E: The energy dependence of lithium formate EPR dosimeters for clinical electron beams. Phys. Med. Biol. 52, 4362-4369, 2007 MELI JA, MEIGOONI AS and NATH R: On the choice of phantom material for the dosimetry of Ir-192 sources. Int. J. Radiat. Oncol. Biol. Phys 14, 587-594, 1988 MOHAN R, CHUI C and LIDOFSKY L: Energy and angular distributions of photons from medical linear accelerators, Med. Phys. 12 (5), 592-597, 1985, OREAR J: Least squares when both variables have uncertainties, Am. J. Phys. 50 (10), 912-916, 1982 RIVARD MJ, COURSEY BM, DEWERD LA, HANSON WF, HUQ MS, IBBOTT GS, MITCH MG, NATH R and WILLIAMSON JF, Update of AAPM Task Group No. 43 Report: A revised AAPM protocol for BT dose calculations, Med. Phys. 31, 633-674, 2004 THOMADSEN B R, RIVARD M J and BUTLER W M, Brachytherapy Physics, Medical Physics Publishing, 2005 THOMAS JO, TELLGREN R and ALMLÖF J: Hydrogen bond studies: XCVI. X-N map and ab initio MO-LCAOSCF calculations of the difference electron density in non-centrosymmetric lithium formate monohydrate, LiHCOO·H2O Acta Crystallogr. B 31, 1946–55, 1975 VESTAD TA, MALINEN E, LUND A, HOLE EO and SAGSTUEN E: EPR dosimetric properties of formates, Appl. Radiat. Isot. 59, 181-188, 2003 VESTAD TA, GUSTAFSSON H, LUND A, HOLE EO and SAGSTUEN E: Radiation induced radicals in lithium formate monohydrate (LiHCO2 H2O). EPR and ENDOR studies of X-irradiated crystal and polycrystalline samples, 2004 a VESTAD TA, MALINEN E, OLSEN DR, HOLE EO and SAGSTUEN E:
57
Electron paramagnetic resonance (EPR) dosimetry using lithium formate in radiotherapy comparison with thermoluminescence (TL) dosimetry using lithium fluoride, Phys. Med. Biol. 49, 4701-4715, 2004 b WEIL JA, BOLTON JR and WERTZ JE: Electron paramagnetic resonance, JohnWiley & Sons: New Jersey, USA, 1994 WONG TPY, FERNANDO WASANTHA, JOHNSTON PN and BUBB IF: Transit dose of an Ir-192 high dose rate brachytherapy stepping source, Phys. Med. Biol. 46, 323-331, 2001
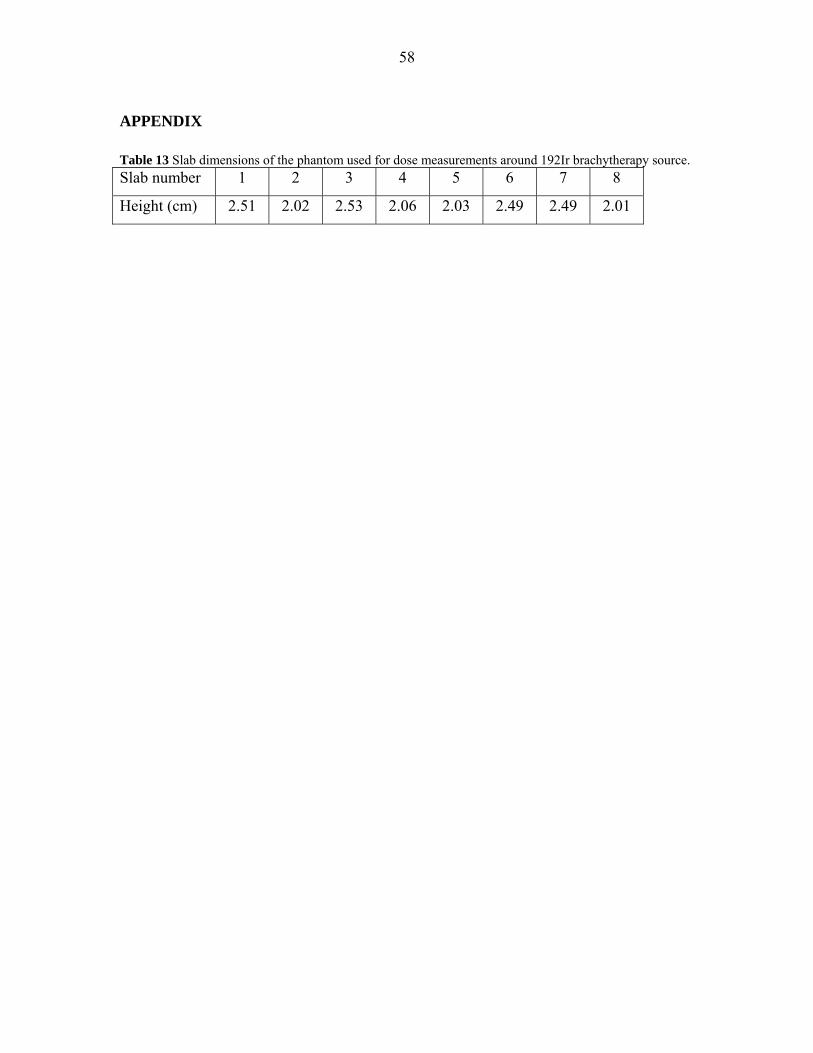
58
APPENDIX Table 13 Slab dimensions of the phantom used for dose measurements around 192Ir brachytherapy source. Slab number 1 2 3 4 5 6 7 8
Height (cm) 2.51 2.02 2.53 2.06 2.03 2.49 2.49 2.01
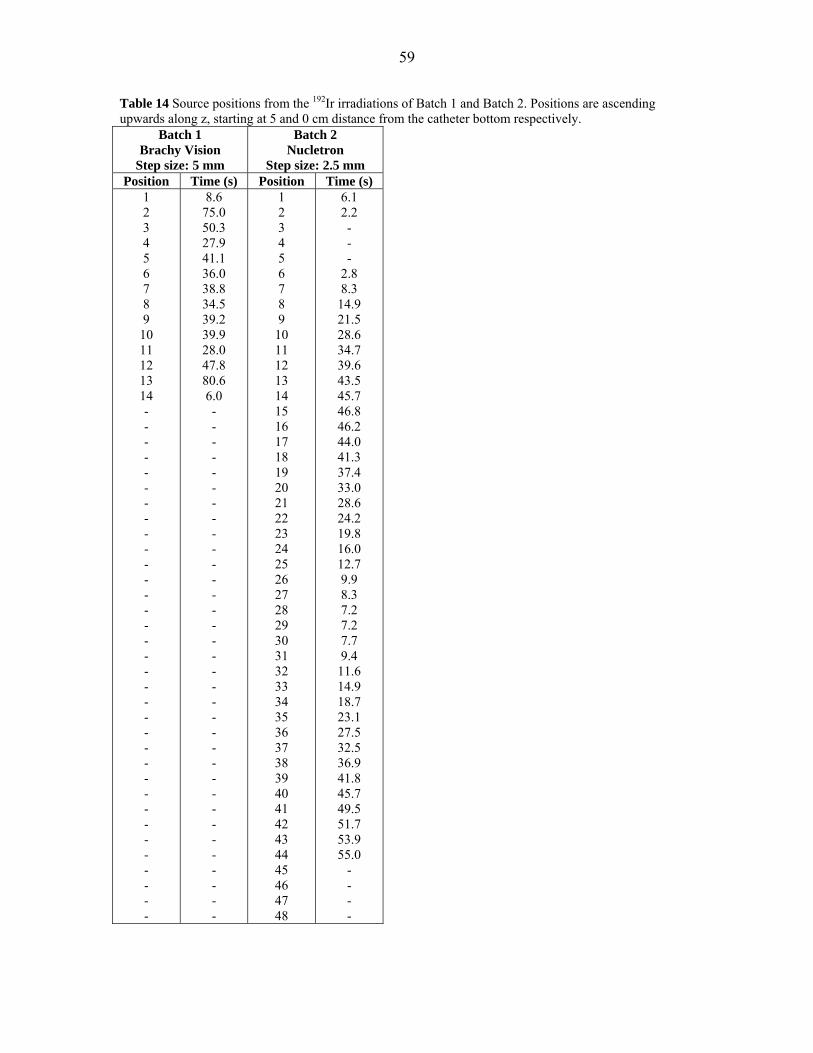
59
Table 14 Source positions from the 192Ir irradiations of Batch 1 and Batch 2. Positions are ascending upwards along z, starting at 5 and 0 cm distance from the catheter bottom respectively.
Batch 1 Brachy Vision
Step size: 5 mm
Batch 2 Nucletron
Step size: 2.5 mm Position Time (s) Position Time (s)
1 2 3 4 5 6 7 8 9
10 11 12 13 14 - - - - - - - - - - - - - - - - - - - - - - - - - - - - - - - - - -
8.6 75.0 50.3 27.9 41.1 36.0 38.8 34.5 39.2 39.9 28.0 47.8 80.6 6.0 - - - - - - - - - - - - - - - - - - - - - - - - - - - - - - - - - -
1 2 3 4 5 6 7 8 9
10 11 12 13 14 15 16 17 18 19 20 21 22 23 24 25 26 27 28 29 30 31 32 33 34 35 36 37 38 39 40 41 42 43 44 45 46 47 48
6.1 2.2 - - -
2.8 8.3
14.9 21.5 28.6 34.7 39.6 43.5 45.7 46.8 46.2 44.0 41.3 37.4 33.0 28.6 24.2 19.8 16.0 12.7 9.9 8.3 7.2 7.2 7.7 9.4
11.6 14.9 18.7 23.1 27.5 32.5 36.9 41.8 45.7 49.5 51.7 53.9 55.0
- - - -