Embed Size (px)
Citation preview
Medical Physics Journal Accepted July 2006, To Appear:
Optimization of HDR brachytherapy dose distributions
using linear programming with penalty costs
Ron Alterovitz a), Etienne Lessard, Jean Pouliot, I-Chow Joe Hsu,
James F. O'Brien, and Ken Goldberg Ron Alterovitz a) Department of Industrial Engineering and Operations Research, University of California, Berkeley, 4141 Etcheverry Hall, Berkeley, CA, 94720-1777 Etienne Lessard, Jean Pouliot, and I-Chow Joe Hsu Department of Radiation Oncology, University of California, San Francisco, Comprehensive Cancer Center, 1600 Divisadero Street, San Francisco, CA 94143-1708 James F. O'Brien Department Electrical Engineering and Computer Science, University of California, Berkeley, 633 Soda Hall, Mail Code 1776, Berkeley, California 94720-1776 Ken Goldberg Department of Industrial Engineering and Operations Research and Department of Electrical Engineering & Computer Science, University of California, Berkeley, 4141 Etcheverry Hall, Berkeley, CA, 94720-1777 a) Author to whom correspondence should be addressed Department of Industrial Engineering and Operations Research University of California, Berkeley 4141 Etcheverry Hall Berkeley, California, 94720-1777. Telephone: (510) 643-2030 Fax: (510) 642-1403 Electronic mail: [email protected] Keywords: HDR, optimization, conformal radiotherapy, prostate therapy, IPSA Running title: Optimization of HDR brachytherapy using linear programming
Alterovitz - 2 -
ABSTRACT Prostate cancer is increasingly treated with high-dose-rate (HDR) brachytherapy, a type of radiotherapy in which a radioactive source is guided through catheters temporarily implanted in the prostate. Clinicians must set dwell times for the source inside the catheters to maximize satisfaction of dose requirements that conform to patient-specific anatomy. The primary contribution of this paper is to take the well-established dwell times optimization problem defined by Inverse Planning by Simulated Annealing (IPSA) developed at UCSF and exactly formulate it as a feasible linear programming (LP) problem. Because LP problems can be solved exactly and deterministically, this formulation provides strong performance guarantees: one can rapidly find the mathematically optimal solution for any patient case and clinical criteria parameters. For a sample of 20 prostate cancer patient cases, the new LP method computed optimal dwell times in less than 15 seconds per case on a standard PC. The LP method does not require setting any non-clinical optimization parameters and provides a precise baseline for evaluating solutions obtained by probabilistic methods such as simulated annealing (SA). The secondary contribution of this paper addresses an important and clinically relevant open problem: how close to mathematical optimality are solutions currently being obtained clinically using SA? The isodose curves for solutions obtained using SA are substantially different from those of the mathematically optimal solutions obtained using LP, but the dose distributions are clinically equivalent as measured by standard dosimetric indices with a 2% threshold.
Alterovitz - 3 -
I. INTRODUCTION Prostate cancer, which kills an estimated 30,000 Americans each year1, is increasingly
treated with high-dose-rate (HDR) brachytherapy, a medical procedure in which radioactive sources are guided through catheters to provide a high radioactive dose to the cancer while sparing surrounding healthy tissues. In HDR brachytherapy, the physician implants 14 to 18 catheters in the prostate through the perineum under ultrasound guidance. For treatment, the catheters are attached to a High-Dose-Rate Remote Afterloader for treatment delivery. The afterloader moves a single radioactive source, typically 4.5 mm long and 0.9 mm in diameter containing 192Ir, inside each catheter, stopping temporarily at predetermined dwell locations. By adjusting the length of time (dwell time) that the source remains at any location within a catheter (dwell position), it is possible to generate a wide variety of dose distributions.
When treating prostate cancer, physicians desire dose distributions that conform to patient anatomy and satisfy minimum and maximum dose prescriptions for the target volume (prostate) and nearby critical organs (urethra, bladder, and rectum)2. Prior to connecting the afterloader, the physician obtains an image (usually CT scan or MRI) of the catheters, prostate, and surrounding tissues and prescribes clinical dose requirements for each tissue type. The goal is then to select dwell times to satisfy the clinical criteria as best as possible. This goal can be formulated as an optimization problem: compute dwell times to minimize deviation from prescribed dose subject to dwell position and dose feasibility constraints.
To address this optimization problem, Lessard and Pouliot developed Inverse Planning by Simulated Annealing (IPSA)3-5. IPSA has been used in the treatment planning of over a thousand patients at 6 medical centers (UCSF, San Francisco; NIH, Bethesda; CHUQ, Quebec City; CHUM, Montreal; Sonnybrook, Toronto; Christiana Care Health Services, Newark)6-11. A complete description of IPSA and its clinical applications was recently published12. Only the elements required for the present work are described here. Using hand-segmented boundaries of the prostate, urethra, bladder, and rectum, and often the penile bulb and dominant intraprostatic lesions13, the software generates a discrete sample of dose calculation points inside and on the boundary of the tissue types. IPSA permits the physician to prescribe dose ranges for points in different tissue types as well as penalty costs that grow linearly with the violation of the prescribed dose range at each dose calculation point. These dose penalty cost constraints guarantee that the optimization method will find a feasible solution.
The current version of IPSA software then uses simulated annealing (SA) to compute dwell times to minimize an objective function equal to a weighted sum of penalty costs at dose calculation points. Since the time between medical imaging and HDR therapy must be kept short to reduce the effects of patient movement, tissue swelling, and other sources of uncertainty, fast computation is important for HDR dose optimization. The computation time for a typical prostate is less than 30 seconds on a Silicon Graphics O2 128 (Nucletron’s Plato Station). The computation time includes the automatic selection of the active dwell positions, the generation of the dose calculation points, the generation of a look-up dose-rate table, and 100,000 simulated annealing iterations. Although this method has worked well in clinical practice, there previously was no general quantitative information available regarding the closeness to mathematical optimality of the solutions obtained using simulated annealing, a probabilistic method that cannot guarantee optimality within a finite computation time.
Our primary contribution is to take the well-established dose optimization problem defined by IPSA and show that it can be exactly formulated as a feasible linear programming (LP) problem. Because an LP problem can be solved exactly and deterministically using pre-existing
Alterovitz - 4 -
algorithms, this formulation provides strong performance guarantees for dose optimization: one can rapidly find the mathematically optimal solution for any patient case and clinical criteria parameters. LP does not require setting any non-clinical optimization parameters, allowing clinicians to customize dose prescriptions and costs based on medical considerations without concern about their effect on the convergence of the optimization method. Since the LP solution is guaranteed to be mathematically optimal, it provides a precise baseline for evaluating solutions currently being obtained clinically by probabilistic methods such as SA.
Our secondary contribution addresses an important and clinically relevant question: how close to optimality are solutions obtained using SA? With a sample of 20 prostate cancer patient cases, we show that solutions obtained using the current version of IPSA have substantially different isodose curves from the mathematically optimal solutions obtained using the LP method, but the dose distributions are clinically equivalent as measured by standard dosimetric indices with a 2% threshold.
A linear programming problem is defined by an objective function and constraints that are linear functions of the variables. An LP problem can be solved using the Simplex algorithm, a global deterministic optimization method that considers the geometric polyhedron defined by the linear constraints and systematically moves along edges of the polyhedron to new feasible solutions (represented as vertices of the polyhedron) with successively better values of the objective function until the optimum is reached14. Deterministic global optimization methods such as LP offer several key advantages over probabilistic methods such as SA and genetic algorithms (GA)15-17. The foremost is guaranteed optimality of the solutions in finite computation time. Even if the objective function difference is small for a particular application, the knowledge that the solutions cannot be further improved given the currently specified objective function and constraints eliminates the need for further exploration of solutions and provides insight into the fundamental trade-offs of the problem. Linear programming also has benefits beyond the guarantee of optimal solutions. Probabilistic methods require specification of non-clinical optimization parameters, such as pseudo-temperatures for SA or mutation probabilities for GA, which are not directly relevant to the HDR dose optimization problem. Linear programming does not require any extraneous optimization parameters. Furthermore, the convergence of probabilistic optimization methods is generally linked to the values of clinical parameters in the objective function, such as dose prescriptions, whereas a deterministic method such as linear programming always guarantees optimality. This implies that if a solution obtained using LP is not clinically desirable, the reason must be due to the specification of the problem or the difficulty of the patient case, not a convergence issue in the optimization method.
To apply linear programming to HDR brachytherapy dwell time optimization, the problem must be formulated using linear constraints and a linear objective function. In 1990, Renner et al. was the first group to propose a linear program for HDR brachytherapy dose optimization. Their method minimizes the time the source is irradiating tissue (the sum of dwell times) subject to a minimum dose constraint for a set of points in the target volume18. Kneschaurek et al. extended this method to permit the specification of dose ranges using rigid constraints for both minimum and maximum dose19. The method of Kneschaurek et al. required 540 seconds of computation time on a DEC Alpha workstation running for a case containing 4,851 dose calculation points. Jozsef et al. minimized the maximum deviation from a prescribed dose constant at dose calculation points20. Jozsef et al. do not provide computation times under clinical conditions with patient-specific anatomy.
Previous linear programming methods for HDR dwell time optimization formulate the
Alterovitz - 5 -
problem in a manner that does not guarantee a feasible solution, implying that the methods may fail to provide a solution in clinical practice. The methods of both Kneschaurek et al. and Jozsef et al. permit the specification of dose ranges using maximum and minimum doses for dose calculation points, although these constraints are rigid dose constraints rather than cost functions that contribute to an objective function and grow with violation of the dose limits. When using rigid constraints on dose, a feasible solution is not guaranteed to exist since a dose distribution that satisfies the rigid constraints may not be physically realizable. Finding a feasible solution in such cases necessitates arbitrarily removing some rigid dose constraints, which requires substantial human intervention.
Our new linear programming (LP) formulation combines the advantages of IPSA’s cost functions and extensive clinical validation with the benefits of deterministic global optimization. We show that the new LP method computes in finite time the mathematically optimal solution for dwell times to generate the best achievable dose distribution given the clinical objectives and the pre-optimization data generated by IPSA (active dwell positions, dose calculation points, and dose rate look-up table). We applied both SA and the new LP method to 20 prostate cancer patient cases and evaluated improvement of results using objective function values and standard dosimetric indices. II. METHODS AND MATERIALS A. Patient Data Sets
We applied the LP method retrospectively to 20 prostate cancer patient cases. For these patients, the physician implanted 14 to 18 catheters in the prostate with transrectal ultrasound (TRUS) guidance while the patient was under epidural anesthesia. The prostate volumes ranged from 23cc to 103cc. At the beginning of the implant, a Foley catheter was inserted to help visualize the urethra. Then Flexi-guide catheters (Best Industries, Inc., Flexi-needles, 283-25 (FL153-15NG)), which are 1.98 mm diameter hollow plastic needles through which the radioactive source will move, were inserted transperineally by following the tip of the catheter from the apex of the prostate to the base of the prostate using ultrasound and a stepper measuring insertion distance.
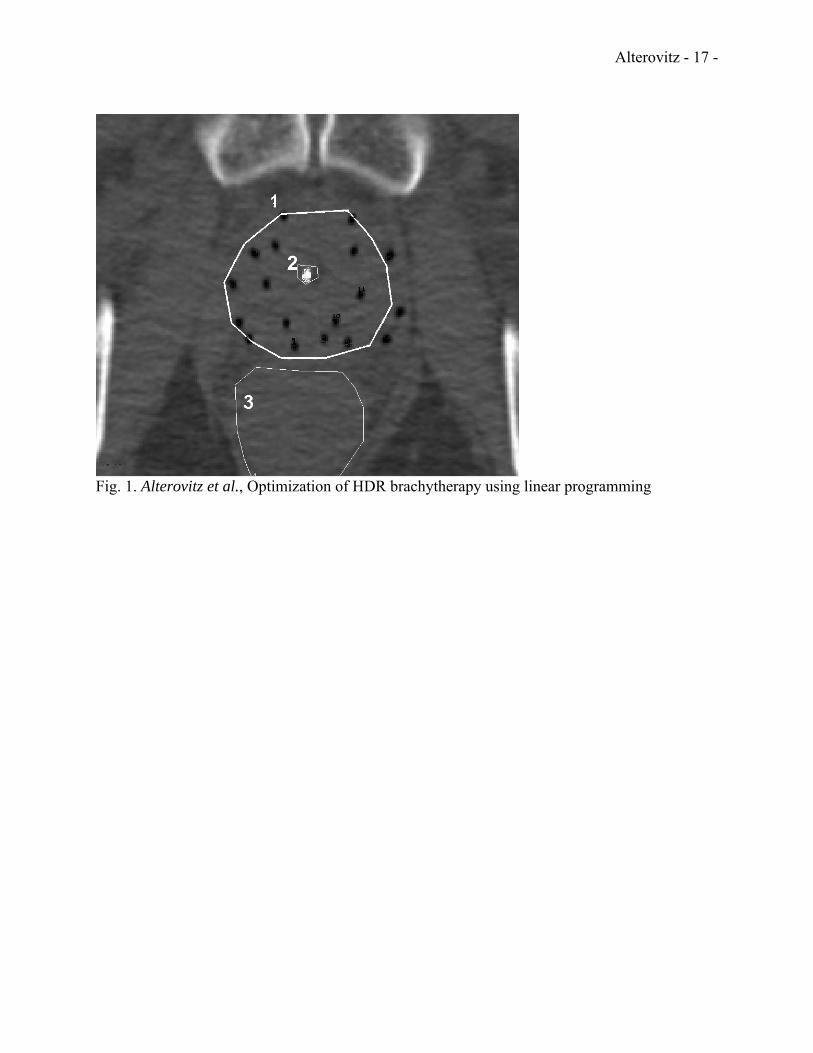
As IPSA is an anatomy-based optimization method, both the SA and LP methods require a segmented representation of the catheters and surrounding tissues. After catheter implantation, a treatment planning pelvic CT scan was obtained for each patient. Three-millimeter-thick CT slices were collected using a spiral CT. The clinical target volume (CTV) and critical organs (CO) including bladder, rectum, and urethra were contoured using the Nucletron Plato Version 14.2.6 (Nucletron B.V., Veenendaal, The Netherlands). The CTV included only the prostate and no margin was added. When outlining the bladder and rectum, the outer most mucosa surface was contoured. The urethra was defined by the outer surface of the Foley catheter. Only the urethral volume within the CTV was contoured. The CO's were contoured on all CT slices containing the CTV and at least two additional slices above and below. Implanted catheters were also digitized. A slice of a 3D CT scan with contoured anatomical structures (prostate, urethra, rectum, and bladder) and catheters is shown in Fig. 1.
From the digitized anatomical structures, IPSA selected the active dwell positions and generated a set of m dose calculation points for which the optimization methods will calculate dose. Since the selection of the active dwell positions and dose calculation points affects the outcome of optimization21, we use those generated by IPSA as input for the LP method. For each contoured volume, IPSA uses two categories of dose calculation points: “surface” and “volume.” This results in 8 dose calculation point types: “surface” and “volume” for the four contoured
Alterovitz - 6 -
tissue types (prostate, urethra, bladder, and rectum). For each tissue type, adjusting the dose to “surface” dose calculation points controls the dose coverage and conformality while adjusting the dose to “volume” dose calculation points controls the dose homogeneity2.
The patients were treated with HDR brachytherapy at UCSF Comprehensive Cancer Center using dosimetric plans generated by the current version of IPSA. We used imaging and dosimetry records from those treatments to compare SA with LP. B. Dose calculation
Dwell positions are defined as points along catheters at which a source can be placed for a non-zero interval of time. The n active dwell positions were selected by IPSA. We define the dwell time of a source at dwell position j by tj. A dwell time of 0 corresponds to skipping past a dwell position. The dwell times tj are the variables that will be set to produce a dose distribution that satisfies the clinical criteria as best as possible.
Given the coordinates of the dwell positions and a dose calculation point i of each tissue type, we obtain the dose-rate contribution dij of dwell position j to dose calculation point i as specified in the AAPM TG-43 dosimetry protocol22,23. The dose-rate contribution is the energy imparted by the radioactive source into an absorbing material (the tissue) per unit time and has units cGy/sec, where 1 gray (Gy) equals 1 joule per kilogram. The dose-rate contribution is a function of rij, the distance between dwell position j and dose calculation point i. It also depends on the radioactive material used in the source. The source used with the afterloader for HDR brachytherapy was 192Ir.
The dose contribution of dwell position j to dose calculation point i is computed by multiplying the dose-rate contribution dij by the dwell time tj. The dose Di at a dose calculation point i is calculated by summing the dose contribution from each dwell position.
∑=
=n
jjiji tdD
1
The dose Di has units of cGy, which describes the energy imparted by radiation into a unit mass of tissue. C. Clinical criteria
After contouring, the physician prescribes dose ranges for each anatomical structure. The dose ranges used in this study, listed in Table I, are typical values clinically used at UCSF Comprehensive Cancer Center. This includes the minimum dose Ds
min and maximum dose Dsmax
for each dose calculation point type s. For a dose calculation point i of type s, the desired dose Dsi should satisfy Ds
min ≤ Dsi ≤ Dsmax.
In practice, it may not be physically possible to provide a radioactive dose in the physician specified range for every dose calculation point in the 3D volume. Hence, the physician also specifies a “penalty” for any point for which the clinical criteria is not satisfied. If the actual dose is below or above the prescribed range, the penalty increases linearly at rates Ms
min and Msmax,
respectively. Adjustment of Msmin and Ms
max sets the relative importance of dose range satisfaction between anatomical structures. The dose ranges (Ds
min, Dsmax) and penalty weights Ms
min and Msmax
used in this study are shown in Table I for each dose calculation point type s. The penalty wsi at a dose calculation point i of type s can be described in mathematical form using a cost function.
( )( )
⎪⎩
⎪⎨
⎧
<<≥−≤−−
=maxmin
maxmaxmax
minminmin
if0 if if
ssis
ssissis
ssissis
si
DDDDDDDMDDDDM
w . (1)
Alterovitz - 7 -
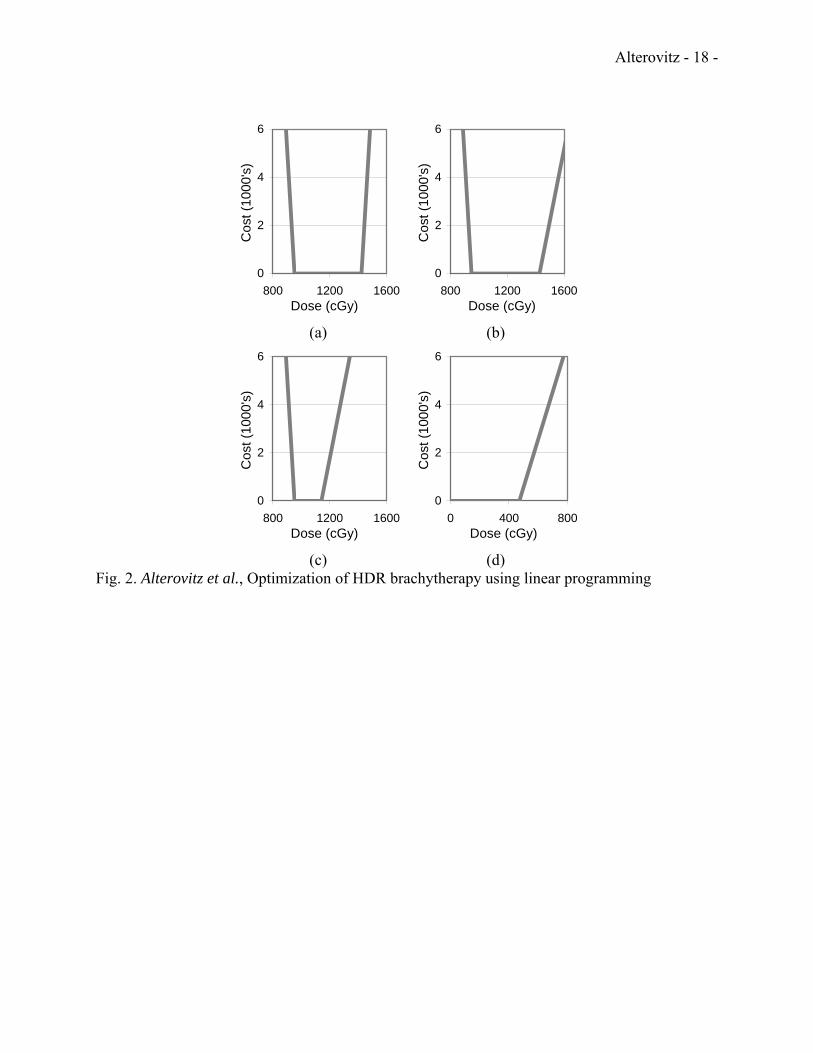
Fig. 2 plots the cost functions (penalty as a function of dose) for the clinical criteria in Table I. D. Linear Programming Formulation
Once the dose ranges and penalty costs are specified, the objective is to satisfy the clinical criteria as best as possible by computing dwell times that minimize the net dose penalty costs. Equation (1) from section II.C defines the cost function for an individual dose calculation point i of type s based on the clinical criteria for that point. For each type s, we define the penalty cost Es as the average penalty cost per point:
∑=
=sm
i s
sis m
wE
1 (2)
where ms is the number of dose calculation points of type s. The global objective function is to minimize the sum of the penalty costs for the 8 dose calculation point types:
∑∑∑= ==
==8
1 1
8
1 s
m
i s
si
ss
s
mw
EE . (3)
This objective function is identical to the objective function used by IPSA3. The objective function E is not linear because it is composed of nonlinear functions wsi for
each dose calculation point i. However, each function wsi is piece-wise linear. We can formulate this problem as a linear program by creating artificial variables csi to represent cost and defining the following constraints:
( )( )
0
maxmax
minmin
≥−≥−−≥
si
ssissi
ssissi
cDDMcDDMc
. (4)
Because wsi is a piece-wise linear and convex function, the constraints above guarantee that csi ≥ wsi for all i, s. Furthermore, we redefine the global objective function to
∑∑= =
=8
1 1s
m
i s
sis
mc
E .
For minimized E where the costs csi satisfy the inequalities (4), we are guaranteed csi = wsi for all s, i. We show this by proving the contrapositive (csi ≠ wsi implies E not minimized), which is logically equivalent24. If csi ≠ wsi, then csi > wsi for some s, i and there will exist a cost c’si such that csi > c’si ≥ wsi. Since csi’ will not violate any constraint in inequalities (4), it is feasible. We define E' exactly as E except using c’si instead of csi. Hence, E' < E and no cost variables used to compute E' violate a constraint, which implies E is not minimized. Hence, for minimized E, we are guaranteed csi = wsi.
We summarize constants, variables, and the objective function for the LP formulation in Table II. In equation (5), we explicitly define the linear program in canonical form14 by plugging into the constraints the dose distribution Dsi at point i of type s due to dwell times tj.
Alterovitz - 8 -
njtmisc
misDMtdMc
misDMtdMc
mcE
j
ssi
sss
n
jjsijssi
sss
n
jjsijssi
s
m
i s
sis
,,10,,1;8,,10
,,1;8,,1
,,1;8,,1
:Subject to
Minimize
maxmax
1
max
minmin
1
min
8
1 1
K
KK
KK
KK
=≥==≥
==−≥−
==≥+
=
∑
∑
∑∑
=
=
= =
(5)
Because of the properties of the artificial variables csi shown above for minimized E, the optimal solution obtained for the linear program will be the same as the optimal solution to the nonlinear formulation based on the objective function in equation (3) with the cost functions in equation (1). A (non-optimal) feasible solution for the LP formulation can be trivially found by setting tj = 0 for all j and setting
⎪⎭
⎪⎬⎫
⎪⎩
⎪⎨⎧
⎟⎟
⎠
⎞
⎜⎜
⎝
⎛−⎟
⎟
⎠
⎞
⎜⎜
⎝
⎛⎟⎟
⎠
⎞
⎜⎜
⎝
⎛−⎟
⎟
⎠
⎞
⎜⎜
⎝
⎛−= ∑∑
==
max
1
maxmin
1
min ,0,max s
n
jjsijss
n
jjsijssi DtdMDtdMc
for all i and s. E. Method Evaluation
We implemented software using C++ to read patient specific parameters from IPSA and output the linear program (5) in the file format of AMPL (A Mathematical Programming Language)25. We solved the linear program specified in each AMPL file using ILOG CPLEX 9.0, an advanced implementation of the Simplex algorithm14 designed for large industrial optimization problems26. Computation was performed on a 3.0GHz Pentium IV computer running the Linux operating system.
We recorded the dwell times and the objective function value E for the solutions obtained using SA and LP. We evaluated the resulting dose distributions using standard dosimetric indices, including prostate V100 and V150 (the percentage of the prostate receiving over 100% and over 150% of the prescribed dose, respectively). As dose inside the prostate should fall between 100% (Dmin) and 150% (Dmax) of prescribed dose, ideally V100 should be 100% and V150 should be 0%. Similarly, we also evaluated V100 and V150 for the urethra. Dosimetric indices for normal structures (non-cancerous tissues) include the rectum (V50 and V100) and the bladder (V50 and V100). As normal structures should be spared radioactive dose, these indices ideally should be close to 0%. The objective function E is effectively a weighted sum of the difference of the dosimetric indices from their ideal values, where the relative weights are determined by the costs Ms
min and Msmax for each s and the distinction between surface and volume
points. III. RESULTS
ILOG CPLEX solved for the optimal solution to the linear program in an average time of 9.00 seconds per case with a standard deviation of 3.77 seconds for the 20 prostate cancer patient cases. The times ranged from 3.68 seconds to 14.63 seconds. The Simplex algorithm in ILOG CPLEX required an average of 1653 iterations with a standard deviation of 341 iterations.
The average objective function value for 20 prostate cancer patient cases was 3.27 for the LP
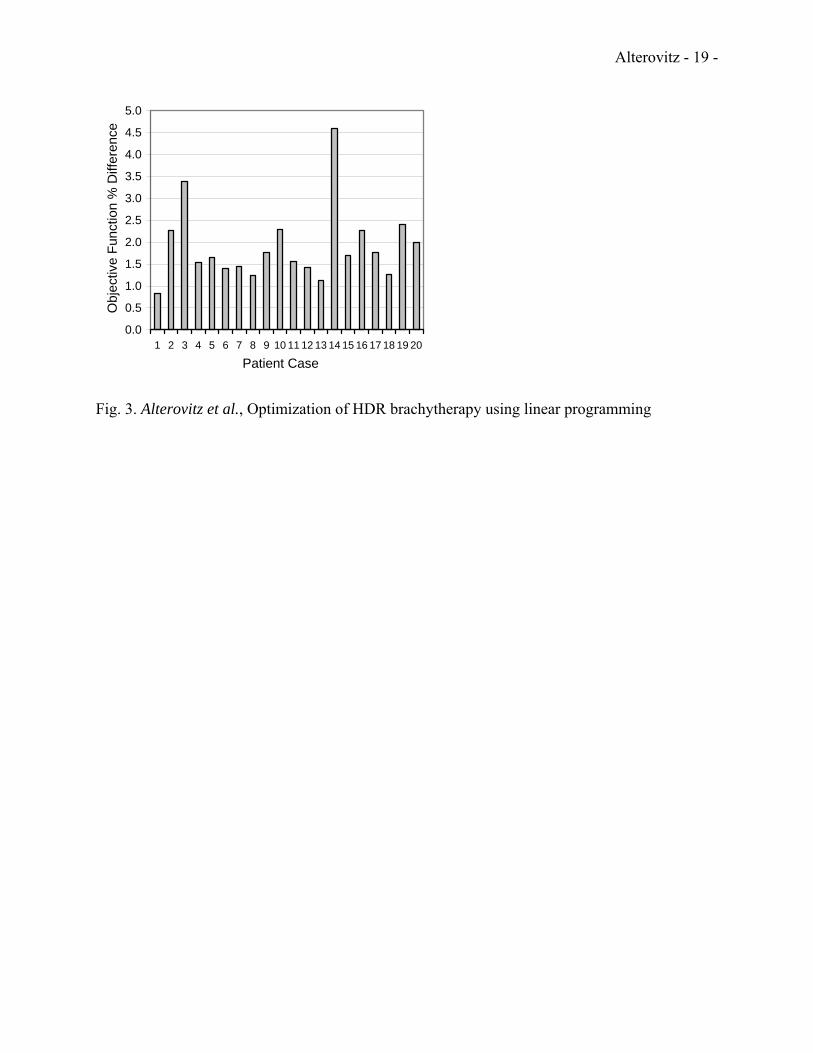
Alterovitz - 9 -
method compared to 3.33 for SA. The percent difference in objective function value between the solution found using SA and the optimal solution found using LP for each individual patient case is shown in Fig. 3. Improvement varies from a minimum of 0.84% to a maximum of 4.59%. We performed paired t-tests to determine the statistical significance (P < 0.01) of the results and found that the improvement in objective function value using the LP method compared to SA was statistically significant (P = 1.54×10⁻⁷).
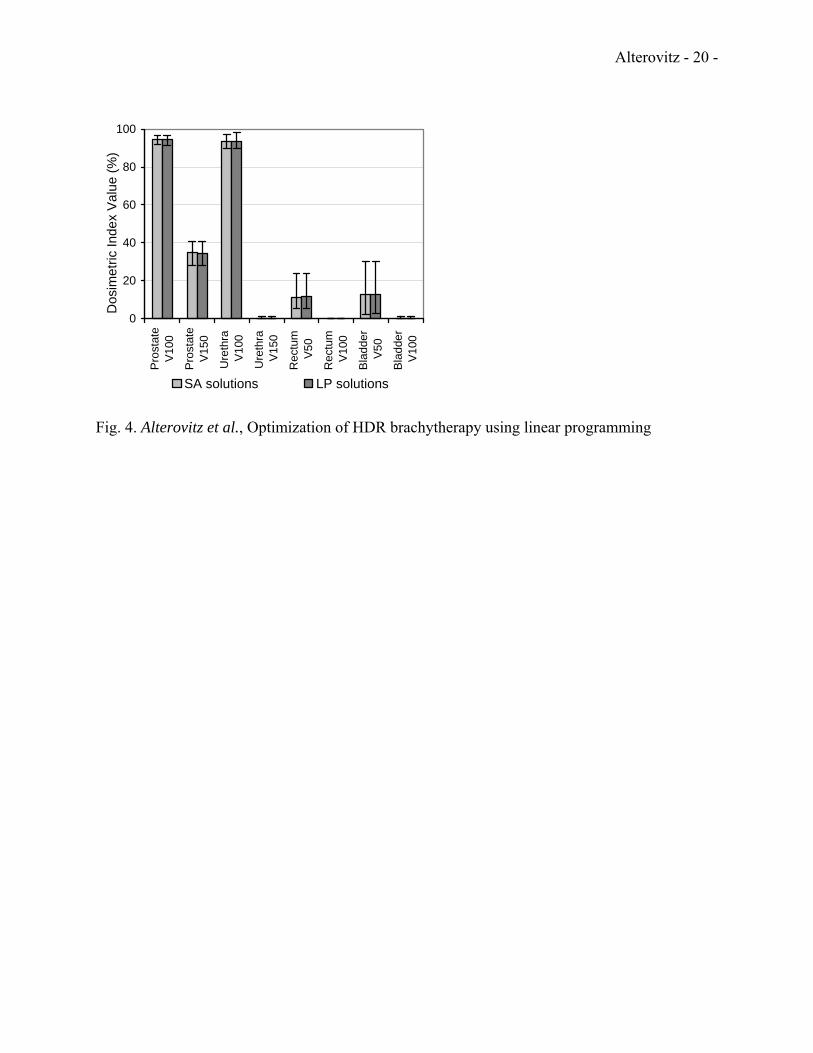
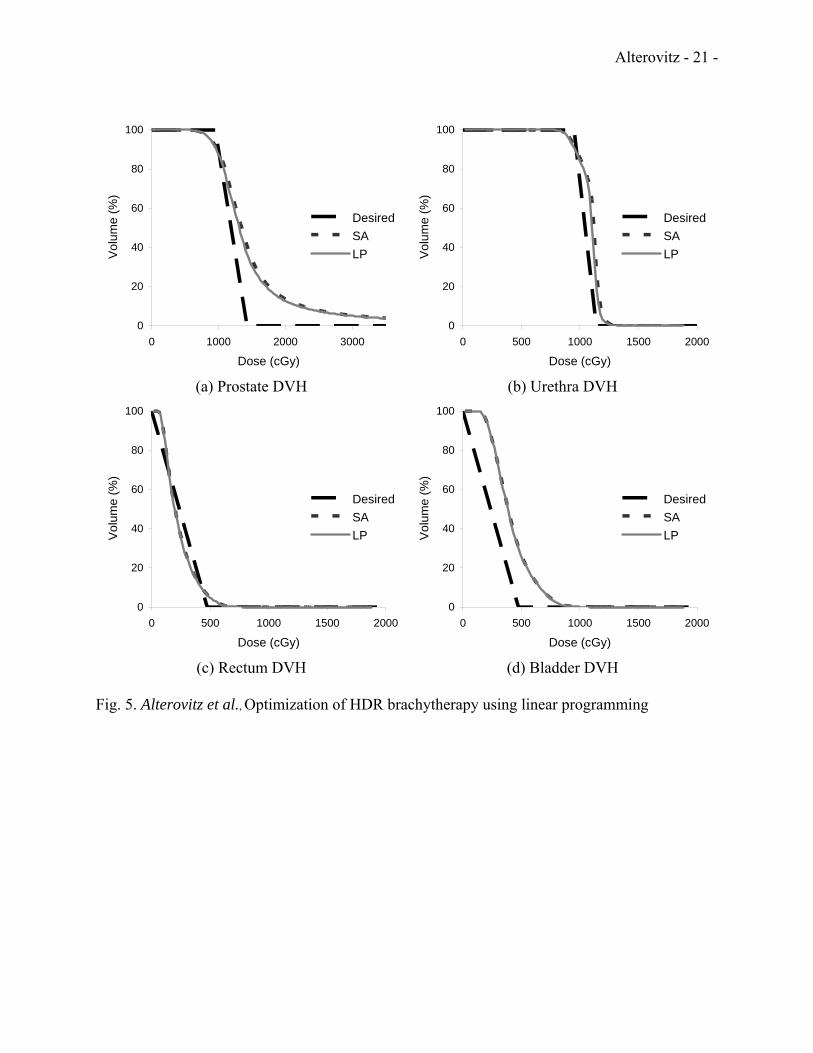
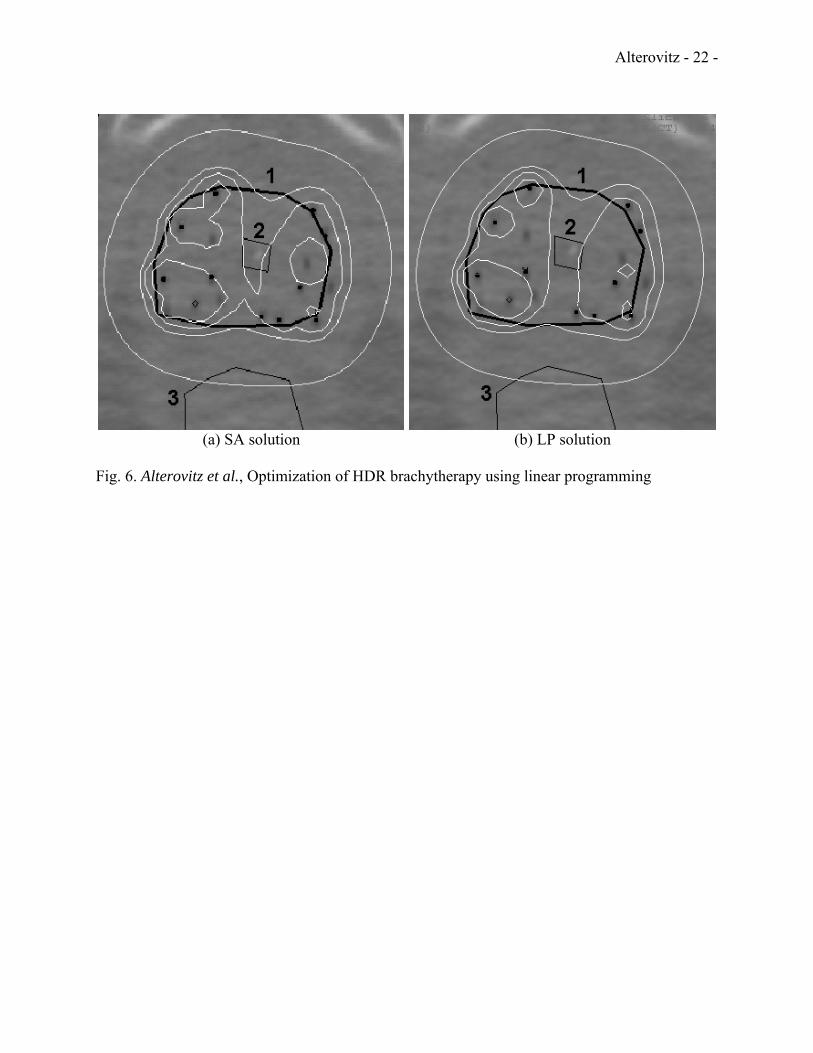
Fig. 4 displays the standard dosimetric indices for both the SA and LP solutions. The bars indicate the mean indices as percents and the error bars indicate the maximum and minimum indices obtained for the 20 prostate cancer patient cases. Based on these dosimetric indices, the difference between the dose distributions generated by SA and LP was small. This is quantitatively shown in Table III. The maximum improvement of LP over SA in the 20 patient cases tested was 1.65% for the prostate V150 index. LP resulted in worse dosimetric index values than SA for some patient cases due to inherent trade-offs between the indices for any particular patient. None of the dosimetric indices indicated a statistically significant (P < 0.01) difference between the dose distributions generated by SA and LP. Fig. 5 plots the dose-volume-histogram (DVH) for each tissue type for the patient case with the greatest magnitude improvement in a dosimetric index between the LP and SA solutions. Fig. 6 displays a CT scan of the same patient with overlaid isodose contours for both solutions. IV. DISCUSSION
The LP method achieved high quality results with prostate V100 in excess of 94.6% and relatively low doses for normal tissues. The dosimetric index results are not significantly different from those of IPSA, which was previously shown to be superior to the commonly used method GO (Geometric Optimization)2,6. The small variances observed for the prostate and urethra in Fig. 4 show the consistency of the treatment plan quality for both the SA and LP methods. The larger variances for the prostate V150, the rectum, and the bladder are due to differences between patients in anatomy, prostate volume, and distance between the prostate and organs at risk.
The LP and SA methods are both based on IPSA’s objective function for the HDR brachytherapy dwell time optimization problem. The only difference is the optimization algorithm used, simulated annealing versus an equivalent linear programming formulation that can be solved to mathematical optimality using the Simplex algorithm. As simulated annealing is a probabilistic method, it is only guaranteed to converge to an optimal solution after an infinite amount of computation time. Standard termination criteria, such as stopping the algorithm after a fixed number of iterations, may result in sub-optimal solutions. During the development phase of IPSA, a large number of cases were run using a very large number of iterations (>1 million) and no significant improvement on the objective function were found compared to the values found after 100,000 iterations. However, the closeness to optimality of the solutions of the current version of IPSA could not be guarantied for every new clinical case.
Because the LP formulation of IPSA’s objective function can be solved deterministically to global mathematical optimality, the LP method solution provides a precise baseline for evaluating solutions obtained by probabilistic methods such as SA. The LP method computed a solution with a better objective function value compared to SA for every patient case. The improvement in objective function values of LP compared to SA was statistically significant. However, the effect size of the objective function improvement was not sufficient to result in statistically significant differences in standard dosimetric indices for our sample of 20 prostate cancer patient cases. We observe that the DVH plots for the patient case with the largest
Alterovitz - 10 -
difference in dosimetric indices are similar for both methods (Fig. 5) while some differences are observable on the isodose curves (Fig. 6). The hot spots (prostate V150) have different shapes and the prostate V120 curve is at a different location. This indicates that the local dose distribution (isodose) is different while global dose delivered to the prostate (DVH) and critical dose delivered to the prostate (dosimetric indices) are equivalent. We believe that an improvement of less than 2% in a standard dosimetric index is not clinically relevant in current medical practice, and the magnitudes of improvement in dosimetric indices shown in Table III are all less than this threshold. This quantitatively indicates that the dose distributions generated by SA are clinically equivalent to the best achievable dose distributions based on the current IPSA objective function and dose constraints. V. CONCLUSION
In HDR brachytherapy, clinicians must set dwell times for a radioactive source inside the prostate to maximize satisfaction of dose requirements that conform to patient-specific anatomy. Our primary contribution was to take the well-established dwell times optimization problem defined by Inverse Planning by Simulated Annealing (IPSA) and exactly formulate it as a feasible linear programming (LP) problem. Because LP problems can be solved exactly and deterministically, this formulation provides strong performance guarantees: one can rapidly find the mathematically optimal solution for any patient case and clinical criteria parameters. For a sample of 20 prostate cancer patient cases, the new LP method computed optimal dwell times in less than 15 seconds per case on a standard PC. The LP method does not require setting any non-clinical optimization parameters and provides a precise baseline for evaluating solutions obtained by probabilistic methods such as simulated annealing (SA).
Our secondary contribution was to address an important and clinically relevant open problem: how close to mathematical optimality are solutions currently being obtained clinically using SA? For a sample of 20 prostate cancer patient cases, the isodose curves for solutions obtained using SA were substantially different from those of the mathematically optimal solutions obtained using LP, but the dose distributions were clinically equivalent as measured by standard dosimetric indices with a 2% threshold. The results indicate that solutions generated by the current version of IPSA are clinically equivalent to the best achievable solutions.
The linear program we formulated is specialized for prostate cancer patient cases. The mathematical formulation can be extended to other cancer types for which HDR brachytherapy is used by incorporating different clinical parameters, although integrating and testing the LP method with medical imaging for segmentation for other cancer types would require substantial effort. The method can also be extended to support any piece-wise linear convex cost functions, not solely the 3-piece cost functions presented above. Recent developments in magnetic resonance spectroscopy imaging and image registration introduce a new clinical criterion, a dose boost to the tumor volume within the prostate27-29. Although we do not explicitly consider that dose calculation point type, the mathematical formulation we defined can be extended to incorporate it by adding a tumor volume tissue type. A potential advantage of the LP method for each of these extensions is that it will use the well-established framework of IPSA and deterministically compute mathematically optimal dwell time solutions for all patient cases. VI. ACKNOWLEDGMENTS
This work was supported in part by the National Institutes of Health under grant R21 EB003452 and by a National Science Foundation Graduate Research Fellowship to Ron Alterovitz. We also thank Alper Atamtürk and Andrew Lim at UC Berkeley for their advice and feedback.
Alterovitz - 11 -
REFERENCES 1 National Center for Health Statistics, Prostate disease, Available:
http://www.cdc.gov/nchs/fastats/prostate.htm, 2004. 2 I.-C. J. Hsu, E. Lessard, V. Weinberg, and J. Pouliot, “Comparison of inverse planning
simulated annealing and geometrical optimization for prostate high-dose-rate brachytherapy,” Brachytherapy 3, 147-152 (2004).
3 E. Lessard and J. Pouliot, “Inverse planning anatomy-based dose optimization for HDR brachytherapy of the prostate using fast simulated annealing algorithm and dedicated objective function,” Med. Phys. 28, 773-779 (2001).
4 E. Lessard, I.-C. J. Hsu, and J. Pouliot, “Inverse planning for interstitial gynecological template brachytherapy: truly anatomy based planning,” Int. J. Radiat. Oncol. Biol. Phys. 54(5), 1243-1250 (2002).
5 E. Lessard, “Development and clinical introduction of an inverse planning dose optimization by simulated annealing (IPSA) for high dose rate brachytherapy,” Med. Phys. (Thesis abstract) 31(10), 2935 (2004).
6 B. Lachance, D. Beliveau-Nadeau, E. Lessard, et al., “Early clinical experience with anatomy-based inverse planning dose optimization for high-dose-rate boost of the prostate,” Int. J. Radiat. Oncol. Biol. Phys. 54, 86-100 (2002).
7 A. Mamoudieh, C. Tremblay, L. Beaulieu, B. Lachance, F. Harel, E. Lessard, J. Pouliot, and E. Vigneault, “Anatomy based inverse planning dose optimization in HDR prostate implant: A toxicity study,” Radiotherapy and Oncology 75, 318-324 (2005).
8 D. Citrin, H. Ning, H. Guion, G. Li, R.C. Susil, R.W. Miller, E. Lessard, J. Pouliot, X. Huchen, J. Capala, C.N. Coleman, K. Camphausen, and C. Menard, “Inverse Treatment Planning Based on MRI for HDR Prostate Brachytherapy,” Int. J. Radiat. Oncol. Biol. Phys. 61(4), 1267-1275 (2005).
9 C. Ménard, R.C. Susil, P. Choyke, G.S. Gustafson, W. Kammerer, H. Ning, R.W. Miller, K.L. Ullman, N.S. Crouse, S. Smith, E. Lessard, J. Pouliot, V. Wright, E. McVeigh, C. N. Coleman, and K. Camphausen, “MRI-guided HDR prostate brachytherapy in a standard 1.5T scanner,” Int. J. Radiation Oncology Biol. Phys. 59(5), 1414–1423 (2004).
10 K.D. DeWitt, I-C Hsu, V.K. Weinberg, E. Lessard and J. Pouliot, “3-D Inverse treatment planning for the Tandem and Ovoid Applicator in Cervical Cancer,” Int. J. Radiat. Oncol. Biol. Phys. 63(4), 1270-1274 (2005).
11 R. Taschereau, P.R. Stauffer, I.C. Hsu, J.L. Schlorff, A.J. Milligan, and J. Pouliot, “Radiation Dosimetry of a Conformal Heat-brachytherapy Applicator,” Technology in Cancer Research & Treatment 3(4), August (2004).
12 J. Pouliot, E. Lessard, and I.-C. J. Hsu, “Chapter 21 : Advanced 3D Planning,” Brachytherapy Physics, Second Edition, Medical Physics Publishing, 2005
13 J. Pouliot et al., “Inverse planning for HDR prostate brachytherapy used to boost dominant intraprostatic lesions defined by magnetic resonance spectroscopy imaging,” Int. J. Radiat. Oncol., Biol., Phys. 59, 1196 (2004).
14 S. G. Nash and A. Sofer, Linear and Nonlinear Programming, McGraw-Hill, 1996. 15 M. Lahanas, D. Baltas and N. Zamboglou “Anatomy-based three dimensional dose
optimization in brachytherapy using multiobjective genetic algorithms” Med. Phys. 26(9), pp1904-1918 (1999)
Alterovitz - 12 -
16 Y. Yu, J.B. Zhang, G. Cheng, M.C. Schell, P. Okunieff “Multi-objective optimization in radiotherapy: application to stereotactic radiosurgery and prostate brachytherapy” Artificial intelligence in Medecine 19, pp39-51, (2000)
17 M. Lahanas, D. Baltas and N. Zamboglou “A hybrid evolutionary algorithm for multi-objective anatomy-based dose optimization in high dose rate brachytherapy” Med. Phys. Biol 48, pp399-415 (2003)
18 W. D. Renner, T. P. O’Conner, and N. M. Bermudez, “An algorithm for generation of implant plans for high-dose-rate irradiators,” Med. Phys. 17, 35-40 (1990).
19 P. Kneschaurek, W. Schiess, and R. Wehrmann, “Volume-based dose optimization in brachytherapy,” Int. J. Radiat. Oncol. Biol. Phys. 45, 811-815 (1999).
20 G. Jozsef, O. E. Streeter, and M. A. Astrahan, “The use of linear programming in optimization of HDR implant dose distributions,” Med. Phys. 30, 751-760 (2003).
21 M. Lahanas, D. Baltas, S. Giannouli, N. Milickovic, and N. Zamboglou, “Generation of uniformly distributed dose points for anatomy-based three-dimensional dose optimization methods in brachytherapy,” Med. Phys. 27, 1034-1046 (2000).
22 R. Nath et al., “Dosimetry of interstitial brachytherapy sources: recommendations of the AAPM Radiation Therapy Committee Task Group No. 43.,” Med. Phys. 22, 209-234 (1995).
23 M.J. Rivard et al., “Update of AAPM Task Group No. 43 Report: A revised AAPM protocol for brachytherapy dose calculations,” Med. Phys. 31, 633 – 674 (2004).
24 R. G. Taylor, Models of Computation and Formal Languages, Oxford University Press, 1998.
25 R. Fourer, D. M. Gay, and B. W. Kernighan, AMPL: a modeling language for mathematical programming, Thomson/Brooks/Cole, 2nd edition, 2003.
26 ILOG, Inc., ILOG CPLEX: High-performance software for mathematical programming and optimization, Available: http://www.ilog.com/products/cplex/, 2005.
27 Y. Kim, S. M. Noworolski, J. Pouliot and I.-C. Hsu, D. B. Vigneron, J. Kurhanewicz, “Expandable and rigid endorectal coils for prostate MRI: Impact on prostate distortion and rigid image registration,” Med. Phys. 32(12), 3569-3578, 2005.
28 R. Alterovitz, K. Goldberg, J. Kurhanewicz, J. Pouliot, and I.-C. J. Hsu, “Image registration for prostate MR Spectroscopy using biomechanical modeling and optimization of force and stiffness parameters,” in Proceedings 26th Annual Int. Conf. of the IEEE Engineering In Medicine and Biology Society, San Francisco, CA, 2004, pp. 1722–1725.
29 R. Alterovitz, K. Goldberg, J. Pouliot, I.-C. J. Hsu, Y. Kim, S.M. Noworolski, and J. Kurhanewicz, “Registration of MR prostate images with biomechanical modeling and nonlinear parameter estimation,” Med. Phys., to appear (2006).
Alterovitz - 13 -
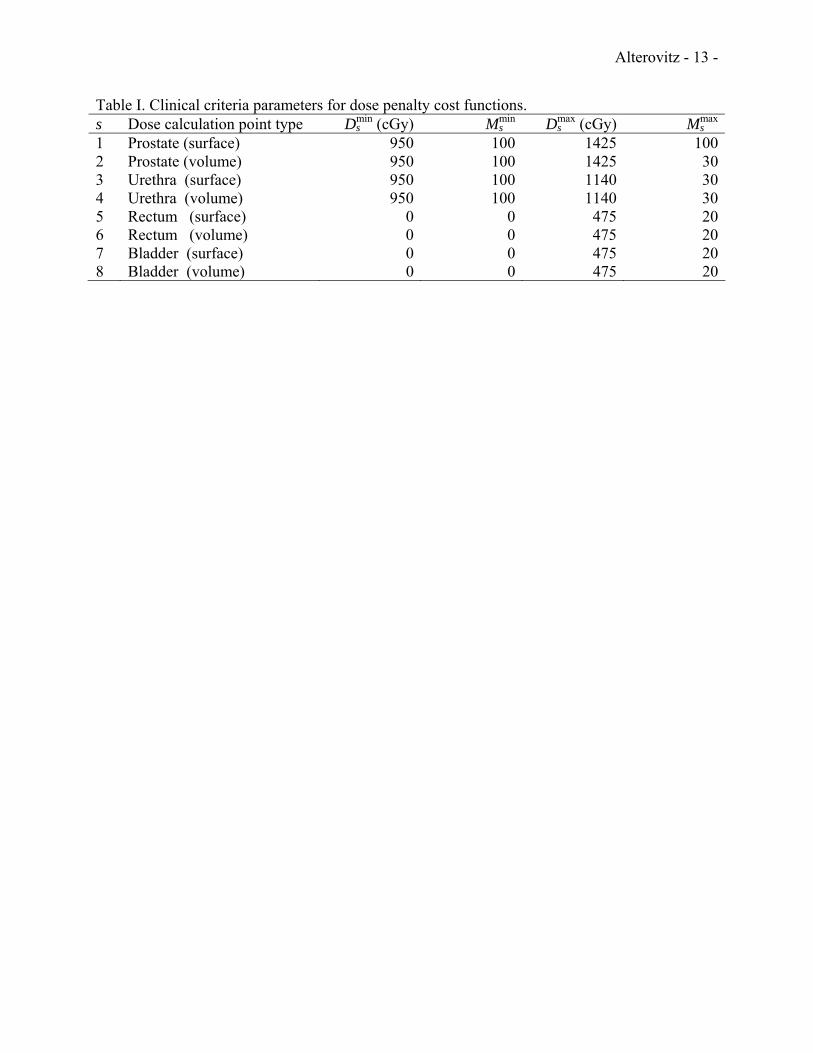
Table I. Clinical criteria parameters for dose penalty cost functions. s Dose calculation point type Ds
min (cGy) Msmin Ds
max (cGy) Msmax
1 Prostate (surface) 950 100 1425 1002 Prostate (volume) 950 100 1425 303 Urethra (surface) 950 100 1140 304 Urethra (volume) 950 100 1140 305 Rectum (surface) 0 0 475 206 Rectum (volume) 0 0 475 207 Bladder (surface) 0 0 475 208 Bladder (volume) 0 0 475 20

Alterovitz - 14 -
Table II: HDR dose optimization LP formulation constants, variables, and functions. Constants ms Number of dose calculation points of type s. N Number of dwell positions. dij Dose-rate contribution from dwell position j to dose calculation point i. Variables tj Source dwell time for dwell position j. ci Penalty cost at dose calculation point i. Objective E Global cost function.
Alterovitz - 15 -
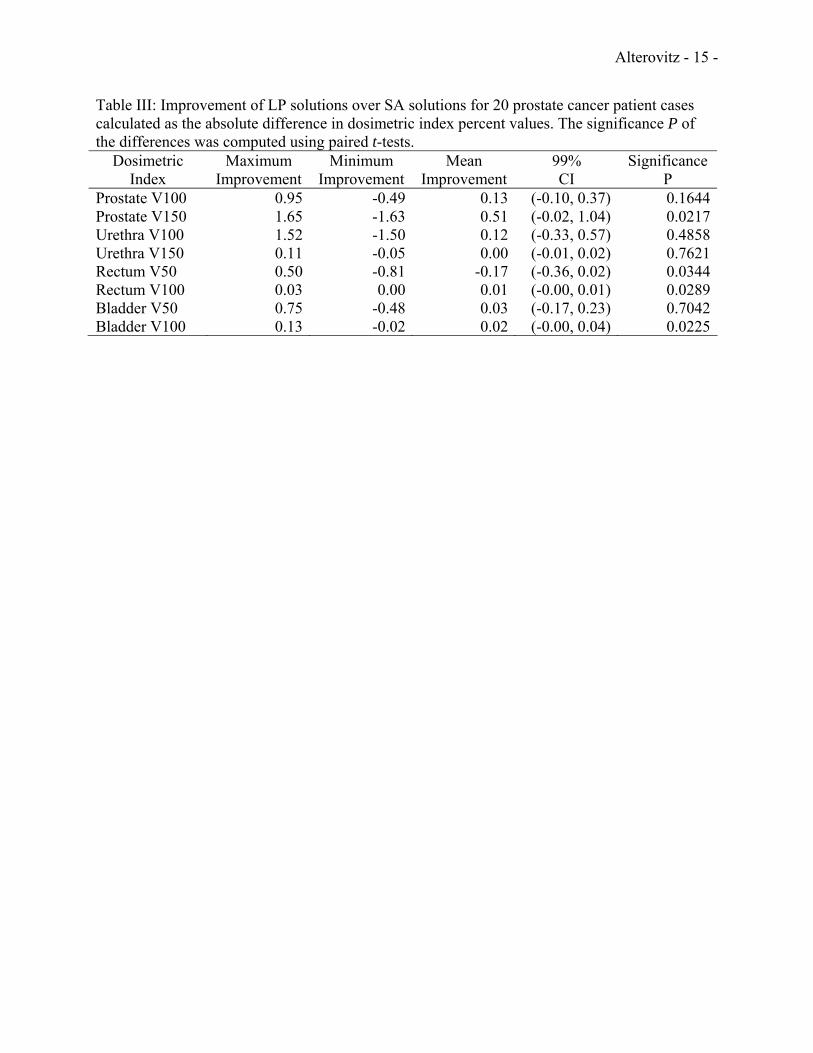
Table III: Improvement of LP solutions over SA solutions for 20 prostate cancer patient cases calculated as the absolute difference in dosimetric index percent values. The significance P of the differences was computed using paired t-tests.
Dosimetric Index
Maximum Improvement
Minimum Improvement
Mean Improvement
99% CI
Significance P
Prostate V100 0.95 -0.49 0.13 (-0.10, 0.37) 0.1644Prostate V150 1.65 -1.63 0.51 (-0.02, 1.04) 0.0217Urethra V100 1.52 -1.50 0.12 (-0.33, 0.57) 0.4858Urethra V150 0.11 -0.05 0.00 (-0.01, 0.02) 0.7621Rectum V50 0.50 -0.81 -0.17 (-0.36, 0.02) 0.0344Rectum V100 0.03 0.00 0.01 (-0.00, 0.01) 0.0289Bladder V50 0.75 -0.48 0.03 (-0.17, 0.23) 0.7042Bladder V100 0.13 -0.02 0.02 (-0.00, 0.04) 0.0225
Alterovitz - 16 -
Figure Captions Fig. 1. Transverse slice of a CT scan with white contours of the prostate (1), urethra (2), and rectum (3). The catheters are marked with black dots. The bladder is not visible in this slice. Fig. 2. The clinical criteria are specified using cost functions which define penalty as a function of dose for the each dose calculation point type including the prostate surface (a), prostate volume (b), urethra (c), and rectum and bladder (d). Fig. 3. The percent difference in objective function value between the optimal solution (found using the LP method) and the solution found by SA for 20 prostate cancer patient cases. The difference is statistically significant (P = 1.54 × 10⁻⁷). Fig. 4. Mean dosimetric index results for the SA and LP methods for 20 prostate cancer patient cases. Error bars indicate maximum and minimum values for the 20 patient cases. Fig. 5. Dose-volume-histogram (DVH) plots for the prostate (a), urethra (b), rectum (c), and bladder (d) for the patient case with greatest difference in dosimetric indices between the LP and SA solutions. For dose less than Dmin for each tissue type, the desired volume is 100%. For dose greater than Dmax, the desired volume 0%. Fig. 6. Isodose curves for the SA (a) and LP (b) solutions for the patient case with greatest difference in dosimetric indices. The prostate (1), urethra (2), and rectum (3) are contoured in black. Catheters are shown as black dots. Isodose curves for 50%, 100% (Dmin), 120%, and 150% (Dmax) of prostate minimum prescribed dose are plotted in white.
Alterovitz - 17 -
Fig. 1. Alterovitz et al., Optimization of HDR brachytherapy using linear programming
Alterovitz - 18 -
0
2
4
6
800 1200 1600Dose (cGy)
Cos
t (10
00's
)
0
2
4
6
800 1200 1600Dose (cGy)
Cos
t (10
00's
)
(a) (b)
0
2
4
6
800 1200 1600Dose (cGy)
Cos
t (10
00's
)
0
2
4
6
0 400 800Dose (cGy)
Cos
t (10
00's
)
(c) (d) Fig. 2. Alterovitz et al., Optimization of HDR brachytherapy using linear programming
Alterovitz - 19 -
0.0
0.5
1.0
1.5
2.0
2.5
3.0
3.5
4.0
4.5
5.0
1 2 3 4 5 6 7 8 9 10 11 12 13 14 15 16 17 18 19 20
Patient Case
Obj
ectiv
e Fu
nctio
n %
Diff
eren
ce
Fig. 3. Alterovitz et al., Optimization of HDR brachytherapy using linear programming
Alterovitz - 20 -
0
20
40
60
80
100
Pro
stat
eV
100
Pro
stat
eV
150
Ure
thra
V
100
Ure
thra
V
150
Rec
tum
V
50
Rec
tum
V
100
Bla
dder
V
50
Bla
dder
V
100
Dos
imet
ric In
dex
Val
ue (%
)
SA solutions LP solutions
Fig. 4. Alterovitz et al., Optimization of HDR brachytherapy using linear programming
Alterovitz - 21 -
0
20
40
60
80
100
0 1000 2000 3000
Dose (cGy)
Volu
me
(%)
DesiredSALP
(a) Prostate DVH
0
20
40
60
80
100
0 500 1000 1500 2000
Dose (cGy)
Volu
me
(%)
DesiredSALP
(b) Urethra DVH
0
20
40
60
80
100
0 500 1000 1500 2000
Dose (cGy)
Volu
me
(%)
DesiredSALP
(c) Rectum DVH
0
20
40
60
80
100
0 500 1000 1500 2000
Dose (cGy)
Volu
me
(%)
DesiredSALP
(d) Bladder DVH Fig. 5. Alterovitz et al., Optimization of HDR brachytherapy using linear programming
Alterovitz - 22 -
(a) SA solution (b) LP solution Fig. 6. Alterovitz et al., Optimization of HDR brachytherapy using linear programming