Embed Size (px)
Citation preview
CLIVAR Exchanges No. 72, June 2017 52Past Global Changes Magazine, Volume 25, No. 1
Braddock K. Linsley1, Robert B. Dunbar2, Donna Lee1, Neil Tangri2, Emilie Dassié1,3
1 Lamont-Doherty Earth Observatory, 61 Route 9W, Palisades, NY 10964, USA
2 Department of Environmental Earth Systems Science, Stanford University,
Stanford, CA, 94305, USA
3 Laboratoire d'Océanographie et du Climat: LOCEAN - IPSL, UMR 7159 CNRS/UPMC/IRD,
Université P. et M. Curie, 4 place Jussieu, 75252 Paris cedex 05, France
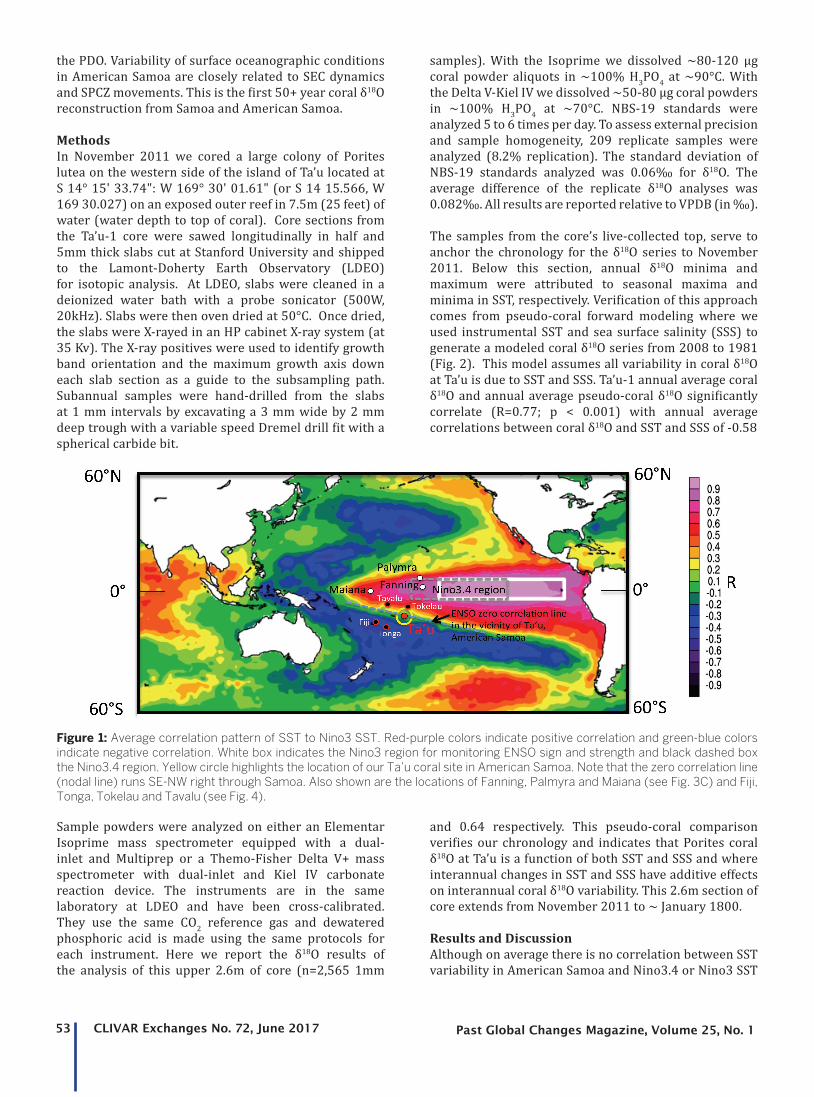
IntroductionPatterns of climate variability are often studied by evaluating instrumental or paleo-data from regions that have the highest correlations to the target climate mode. For example, past variations in ENSO have been primarily evaluated by compiling or reconstructing sea surface temperature (SST) in the Nino3.4 (5°N-5°S; 120°W-170°W) and Nino3 (5°N-5°S; 90°W-150°W) regions in the equatorial Pacific (e.g.: Trenberth 1997; Urban et al., 2000; Cobb et al., 2013). However, critical information on the spatial extent of a target climate mode can also be gained by studying conditions on the nodal line perimeter of the climate pattern where on average there is no correlation (R=~0) between the climate parameter being reconstructed and the target mode.
During El Niño and La Niña events in the Pacific, the largest SST anomalies are focused in an elongated E-W pattern or footprint that is generally symmetric around 0° latitude in the central Pacific. Individual ENSO events display differences in both the amplitude and the longitude of the largest SST anomalies and cluster analysis of the last 50 years of Pacific SST data indicate that there are three primary El Niño patterns and one primary La Niña pattern (Chen et al., 2015). The mean of these ENSO event patterns results in the classic footprint in ENSO-related SST anomalies surrounded by a perimeter where SST is on average not positively or negatively correlated with ENSO (see Fig. 1). This perimeter reflects a nodal line where on average SST variability is not correlated to ENSO. Instrumental data suggest that the average ENSO nodal line for all types of El Niño and La Niño events has been relatively stable over the last ~50 years.
In the South Pacific, the ENSO nodal line runs northwest to southeast though Samoa (14°S, 172°W) and American Samoa (14°S, 169.5°W) to French Polynesia (17°S, 150°W)(Fig. 1). This location is nearly identical to the nodal line for the decadal mode of SST variability in the
Pacific (the Pacific Decadal Oscillation (PDO)). Since the PDO appears to have both subtropical and tropical origins (Newman et al., 2016), the congruence of ENSO and PDO nodal lines in some regions is not unexpected. This region in the South Pacific is also the central rainfall axis of the South Pacific Convergence Zone (SPCZ) which trends northwest to southeast from the Equator in the western Pacific through Samoa and American Samoa.
The SPCZ is the largest spur of the Intertropical Convergence Zone (ITCZ) and a key hydrologic feature in the tropics yet its dynamics and even current position are poorly represented in climate models (Vincent 1994; Vincent et al., 2009; Cai et al., 2012; Evans et al., 2015). Atmospheric data indicate a close relationship between SPCZ movements and ENSO in this region. Over the last 30 years, instrumental precipitation data indicate that during most El Niño events the SPCZ moves a few degrees northward (Gouriou and Delcroix 2002; Vincent et al., 2009; Salinger et al., 1995). Southward SPCZ shifts occur during La Niña events (Gouriou and Delcroix 2002, Vincent et al., 2009; Cai et al., 2012). During very strong El Niño events such as 1982/83 and 1997/98, and during some moderate strength El Niño’s such as 1991-1992, the SPCZ can collapse onto the equator (so-called zonal SPCZ events; Vincent et al., 2009; Linsley et al., 2017). Both SPCZ responses during El Niño result in saltier and slightly cooler conditions on average in the area of the SPCZ central rainfall axis as the SPCZ shifts northeast and the westward flowing South Equatorial Current (SEC) advects relatively salty water into the region.
In an effort to track past changes in the SPCZ response to ENSO events and the PDO we have analyzed sub-seasonal skeletal δ18O in a Porites lutea coral core from the island of Ta’u in the Manua Island group on the eastern side of American Samoa. Ta’u Island is located in the center ofthe SPCZ and on the nodal line region for both ENSO and
Abrupt Northward Shift of SPCZ position in the late-1920s Indicates Coordinated Atlantic and
Pacific ITCZ Changedoi: 10.22498/pages.25.1.52
53 CLIVAR Exchanges No. 72, June 2017 Past Global Changes Magazine, Volume 25, No. 1
the PDO. Variability of surface oceanographic conditions in American Samoa are closely related to SEC dynamics and SPCZ movements. This is the first 50+ year coral δ18O reconstruction from Samoa and American Samoa.
MethodsIn November 2011 we cored a large colony of Porites lutea on the western side of the island of Ta’u located at S 14° 15' 33.74": W 169° 30' 01.61" (or S 14 15.566, W 169 30.027) on an exposed outer reef in 7.5m (25 feet) of water (water depth to top of coral). Core sections from the Ta’u-1 core were sawed longitudinally in half and 5mm thick slabs cut at Stanford University and shipped to the Lamont-Doherty Earth Observatory (LDEO) for isotopic analysis. At LDEO, slabs were cleaned in a deionized water bath with a probe sonicator (500W, 20kHz). Slabs were then oven dried at 50°C. Once dried, the slabs were X-rayed in an HP cabinet X-ray system (at 35 Kv). The X-ray positives were used to identify growth band orientation and the maximum growth axis down each slab section as a guide to the subsampling path. Subannual samples were hand-drilled from the slabs at 1 mm intervals by excavating a 3 mm wide by 2 mm deep trough with a variable speed Dremel drill fit with a spherical carbide bit.
Sample powders were analyzed on either an Elementar Isoprime mass spectrometer equipped with a dual-inlet and Multiprep or a Themo-Fisher Delta V+ mass spectrometer with dual-inlet and Kiel IV carbonate reaction device. The instruments are in the same laboratory at LDEO and have been cross-calibrated. They use the same CO2 reference gas and dewatered phosphoric acid is made using the same protocols for each instrument. Here we report the δ18O results of the analysis of this upper 2.6m of core (n=2,565 1mm
samples). With the Isoprime we dissolved ~80-120 μg coral powder aliquots in ~100% H3PO4 at ~90°C. With the Delta V-Kiel IV we dissolved ~50-80 μg coral powders in ~100% H3PO4 at ~70°C. NBS-19 standards were analyzed 5 to 6 times per day. To assess external precision and sample homogeneity, 209 replicate samples were analyzed (8.2% replication). The standard deviation of NBS-19 standards analyzed was 0.06‰ for δ18O. The average difference of the replicate δ18O analyses was 0.082‰. All results are reported relative to VPDB (in ‰).
The samples from the core’s live-collected top, serve to anchor the chronology for the δ18O series to November 2011. Below this section, annual δ18O minima and maximum were attributed to seasonal maxima and minima in SST, respectively. Verification of this approach comes from pseudo-coral forward modeling where we used instrumental SST and sea surface salinity (SSS) to generate a modeled coral δ18O series from 2008 to 1981 (Fig. 2). This model assumes all variability in coral δ18O at Ta’u is due to SST and SSS. Ta’u-1 annual average coral δ18O and annual average pseudo-coral δ18O significantly correlate (R=0.77; p < 0.001) with annual average correlations between coral δ18O and SST and SSS of -0.58
and 0.64 respectively. This pseudo-coral comparison verifies our chronology and indicates that Porites coral δ18O at Ta’u is a function of both SST and SSS and where interannual changes in SST and SSS have additive effects on interannual coral δ18O variability. This 2.6m section of core extends from November 2011 to ~ January 1800.
Results and DiscussionAlthough on average there is no correlation between SST variability in American Samoa and Nino3.4 or Nino3 SST
Figure 1: Average correlation pattern of SST to Nino3 SST. Red-purple colors indicate positive correlation and green-blue colors indicate negative correlation. White box indicates the Nino3 region for monitoring ENSO sign and strength and black dashed box the Nino3.4 region. Yellow circle highlights the location of our Ta’u coral site in American Samoa. Note that the zero correlation line (nodal line) runs SE-NW right through Samoa. Also shown are the locations of Fanning, Palmyra and Maiana (see Fig. 3C) and Fiji, Tonga, Tokelau and Tavalu (see Fig. 4).

CLIVAR Exchanges No. 72, June 2017 54Past Global Changes Magazine, Volume 25, No. 1
over the last ~30 years (see Fig. 1), large El Niño events result in elevated SSS in the Samoa region today (Gouriou and Delcroix 2002; Hasson et al., 2013)(see Fig. 2). There has been a close relationship between SPCZ movements, ENSO and the eastern extent of the western Pacific warm pool with the SPCZ shifting northeast during El Niño events and southwest during La Niña events (Gouriou and Delcroix 2002, Vincent et al., 2009). This SPCZ re-positioning results in more saline conditions on average in the Samoa region during El Niño as the SPCZ shifts northeast and the westward flowing SEC advects relatively salty water into the region.
To evaluate interannual and lower frequency changes in Ta’u-1 coral δ18O for comparison to equatorial indices of ENSO, we filtered the monthly coral δ18O series in two ways. Our first approach was to 24 month high-pass filter and then detrend the coral δ18O series due to the presence of a significant secular coral δ18O trend. The detrending was accomplished using Singular Spectrum Analysis to isolate and then remove the first principal component (the secular trend). This filtered Ta’u δ18O time series was then compared to 7 month running average filtered Nino3.4 SST anomalies (see Fig. 3A). The second filtering approach was to apply only a 24 month high-pass filter (leaving the trend in place) to facilitate direct comparison to equatorial coral δ18O records (see Fig. 3C). We use a composite average of three coral δ18O records from Fanning (Cobb et al., 2013), Palmyra (Cobb et al., 2013) and Maiana (Urban et al., 2000) as a coral δ18O-based index of equatorial ENSO state (termed FPM; see Linsley et al., 2015).
Comparing the Ta’u coral δ18O record to the timing of equatorial ENSO variability indicates a striking phase shift in the decadal mean correlation in the late 1920s. Running correlations between the Ta’u δ18O results and Nino3.4 SST and the FPM equatorial composite coral δ18O highlights the abruptness of the phase shift in the 1920s (see Fig. 3B and D). Sea surface temperature (using ERSST) at American Samoa shows no change in phasing with Nino3.4 SST in the 1920s (not shown) pointing to a change in the timing of interannual surface salinity variability. The Ta’u coral δ18O series indicates that the relationship between El Niño events and more saline conditions in this central region of the SPCZ existed only back to 1927, when there was an abrupt change. Prior to 1927, the Ta’u coral δ18O record contains distinct evidence that on average fresher conditions occurred during El Niño events in Samoa/American Samoa (Fig. 3A and C). This is exactly the situation which occurs today north of Samoa between 7°S and 8°S near the island groups of Tokelau (8°S, 172°W) and Tavalu (7°S, 179°E) (see Fig. 4). Surface salinity is significantly lower during El Niño events in the region extending NW-SE including the Tavalu and Tokelau Island groups at 7-8°S. At the same time, surface salinity increases at Fiji, Tonga and Samoa (Fig. 4).
These observations indicate that the mean position of the SPCZ must have been shifted southwest of its current position during at least the ~50 year period prior to the late 1920s combined possibly with a reduced latitudinal migration to the northeast during El Niño. This reorganization would explain the fresher conditions during El Niño recorded in our Ta’u coral δ18O record in
Figure 2: (top): Sea surface temperature (SST) (NCEP) and sea surface salinity (SSS; Delcroix et al., 2011) for the grids containing Ta’u, American Samoa. (bottom): Ta’u coral δ18O from the Ta’u-1 Porites coral core and “pseudo-coral δ18O” calculated from SST and SSS. The very strong (VS) El Niño events of 1982/93 and 1997/98 are indicated by gray shading. During these events the SPCZ collapsed onto the equator (so-called zonal SPCZ events). Annual average δ18O and pseudo-coral δ18O, R = 0.77 (p<0.001). This correspondence demonstrates that coral δ18O at Samoa is accurately recording surface ocean conditions.

55 CLIVAR Exchanges No. 72, June 2017 Past Global Changes Magazine, Volume 25, No. 1
this period prior to 1927. This is the opposite response to the higher salinity conditions that occur during El Niño events at Ta’u beginning at ~ 1930. The abruptness of the shift in El Niño response in the late 1920s suggests a rapid reorganization of climate patterns in the South Pacific. Based on observational data in the Atlantic, the timing of this abrupt change in SPCZ position occurred during a phase change of the Atlantic Multidecadal Oscillation (AMO) when SST in the North Atlantic abruptly warmed
in the mid-1920a as the AMO changed from a negative to positive phase and the ITCZ in the Atlantic shifted north (e.g.; Knight et al., 2006; Zhang and Delworth, 2006; García-García and Ummenhofer 2015). If the SPCZ central axis also shifted north in the mid-1920s as our Ta’u coral δ18O indicates, this would point to a coordinated ITCZ change in both the Atlantic and Pacific basins. However, the AMO also changed phase in the late 1960s when our Ta’u results do not indicate a phase change between SPCZ
Figure 4: Monthly surface salinity from near Fiji, American Samoa, Tonga, and near Tokelau and Tavalu (north and northwest of Samoa respectively) (data from Delcroix et al., 2011). Note the strong freshening in the regions of the Tokelau and Tavalu Islands during El Niño (tan bars) when the SPCZ shifts northeast. Fiji and Tonga experience higher salinities during El Niño whereas Samoa surface salinity has a more intermediate response. Blue bars are La Niña events.
-1
-0.5
0
0.5
11800 1850 1900 1950 2000
Tau-1 d18O and FPM coral d18O (running correlation)
R va
lue
(25 m
onth
wind
ow)
Year
A
B
C
D
R= -0.61 R= 0.19
R= 0.54 R= -0.13
-1
-0.5
0
0.5
1
1800 1850 1900 1950 2000
R value (Tau-1 d18O vs Nino3.4 SST)(25 month window)
R va
lue
(25 m
onth
wind
ow)
Year
-0.4
-0.3
-0.2
-0.1
0
0.1
0.2
0.3
0.4 -2
-1
0
1
2
31800 1850 1900 1950 2000
Tau-1 coral δ18O, 24 month high pass filtered - trendNino3.4 SST 7 month running average
Tau-1
δ18O
24mo
-tren
d Nino3.4 SST (°C)
Year
Samoa cora δ18O and Nino3.4 SST
-1
-0.8
-0.6
-0.4
-0.2
0
0.2
0.4
-0.8
-0.6
-0.4
-0.2
0
0.2
0.4
0.6
1800 1850 1900 1950 2000
Tau-1 coral δ18O (24 month high pass filtered)
Fanning, Palmyra, Maiana (FPM) coral δ18O composite (7 month running average).
Tau-1
cora
l δ18
O (pe
r mil) FPM
coral δ 18O (per ml)
Samoa coral δ18O and Equatorial Pacific coral δ18O
Figure 3: Comparison of Ta’u (American Samoa) coral δ18O to: (A) Nino3.4 SST and (C) an equatorial Pacific composite coral δ18O record from Fanning, Palmyra and Maiana (FPM)(Linsley et al., 2015). Panels B and D show the 25 month running correlation between the series. Horizontal gray bars in B and D indicate average correlation (R value) across the interval. In panel A, arrows indicate El Niño events where it was distinctly cooler and saltier at Samoa. Note that on average after ~ 1927, warmer conditions in the Niño3.4 area (El Niño) occurred when it was cooler and saltier at Samoa. Before 1927, the opposite pattern is observed; fresher and warmer conditions at Samoa corresponded with El Niño conditions on the equator back to ~ 1872 AD (see panel B)
CLIVAR Exchanges No. 72, June 2017 56Past Global Changes Magazine, Volume 25, No. 1
variability and equatorial ENSO. The lack of a change in SPCZ-ENSO phasing in the late 1960s when the AMO shifted from a positive phase to a negative phase suggests that there was something climatically different in the late 1920s and/or that the SPCZ and ITCZ are not connected causally. The 1920’s were also a time when the PDO changed phase, although this phase change was gradual and appears to have started in the early 1920s. Other clues to significant tropical-subtropical re-organization in the late 1920s at the same time as the SPCZ and Atlantic ITCZ shifted north are a 1920s shift to weaker Pacific trade winds (Thompson et al., 2014). Further interpretation of these preliminary observations of SPCZ position change in the late 1920s will require future work.
ReferencesCai W., M. Lengaigne, S. Borlace, M. Collins, T. Cowan, M. J. McPhaden, A. Timmermann, S. Power, J. Brown, C. Menkes, A. Ngari, E. M. Vincent, M. J. Widlansky, 2012: More extreme swings of the SPCZ due to greenhouse warming, Nature, 488, 365–369, doi:10.1038/nature11358.
Chen, D. , T. Lian, C. Fu, M. A. Cane, Y. Tang, R. Murtugudde, X. Song, Q. Wu, L. Zhou, 2015: Strong influence of westerly wind bursts on El Niño diversity, Nature Geoscience, vol 8, May 2015, doi:10.1038/NGEO2399.
Cobb, K. M., N. Westpha, H.R. Sayani, J.T. Watson, E. Di Lorenzo, H. Cheng, R.L. Edwards, and C.D. Charles, 2013: Highly Variable El Niño-Southern Oscillation Throughout the Holocene, Science, 339, no. 6115, pp. 67-70,.doi:10.1126/science.1228246.
Delcroix, T., G. Alory, S. Cravatte, T. Correge, and M. J. McPhaden, 2011: A gridded sea surface salinity data set for the tropical Pacific with sample applications (1950–2008), Deep Sea Res., Part I, 58(1), 38–48, doi:10.1016/j.dsr.2010.11.002.
Evans. J.P. K. Bormann, J. Katzfey, S. Dean, R. Arritt, 2015: Regional climate model projections of the South Pacific Convergence Zone, Clim. Dynamics, DOI 10.1007/s00382-015-2873-x.
García-García, D., and C. C. Ummenhofer (2015), Multidecadal variability of the continental precipitation annual amplitude driven by AMO and ENSO, Geophys. Res. Lett., 42, 526–535, doi:10.1002/2014GL062451.
Gouriou Y, T. Delcroix, 2002: Seasonal and ENSO variations of sea surface salinity and temperature in the South Pacific Convergence Zone during 1976–2000. J Geophys Res Oceans 107(C12):8011. doi:10.1029/2001jc000830.Hasson, E.A., T. Delcroix, R. Dussin, 2013: An assessment of the mixed layer salinity budget in the tropical Pacific Ocean. Observations and modelling (1990–2009), Ocean Dynamics DOI 10.1007/s10236-013-0596-2.
Knight, J. R. C. K. Folland, J. A. Scaife, 2006: Climate impacts of the Atlantic multidecadal oscillation, Geophts. Res. Lett., vol 33, L17706, doi:10.1029/2006GL026242
Linsley, B. K., H. C. Wu, E. P. Dassié, and D. P. Schrag, 2015: Decadal changes in South Pacific sea surface temperatures and the relationship to the Pacific decadal oscillation and upper ocean heat content, Geophys. Res. Lett., 42, doi:10.1002/2015GL063045.
Linsley, B. K., H. C. Wu, T. Rixen, C. D. Charles, A. L. Gordon, M. D. Moore, 2017: SPCZ Zonal Events and Downstream Influence on Surface Ocean Conditions in the Indonesian Throughflow Region, Geophys. Res. Lett., 43, doi:10.1002/2016GL070985.
Newman, M., M.A. Alexander, T.R. Ault, K.M. Cobb, C. Deser, E. Di Lorenzo, N.J. Mantua, A.J. Miller, S. Minobe, H. Nakamura, N. Schneider, D.J. Vimont, A.S. Phillips, J.D. Scott, C.A. Smith, 2016: The Pacific decadal oscillation, revisited. J. Climate, vol. 29, 4399-4427, June 2016.
Salinger, M. J., B. B. Fitzharris, J. E. Hay, P. D. Jones, and J. P. Schmidely-Leleu, 1995: Climate trends in the south-west Pacific, Int. J. Climatol., 15, 285–302.
Thompson, D. M., J. E. Cole, G. T. Shen, A. W. Tudhope, G. M. Meehl, 2014: Early twentieth-century warming linked to tropical Pacific wind strength, Nature Geoscience, published online December 22, 2014, doi: 10.1038/Ngeo2321.
Trenberth, K. E. (1997) The Definition of El Niño. Bulletin of the American Meteorological Society, 78, 2771-2777.
Urban, F. E., J.E. Cole, J. T. Overpeck, 2000: Influence of mean climate change on climate variability from a 155-year tropical Pacific coral record, Nature, 407, 989-993.
Vincent, D., The South Pacific convergence zone (SPCZ): A review, 1994: Mon. Weather Rev., 122, 1949–1970.
Vincent, E. M., M. Lengaigne, C. E. Menkes, N. C. Jourdain, P. Marchesiello, and G. Madec 2009: Interannual variability of the South Pacific Convergence Zone and implications for tropical cyclone genesis, Clim. Dyn., 36(9-10), 1881–1896, doi:10.1007/s00382-009-0716-3.
Zhang, R., T. L. Delworth, 2006: Impact of Atlantic multidecadal oscillation on India/Sahel rainfall and Atlantic hurricanes, Geophys. Res. Lett., vol. 33, L17712, doi:10.1029/2006GL026267.