Embed Size (px)
Citation preview

About this Manual We’ve added this manual to the Agilent website in an effort to help you support your product. This manual is the best copy we could find; it may be incomplete or contain dated information. If we find a more recent copy in the future, we will add it to the Agilent website. Support for Your Product Agilent no longer sells or supports this product. Our service centers may be able to perform calibration if no repair parts are needed, but no other support from Agilent is available. You will find any other available product information on the Agilent Test & Measurement website, www.tm.agilent.com. HP References in this Manual This manual may contain references to HP or Hewlett-Packard. Please note that Hewlett-Packard's former test and measurement, semiconductor products and chemical analysis businesses are now part of Agilent Technologies. We have made no changes to this manual copy. In other documentation, to reduce potential confusion, the only change to product numbers and names has been in the company name prefix: where a product number/name was HP XXXX the current name/number is now Agilent XXXX. For example, model number HP8648A is now model number Agilent 8648A.
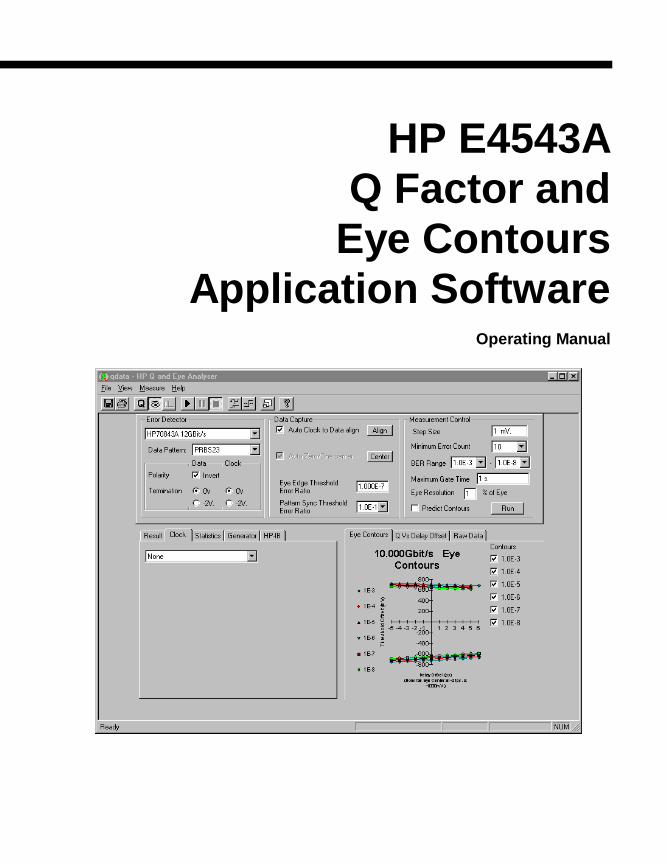
HP E4543AQ Factor and
Eye ContoursApplication Software
Operating Manual

Copyright Hewlett-Packard-Limited 1999
All rights Reserved.
Reproduction, adaption, or translation without prior written permissionis prohibited, except as allowed under copyright laws.
Publication number
E4543-90004
Printed in UK
NoticeThe information contained in this document is subject to changewithout notice.
Hewlett-Packard makes no warranty of any kind with regard tothis material, including, but not limited to, the implied warrantiesor merchantability and fitness for a particular purpose.
Hewlett-Packard shall not be liable for errors contained herein or forincidental damages in connection with the furnishing, performance, oruse of this material.
This manual was produced using Doc-To-Help®, by WexTechSystems, Inc.
Microsoft ® is the U.S. registered trademark of Microsoft Corporation
Lotus ® is the U.S. registered trademark of Lotus DevelopmentCorporation

Contents
About the HP E4543A Q Factor and Eye Contour Application Software 1Version Number ........................................................................................................................1Overview ...................................................................................................................................1
User Interface 3Introduction.................................................................................................................3
Menu Bar...................................................................................................................................3File: .............................................................................................................................3View:...........................................................................................................................4Measure:......................................................................................................................4Help:............................................................................................................................5
Tool bar .....................................................................................................................................5Status Bar ..................................................................................................................................6Application Window .................................................................................................................6
To Select/Setup the Error Detector .............................................................................6To Setup Data Capture ................................................................................................7To Setup Measurement Control ..................................................................................9To Setup the Generator .............................................................................................11To Setup the Clock....................................................................................................12To Setup HPIB Address............................................................................................13To View Results:.......................................................................................................14To View Statistics .....................................................................................................15To View Warnings ....................................................................................................16Graphic Measurement Results...................................................................................17
To Make a Measurement 19Introduction .............................................................................................................................19Q Factor Measurement Procedure ...........................................................................................19
Setup Procedure ........................................................................................................19Eye Contour Measurement ......................................................................................................23
Setup Procedure ........................................................................................................23
Installation 27Introduction ..............................................................................................................27
Equipment Required ...............................................................................................................27Supported Computer .................................................................................................27HPIB Interface..........................................................................................................27
To Install E4543A Q Factor and Eye Application Software ...................................................28Troubleshooting........................................................................................................28Support .....................................................................................................................28
Legal Information 29Warranty .................................................................................................................................29HP Software Product License Agreement ...............................................................................30
Reference 33Introduction.............................................................................................................................33Derivation of Q .......................................................................................................................33Measurements method.............................................................................................................37

E4543A Application Software About the HP E4543A Q Factor and Eye Contour Application Software • 1
About the HP E4543A Q Factor andEye Contour Application Software
Version NumberA.02.00
OverviewThe HP E4543A application software is designed to be used withHewlett-Packard’s HP 70843A/B and HP 70841B/70842B ErrorPerformance Analyzers to enable users to characterize high speed opticalcommunications links in terms of Q-factor and Eye Contour.
Measurement results can be displayed numerically or graphically, andalso stored on disk or printed as required.
Q Factor explainedQ factor measurement is a technique for rapidly evaluating the quality ofmodern high performance optical communications systems. The Q factormeasurement provides a single figure of merit related to the signal tonoise ratio of the system under test.
Eye Contour explainedEye Contour provides a graphical indication of the quality of themeasured signal by plotting the Eye Diagram for various BERthresholds.
ReferenceFor a detailed explanation of Q Factor measurement techniques refer toMargin Measurements in Optical Amplifier Systems. IEEE PhotonicsTechnology Letters Vol 5 number 3. N.S Bergano et al.

2 • About the HP E4543A Q Factor and Eye Contour Application Software E4543A Application Software

E4543A Application Software User Interface • 3
User Interface
IntroductionThe Menu Bar, Tool Bar and keys within the application window areused to select main parameters and configure/control measurements.Refer to the following sections for an explanation of each of the userinterfaces.
Menu Bar
There are four selections on the Menu Bar, File, View, Measure andHelp.
File:Select from: Save Data, Save Data As, Print Graph, Print Setup andExit App.
Save DataSave the raw measurement data in ASCII format to a file (defaultextension .txt). Saved data can be loaded into an application such asLotus 123 or Microsoft Excel and processed to provide graphs/plotsof measurement results. Note the ’,’ comma character is used as theseparator between the fields in the .txt file.
Save Data AsSave data in a new or different file from the one initially selected.
Print GraphEnables the Print dialog box where you can select the print functions.
Print SetupEnables the Print Setup Dialog Box, which allows the user to changethe Printer configuration. The detail may vary depending on the type ofPrinter configured on the PC.

4 • User Interface E4543A Application Software
Exit AppThis selection exits the application window
View:Select from Tool Bar, Status Bar and Zoom.
Tool BarSelect Tool Bar to display all the application icons below the Menu Bar.
Status BarSelect Status Bar to display current application status at the bottom ofthe application window.
ZoomSelect Zoom to enlarge the size of the graphs displayed in theapplication window.
Measure:Select from: Q Factor, Eye Contour, Burst Mode, Run, Pause, Stop,Align Clk/Data, Center 0/1 or Frequency Update.
Q FactorSelecting this field selects measurement of Q.
Eye ContourSelecting this field selects measurement of Eye Contours.
Burst Mode (HP 70843A/B only)
Select this mode when carrying out fibre optic loop tests.
RunStarts a new measurement or continues a paused one.
PausePauses the current measurement; selecting RUN will continue fromwhere paused.
StopStops the current measurement.
Align Clk/DataInitiates a clock to data alignment attempt using the current instrumentsettings.
Center 0/1Initiates a zero/one center operation using the current instrument settings

E4543A Application Software User Interface • 5
Frequency UpdateSelect this field to provide on the Results page a result of the measuredfrequency from the Error Detector.Deselect the Frequency Update field (no tick next to selection) if youwish to set the HSBER instrument to Local and view or change displays.
Help:
About Q & Eye:Use this key to view revision information for the E4543A Q Factor andEye Contour application software.
Tool bar
Selects the Save As function; enables the Raw Data to be saved inASCII format.
Prints the currently displayed graph. .
Selects measurement of Q.
Selects measurement of Eye Contours
Select Burst Mode Q measurement (HP 70843A/B only)
Starts a new measurement or continues a paused one
Pauses the current measurement; selecting RUN will continuefrom where paused
Stops the current measurement.
Performs a clock to data alignment attempt on the currentmeasurement data.
Performs a zero/one center operation on the current measurement
Zoom: Use this icon to enlarge the display of the graphs (e.g.BER Vs Threshold) in the application window.
Help: Use this key to obtain revision information for the HPE4543A Q Factor and Eye Contour application software.

6 • User Interface E4543A Application Software
Status BarStatus BarTo enable the status bar select VIEW then Status Bar.
The four fields on the status bar give information on the currentmeasurement.
Application WindowThe following text illustrates and explains the user selectable functionsand parameters within the HP E4543A Application window.
To Select/Setup the Error Detector
Select the Error Detector from the choices given. No other userselectable fields are enabled till you select an Error Detector. Initiallyvalues for all parameters are read from the Error Detector, and can bechanged as required.
Data Pattern:
Select from a choice of PRBS patterns of PRBS 7, 10, 15, 23 and 31 orselect an User Pattern from 0 to 12. User pattern 0 is the current userpattern. User patterns 1 to 4 are internal pattern stores in the instrument;patterns 5 to 12 are stored on disk.
Polarity:Select data from normal or inverted.
Termination:Click on the Termination buttons and set clock and data termination to-2V or 0V.
E4543A Application Software User Interface • 7
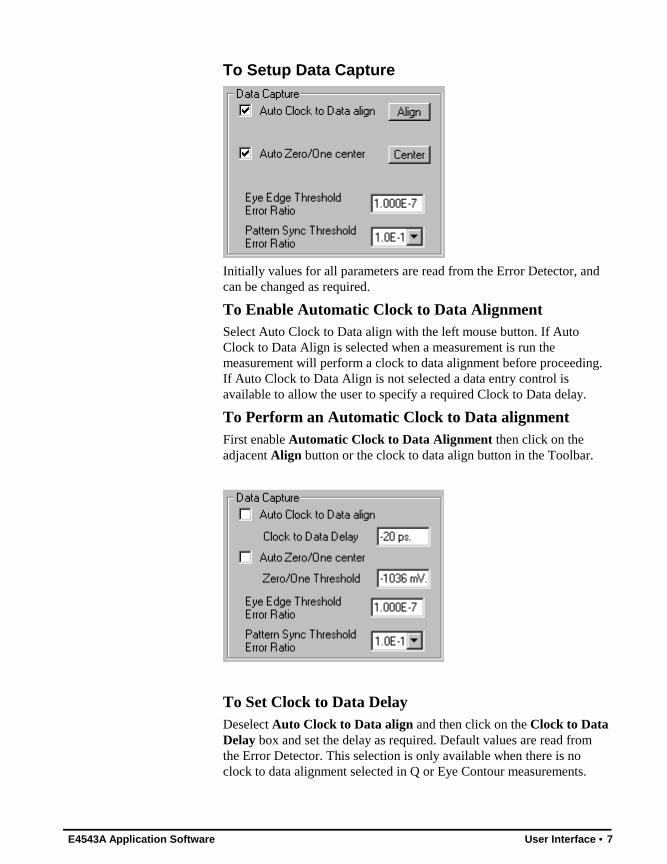
To Setup Data Capture
Initially values for all parameters are read from the Error Detector, andcan be changed as required.
To Enable Automatic Clock to Data AlignmentSelect Auto Clock to Data align with the left mouse button. If AutoClock to Data Align is selected when a measurement is run themeasurement will perform a clock to data alignment before proceeding.If Auto Clock to Data Align is not selected a data entry control isavailable to allow the user to specify a required Clock to Data delay.
To Perform an Automatic Clock to Data alignmentFirst enable Automatic Clock to Data Alignment then click on theadjacent Align button or the clock to data align button in the Toolbar.
To Set Clock to Data DelayDeselect Auto Clock to Data align and then click on the Clock to DataDelay box and set the delay as required. Default values are read fromthe Error Detector. This selection is only available when there is noclock to data alignment selected in Q or Eye Contour measurements.

8 • User Interface E4543A Application Software
To Enable Automatic Zero/One CenteringSelect Auto Zero/One Center with the left mouse button. If Automatic0/1 centering is selected when a measurement is run the measurementwill perform a Zero/One Center operation before proceeding, afterclock/data alignment is selected. If Automatic 0/1 Centering is notselected a data entry control is available to allow the user to specify adesired Zero/One center threshold.
To Perform the Zero/One Center
First enable Automatic 0/1 Centering then click on the adjacent Centerbutton or on the 0/1 center button in the Toolbar.
To Set the Zero/One CenterDeselect Auto Zero/One center and then click on the Zero/OneThreshold box and set the Threshold as required. The default values areread from the Error Detector. This selection is only available when thereis no Auto Zero/One center selected.
To Set Eye Edge Threshold Error RatioClick in the Eye Edge Threshold Error Ratio data entry control and enterthe eye edge threshold error ratio as required using the keys provided.
To Select Pattern Sync Threshold Error RatioClick in the Pattern Sync Threshold Error Ratio data entry control andenter the pattern sync threshold error ratio as required using the keysprovided.
To Select Burst Mode Duty Cycle
This function is only available when a Q measurement is selected, andthe Error Detector is an HP 70843A/B.Click on the Burst Mode icon or
E4543A Application Software User Interface • 9
select Burst Mode from the Measure menu, then click in the Duty Cycledata entry control and enter the measurement duty cycle as requiredusing the keys provided.
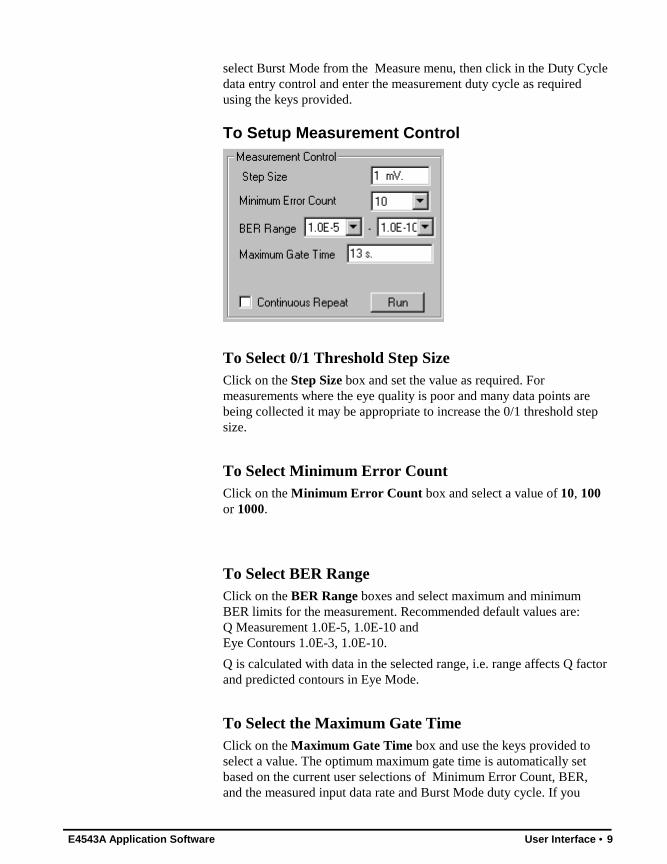
To Setup Measurement Control
To Select 0/1 Threshold Step SizeClick on the Step Size box and set the value as required. Formeasurements where the eye quality is poor and many data points arebeing collected it may be appropriate to increase the 0/1 threshold stepsize.
To Select Minimum Error CountClick on the Minimum Error Count box and select a value of 10, 100or 1000.
To Select BER RangeClick on the BER Range boxes and select maximum and minimumBER limits for the measurement. Recommended default values are:Q Measurement 1.0E-5, 1.0E-10 andEye Contours 1.0E-3, 1.0E-10.
Q is calculated with data in the selected range, i.e. range affects Q factorand predicted contours in Eye Mode.
To Select the Maximum Gate TimeClick on the Maximum Gate Time box and use the keys provided toselect a value. The optimum maximum gate time is automatically setbased on the current user selections of Minimum Error Count, BER,and the measured input data rate and Burst Mode duty cycle. If you

10 • User Interface E4543A Application Software
select a gate time of your own choice a warning may be displayed on thescreen if it is less than the calculated value.
To Select a Single or Continuous Repeat MeasurementClick on the Continuous Repeat box and select as required. If youselect Continuous Repeat (an [á] in the box) a new measurementbegins at the end of each measurement. Note that this function is onlyavailable in Q Factor application.When Continuous Repeat is selected the Q Vs Time and QPDF pagesbecome available.
To Select Eye Resolution
Click on the Eye Resolution box and select the required delay step sizeas a percentage of the bit period. Note this function is only available inthe Eye Contour application.
To Predict ContoursSelect [á] in the box to enable the Predict Contours function. Note thisfunction is only available in the Eye Contour application , and willattempt to calculate contours down to 1E-20.
Enabling Contours prediction will result in the display of contoursbeyond the measured range based on Q results calculated at each delay.If, for any reason a Q result is not calculated at a particular clock to datadelay then no predicted contours are displayed at that delay point.
To Initiate a Q or Eye MeasurementClick on RUN.
E4543A Application Software User Interface • 11
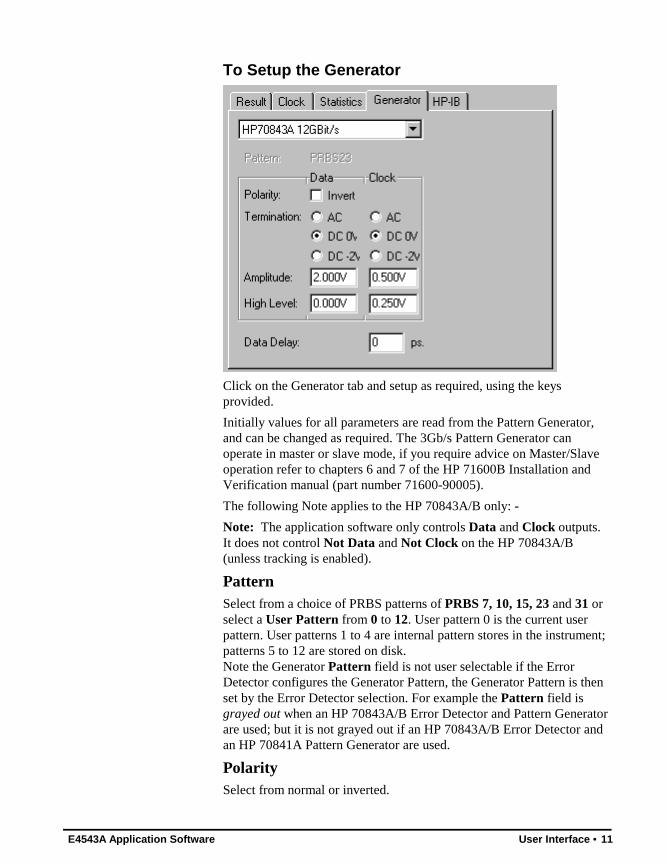
To Setup the Generator
Click on the Generator tab and setup as required, using the keysprovided.
Initially values for all parameters are read from the Pattern Generator,and can be changed as required. The 3Gb/s Pattern Generator canoperate in master or slave mode, if you require advice on Master/Slaveoperation refer to chapters 6 and 7 of the HP 71600B Installation andVerification manual (part number 71600-90005).
The following Note applies to the HP 70843A/B only: -
Note: The application software only controls Data and Clock outputs.It does not control Not Data and Not Clock on the HP 70843A/B(unless tracking is enabled).
PatternSelect from a choice of PRBS patterns of PRBS 7, 10, 15, 23 and 31 orselect a User Pattern from 0 to 12. User pattern 0 is the current userpattern. User patterns 1 to 4 are internal pattern stores in the instrument;patterns 5 to 12 are stored on disk.Note the Generator Pattern field is not user selectable if the ErrorDetector configures the Generator Pattern, the Generator Pattern is thenset by the Error Detector selection. For example the Pattern field isgrayed out when an HP 70843A/B Error Detector and Pattern Generatorare used; but it is not grayed out if an HP 70843A/B Error Detector andan HP 70841A Pattern Generator are used.
PolaritySelect from normal or inverted.

12 • User Interface E4543A Application Software
TerminationSet Data and Clock Termination to AC (HP 70843A/B only) or DC -2V / 0V.
AmplitudeClick on the appropriate data entry control and enter the Data andClock Amplitude to the required value using the keys provided.
High LevelClick on the appropriate data entry control and enter the Data andClock High Level to the required value using the keys provided
Data to Clock Delay
Set the generator data to clock delay by clicking on the Data to ClockDelay box and using the keys provided to select the required value.
To Setup the Clock
Click on the Clock tab and select the clock source using the keysprovided. If you require information on Master/Slave operation refer toyour Error Performance Analyzer Operating manual.
FrequencyClick on the frequency key and set the frequency as required.
Power (HP 70340A only)
Click on the Power key and set the power as required.
Warning: Do not set the power level greater than the maximum inputpower level of the HP 70843A/B (15dBm).
E4543A Application Software User Interface • 13
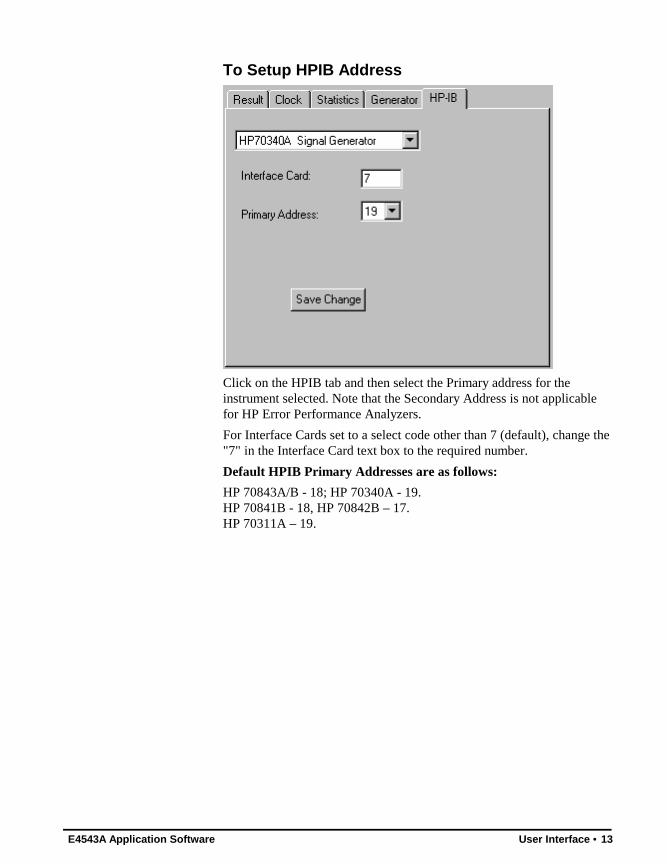
To Setup HPIB Address
Click on the HPIB tab and then select the Primary address for theinstrument selected. Note that the Secondary Address is not applicablefor HP Error Performance Analyzers.
For Interface Cards set to a select code other than 7 (default), change the"7" in the Interface Card text box to the required number.
Default HPIB Primary Addresses are as follows:
HP 70843A/B - 18; HP 70340A - 19.HP 70841B - 18, HP 70842B – 17.HP 70311A – 19.
14 • User Interface E4543A Application Software
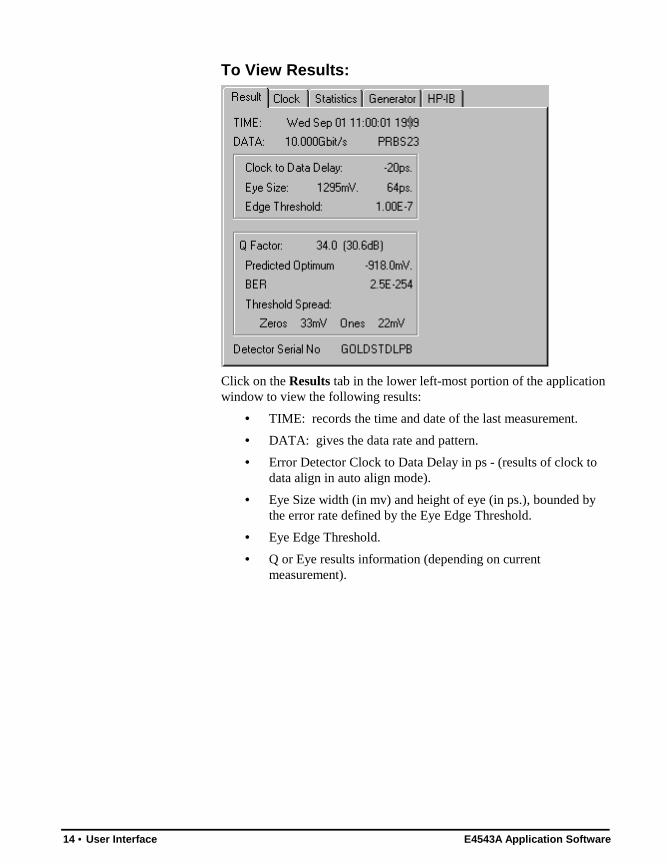
To View Results:
Click on the Results tab in the lower left-most portion of the applicationwindow to view the following results:
• TIME: records the time and date of the last measurement.
• DATA: gives the data rate and pattern.
• Error Detector Clock to Data Delay in ps - (results of clock todata align in auto align mode).
• Eye Size width (in mv) and height of eye (in ps.), bounded bythe error rate defined by the Eye Edge Threshold.
• Eye Edge Threshold.
• Q or Eye results information (depending on currentmeasurement).
E4543A Application Software User Interface • 15
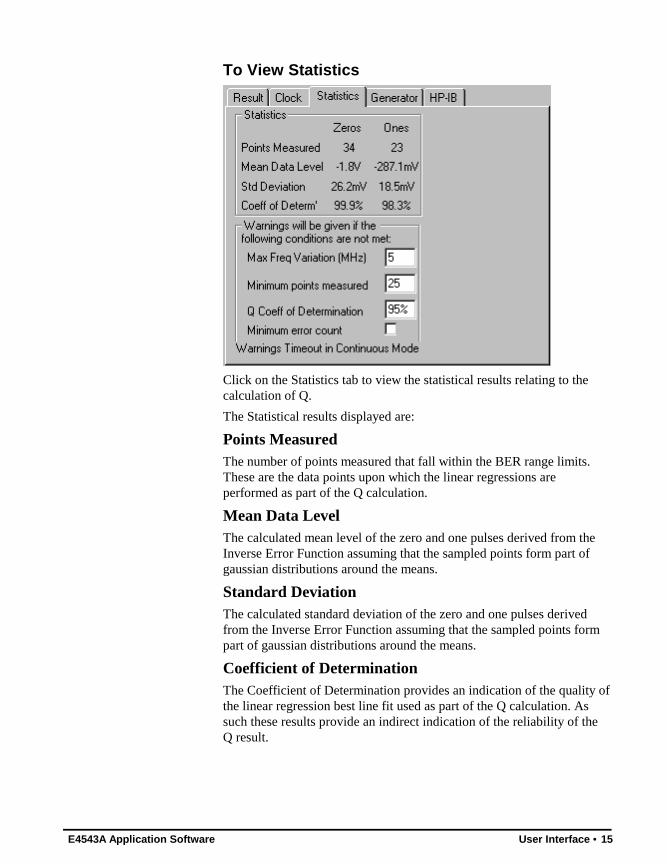
To View Statistics
Click on the Statistics tab to view the statistical results relating to thecalculation of Q.
The Statistical results displayed are:
Points MeasuredThe number of points measured that fall within the BER range limits.These are the data points upon which the linear regressions areperformed as part of the Q calculation.
Mean Data LevelThe calculated mean level of the zero and one pulses derived from theInverse Error Function assuming that the sampled points form part ofgaussian distributions around the means.
Standard DeviationThe calculated standard deviation of the zero and one pulses derivedfrom the Inverse Error Function assuming that the sampled points formpart of gaussian distributions around the means.
Coefficient of DeterminationThe Coefficient of Determination provides an indication of the quality ofthe linear regression best line fit used as part of the Q calculation. Assuch these results provide an indirect indication of the reliability of theQ result.

16 • User Interface E4543A Application Software
To View Warnings
Click on the Statistics tab to view the user selectable warnings.
Maximum Frequency Variation (MHz)This warning only applies to Continuous Q measurements and Eyemeasurements. The Maximum Frequency Variation setting is the amountby which the clock frequency is allowed to vary from its initial settingbefore a warning is displayed.
If the clock frequency varies by an amount greater than the valueselected (in the Maximum Frequency Variation field) the measurementis suspended and a warning is displayed. The warning offers the choiceof continuing with the measurement (click OK) or aborting (clickCANCEL).
If you select OK the measurement continues, however the results may beinaccurate.
If you select CANCEL; reset the clock source as required or change theMaximum Frequency Variation to a more suitable value before starting anew measurement.
Eye Edge Minimum points measuredThis facility provides a means of alerting the user if a Q calculationwould be based on too few measured points. In order for the Q factorcalculation to be valid sufficient points must be measured on each sideof the Zero/One center to allow the necessary linear regressioncalculation to be valid. The more points that are used the greater theconfidence in the calculated results.
A warning will be given if fewer than the given number of points aremeasured on either side of the Zero/One center.
E4543A Application Software User Interface • 17
If Continuous Repeat is selected this warning will time-out to allowrepetition to continue.
Q Coefficient of DeterminationThe Coefficient of Determination is a statistical indication of the validityof the linear regressions performed as part of the Q calculation. Thisfacility provides a means of alerting the user if a Q calculation would bebased on linear regression results with less than the requestedDetermination.
A warning will be given if the requested Coefficient of Determination isnot achieved for either side of the Zero/One center.
If Continuous Repeat is selected this warning will time-out to allowrepetition to continue.
Minimum Error Count not reached during gate timeIf you select this box a warning will be displayed on the screen if theMinimum Error Count value (selected in the Measurement Controlbox) is not achieved within the Maximum Gate Time (selected in theMeasurement Control box).
If Continuous Repeat is selected this warning will time-out to allowrepetition to continue.
Graphic Measurement ResultsGraphic Displays of the following statistical results are displayed:
Q Factor MeasurementWhen a Single Q measurement is performed displays of BER versusThreshold, Inverse Error Function versus Threshold and Raw Data areprovided.
When Continuous Repeat is selected for Q measurements, additionalgraphs for Q versus time and Q PDF displays are provided.
Eye Contour MeasurementGraphical displays of Eye Contours, Q Factor versus Delay and RawData are provided.

18 • User Interface E4543A Application Software
E4543A Application Software To Make a Measurement • 19
To Make a Measurement
IntroductionThe following procedure explains how to configure the HP E4543A QFactor and Eye Contour Application Software to perform Q factor andEye Contour measurements when using a HP Error PerformanceAnalyzer. It is recommended that you configure the measurements in theorder given.
Before running the application software ensure that the ErrorPerformance Analyzer has been powered up for at least 30 seconds andis functioning correctly.
Q Factor Measurement ProcedureThis procedure assumes the software is loaded correctly and the HPError Performance Analyzer and your PC are connected via an HPIBcable, and configured correctly.
Setup Procedure
Setup Clock Source1. Set your clock source to the desired frequency.
Setup Pattern Generator2. If your system includes a Pattern Generator click on the first
field within the Generator functional box and select a PatternGenerator from the choices given.
3. Setup the Pattern Generator Pattern, Polarity, Termination,Amplitude and High Level as required.
Setup Error Detector4. Click on the top field within the Error Detector functional
box and select an Error Detector from the choices given.
20 • To Make a Measurement E4543A Application Software
5. Select the Q Measure icon from the Tool Bar or selectMeasure, Q Factor from the Menu Bar.
6. Select a Data Pattern - the choices are PRBS of 7, 10, 15, 23or 31 or User Patterns 0 to 12. User pattern 0 is the current datapattern.
7. Select Data Polarity - choose from normal or inverted.
8. Select Data and Clock Termination - set to 0V or -2V.
Setup Data Capture9. The default setting for Auto Clock to Data Align and Auto
Zero/One center is ON (an [x] in the box), which is therecommended setting.If you wish to set your own clock to data delay or zero/onethreshold deselect the appropriate boxes (or if you are in BurstMode) and select the required values using the keys provided.
10. In Burst Mode select a duty cycle 100% to 0.01%. Note thisdoes not set the pulse generator but is used to determine themaximum gate time.
11. If you are not in Burst Mode select the required Eye EdgeThreshold Error Ratio.
12. If not in Burst Mode select the Pattern Sync Threshold, therange is 1.0E-1 to 1.0E-8.
On continuous run measurements it may be advisable toperform clock to data align and zero/one center operations first,and then deselect auto clock to data align and zero/one center,before running a measurement.
Setup Measurement Control13. Select the 0/1 Threshold Step Size. For long duration
measurements you may need to increase the step size to asuitable value.
14. Select the Minimum Error Count, the choices are 10, 100 or1000. This selection can determine the duration of themeasurement. If you select for example an error count of 100,then each data point is sampled until either 100 errors occur orthe maximum gating time is exceeded. The 10 selection is thefastest but the least accurate.
15. Select the BER Range from 1.0E-1 to 1.0E-12. Note: Set themaximum rate consistent with at least 1 error/tenth second is asfollows:At 3 Gb/s: 10 errors/second = 3.3E-9At 10 Gb/s 0.1% Burst = 1.0E-6.Recommended default setting is 1.0E-5 to 1.0E-10.

E4543A Application Software To Make a Measurement • 21
16. Maximum Gate Time - Before you select the Maximum GateTime please read the following note.Note: The optimum Maximum Gate Time is automatically setfor the user based on the current selections. This setting isdetermined by the following user selections: Minimum ErrorCount, BER Range, measured data rate (and the burst modeduty cycle). It is recommended therefore that you setup themeasurement in the order given. If you wish to select anotherGate Time use the keys provided. Warnings may be displayedon the screen if your choice is less than a preferred value.
17. Select a Single or Continuous measurement. If you selectContinuous then at the end of each measurement-gating period anew measurement begins.
StatisticsTo Set Maximum Frequency Variation
18. This warning only applies to Continuous Q measurements andEye measurements. The Maximum Frequency Variation settingis the amount by which the clock frequency is allowed to varyfrom its initial setting before a warning is displayed. Click onthe Max Freq Variation field and set as required.
If the clock frequency varies by an amount greater than thevalue selected (in the Maximum Frequency Variation field) themeasurement is suspended and a warning is displayed. Thewarning offers the choice of continuing with the measurement(click OK) or aborting (click CANCEL). Note the clockfrequency is checked at the beginning of each Q measurement.
If you select OK the measurement continues, however theresults may be inaccurate.
If you select CANCEL; reset the clock source as required orchange the Maximum Frequency Variation to a more suitablevalue before starting a new measurement.
To Set Eye Edge Points Measured Warning
19. This facility provides a means of alerting the user if a Qcalculation would be based on too few measured points. Inorder for the Q factor calculation to be valid sufficient pointsmust be measured on each side of the Zero/One center to allowthe necessary linear regression calculation to be valid. The morepoints that are used the greater the confidence in the calculatedresults.A warning will be given if less than the given number of pointsis measured on either side of the Zero/One center.

22 • To Make a Measurement E4543A Application Software
If Continuous Repeat is selected this warning will time-out toallow repetition to continue.
To Set Q Coefficient of Determination Warning
20. The Coefficient of Determination is a statistical indication ofthe validity of the linear regressions performed as part of the Qcalculation. This facility provides a means of alerting the user ifa Q calculation would be based on linear regression results withless than the requested Determination.A warning will be given if the requested Coefficient ofDetermination is not achieved for either side of the Zero/Onecenter.If Continuous Repeat is selected this warning will time-out toallow repetition to continue.
To Select Minimum Error Count Warning
21. User selectable to On [x] or OFF []. Set this field to ON [x] ifyou wish a warning displayed whenever the minimum errorcount is not reached within the maximum gate time.
To Start a New Measurement
22. Select Run to start a new measurement. As the measurementprogresses status messages are displayed in the Status Bar andthe graphs results are updated as data is measured.The measurement sequence is as follows:a. Perform Clock to Data Alignment (if Auto selected).b. Perform 0/1 Threshold center (if Auto selected).c. Search for Zero Edge on eye.d. Collect BER Vs Threshold at Zero edge over specified BERrange.e. Search for One edge.f. Collect BER Vs Threshold at One edge over specified BERrangeg. Perform Q calculation and display result.
Results23. Click on the Results tab to view results of Clock to Data delay,
0/1 Threshold center and eye width and height.Graphs are given of BER versus Threshold, Inverse ErrorFunction versus Threshold showing straight line fit and anumerical display of Raw Data is also available.When Continuous Repeat is selected in the MeasurementControl data entry box graphs of Q Vs Time and Q PDF arealso provided.In Continuous Repeat mode the results displayed are theresults from the last complete measurement.

E4543A Application Software To Make a Measurement • 23
At the end of the measurement the Results window also shows:Q factor (linear/dB).Optimum 0/1 thresholdResidual BER at optimum 0/1 thresholdThreshold spread (number of millivolts betweenmaximum/minimum specified BER).
24. Return to the Statistics window to get the following:The number of points measured for ones and zeros.The mean data levels.A calculation of the Std Deviations, and the Coefficients ofDetermination from the linear regression.
Eye Contour MeasurementThis procedure assumes the software is loaded correctly and the HPError Performance Analyzer and your PC are connected via an HPIBcable, and configured correctly.
Setup Procedure
Setup Clock Source1. Set your clock source to the desired frequency.
Setup Generator2. If your system includes a Pattern Generator click on the first
field within the Generator functional box and select a PatternGenerator from the choices given.
3. Setup the Pattern Generator Pattern, Polarity, Termination,Amplitude and High Level as required.
Setup Error Detector4. Click on the top field within the Error Detector functional box
and select an Error Detector from the choices given.
5. Select the Eye Contour icon from the Tool Bar or selectMeasure, Eye Contour from the Menu Bar
6. Select a Data Pattern - the choices are PRBS of 7, 10, 15, 23or 31 or User Patterns 0 to 12. User pattern 0 is the current datapattern.
7. Select Data Polarity.

24 • To Make a Measurement E4543A Application Software
8. Select Data and Clock Termination.
Setup Data Capture9. The default setting for Auto Clock to Data Align is ON (an [x]
in the box), which is the recommended setting. If you wish to set your own clock to data delay deselect theappropriate box and select the required values using the keysprovided.
10. Select the required Eye Edge Threshold Error Ratio.
11. Select Pattern Sync Threshold, the range is 1.0E-3 to 1.0E-8.
Setup Measurement Control12. Select the 0/1 Threshold Step Size. For long duration
measurements you may need to increase the step size to asuitable value.
13. Select the Minimum Error Count, the choices are 10, 100 or1000. This selection can determine the duration of themeasurement. If you select for example an error count of 100,then each data point is sampled until either 100 errors occur orthe maximum gating time is exceeded. The 10 selection is thefastest but least accurate.
14. Select the BER Range from 1.0E-1 to 1.0E-12. Therecommended default setting is 1.0E-3 to 1.0E-10.
15. Maximum Gate Time - Before you select the Maximum GateTime please read the following Note:Note: The optimum Maximum Gate Time is automatically setfor the user based on the current selections. This setting isdetermined by the following user selections: Minimum ErrorCount, BER Range and the measured data rate. It isrecommended therefore that you setup the measurement in theorder given. If you wish to select another Gate Time use thekeys provided. Warnings may be displayed on the screen if yourchoice is less than a preferred value.
16. Eye Resolution: Click on the Eye Resolution box and selectthe required delay step size.
17. Predict Contours:If you select Predict Contours the application will attempt topredict the eye contours down to a BER of 1.0E-20 at eachsample delay based on the Q calculation at that delay.
StatisticsTo Set Maximum Frequency Variation
18. This warning only applies to Continuous Q measurements andEye measurements. The Maximum Frequency Variation setting

E4543A Application Software To Make a Measurement • 25
is the amount by which the clock frequency is allowed to varyfrom its initial setting before a warning is displayed. Click onthe Max Freq Variation field and set as required.
If the clock frequency varies by an amount greater than thevalue selected (in the Maximum Frequency Variation field) themeasurement is suspended and a warning is displayed. Thewarning offers the choice of continuing with the measurement(click OK) or aborting (click CANCEL). The clock frequency ischecked at the start of each delay step.
If you select OK the measurement continues, however theresults may be inaccurate.
If you select CANCEL, reset the clock source as required orchange the Maximum Frequency Variation to a more suitablevalue before starting a new measurement.
To Set Eye Edge Points Measured Warning
19. This facility provides a means of alerting the user if a Qcalculation would be based on too few measured points. Inorder for the Q factor calculation to be valid sufficient pointsmust be measured on each side of the Zero/One center to allowthe necessary linear regression calculation to be valid. The morepoints that are used the greater the confidence in the calculatedresults.A warning will be given if less than the given number of pointsis measured on either side of the Zero/One center.If Continuous Repeat is selected this warning will time-out toallow repetition to continue.
To Set Q Coefficient of Determination Warning
20. The Coefficient of Determination is a statistical indication ofthe validity of the linear regressions performed as part of the Qcalculation. This facility provides a means of alerting the user ifa Q calculation would be based on linear regression results withless than the requested Determination.A warning will be given if the requested Coefficient ofDetermination is not achieved for either side of the Zero/Onecenter.
To Select Minimum Error Count Warning
21. User selectable to On [x] or OFF []. Set this field to ON [x] ifyou wish a warning displayed whenever the minimum errorcount is not reached within the maximum gate time.
To Start a New Measurement

26 • To Make a Measurement E4543A Application Software
22. Select Run to start a new measurement.As the measurement progresses status messages are displayed inthe Status Bar and the graphs results are updated as data ismeasured.The measurement sequence is as follows:a. Perform Clock to Data Alignment (if Auto selected).b. Perform 0/1 Threshold Center.c. Search for zero edge of eye.d. Collect BER Vs Threshold at zero edge.e. Search for One edge of eye.f. Collect BER Vs Threshold.g. Calculate Q - if valid Q calculated then plot the predictedcontours.h. Step clock to data delay by the size of the preset eyeresolution (e.g. 10%) and repeat from step c.
Results23. Click on the Results tab to view results of Clock to Data delay,
Eye Size, Eye Edge Threshold, and Nominal Eye Center.Graphs are given of Eye Contours, Q versus Delay and anumerical display of Raw Data is also provided.At each delay step the Results window also shows:Q factor (linear/dB).Optimum 0/1 threshold.Residual BER at optimum 0/1 threshold.Threshold spread (number of millivolts betweenmaximum/minimum specified BER).
24. Return to the Statistics window to get the following:
The number of points measured for ones and zeros.The mean data levels.A calculation of the Std Deviations, and the Coefficients ofDetermination from the linear regression.

E4543A Application Software Installation • 27
Installation
IntroductionThis chapter provides information on the equipment required to run theE4543A Q Factor and Eye Contour Application Software and how toinstall it. Simple troubleshooting is also given to aid the user should theapplication fail to operate correctly and advice on where to obtainadditional support.
Equipment RequiredHP Error Performance Analyzer
To enable back to back operation a Pattern Generator is required.
Supported ComputerThe E4543A Q Factor and Eye Contours Application Software isdesigned to run on IBM-PC/AT, or 100% compatible, PC or Laptoprunning Microsoft Windows 95 or Microsoft Windows NT.
The recommended and supported PC options are:
HP 100MHz Pentium PC with at least 8 Mbytes of memory and aHP 82335B interface, or HP 82341C. Note that the E4543A softwarecannot be used with the HP 82341D interface.
The E4543A application software is supplied on two 3.5in floppy disks.
HPIB InterfaceControl of the HP Error Performance Analyzer from the computer is viathe IEEE.488 interface (HPIB).
The HP standard Instrument Control Library (SICL) is used as theinterface between the application software and the HPIB hardware.
Note: HP SICL does not form part of the E4543A product and must beinstalled separately before the application can run.
The recommended interface is the HP 82341C with HP E2094G I/Olibraries.
28 • Installation E4543A Application Software
The HP E4543A is a 16-bit application and requires 16-bit SICL driversto be installed.
To Install E4543A Q Factor and Eye Application Software1. Ensure an HPIB card is installed in your PC and is configured
correctly.
2. Connect a suitable cable from the HP Error PerformanceAnalyzer rear panel HPIB port to the HPIB port on your PC.
3. Run the File Manager.
4. Insert disk 1 into the "A" floppy disk drive.
5. In File Manager select drive "A".
6. Select and run file "setup.exe".
7. Follow the installation instructions that appear on your screenafter installation.
8. To run the software click on the Q & Eye Analyzer under theWindows Start/Programs menu.
9. To run the help file click on the Q & Eye Help icon under theWindows Start/Programs menu.
TroubleshootingIf the E4543A application software is not operating properly or not at all,carry out the following procedure:
1. Check that the HP Error Performance Analyzer is powered upcorrectly.
2. Check that the HP Error Performance Analyzer and the PCHPIB ports are cabled together
3. Check that the HPIB card installed in your PC is configuredcorrectly. Use the I/O Config Utility in the HP SICL programgroup.
4. Ensure the HPIB address of each element in your system is setcorrectly.
SupportIf you need any further help, please contact your nearest Hewlett-Packard service center or fax details to the Hewlett Packard ProductSupport department:
+44 131 331 7488.
E4543A Application Software Legal Information • 29
Legal Information
WarrantySoftware: HP warrants for a period of 90 days from the date of purchasethat the software product will execute its programming instructions whenproperly installed on the personal computer or workstation indicated onthis package. HP does not warrant that the operation of the software willbe uninterrupted or error free. In the event that this software product failsto execute its programming instructions during the warranty period, Cus-tomer’s remedy shall be to return the diskette(s) or tape cartridge(s)(“media”) to HP for replacement. Should HP be unable to replace themedia within a reasonable amount of time, Customer’s alternate remedyshall be a refund of the purchase price upon return of the product and allcopies.
Media: HP warrants the media upon which this product is recorded to befree from defects in materials and workmanship under normal use for aperiod of 90 days from the date of purchase. In the event any mediaprove to be defective during warranty period, Customer’s remedy shallbe to return the media to HP for replacement. Should HP be unable toreplace the media within a reasonable amount of time, Customer’salternate remedy shall be a refund of the purchase price upon return ofthe product and all copies.
Notice of Warranty Claims: Customer must notify HP in writing of anywarranty claim not later than thirty (30) days after the expiration of thewarranty period.
Limitation of Warranty: HP makes no other express warranty, whetherwritten or oral, with respect to this product. Any implied warranty ofmerchantability or fitness is limited to the 90-day duration of this writtenwarranty. Some states or provinces do not allow limitations on how longan implied warranty lasts, so the above limitation or exclusion may notapply. *
This warranty gives specific legal rights, and you may also have otherrights that vary from state to state, or province to province.
Exclusive Remedies: The remedies provided above are Customer’s soleand exclusive remedies. In no event shall HP be liable for any direct,indirect, special, incidental, or consequential damages (including lost
30 • Legal Information E4543A Application Software
profit) whether based on warranty, contract, tort, or any other legaltheory. Some states or provinces do not allow the exclusion or limitationof incidental or consequential damages, so the above limitation orexclusion may not apply to you.
Warranty Service: Warranty service may be obtained from the nearestHP sales office or other location indicated in the owner’s manual orservice booklet.
* UK only: if you are a “customer” as defined by statutes, parts of thisstatement may not apply to you.
HP Software Product License AgreementImportant: Please carefully read this license Agreement before openingthe media envelope or operating the equipment. Rights in the softwareare offered only on the condition that the Customer agrees to all termsand conditions of the License Agreement. Opening the media envelopeor operating the equipment indicates your acceptance of these terms andconditions. If you do not agree to the License Agreement, you may returnthe unopened package for a full refund.
License Agreement
In return for payment of the applicable fee, HP grants the Customer alicense in the software, until terminated, subject to the following:
Use
Customer may use the software on any one computer.
Customer may not reverse assemble or decompile the software.
Copies and Adaptations
Customer may make copies or adaptations of the software:
For archival purposes, or
When copying or adaptation is an essential step in the use of the softwarewith a computer so long as the copies and adaptations are used in noother manner.
Customer has no rights to copy unless they acquire an appropriate licenseto reproduce which is available from HP for some software.
Customer agrees that no warranty, free installation, or free training isprovided by HP for any copies or adaptations made by Customer.
All copies and adaptations of the software must bear the copyrightnotice(s) contained in or on the original.
Ownership
Customer agrees that they do not have any title or ownership of thesoftware, other than ownership of the physical media.
Customer acknowledges and agrees that the software is copyrighted andprotected under the copyright laws.

E4543A Application Software Legal Information • 31
Customer acknowledges and agrees that the software may have beendeveloped by a third party software supplier named in the copyrightnotice(s) included with the software, who shall be authorized to holdCustomer responsible for any copyright infringement or violation of thisLicense Agreement.
Transfer of Rights in Software
Customer may transfer rights in the software to a third party only as partof the transfer of all their rights and only if Customer obtains the prioragreement of the third party to be bound by the terms of the LicenseAgreement.
Upon such transfer, Customer agrees that the rights in the software areterminated and that they will either destroy their copies and adaptationsor deliver them to the third party.
Transfer to a U.S. government department or agency or to a prime orlower tier contractor in connection with U.S. government contract shallbe made only upon their prior written agreement to terms required byHP.
Sublicensing and Distribution
Customer may not sublicense the software or distribute copies oradaptations of the software to the public in physical media or bytelecommunication without the prior written consent of HP.

32 • Legal Information E4543A Application Software
E4543A Application Software Reference • 33
Reference
IntroductionThe following text gives an explanation of Q factor measurement techniques.
What is Q-factor?
The Q-factor is a figure of merit used to describe the signal-to-noise ratio of optically amplifiedtransmission systems. The Q-factor is rapidly being adopted as a figure of merit for optically amplifiedcommunications systems because it provides an estimate of the signal-to-noise ratio at the receiver’sdecision circuit.
Derivation of Q
Quantitatively, the system performance is characterized by the bit error ratio (BER). This is theprobability that a data pulse is interpreted incorrectly (i.e. a pulse signifying a ’1’ being detected as a ’0’and vice versa). This may be understood with reference to figure 1a, which shows a portion of a typicalfluctuating signal received by decision circuit, sampled at decision instant td. Figure 1b shows theprobability density functions associated with the two logical states. The width of the distributions forthe two logical states is determined by the source characteristics and the transmission impairments.Some of the causes of transmission impairments include amplified spontaneous emission (ASE), fiberchromatic dispersion, polarization mode dispersion, fiber non-linearity and noise in the receiver.
The sampled value, v, fluctuates from bit to bit around an average value µ 1 or µ 0, depending on
whether the received bit corresponds to a ’1’ or ’0’ respectively. The decision circuit compares thesampled value with a threshold value vd, set somewhere between the two states. The decision circuitassigns a ’1’ if v > vd or a ’0’ if v < vd.
An error occurs due to signal degradation if v < vd for a ‘1’ or if v > vd for a '0'. The BER isdetermined as the sum of the areas under the tails of the probability density functions that appear onthe wrong side of the decision threshold value vd [shaded area in figure 1b]. The error probability orBER is:
BER = p (1) P(0/1) + p(0) P(1/0) (1)

34 • Reference E4543A Application Software
Where p(1) and p(0) are the probabilities of receiving ’1’ and ’0’ respectively. P(0/1) is the probabilityof deciding ’0’ when ’1’ is received, and P(1/0) is the probability of deciding ’1’ when ’0’ is received.Typical live signal traffic in a communications channel can be approximated by a pseudo random bitsequence (PRBS), where a ’1’ or ’0’ are equally likely to occur therefore p(1) ≈ p(0) = 1/2. The BERcan therefore be simplified to:
BER = 1/2[ P(0/1) + P(1/0) ] (2)
Figure 1b illustrates P(0/1) and P(1/0) the probability density functions for a PRBS signal. These areapproximately Gaussian, centered at the average signal levels µ 1 and µ 0. The shaded region, where
the distributions overlap, shows the probability of incorrect identification when µ 1 falls below vd, or
µ 0 exceeds vd.
Figure 1. Typical signal appearing at the receiver decision circuit.
The probability density functions of µ 0 and µ 1 depend on the statistics of the noise sources
responsible for variations in the received bits. A common approximation is to consider them asGaussian probability density functions. As the mean and variance are, in general, different for a ’1’ anda ’0’, we define the corresponding variances as σ 1 and σ 0 respectively. For a Gaussian probabilitydensity function, the probabilities are:
P(0/1) = 1
2 21
12
12
1
1σ πµ
σµ µ
σexp[
( )] ( )
vd erfc
vd d− = −∫ (3)
P(1/0) = 1
2 20
2
02
0
0σ πµ
σµ µ
σexp[
( )] ( )
−= −
∫v
d erfcvd d (4)
E4543A Application Software Reference • 35
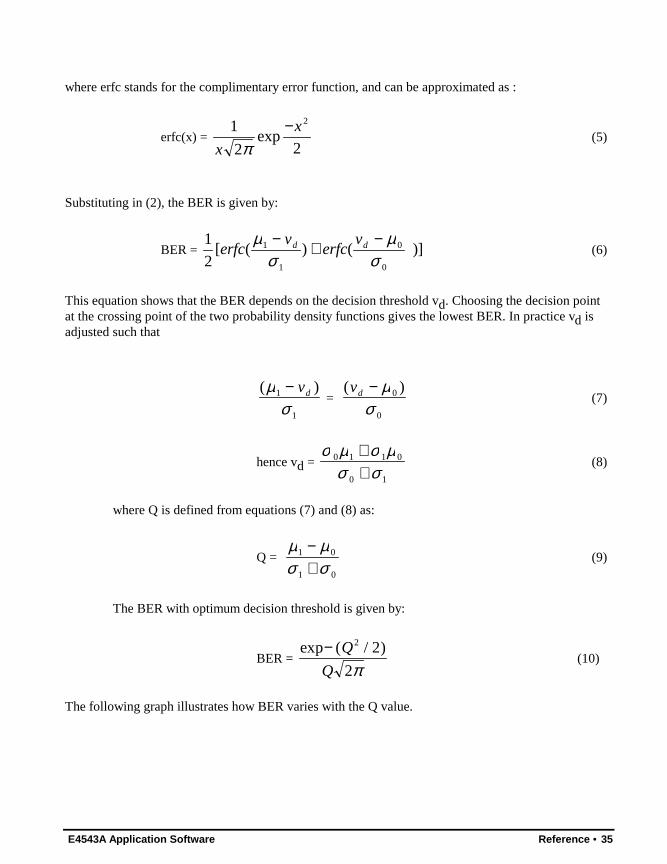
where erfc stands for the complimentary error function, and can be approximated as :
erfc(x) = 1
2 2
2
x
x
πexp
−(5)
Substituting in (2), the BER is given by:
BER = 1
21
1
0
0
[ ( ) ( )]erfcv
erfcvd dµ
σµ
σ− + −
(6)
This equation shows that the BER depends on the decision threshold vd. Choosing the decision pointat the crossing point of the two probability density functions gives the lowest BER. In practice vd isadjusted such that
( )µσ
1
1
− vd = ( )vd − µ
σ0
0
(7)
hence vd = σ µ σ µ
σ σ0 1 1 0
0 1
++
(8)
where Q is defined from equations (7) and (8) as:
Q = µ µσ σ
1 0
1 0
−+
(9)
The BER with optimum decision threshold is given by:
BER = exp ( / )− Q
Q
2 2
2π (10)
The following graph illustrates how BER varies with the Q value.

36 • Reference E4543A Application Software
1.0E -16
1.0E -14
1.0E -12
1.0E -10
1.0E -08
1.0E -06
1.0E -04
1.0E -02
1.0E+00
0Q value
bit e
rror
rat
io
0 1 2 3 4 5 6 7 8
Data A
BE R vers us Q
Figure 2: bit error ratio versus Q-factor

E4543A Application Software Reference • 37
Measurements method
Pattern generatorGenerator
DUT
Data
(Transmission system)
Clock
Data Clock
Error detector
Computer
Clock recovery
circuit
Figure 3 Block Diagram of variable decision threshold technique
The Q-factor is calculated from recorded data of BER versus decision level through the center of thedata signal eye (ref. figure 4). The equivalent mean and variance of the 1’s and 0's are determined byfitting this data to a Gaussian characteristic as per equation 6.
10 to 10 BER is used
Typically only data in the range-11 -4
for Q measurement
samples taken here
Figure 4: Data eye diagram indicating that the actual data is obtained from the tail of the Gaussiandistributions
Because the probability density functions are not Gaussian, this technique implies that the calculatedmeans and variances do not correlate exactly with the physical values that are to be found in the eyediagram, as in figure 1. They have, however, been shown1 to be realistic values when used to predictthe Q value.
The data for the '1s' and '0s' are separated into two sets separated by the point of minimum error ratiofor measurable BERs, or by a decision level that yields error free performance. The Q-factor isdetermined from both sets of data.

38 • Reference E4543A Application Software
The 0/1-threshold level (i.e. decision level) of an error performance analyzer is approximately set tothe mean data ’1’ level, and the BER measured. The 0/1-threshold level is decreased by a small amountand the BER measured again. This process is repeated many times until a set of BER versus 0/1threshold levels has been recorded ( typically 10-4 < BER < 10-11). When measuring the Q-factor, itis normal to extend the measurement range beyond the range of values that will be used in the Qcalculations to ensure that the data is not tailing off, as such a response may indicate a BER floor. Notethat the 0/1-threshold level step size used provides a trade-off between the time taken to perform themeasurement and the accuracy of the resulting Q value. For high Q systems the BER decreases quicklyas the 0/1-threshold level tends towards the center of the eye therefore the step size employed shouldbe small.
The 0/1-threshold level of the error performance analyzer is then approximately set to the mean data ’0’level, and the BER measured. The 0/1-threshold level is increased by a small amount and the BERmeasured again. This process is repeated until a set of BER versus 0/1 threshold levels has beenrecorded (typically 10-4< BER < 10-11).
The inverse error function is computed for each BER using the following approximation:
[log( (. ))] ( ) . . .1
21192 0 6681 0 01621 2erfc x x x− ≈ − − where x is log(BER) (11)
After evaluating the inverse error function, the data is plotted against the 0/1 threshold (i.e. decision)level, vd. Each set of data should approximate to a straight line. A straight line is fitted to each set ofdata by linear regression . The equivalent variance and mean for the Q calculation are given by theslope and intercept.
Q is then calculated using equation (9).
References
1. N. S. Bergano, F. W. Kerfoot and C. R. Davidson, "Margin Measurements in Optical AmplifierSystems", IEEE Technology Letters, Vol. 5, No. 3, March 1993.
2. D. Marcuse, "Derivation of analytical expressions for the bit-error probability in lightwave systemswith optical amplifiers", Journal of Lightwave Technology, Vol. 8, Dec 1990.
3. V.J. Mazurczyk, D.G. Duff, "Effect of intersymbol interference on signal-to-noise measurements",OFC ’95 Technical Digest, vol. 8.
4. J.C Feggler et al, “WDM Transmission Measurements on an Installed OpticalUndersea Cable System”, Optical Fiber Conference, paper TuN3, San Jose, CA, Feb 27, 1996.


![Agilent Technologies N5161A/62A/81A/82A/83A MXG Signal ...literature.cdn.keysight.com/litweb/pdf/N5180-90004.pdf · Contents vi Agilent N5161A/62A/81A/82A/83A SCPI Command Reference:MARKer[0,1,2,3,4,5,6,7,8,9,10,11,12,13,14,15,16,17,18,19]:FREQuency](https://img.dokumen.tips/doc/110x75/60175464f4f7d147d01bdb0d/agilent-technologies-n5161a62a81a82a83a-mxg-signal-contents-vi-agilent-n5161a62a81a82a83a.jpg)