Embed Size (px)
Citation preview
ABOUT MONTHLY AND QUARTERLY DATA
Click on table of contents to be taken to your section of interest.
CONTENTS
About Monthly and Quarterly Data ............................................................................................... 8 1. Frequently Asked Questions ..................................................................................................... 8 How often do you update the data? .............................................................................................. 8 Why is data often revised? ........................................................................................................... 9 Why are some datasets only available quarterly? ........................................................................ 9 What does seasonally adjusted mean? ........................................................................................ 9 Should I choose seasonally adjusted or non-seasonally adjusted? .............................................. 9 Not all of the data I select is displayed. Why? .............................................................................. 9 How do you forecast the data? ..................................................................................................... 9
2. Methodology ........................................................................................................................... 10 3. Definitions & Sources ............................................................................................................. 11 Agricultural Raw Materials Index ................................................................................................ 11 Almond Price .............................................................................................................................. 11 Aluminium Price ......................................................................................................................... 11 Apple Price ................................................................................................................................. 11 Banana Price .............................................................................................................................. 11 Bank Nonperforming Loans to Total Gross Loans ...................................................................... 12 Barley Price ................................................................................................................................ 12 Beef Price ................................................................................................................................... 12 Beverages Index ........................................................................................................................ 12 Business Confidence Index ........................................................................................................ 12 Capital to Assets ........................................................................................................................ 13 Cardamom Price ........................................................................................................................ 13 Central Bank Policy Rate............................................................................................................ 13 Chicken Price ............................................................................................................................. 13 Coal Price ................................................................................................................................... 14 Cocoa Price ................................................................................................................................ 14 Coconut Oil Price ....................................................................................................................... 14 Coffee Price ................................................................................................................................ 14 Commodity Fuel (Energy) Index ................................................................................................. 14 Consumer Confidence Index ...................................................................................................... 15 Copper Price .............................................................................................................................. 15 Coriander Price .......................................................................................................................... 15 Corn Price .................................................................................................................................. 15 Cotton Price ................................................................................................................................ 15 Crude Oil (Europe Brent) Spot Price .......................................................................................... 16 Crude Oil (WTI Cushing) Spot Price ........................................................................................... 16
Cumin Price ................................................................................................................................ 16 Current Account Balance............................................................................................................ 16 Customer Deposits to Total Non-Interbank Loans ...................................................................... 17 Employed/Unemployed/Economically Active Population ............................................................ 17 Exchange Rates Against US Dollar ............................................................................................ 17 Export Price Index ...................................................................................................................... 18 Exports ....................................................................................................................................... 18 Exports of Goods and Services .................................................................................................. 18 Food Index ................................................................................................................................. 18 Foreign Currency Denominated Loans to Total Loans ............................................................... 18 Foreign Exchange Reserves ...................................................................................................... 19 GDP ........................................................................................................................................... 19 Gold Price ................................................................................................................................... 19 Government Expenditure............................................................................................................ 19 Government Final Consumption Expenditure ............................................................................. 20 Government Net Lending/Borrowing .......................................................................................... 20 Government Revenue ................................................................................................................ 20 Grapefruit Price .......................................................................................................................... 20 Gross Fixed Capital Formation ................................................................................................... 20 Gross Loans to Nonfinancial Corporations ................................................................................. 21 Hard Logs Price .......................................................................................................................... 21 Hard Sawnwood Price ................................................................................................................ 21 House Price Index ...................................................................................................................... 21 House Price to Income Ratio ...................................................................................................... 22 House Price to Rent Ratio .......................................................................................................... 22 House Rent Price Index.............................................................................................................. 22 Household Debt .......................................................................................................................... 22 Housing Completions ................................................................................................................. 22 Housing Permits ......................................................................................................................... 23 Import Price Index ...................................................................................................................... 23 Imports ....................................................................................................................................... 23 Imports of Goods and Services .................................................................................................. 23 Increases in Stocks .................................................................................................................... 24 Index of Consumer Prices .......................................................................................................... 24 Industrial Production Index ......................................................................................................... 24 Inflation ....................................................................................................................................... 25 International Reserves................................................................................................................ 25 Iron Ore Price ............................................................................................................................. 25 Lamb Price ................................................................................................................................. 25 Lead Price .................................................................................................................................. 25 Lemon Price ............................................................................................................................... 26 Lime Price .................................................................................................................................. 26 Long-Term Interest Rates........................................................................................................... 26 Market Capitalisation .................................................................................................................. 26 Mean Maximum Temperature .................................................................................................... 26 Mean Minimum Temperature ..................................................................................................... 27 Mean Temperature ..................................................................................................................... 27

Metals Index ............................................................................................................................... 27 Milk Price, European Union ........................................................................................................ 27 Milk Price, New Zealand ............................................................................................................. 27 Milk Price, USA .......................................................................................................................... 28 Money Supply ............................................................................................................................. 28 Natural Gas Price, Europe .......................................................................................................... 28 Natural Gas Price, Japan ........................................................................................................... 28 Natural Gas Price, USA .............................................................................................................. 28 Nickel Price ................................................................................................................................ 29 Non-Residential Building Completions ....................................................................................... 29 Non-Residential Building Permits ............................................................................................... 29 Number of Job Vacancies .......................................................................................................... 29 Orange Juice Price ..................................................................................................................... 30 Orange Price .............................................................................................................................. 30 Overnight Interbank Rate ........................................................................................................... 30 Palm Oil Price ............................................................................................................................. 30 Peanut Price ............................................................................................................................... 30 Pepper Price ............................................................................................................................... 31 Pork Price ................................................................................................................................... 31 Private Final Consumption Expenditure ..................................................................................... 31 Producer Price Index, Manufacturing ......................................................................................... 31 Pulp Price ................................................................................................................................... 31 Real GDP Growth ....................................................................................................................... 32 Red Chili Price ............................................................................................................................ 32 Regulatory Tier 1 Capital to Risk-Weighted Assets .................................................................... 32 Residential Real Estate Loans to Total Loans ............................................................................ 32 Retail Sales Index ...................................................................................................................... 32 Rice Price ................................................................................................................................... 33 Rubber Price .............................................................................................................................. 33 Salmon Price .............................................................................................................................. 33 Silver Price ................................................................................................................................. 33 Soft Logs Price ........................................................................................................................... 33 Soft Sawnwood Price ................................................................................................................. 34 Soybeans Price .......................................................................................................................... 34 Steel Price, China ....................................................................................................................... 34 Steel Price, USA ......................................................................................................................... 34 Steel Price, Western Europe ...................................................................................................... 34 Stock Market Index ..................................................................................................................... 35 Strawberry Price ......................................................................................................................... 35 Sugar Price, European Union ..................................................................................................... 35 Sugar Price, USA ....................................................................................................................... 35 Sugar Price, World ..................................................................................................................... 35 Tea Price .................................................................................................................................... 36 Tin Price ..................................................................................................................................... 36 Tobacco Price ............................................................................................................................ 36 Total Gross Loans ...................................................................................................................... 36 Total Precipitation ....................................................................................................................... 36

Trade Balance ............................................................................................................................ 37 Turmeric Price ............................................................................................................................ 37 Unemployment Rate ................................................................................................................... 37 Unit Labour Cost Index ............................................................................................................... 37 Usual/Actual Weekly Working Hours .......................................................................................... 38 Wage per Hour ........................................................................................................................... 38 Wheat Price ................................................................................................................................ 38 Wool Price .................................................................................................................................. 38 Zinc Price ................................................................................................................................... 39 Seasonal Adjustment ................................................................................................................. 39 Point Increase ............................................................................................................................ 39 Growth Rates ............................................................................................................................. 39
4. Forecasting Methodology ....................................................................................................... 40 I. Euromonitor Macro Model ....................................................................................................... 40 II. Vector Error Correction Model ................................................................................................ 41 III. ARIMA Models ...................................................................................................................... 41
Data pre-processing ............................................................................................................... 41 Model selection ....................................................................................................................... 42 Forecast validation.................................................................................................................. 42 Data post-processing .............................................................................................................. 43
IV. Commodity Forecasts ........................................................................................................... 43
Some specific economic ideas applied in the model............................................................... 43 Basic modelling framework ..................................................................................................... 43 Outcomes of model solution ................................................................................................... 44
5. Business Confidence Indices: Methodology & Sources .......................................................... 45 Australia ..................................................................................................................................... 45 Austria ........................................................................................................................................ 45 Belgium ...................................................................................................................................... 46 Brazil .......................................................................................................................................... 47 Bulgaria ...................................................................................................................................... 48 Canada ....................................................................................................................................... 49 Chile ........................................................................................................................................... 49 China .......................................................................................................................................... 50 Colombia .................................................................................................................................... 51 Costa Rica .................................................................................................................................. 51 Croatia ........................................................................................................................................ 52 Czech Republic .......................................................................................................................... 53 Denmark ..................................................................................................................................... 53 Ecuador ...................................................................................................................................... 54 Estonia ....................................................................................................................................... 55 Finland........................................................................................................................................ 56 France ........................................................................................................................................ 57 Georgia....................................................................................................................................... 58 Germany ..................................................................................................................................... 58 Greece........................................................................................................................................ 59 Hong Kong, China ...................................................................................................................... 60

Hungary ...................................................................................................................................... 61 India ........................................................................................................................................... 62 Indonesia .................................................................................................................................... 63 Ireland ........................................................................................................................................ 63 Israel........................................................................................................................................... 64 Italy ............................................................................................................................................. 64 Japan.......................................................................................................................................... 65 Latvia .......................................................................................................................................... 65 Lithuania ..................................................................................................................................... 66 Macedonia .................................................................................................................................. 68 Malaysia ..................................................................................................................................... 69 Mexico ........................................................................................................................................ 69 Netherlands ................................................................................................................................ 70 New Zealand .............................................................................................................................. 70 Nigeria ........................................................................................................................................ 71 Norway ....................................................................................................................................... 72 Peru ............................................................................................................................................ 72 Philippines .................................................................................................................................. 73 Poland ........................................................................................................................................ 73 Portugal ...................................................................................................................................... 74 Qatar .......................................................................................................................................... 75 Romania ..................................................................................................................................... 76 Russia ........................................................................................................................................ 77 Saudi Arabia ............................................................................................................................... 78 Singapore ................................................................................................................................... 78 Slovakia ...................................................................................................................................... 79 Slovenia...................................................................................................................................... 80 South Africa ................................................................................................................................ 81 South Korea ............................................................................................................................... 81 Spain .......................................................................................................................................... 82 Sweden ...................................................................................................................................... 83 Switzerland ................................................................................................................................. 83 Thailand...................................................................................................................................... 84 Turkey ........................................................................................................................................ 85 United Arab Emirates ................................................................................................................. 86 United Kingdom .......................................................................................................................... 86 USA ............................................................................................................................................ 87
6. Consumer Confidence Indices: Methodology & Sources ........................................................ 89 Algeria ........................................................................................................................................ 89 Argentina .................................................................................................................................... 89 Australia ..................................................................................................................................... 90 Austria ........................................................................................................................................ 91 Belgium ...................................................................................................................................... 91 Brazil .......................................................................................................................................... 92 Bulgaria ...................................................................................................................................... 93 Canada ....................................................................................................................................... 94 Chile ........................................................................................................................................... 94
China .......................................................................................................................................... 95 Colombia .................................................................................................................................... 96 Costa Rica .................................................................................................................................. 97 Croatia ........................................................................................................................................ 97 Czech Republic .......................................................................................................................... 98 Denmark ..................................................................................................................................... 99 Dominican Republic ................................................................................................................... 99 Ecuador .................................................................................................................................... 100 Egypt ........................................................................................................................................ 101 Estonia ..................................................................................................................................... 101 Finland...................................................................................................................................... 102 France ...................................................................................................................................... 103 Georgia..................................................................................................................................... 104 Germany ................................................................................................................................... 105 Greece...................................................................................................................................... 105 Hungary .................................................................................................................................... 106 Indonesia .................................................................................................................................. 107 Ireland ...................................................................................................................................... 108 Israel......................................................................................................................................... 109 Italy ........................................................................................................................................... 109 Japan........................................................................................................................................ 110 Jordan ...................................................................................................................................... 110 Kuwait....................................................................................................................................... 111 Latvia ........................................................................................................................................ 112 Lithuania ................................................................................................................................... 112 Malaysia ................................................................................................................................... 113 Mexico ...................................................................................................................................... 114 Netherlands .............................................................................................................................. 114 New Zealand ............................................................................................................................ 115 Nigeria ...................................................................................................................................... 116 Norway ..................................................................................................................................... 116 Peru .......................................................................................................................................... 117 Philippines ................................................................................................................................ 117 Poland ...................................................................................................................................... 118 Portugal .................................................................................................................................... 119 Qatar ........................................................................................................................................ 119 Romania ................................................................................................................................... 120 Russia ...................................................................................................................................... 121 Saudi Arabia ............................................................................................................................. 122 Slovakia .................................................................................................................................... 122 Slovenia.................................................................................................................................... 123 South Africa .............................................................................................................................. 124 South Korea ............................................................................................................................. 125 Spain ........................................................................................................................................ 125 Sweden .................................................................................................................................... 126 Switzerland ............................................................................................................................... 127 Taiwan ...................................................................................................................................... 127

Thailand.................................................................................................................................... 128 Tunisia ...................................................................................................................................... 129 Turkey ...................................................................................................................................... 130 Ukraine ..................................................................................................................................... 130 United Arab Emirates ............................................................................................................... 131 United Kingdom ........................................................................................................................ 132 Uruguay .................................................................................................................................... 132 USA .......................................................................................................................................... 133 Vietnam .................................................................................................................................... 134
7. House Price Indices: Methodology & Sources ...................................................................... 136 Argentina .................................................................................................................................. 136 Australia ................................................................................................................................... 136 Austria ...................................................................................................................................... 137 Belarus ..................................................................................................................................... 137 Belgium .................................................................................................................................... 138 Brazil ........................................................................................................................................ 138 Bulgaria .................................................................................................................................... 139 Canada ..................................................................................................................................... 139 Chile ......................................................................................................................................... 140 China ........................................................................................................................................ 141 Colombia .................................................................................................................................. 141 Croatia ...................................................................................................................................... 142 Czech Republic ........................................................................................................................ 142 Denmark ................................................................................................................................... 142 Estonia ..................................................................................................................................... 143 Finland...................................................................................................................................... 143 France ...................................................................................................................................... 144 Georgia..................................................................................................................................... 145 Germany ................................................................................................................................... 145 Greece...................................................................................................................................... 146 Hong Kong, China .................................................................................................................... 147 Hungary .................................................................................................................................... 147 India ......................................................................................................................................... 148 Indonesia .................................................................................................................................. 148 Ireland ...................................................................................................................................... 149 Israel......................................................................................................................................... 150 Italy ........................................................................................................................................... 150 Japan........................................................................................................................................ 151 Kazakhstan ............................................................................................................................... 151 Latvia ........................................................................................................................................ 152 Lithuania ................................................................................................................................... 152 Macedonia ................................................................................................................................ 153 Malaysia ................................................................................................................................... 154 Mexico ...................................................................................................................................... 154 Netherlands .............................................................................................................................. 155 New Zealand ............................................................................................................................ 155 Norway ..................................................................................................................................... 156

Peru .......................................................................................................................................... 156 Philippines ................................................................................................................................ 157 Poland ...................................................................................................................................... 157 Portugal .................................................................................................................................... 158 Qatar ........................................................................................................................................ 158 Romania ................................................................................................................................... 159 Russia ...................................................................................................................................... 159 Serbia ....................................................................................................................................... 160 Singapore ................................................................................................................................. 160 Slovakia .................................................................................................................................... 161 Slovenia.................................................................................................................................... 162 South Africa .............................................................................................................................. 163 South Korea ............................................................................................................................. 163 Spain ........................................................................................................................................ 163 Sweden .................................................................................................................................... 164 Switzerland ............................................................................................................................... 165 Taiwan ...................................................................................................................................... 165 Thailand.................................................................................................................................... 165 Turkey ...................................................................................................................................... 166 Ukraine ..................................................................................................................................... 166 United Arab Emirates ............................................................................................................... 167 United Kingdom ........................................................................................................................ 167 USA .......................................................................................................................................... 168
8. Stock Market Indices ............................................................................................................ 170
ABOUT MONTHLY AND QUARTERLY DATA
Euromonitor International’s high frequency database incorporates a wide range of short-term
economic indicators across 80 countries including short-term forecasts, enabling analysis of
economic trends and developments in real time.
1. FREQUENTLY ASKED QUESTIONS
HOW OFTEN DO YOU UPDATE THE DATA? Our data is updated two times per month, with our analysts closely monitoring the release
schedules of statistical offices and central banks to ensure that our database always contains the
latest available data. The forecasts are also updated twice a month by our expert macroeconomic
modelling team.
WHY IS DATA OFTEN REVISED? Statistical offices frequently revise their data as more information becomes available or as they
find better methods to capture trends. We constantly review the entire time series of data to ensure
that we capture these changes to historical data.
WHY ARE SOME DATASETS ONLY AVAILABLE QUARTERLY? GDP, Real GDP Growth, Government Final Consumption Expenditure, Private Final Consumption
Expenditure, Exports of Goods and Services, Imports of Goods and Services, Gross Fixed Capital
Formation, Increases in Stocks are all only available quarterly. These datasets are major
components of National Accounts data. The international methodology, which most economies
follow, only requires quarterly data. In addition, some indicators for which monthly data availability is
low are available quarterly.
WHAT DOES SEASONALLY ADJUSTED MEAN? Data is often seasonally adjusted to remove the effects of seasonal calendar influences impacting
on a series. Seasonal effects usually reflect the influence of the seasons themselves either directly
(e.g. there is less construction in winter) or through social conventions (e.g. moving holidays such as
Easter and Eid have an impact on working days and Christmas has a huge impact on retail sales).
For the datasets that include countries with missing seasonally adjusted data, we model the missing
series using STL/X-12 seasonal decomposition procedures. To correctly detect and remove the
seasonal component, the decomposition procedures are not implemented if the time series is
shorter than 3 years.
SHOULD I CHOOSE SEASONALLY ADJUSTED OR NON-SEASONALLY ADJUSTED?
Seasonally adjusted data removes “noise” from the time series allowing for a more thorough
understanding of trends. Many analysts prefer seasonally adjusted data because they want to see
those characteristics that seasonal movements tend to mask, especially changes in the direction of
the series.
NOT ALL OF THE DATA I SELECT IS DISPLAYED. WHY? Data is not always available for all countries and all indicators; nor are they always available in
both seasonally adjusted and non-seasonally adjusted form. If the data you choose is unavailable,
change the frequency and/or the seasonal adjustment and try again.
HOW DO YOU FORECAST THE DATA? To arrive at short-term forecasts for our set of monthly and quarterly data, we use econometric
models developed by our expert macroeconomic modelling team as well as judgemental input.
Country-specific indicators are forecasted using Euromonitor Macro Model, Vector Error Correction
Model (VECM) and ARIMA methods, while commodities are considered a separate group and thus
are forecasted using an econometric model reflecting both common and specific factors that affect
commodity markets. The model based forecasts are then revised by imposing certain restrictions
that ensure internal consistency of the forecasts and supplementing them with additional economic
information from a network of in-country experts. For more detailed information see section 4
“Forecasting methodology”.

2. METHODOLOGY
Euromonitor International’s team of economic analysts research part-year economic data from a
range of national and international sources. Our data is updated two times per month, with our
analysts closely monitoring the release schedules of statistical offices and central banks to ensure
that our database always contains the latest available data.
The time series runs from January 2000 (where available) until the latest month.
Statistical offices frequently revise their data backwards – we capture these changes and revise
the entire time series as necessary.
All indices (with the exception of consumer and business confidence) have been re-based to 2010
= 100 to facilitate cross-country comparisons.
Wherever possible, both seasonally adjusted and non-seasonally adjusted data has been
researched. For the datasets that include countries with missing seasonally adjusted data, we model
the missing series using STL/X-12 seasonal decomposition procedures. To correctly detect and
remove the seasonal component, the decomposition procedures are not implemented if the time
series is shorter than 3 years.
Business confidence, consumer confidence and house price data are not strictly cross country
comparable due to varying methodology across countries. For cross-country comparison of business
confidence and consumer confidence, we calculate a standardised index (z-score) indicating the
number of standard deviations each observation is above or below the long-term mean. The further
the index is from zero the better/worse the confidence is compared to the long-term average. Full
information regarding the source, scope and compilation of consumer and business confidence
surveys used can be found in the Methodology & Sources sections 5 and 6.
To arrive at short-term forecasts for our set of monthly and quarterly data, we use econometric
models developed by our expert macroeconomic modelling team as well as judgemental input.
Country-specific indicators are forecasted using Euromonitor Macro Model, Vector Error Correction
Model (VECM) and ARIMA methods, while commodities are considered a separate group and thus
are forecasted using an econometric model reflecting both common and specific factors that affect
commodity markets. The model based forecasts are then revised by imposing certain restrictions
that ensure internal consistency of the forecasts and supplementing them with additional economic
information from a network of in-country experts. For more detailed information see section 4
“Forecasting methodology”.

3. DEFINITIONS & SOURCES
AGRICULTURAL RAW MATERIALS INDEX The index is compiled using the nominal prices of the following commodities: timber (logs and
sawnwood) 52.2%, cotton 11.8%, natural rubber 22.3%, tobacco 13.7%. Data is not country specific,
so in “Geographies selection” select “World” to view data.
Source: World Bank
Frequency: Monthly and quarterly
Seasonal adjustment: Only NSA data is available
ALMOND PRICE Average spot price of Nonpareil variety of Californian or Australian origin, 22/27 pieces/ounce,
light-medium brown coloured kernels, ex-Delhi (exclusive of VAT, other taxes and levies). The price
is in nominal US dollars. Data is not country specific, so in “Geographies selection” select “World” to
view data.
Source: MCX India (Multi Commodity Exchange of India Limited)
Frequency: Monthly and quarterly
Seasonal adjustment: Only NSA data is available
ALUMINIUM PRICE London Metal Exchange, unalloyed primary ingots, high grade, minimum 99.7% purity, settlement
price beginning 2005; previously cash price. The price is in nominal US dollars. Data is not country
specific, so in “Geographies selection” select “World” to view data.
Source: World Bank
Frequency: Monthly and quarterly
Seasonal adjustment: Only NSA data is available
APPLE PRICE USA, fresh market, FOB price. The price is in nominal US dollars. Data is not country specific, so
in “Geographies selection” select “World” to view data.
Source: United States Department of Agriculture
Frequency: Monthly and quarterly
Seasonal adjustment: Only NSA data is available
BANANA PRICE Central & South America, major brands, US import price, free on truck (f.o.t.) US Gulf ports. The
price is in nominal US dollars. Data is not country specific, so in “Geographies selection” select
“World” to view data.
Source: World Bank
Frequency: Monthly and quarterly

Seasonal adjustment: Only NSA data is available
BANK NONPERFORMING LOANS TO TOTAL GROSS LOANS Bank nonperforming loans to total gross loans are the value of nonperforming loans divided by the
total value of the loan portfolio (including nonperforming loans before the deduction of specific loan-
loss provisions). The loan amount recorded as nonperforming should be the gross value of the loan
as recorded on the balance sheet, not just the amount that is overdue. The last figure in time series
refers to the last available data of the corresponding year.
Source: International Monetary Fund
Frequency: Quarterly
Seasonal adjustment: Both SA and NSA data is available
BARLEY PRICE Barley (US) feed, No. 2, spot, 20 days To-Arrive, delivered Minneapolis from May 2012 onwards;
previously April Canadian, feed, Western No. 1, Winnipeg Commodity Exchange, spot, wholesale
farmers' price. The price is in nominal US dollars. Data is not country specific, so in “Geographies
selection” select “World” to view data.
Source: World Bank
Frequency: Monthly and quarterly
Seasonal adjustment: Only NSA data is available
BEEF PRICE Australia/New Zealand, chucks and cow forequarters, frozen boneless, 85% chemical lean, c.i.f.
U.S. port (East Coast), ex-dock, beginning November 2002; previously cow forequarters. The price
is in nominal US dollars. Data is not country specific, so in “Geographies selection” select “World” to
view data.
Source: World Bank
Frequency: Monthly and quarterly
Seasonal adjustment: Only NSA data is available
BEVERAGES INDEX The index is compiled using the nominal prices of the following commodities: coffee 45.7%, cocoa
beans 36.9%, tea 17.4%. Data is not country specific, so in “Geographies selection” select “World”
to view data.
Source: World Bank
Frequency: Monthly and quarterly
Seasonal adjustment: Only NSA data is available
BUSINESS CONFIDENCE INDEX Business confidence index measures the amount of optimism or pessimism that business
managers have with regard to current situation and the prospects of their organizations. Survey
design and methodology vary from country to country depending on the source. Please see section

5 for further information. For cross-country comparison, a standardised business confidence index is
calculated, indicating the number of standard deviations each observation is above or below the
long-term mean. The further the index is from zero the better/worse the confidence is compared to
the long-term average.
Sources: Central Banks, National Statistics Offices, European Commission, trade sources
Frequency: Monthly and quarterly
Seasonal adjustment: Only NSA data is available
CAPITAL TO ASSETS The ratio provides an indication of financial leverage—that is, the extent to which assets are
funded by other than own funds—and another measure of capital adequacy of the deposit-taking
sector. The ratio is calculated by taking capital and reserves as the numerator, and all nonfinancial
and financial assets as the denominator.
Source: International Monetary Fund
Frequency: Quarterly
Seasonal adjustment: Both SA and NSA data is available
CARDAMOM PRICE Average spot price of Cardamom 6-7mm bold bulk with minimum of 375-385 grams per litre
density, Ex-Vandanmedu, Dist. Idukki, Kerala. The price is in nominal US dollars. Data is not country
specific, so in “Geographies selection” select “World” to view data.
Source: MCX India (Multi Commodity Exchange of India Limited)
Frequency: Monthly and quarterly
Seasonal adjustment: Only NSA data is available
CENTRAL BANK POLICY RATE Central bank policy rate is the rate that is used by central bank to implement or signal its monetary
policy stance. It is most commonly set by the central banks’ policy making committees.
Sources: Central Banks, National Statistics Offices, IMF
Frequency: Monthly and quarterly
Seasonal adjustment: Only NSA data is available
CHICKEN PRICE United States, broiler/fryer, whole birds, 2.5 to 3 pounds, USDA grade "A", ice-packed, Georgia
Dock preliminary weighted average, wholesale. The price is in nominal US dollars. Data is not
country specific, so in “Geographies selection” select “World” to view data.
Source: World Bank
Frequency: Monthly and quarterly
Seasonal adjustment: Only NSA data is available
COAL PRICE Australia, thermal GAR, f.o.b. piers, Newcastle/Port Kembla from 2002 onwards , 6,300 kcal/kg
(11,340 btu/lb), less than 0.8% sulphur, 13% ash; previously 6,667 kcal/kg (12,000 btu/lb), less than
1.0% sulphur, 14% ash. The price is in nominal US dollars. Data is not country specific, so in
“Geographies selection” select “World” to view data.
Source: World Bank
Frequency: Monthly and quarterly
Seasonal adjustment: Only NSA data is available
COCOA PRICE International Cocoa Organization daily price, average of the first three positions on the terminal
markets of New York and London, nearest three future trading months. The price is in nominal US
dollars. Data is not country specific, so in “Geographies selection” select “World” to view data.
Source: World Bank
Frequency: Monthly and quarterly
Seasonal adjustment: Only NSA data is available
COCONUT OIL PRICE Philippines/Indonesia coconut oil, bulk, CIF Rotterdam. The price is in nominal US dollars. Data is
not country specific, so in “Geographies selection” select “World” to view data.
Source: World Bank
Frequency: Monthly and quarterly
Seasonal adjustment: Only NSA data is available
COFFEE PRICE International Coffee Organization indicator price, other mild Arabicas, average New York and
Bremen/Hamburg markets, ex-dock. The price is in nominal US dollars. Data is not country specific,
so in “Geographies selection” select “World” to view data.
Source: World Bank
Frequency: Monthly and quarterly
Seasonal adjustment: Only NSA data is available
COMMODITY FUEL (ENERGY) INDEX The index is compiled using the nominal prices of the following commodities: coal 4.7%, natural
gas 10.8%, crude oil 84.6%. Data is not country specific, so in “Geographies selection” select
“World” to view data.
Source: World Bank
Frequency: Monthly and quarterly
Seasonal adjustment: Only NSA data is available

CONSUMER CONFIDENCE INDEX Consumer confidence index measures consumers’ optimism or pessimism about their current and
future situations. Survey design and methodology vary substantially from country to country
depending on the source. Please see section 6 for further information. For cross-country
comparison, a standardised consumer confidence index is calculated, indicating the number of
standard deviations each observation is above or below the long-term mean. The further the index is
from zero the better/worse the confidence is compared to the long-term average.
Sources: Central Banks, National Statistics Offices, European Commission, trade sources
Frequency: Monthly and quarterly
Seasonal adjustment: Only NSA data is available
COPPER PRICE London Metal Exchange, grade A, minimum 99.9935% purity, cathodes and wire bar shapes,
settlement price. The price is in nominal US dollars. Data is not country specific, so in “Geographies
selection” select “World” to view data.
Source: World Bank
Frequency: Monthly and quarterly
Seasonal adjustment: Only NSA data is available
CORIANDER PRICE Average spot price of dried mature seeds of Coriandrum sativum L of Indian origin, machine
cleaned with acceptable level of moisture up to 9%, foreign matter up to 0.9%, damaged seeds up to
1.9%, shrivelled seeds up to 1.5%, weevil seeds up to 0.5% and Coriander splits (Dal) up to 9.5%
with prohibited live infestation, Badami Whole Dhaniya ex warehouse Kota exclusive of sales
tax/VAT. The price is in nominal US dollars. Data is not country specific, so in “Geographies
selection” select “World” to view data.
Source: NCDEX (National Commodity and Derivatives Exchange Limited)
Frequency: Monthly and quarterly
Seasonal adjustment: Only NSA data is available
CORN PRICE United States, no. 2, yellow, f.o.b. US Gulf ports. The price is in nominal US dollars. Data is not
country specific, so in “Geographies selection” select “World” to view data.
Source: World Bank
Frequency: Monthly and quarterly
Seasonal adjustment: Only NSA data is available
COTTON PRICE Cotton (Cotton Outlook "Cotlook A index"), middling 1-3/32 inch, traded in Far East, C/F beginning
2006; previously Northern Europe, c.i.f. The price is in nominal US dollars. Data is not country
specific, so in “Geographies selection” select “World” to view data.

Source: World Bank
Frequency: Monthly and quarterly
Seasonal adjustment: Only NSA data is available
CRUDE OIL (EUROPE BRENT) SPOT PRICE Brent crude is a major classification of oil, used to price two thirds of the world's internationally
traded crude oil supplies. A spot price is the price for a one-time open market transaction for near-
term delivery of a specific quantity of product at a specific location where the commodity is
purchased “on the spot” at current market rates. A barrel is the standard unit of price for oil, and is
equal to 42 US gallons. The price is in nominal US dollars. Data is not country specific, so in
“Geographies selection” select “World” to view data.
Source: U.S. Energy Information Administration
Frequency: Monthly and quarterly
Seasonal adjustment: Only NSA data is available
CRUDE OIL (WTI CUSHING) SPOT PRICE West Texas Intermediate, also known as Texas Light Sweet, is a type of crude oil used as a
benchmark in oil pricing. A spot price is the price for a one-time open market transaction for near-
term delivery of a specific quantity of product at a specific location where the commodity is
purchased “on the spot” at current market rates. A barrel is the standard unit of price for oil, and is
equal to 42 US gallons. The price is in nominal US dollars. Data is not country specific, so in
“Geographies selection” select “World” to view data.
Source: U.S. Energy Information Administration
Frequency: Monthly and quarterly
Seasonal adjustment: Only NSA data is available
CUMIN PRICE Average spot price of dried mature fruits of Cuminum Cyminum L of Indian origin, machine
cleaned with acceptable level of moisture up to 9%, foreign matter up to 1%, damaged seeds up to
2%, seeds with stalks up to 8% and insect damaged seeds up to 0.5%, ex-warehouse Unjha
exclusive of sales tax/VAT. The price is in nominal US dollars. Data is not country specific, so in
“Geographies selection” select “World” to view data.
Source: NCDEX (National Commodity and Derivatives Exchange Limited)
Frequency: Monthly and quarterly
Seasonal adjustment: Only NSA data is available
CURRENT ACCOUNT BALANCE A constituent part of the Balance of Payments (BoP) which consists of the balance of trade in
goods and services between countries, the balance of income and the balance of current transfers.
Trade balance is the difference between exports and imports of goods and services. Income balance
includes the flows of compensations to employees and investment income. Current transfers consist
of all transfers that are not transfers of capital.

Sources: Central Banks, National Statistics Offices, OECD
Frequency: Monthly and quarterly
Seasonal adjustment: Both SA and NSA data is available
CUSTOMER DEPOSITS TO TOTAL NON-INTERBANK LOANS The ratio is a measure of liquidity, in that it compares the “stable” deposit base with gross loans
(excluding interbank activity). When stable deposits are low relative to loans, there is a greater
dependence on more volatile funds to cover the illiquid assets in deposit takers’ portfolios. Customer
deposits is the numerator and includes deposits considered to be more “stable” and less volatile
types of deposits that can be employed to fund long-term lending. Non-interbank loans are the
denominator and incorporate loans excluding interbank activity.
Source: International Monetary Fund
Frequency: Quarterly
Seasonal adjustment: Both SA and NSA data is available
EMPLOYED/UNEMPLOYED/ECONOMICALLY ACTIVE POPULATION Employed population comprises all persons above a specific age who during a specified brief
period, either one week or one day, were in the following categories: (A) "paid employment": (i) "at
work": persons who during the reference period performed some work for wage or salary, in cash or
in kind; (ii) "with a job but not at work": persons who, having already worked in their present job,
were temporarily not at work during the reference period and had a formal attachment to their job.
(B) "self-employment": (i) "at work": persons who during the reference period performed some work
for profit or family gain, in cash or in kind: (ii) "with an enterprise but not at work": persons with an
enterprise, which may be a business enterprise, a farm or a service undertaking, who were
temporarily not at work during the reference period for any specific reason.
Unemployed population comprises all persons above a specific age who during the reference
period were simultaneously: (a) "without work", i.e. were not in paid employment or self-employed;
(b) "currently available for work", i.e. were available for paid employment or self-employment during
the reference period, and (c) "seeking work", i.e. had taken specific steps in a specified reference
period to seek paid employment or self-employment.
Economically active population comprises all persons who furnish the supply of labour for the
production of economic goods and services (employed and unemployed, including those seeking
work for the first time) during a specified time reference period.
Sources: National Statistics Offices, OECD, Eurostat
Frequency: Monthly and quarterly
Seasonal adjustment: Both SA and NSA data is available
EXCHANGE RATES AGAINST US DOLLAR
The exchange rate is defined as the price in a given currency at which bills drawn in another
currency may be bought. The data is the monthly average of market rates.
Sources: Central Banks, National Statistics Offices, OECD, IMF
Frequency: Monthly and quarterly
Seasonal adjustment: Only NSA data is available
EXPORT PRICE INDEX Export price index measures changes in the value of one unit of actual exported merchandise
goods. In case unit values are not available, the index measures changes in the value of a certain
fixed basket of exported merchandise goods. The index represents prices at national currency.
Sources: Customs Departments, National Statistics Offices, Eurostat
Frequency: Monthly and quarterly
Seasonal adjustment: Both SA and NSA data is available
EXPORTS Data refer to merchandise exports. Exports consist of goods leaving a country’s economic
territory. Goods simply being transported through a country (goods in transit) or temporarily admitted
or withdrawn (except for goods for inward or outward processing) are not included. Exports of goods
are valued f.o.b. (free on board); the costs of transportation and insurance up to the border of the
exporting country are included in exports of goods.
Sources: Customs Departments, National Statistics Offices, OECD, IMF
Frequency: Monthly and quarterly
Seasonal adjustment: Both SA and NSA data is available
EXPORTS OF GOODS AND SERVICES Exports of goods and services consist of transactions of all goods and services from residents to
non-residents of a country. They include the value of merchandise, goods sent for processing and
repairs, nonmonetary gold, and services such as transportation, construction, information, financial,
business and other services.
Sources: National Statistics Offices, Eurostat, OECD
Frequency: Quarterly
Seasonal adjustment: Both SA and NSA data is available
FOOD INDEX The index is compiled using the nominal prices of the following commodities: bananas 4.9%,
cereals (maize, rice, wheat, barley) 28.2%, meat (beef, chicken) 12.8%, vegetable oils and protein
meals (coconut oil, groundnuts, groundnut oil, palm oil, soybeans, soybean meal, soybean oil)
40.8%, oranges 3.6%, sugar 9.8%. Data is not country specific, so in “Geographies selection” select
“World” to view data.
Source: World Bank
Frequency: Monthly and quarterly
Seasonal adjustment: Only NSA data is available
FOREIGN CURRENCY DENOMINATED LOANS TO TOTAL LOANS Foreign currency denominated loans to total loans is calculated by using the foreign currency and
foreign-currency-linked part of gross loans to residents and non-residents as the numerator and total
gross loans as the denominator. It is an asset quality indicator, which measures the relative size of

foreign currency loans within gross loans and therefore monitors exposures to both credit and
currency risk.
Source: International Monetary Fund
Frequency: Quarterly
Seasonal adjustment: Both SA and NSA data is available
FOREIGN EXCHANGE RESERVES Foreign exchange reserves comprise a part of international reserves and are stocks of foreign
currency denominated assets held by central banks and monetary authorities. Foreign exchange
includes monetary authorities’ claims on non-residents in the forms of currency bank deposits,
government securities, other bonds and notes, money market instruments, financial derivatives,
equity securities, and nonmarketable claims arising from arrangements between central banks or
governments.
Sources: Central Banks, IMF
Frequency: Monthly and quarterly
Seasonal adjustment: Only NSA data is available
GDP Gross domestic product is an aggregate measure of production equal to the sum of the gross
values added of all resident institutional units engaged in production (plus any taxes, and minus any
subsidies, on products not included in the value of their outputs). The sum of the final uses of goods
and services (all uses except intermediate consumption) measured in purchasers' prices, less the
value of imports of goods and services, or the sum of primary incomes distributed by resident
producer units.
Sources: National Statistics Offices, Eurostat, OECD, IMF
Frequency: Quarterly
Seasonal adjustment: Both SA and NSA data is available
GOLD PRICE 99.5% fine (995 parts of pure gold per thousand), London, afternoon fixing, nominal US dollars
per troy ounce. Afternoon fixing refers to the price determined at 3PM London time each business
day on the London market by the five members of The London Gold Market Fixing Ltd. Data is not
country specific, so in “Geographies selection” select “World” to view data.
Source: World Bank
Frequency: Monthly and quarterly
Seasonal adjustment: Only NSA data is available
GOVERNMENT EXPENDITURE Government expenditure refers to total general government finance devoted for different purposes
financed by government. It covers all non-repayable payments – whether capital or current, requited
or not – by government. Total expenditure consists of total expense and the net acquisition of
nonfinancial assets.
Sources: National Statistics Offices, Eurostat
Frequency: Quarterly
Seasonal adjustment: Both SA and NSA data is available
GOVERNMENT FINAL CONSUMPTION EXPENDITURE Government final consumption expenditure consists of expenditure, including imputed
expenditure, incurred by general government on both individual consumption goods and services
and collective consumption services.
Sources: National Statistics Offices, Eurostat, OECD
Frequency: Quarterly
Seasonal adjustment: Both SA and NSA data is available
GOVERNMENT NET LENDING/BORROWING Net lending (+)/ borrowing (–) is calculated as revenue minus total expenditure. This is a core
government finance balance that measures the extent to which general government is either putting
financial resources at the disposal of other sectors in the economy and non-residents (net lending),
or utilizing the financial resources generated by other sectors and non-residents (net borrowing).
This balance may be viewed as an indicator of the financial impact of general government activity on
the rest of the economy and non-residents.
Sources: National Statistics Offices, Eurostat
Frequency: Quarterly
Seasonal adjustment: Both SA and NSA data is available
GOVERNMENT REVENUE General government revenue consists of taxes, social contributions, grants receivable, and other
revenue. Revenue increases government’s net worth, which is the difference between its assets and
liabilities.
Sources: National Statistics Offices, Eurostat
Frequency: Quarterly
Seasonal adjustment: Both SA and NSA data is available
GRAPEFRUIT PRICE USA, fresh market, FOB price. The price is in nominal US dollars. Data is not country specific, so
in “Geographies selection” select “World” to view data.
Source: United States Department of Agriculture
Frequency: Monthly and quarterly
Seasonal adjustment: Only NSA data is available
GROSS FIXED CAPITAL FORMATION Gross fixed capital formation consists of resident producers’ investments, deducting disposals, in
fixed assets during a given period. It also includes certain additions to the value of non-produced
assets realised by producers or institutional units. Fixed assets are tangible or intangible assets
produced as outputs from production processes that are used repeatedly, or continuously, for more
than one year.
Sources: National Statistics Offices, Eurostat, OECD
Frequency: Quarterly
Seasonal adjustment: Both SA and NSA data is available
GROSS LOANS TO NONFINANCIAL CORPORATIONS Gross loans to nonfinancial corporations are loans to institutional entities whose principal activity
is the production of goods or nonfinancial services for sale at prices that are economically
significant. They include nonfinancial corporations, nonfinancial quasi corporations, and non-profit
institutions that are producers of goods or nonfinancial services for sale at prices that are
economically significant.
Source: International Monetary Fund
Frequency: Quarterly
Seasonal adjustment: Both SA and NSA data is available
HARD LOGS PRICE Malaysia, meranti, Sarawak, sale price charged by importers in Tokyo, Japan. The price is in
nominal US dollars. Data is not country specific, so in “Geographies selection” select “World” to view
data.
Source: World Bank
Frequency: Monthly and quarterly
Seasonal adjustment: Only NSA data is available
HARD SAWNWOOD PRICE Malaysia, dark red seraya/meranti, select and better quality, average 7 to 8 inches; length
average 12 to 14 inches; thickness 1 to 2 inch(es); kiln dry, c. & f. UK ports, with 5% agents
commission including premium for products of certified sustainable forest beginning January 2005;
previously excluding the premium. The price is in nominal US dollars. Data is not country specific, so
in “Geographies selection” select “World” to view data.
Source: World Bank
Frequency: Monthly and quarterly
Seasonal adjustment: Only NSA data is available
HOUSE PRICE INDEX House price index reflects changes in the prices of residential dwellings in a country. Survey
design and methodology vary substantially from country to country. For further information, see
section 7.
Sources: Central Banks, National Statistics Offices, trade sources
Frequency: Monthly and quarterly

Seasonal adjustment: Only NSA data is available
HOUSE PRICE TO INCOME RATIO House price to income ratio is given by the ratio of nominal house prices to nominal household
disposable income per capita. This is a measure of the affordability of purchasing a house.
Source: OECD
Frequency: Quarterly
Seasonal adjustment: Only SA data is available
HOUSE PRICE TO RENT RATIO House price to rent ratio is given by the ratio of nominal house prices to rental prices. This is a
measure of the profitability of owning a house.
Source: OECD
Frequency: Quarterly
Seasonal adjustment: Only SA data is available
HOUSE RENT PRICE INDEX House rent price index measures the level of rent prices for residential dwellings in a geographical
area over time.
Sources: National Statistics Offices
Frequency: Monthly and quarterly
Seasonal adjustment: Only NSA data is available
HOUSEHOLD DEBT Household debt comprises debt incurred by resident households of the economy only.
Source: International Monetary Fund
Frequency: Quarterly
Seasonal adjustment: Both SA and NSA data is available
HOUSING COMPLETIONS Housing completion is an agreement on a local government or other regulatory body that a
completed construction work of housing unit or a part thereof conforms to the requirements
prescribed for such construction work and that it may be used for the intended purpose. A housing
unit is defined as a house, an apartment, a group of rooms or a single room intended for occupancy
as separate living quarters. Separate living quarters are those in which the occupants live separately
from any other individuals in the building and which have a direct access from the outside of the
building or through a common hall.
Sources: National Statistics Offices, Eurostat
Frequency: Monthly and quarterly
Seasonal adjustment: Both SA and NSA data is available

HOUSING PERMITS Housing permit is a type of authorization that must be granted by a local government or other
regulatory body before the construction of a new or existing housing unit can legally occur. A
housing unit is defined as a house, an apartment, a group of rooms or a single room intended for
occupancy as separate living quarters. Separate living quarters are those in which the occupants
live separately from any other individuals in the building and which have a direct access from the
outside of the building or through a common hall.
Sources: National Statistics Offices, Eurostat
Frequency: Monthly and quarterly
Seasonal adjustment: Both SA and NSA data is available
IMPORT PRICE INDEX Import price index measures changes in the value of one unit of actual imported merchandise
goods. In case unit values are not available, the index measures changes in the value of a certain
fixed basket of imported merchandise goods. The index represents prices at national currency.
Sources: Customs Departments, National Statistics Offices, Eurostat
Frequency: Monthly and quarterly
Seasonal adjustment: Both SA and NSA data is available
IMPORTS Data refer to merchandise imports. Imports consist of goods entering a country’s economic
territory. Goods simply being transported through a country (goods in transit) or temporarily admitted
or withdrawn (except for goods for inward or outward processing) are not included. Imports of goods
are valued c.i.f. (cost, insurance, freight). Import values reflect the price of a good delivered at the
frontier of the importing country, including any insurance and freight charges incurred to that point,
before the payment of any import duties or other taxes on imports or trade and transport margins
within the country.
Sources: Customs Departments, National Statistics Offices, OECD, IMF
Frequency: Monthly and quarterly
Seasonal adjustment: Both SA and NSA data is available
IMPORTS OF GOODS AND SERVICES Imports of goods and services consist of transactions of all goods and services from non-residents
to residents of a country. They include the value of merchandise, goods sent for processing and
repairs, nonmonetary gold, and services such as transportation, construction, information, financial,
business and other services.
Sources: National Statistics Offices, Eurostat, OECD
Frequency: Quarterly
Seasonal adjustment: Both SA and NSA data is available

INCREASES IN STOCKS Stocks are holdings of assets and liabilities at a point in time. They include:
stocks of inputs intended to be used later as intermediate consumption in a production process;
stocks of finished goods that have not yet been sold;
stocks of merchandise purchased for resale (mainly in wholesale and retail distribution);
strategic stocks (food, oil, stocks for intervention on agricultural markets) managed by government
authorities;
work in progress, which consists of goods being processed but which cannot yet be delivered to
the user at the end of the accounting period.
Stocks are recorded for all assets within the system’s boundaries; that is, for financial assets and
liabilities and for non-financial assets, both produced and non-produced. However, the coverage is
limited to those assets that are used in economic activity and that are subject to ownership rights.
Thus, stocks are not recorded for assets such as human capital and natural resources that are not
owned.
Sources: National Statistics Offices, Eurostat, OECD
Frequency: Quarterly
Seasonal adjustment: Both SA and NSA data is available
INDEX OF CONSUMER PRICES The index of consumer prices measures changes over time in the general level of prices of goods
and services that a reference population acquires, uses or pays for consumption. A consumer price
index is estimated as a series of summary measures of the period-to-period proportional change in
the prices of a fixed set of consumer goods and services of constant quantity and characteristics,
acquired, used or paid for by the reference population. Each summary measure is constructed as a
weighted average of a large number of elementary aggregate indices. Each of the elementary
aggregate indices is estimated using a sample of prices for a defined set of goods or services
obtained in, or by residents of, a specific region from a given set of outlets or other sources of
consumption goods or services.
Sources: Central Banks, National Statistics Offices, OECD, IMF
Frequency: Monthly and quarterly
Seasonal adjustment: Both SA and NSA data is available
INDUSTRIAL PRODUCTION INDEX Industrial production Index refers to the volume of output generated by production units classified
under the industrial sectors B (Mining), C (Manufacturing), D and E (Electricity, gas and water) of the
International Standard Industrial Classification of all Economic Activities (ISIC Rev. 4). Data is
generally presented in indices of industrial production, which measure volume changes of output.
Initially, partial indices for production groups at a low level of the Industrial classification are
calculated from the production of each group's representatives using weights determined by the
representatives' gross output. These partial indices are then further aggregated. Weights used to
aggregate data at branch and product level are based on variables measuring the relative shares of
the products and branches in the value added of industry, in the base year.

Sources: National Statistics Offices, OECD
Frequency: Monthly and quarterly
Seasonal adjustment: Both SA and NSA data is available
INFLATION Inflation measures the average changes in the Index of consumer prices.
Sources: Central Banks, National Statistics Offices, OECD, IMF
Frequency: Monthly and quarterly
Seasonal adjustment: Both SA and NSA data is available
INTERNATIONAL RESERVES International reserves consist of those external assets that are readily available to and controlled
by monetary authorities for direct financing of payments imbalances. International reserves comprise
of monetary gold, SDRs, reserve position in the Fund, foreign exchange assets (consisting of foreign
currency and deposits and securities) and other claims.
Sources: Central Banks, OECD, IMF
Frequency: Monthly and quarterly
Seasonal adjustment: Only NSA data is available
IRON ORE PRICE For years 2008 (December) to present: spot, any origin fines, 62% Fe, c.f.r. China; during 2006 to
2008 (November): spot, 63.5% Fe. Earlier data refer to annual contract prices (Brazil for Europe,)
VALE Carajas mines sinter feed, f.o.b. Ponta da Madeira. The price is in nominal US dollars. Data is
not country specific, so in “Geographies selection” select “World” to view data.
Source: World Bank
Frequency: Monthly and quarterly
Seasonal adjustment: Only NSA data is available
LAMB PRICE New Zealand, frozen whole carcasses Prime Medium (PM) wholesale, Smithfield, London
beginning January 2006; previously Prime Light (PL). The price is in nominal US dollars. Data is not
country specific, so in “Geographies selection” select “World” to view data.
Source: World Bank
Frequency: Monthly and quarterly
Seasonal adjustment: Only NSA data is available
LEAD PRICE London Metal Exchange, refined, 99.97% purity, settlement price. The price is in nominal US
dollars. Data is not country specific, so in “Geographies selection” select “World” to view data.
Source: World Bank
Frequency: Monthly and quarterly
Seasonal adjustment: Only NSA data is available
LEMON PRICE USA, fresh market, FOB price. The price is in nominal US dollars. Data is not country specific, so
in “Countries selection” select “World” to view data. Data is not country specific, so in “Geographies
selection” select “World” to view data.
Source: United States Department of Agriculture
Frequency: Monthly and quarterly
Seasonal adjustment: Only NSA data is available
LIME PRICE Market price of first class lime fruits in Michoacán, Mexico. The price is in nominal US dollars.
Data is not country specific, so in “Geographies selection” select “World” to view data.
Source: Mexico National System of Information and Integration of Markets
Frequency: Monthly and quarterly
Seasonal adjustment: Only NSA data is available
LONG-TERM INTEREST RATES Long term interest rate is the secondary market yield on long term government bonds, which in
most cases is 10 years. Generally the yield is calculated at the pre-tax level and before deductions
for brokerage costs and commissions and is derived from the relationship between the present
market value of the bond and that at maturity, taking into account also interest payments paid
through to maturity.
Sources: Central Banks, OECD
Frequency: Monthly and quarterly
Seasonal adjustment: Only NSA data is available
MARKET CAPITALISATION Market capitalisation is an estimation of the value of a business that is obtained by multiplying the
number of shares outstanding by the current price of a share.
Sources: National Statistics, Central Banks, World Federation of Exchanges
Frequency: Monthly and quarterly
Seasonal adjustment: Only NSA data is available
MEAN MAXIMUM TEMPERATURE Average daily maximum air temperature in Celsius.
Sources: NOAA NCEI (National Oceanic and Atmospheric Administration's National Centers for
Environmental Information), Weatherbase
Frequency: Monthly and quarterly
Seasonal adjustment: Only NSA data is available

MEAN MINIMUM TEMPERATURE Average daily minimum air temperature in Celsius.
Sources: NOAA NCEI (National Oceanic and Atmospheric Administration's National Centers for
Environmental Information), Weatherbase
Frequency: Monthly and quarterly
Seasonal adjustment: Only NSA data is available
MEAN TEMPERATURE Average daily air temperature in Celsius.
Sources: NOAA NCEI (National Oceanic and Atmospheric Administration's National Centers for
Environmental Information), Weatherbase
Frequency: Monthly and quarterly
Seasonal adjustment: Only NSA data is available
METALS INDEX The index is compiled using the nominal prices of the following commodities: aluminium 26.7%,
copper 38.4%, iron ore 18.9%, lead 1.8%, nickel 8.1%, tin 2.1%, zinc 4.1%. Data is not country
specific, so in “Geographies selection” select “World” to view data.
Source: World Bank
Frequency: Monthly and quarterly
Seasonal adjustment: Only NSA data is available
MILK PRICE, EUROPEAN UNION The price a dairy farmer receives if milk of specific (standard) composition, quality and quantity is
delivered to the different European dairy companies. The price (nominal US dollars per 100 kg) is
exclusive of VAT, ex-farm and inclusive of supplementary payments. Select “World” in “Geographies
selection” to view data.
Source: LTO Nederland
Frequency: Monthly and quarterly
Seasonal adjustment: Only NSA data is available
MILK PRICE, NEW ZEALAND The price a dairy farmer receives if milk of specific (standard) composition, quality and quantity is
delivered to Fonterra, the largest New Zealand dairy company. The price (nominal US dollars per
100 kg) is exclusive of VAT, ex-farm and inclusive of supplementary payments. Select “World” in
“Geographies selection” to view data.
Source: LTO Nederland
Frequency: Monthly and quarterly
Seasonal adjustment: Only NSA data is available

MILK PRICE, USA All milk price received by producers, nominal US dollars per 100 kg; before deductions for hauling;
includes quality, quantity and other premiums; excludes hauling subsidies. All milk includes fluid
grade milk (milk produced under sanitary conditions that qualify it for fluid consumption) and
manufacturing grade milk (milk not meeting the fluid grade standards). Select “World” in
“Geographies selection” to view data.
Source: United States Department of Agriculture
Frequency: Monthly and quarterly
Seasonal adjustment: Both SA and NSA data is available.
MONEY SUPPLY Money supply is defined as narrow money (M1) that includes currency in circulation, i.e.
banknotes and coins, as well as balances which can immediately be converted into currency or used
for cashless payments, i.e. overnight deposits.
Sources: National Statistics Offices, Eurostat
Frequency: Monthly and quarterly
Seasonal adjustment: Both SA and NSA data is available
NATURAL GAS PRICE, EUROPE Europe, average import border price and a spot price component, beginning April 2010 including
UK; during June 2000 - March 2010 prices excludes UK. The price is in nominal US dollars. Select
“World” in “Geographies selection” to view data.
Source: World Bank
Frequency: Monthly and quarterly
Seasonal adjustment: Only NSA data is available
NATURAL GAS PRICE, JAPAN Liquefied Natural Gas (Japan), import price, cif, recent two months' averages are estimates. The
price is in nominal US dollars. Select “World” in “Geographies selection” to view data.
Source: World Bank
Frequency: Monthly and quarterly
Seasonal adjustment: Only NSA data is available
NATURAL GAS PRICE, USA Natural gas spot price at the Henry Hub terminal in Louisiana. The price is in nominal US dollars.
Select “World” in “Geographies selection” to view data.
Source: World Bank
Frequency: Monthly and quarterly
Seasonal adjustment: Only NSA data is available
NICKEL PRICE London Metal Exchange, cathodes, minimum 99.8% purity, settlement price beginning 2005;
previously cash price. The price is in nominal US dollars. Data is not country specific, so in
“Geographies selection” select “World” to view data.
Source: World Bank
Frequency: Monthly and quarterly
Seasonal adjustment: Only NSA data is available
NON-RESIDENTIAL BUILDING COMPLETIONS Building completion is an agreement on a local government or other regulatory body that a
completed construction work conforms to the requirements prescribed for such construction work
and that it may be used for the intended purpose. Non-residential buildings include all buildings
other than dwellings: warehouse and industrial buildings, commercial buildings, buildings for public
entertainment, hotels, restaurants, educational buildings, health buildings and other.
Sources: National Statistics Offices
Frequency: Monthly and quarterly
Seasonal adjustment: Both SA and NSA data is available
NON-RESIDENTIAL BUILDING PERMITS Building permit is a type of authorization that must be granted by a local government or other
regulatory body before the construction of a new or existing unit can legally occur. Non-residential
buildings include all buildings other than dwellings: warehouse and industrial buildings, commercial
buildings, buildings for public entertainment, hotels, restaurants, educational buildings, health
buildings and other.
Sources: National Statistics Offices
Frequency: Monthly and quarterly
Seasonal adjustment: Both SA and NSA data is available
NUMBER OF JOB VACANCIES A job vacancy is a post, either newly created, unoccupied or about to become vacant, which the
employer actively seeks to fill with a suitable candidate from outside the enterprise (including any
further necessary steps) immediately or in the near future. Although the definition states that a job
vacancy should be open to candidates from outside the enterprise, this does not exclude the
possibility of appointing an internal candidate to the post. A post that is open to internal candidates
only, however, is not considered a job vacancy.
Sources: National Statistics Offices, OECD, Eurostat
Frequency: Monthly and quarterly
Seasonal adjustment: Both SA and NSA data is available
ORANGE JUICE PRICE Intercontinental Exchange (ICE), Frozen Concentrated Orange Juice (FCOJ-A) futures contract,
nearby position, monthly average of close prices. The price is in nominal US dollars. Data is not
country specific, so in “Geographies selection” select “World” to view data.
Source: Intercontinental Exchange
Frequency: Monthly and quarterly
Seasonal adjustment: Only NSA data is available
ORANGE PRICE Mediterranean exporters, navel, European Union indicative import price, c.i.f. Paris. The price is in
nominal US dollars. Data is not country specific, so in “Geographies selection” select “World” to view
data.
Source: World Bank
Frequency: Monthly and quarterly
Seasonal adjustment: Only NSA data is available
OVERNIGHT INTERBANK RATE Overnight interbank rate is the rate at which banks lend money to each other in domestic currency
for the duration of one night. Official discount rates are used in some cases where official interbank
rates are not calculated by national authorities. The official discount rate is the rate at which central
banks make advances to, or discount eligible bills of exchange for, selected banks and other
financial intermediaries. Overnight loans usually serve to balance temporary surpluses and
shortages of liquidity in banks, and are usually considered the lowest cost of money in the market.
Sources: Central Banks, OECD
Frequency: Monthly and quarterly
Seasonal adjustment: Only NSA data is available
PALM OIL PRICE Palm oil (Malaysia), 5% bulk, c.i.f. North-West Europe market. The price is in nominal US dollars.
Data is not country specific, so in “Geographies selection” select “World” to view data.
Source: World Bank
Frequency: Monthly and quarterly
Seasonal adjustment: Only NSA data is available
PEANUT PRICE United States, Runners 40/50, shelled basis, c.i.f. Rotterdam. The price is in nominal US dollars.
Data is not country specific, so in “Geographies selection” select “World” to view data.
Source: World Bank
Frequency: Monthly and quarterly
Seasonal adjustment: Only NSA data is available
PEPPER PRICE Average spot price of dried mature fruits of black pepper (Piper nigrum) with acceptable level of
moisture up to 11.5%, foreign matter up to 0.5% and light pepper up to 2%, Malabar Garbled 1 ex
accredited warehouse Kochi exclusive of all taxes. The price is in nominal US dollars. Data is not
country specific, so in “Geographies selection” select “World” to view data.
Source: NCDEX (National Commodity and Derivatives Exchange Limited)
Frequency: Monthly and quarterly
Seasonal adjustment: Only NSA data is available
PORK PRICE United States, price received by farmers for live hogs. The price is in nominal US dollars. Data is
not country specific, so in “Geographies selection” select “World” to view data.
Source: United States Department of Agriculture
Frequency: Monthly and quarterly
Seasonal adjustment: Only NSA data is available
PRIVATE FINAL CONSUMPTION EXPENDITURE Consists of the expenditure, including imputed expenditure, incurred by resident households on
individual consumption goods and services, including those sold at prices that are not economically
significant. It also includes imputed expenditure (such as rent payments that householders would
pay if they rented their dwelling, instead of owning it) and the expenditures of Non Profit Institutions
Serving Households (NPISH).
Sources: National Statistics Offices, Eurostat, OECD, IMF
Frequency: Quarterly
Seasonal adjustment: Both SA and NSA data is available
PRODUCER PRICE INDEX, MANUFACTURING Producer Price Indices (PPIs) are indices designed to measure the average change in the price of
goods and services either as they leave the place of production or as they enter the production
process. Data refer to goods and services produced for domestic market.
Sources: National Statistics Offices, OECD
Frequency: Monthly and quarterly
Seasonal adjustment: Only NSA data is available
PULP PRICE Woodpulp from Sweden, softwood, sulphate, bleached, air-dry weight, CIF North Sea ports. The
price is in nominal US dollars. Data is not country specific, so in “Geographies selection” select
“World” to view data.
Source: World Bank
Frequency: Monthly and quarterly
Seasonal adjustment: Only NSA data is available
REAL GDP GROWTH Percentage change in GDP at constant prices.
Sources: National Statistics Offices, Eurostat, OECD, IMF
Frequency: Quarterly
Seasonal adjustment: Both SA and NSA data is available
RED CHILI PRICE Average spot price of dried ripe fruits or pods of the Capsicum annum L & Capsicum frutescens L
of bright red colour, not less than 4 cm in length with acceptable level of moisture up to 11%, foreign
matter up to 1%, damaged fruits up to 3.5%, loose seeds 0.9%, unripe fruits up to 1.9% and insect
damaged matter up to 1%, Chilli Teja Guntur exclusive of Sales Tax/VAT. The price is in nominal US
dollars. Data is not country specific, so in “Geographies selection” select “World” to view data.
Source: NCDEX (National Commodity and Derivatives Exchange Limited)
Frequency: Monthly and quarterly
Seasonal adjustment: Only NSA data is available
REGULATORY TIER 1 CAPITAL TO RISK-WEIGHTED ASSETS The ratio measures the capital adequacy of deposit takers based on the core capital concept of
the Basel Committee on Banking Supervision. Tier 1 capital is the numerator and comprises paid-up
shares and common stock—issued and fully paid ordinary shares/common stock and perpetual
noncumulative preference shares—and disclosed reserves created or increased by appropriations of
retained earnings or other surplus. Sector-wide risk-weighted assets are the denominator and
include currency and deposits, loans, securities, and other on-balance-sheet assets. Assets are
weighted by factors representing their credit riskiness and potential for default.
Source: International Monetary Fund
Frequency: Quarterly
Seasonal adjustment: Both SA and NSA data is available
RESIDENTIAL REAL ESTATE LOANS TO TOTAL LOANS Residential Real Estate Loans to Total Loans is an asset quality ratio, which is intended to identify
deposit takers’ exposure to the residential real estate sector, with the focus on household borrowers.
A high concentration of the loan portfolio in real estate signals the potential existence of an important
vulnerability in the financial system.
Source: International Monetary Fund
Frequency: Quarterly
Seasonal adjustment: Both SA and NSA data is available
RETAIL SALES INDEX Retail trade represents a form of trade in which the goods are purchased in small quantities for
direct consumption by the purchaser. Retail sales index measures the turnover of the country’s retail
trade industry. Retail trade includes the activities of ISIC Rev. 4 Division 47 (Retail trade, except of

motor vehicles and motorcycles). This corresponds to the NACE Rev. 2 Division 47 (Retail trade,
except of motor vehicles and motorcycles). The index is available in both nominal and real terms.
Sources: National Statistics Offices, Eurostat, OECD
Frequency: Monthly and quarterly
Seasonal adjustment: Both SA and NSA data is available
RICE PRICE Thailand, 5% broken, white rice (WR), milled, indicative price based on weekly surveys of export
transactions, government standard, f.o.b. Bangkok. The price is in nominal US dollars. Data is not
country specific, so in “Geographies selection” select “World” to view data.
Source: World Bank
Frequency: Monthly and quarterly
Seasonal adjustment: Only NSA data is available
RUBBER PRICE Rubber (any origin), Ribbed Smoked Sheet (RSS) no. 1, in bales, Rubber Traders Association
(RTA), spot, New York. The price is in nominal US dollars. Data is not country specific, so in
“Geographies selection” select “World” to view data.
Source: World Bank
Frequency: Monthly and quarterly
Seasonal adjustment: Only NSA data is available
SALMON PRICE Fresh Norwegian salmon, farm bred, export price. The price is in nominal US dollars. Data is not
country specific, so in “Geographies selection” select “World” to view data.
Source: Statistics Norway
Frequency: Monthly and quarterly
Seasonal adjustment: Only NSA data is available
SILVER PRICE UK, 99.9% refined, London afternoon fixing. Data is not country specific, so in “Geographies
selection” select “World” to view data.
Source: World Bank
Frequency: Monthly and quarterly
Seasonal adjustment: Only NSA data is available
SOFT LOGS PRICE Average export price of Douglas-fir, Western hemlock and other softwoods exported from
Washington, Oregon, Northern California and Alaska. The price is in nominal US dollars. Data is not
country specific, so in “Geographies selection” select “World” to view data.

Source: International Monetary Fund
Frequency: Monthly and quarterly
Seasonal adjustment: Only NSA data is available
SOFT SAWNWOOD PRICE Soft sawnwood, average export price of Douglas Fir, U.S. Price. The price is in nominal US
dollars. Data is not country specific, so in “Geographies selection” select “World” to view data.
Source: International Monetary Fund
Frequency: Monthly and quarterly
Seasonal adjustment: Only NSA data is available
SOYBEANS PRICE Soybeans (United States), c.i.f. Rotterdam. The price is in nominal US dollars. Data is not country
specific, so in “Geographies selection” select “World” to view data.
Source: World Bank
Frequency: Monthly and quarterly
Seasonal adjustment: Only NSA data is available
STEEL PRICE, CHINA 5mm thick x 1200-1500mm wide hot-rolled band with a carbon component of 0.08% to 0.13%
price in China, ex-works. The price is in nominal US dollars. Select “World” in “Geographies
selection” to view data.
Source: SteelBenchmarker
Frequency: Monthly and quarterly
Seasonal adjustment: Only NSA data is available
STEEL PRICE, USA 5mm thick x 1200-1500mm wide hot-rolled band with a carbon component of 0.08% to 0.13%
price in the USA, FOB mill. The price is in nominal US dollars. Select “World” in “Geographies
selection” to view data.
Source: SteelBenchmarker
Frequency: Monthly and quarterly
Seasonal adjustment: Only NSA data is available
STEEL PRICE, WESTERN EUROPE 5mm thick x 1200-1500mm wide hot-rolled band with a carbon component of 0.08% to 0.13%
price in Germany/France, ex-works. The price is in nominal US dollars. Select “World” in
“Geographies selection” to view data.
Source: SteelBenchmarker
Frequency: Monthly and quarterly
Seasonal adjustment: Only NSA data is available

STOCK MARKET INDEX Stock market index is a hypothetical basket of securities designed to summarize the performance
of stocks market. Usually all indexes are chain-linked, meaning that they are always calculated
based on the price level of the previous trading day. The indexes are market weighted, calculated
based on the change in the total market value from one point in time to another of all the shares
included in the index. The figure for a certain time period refers to an average of daily data for that
period. For country-specific index names see section 8.
Source: national stock exchanges, OECD
Frequency: Monthly and quarterly
Seasonal adjustment: Only NSA data is available
STRAWBERRY PRICE USA, fresh market, FOB price. The price is in nominal US dollars. Data is not country specific, so
in “Geographies selection” select “World” to view data.
Source: United States Department of Agriculture
Frequency: Monthly and quarterly
Seasonal adjustment: Only NSA data is available
SUGAR PRICE, EUROPEAN UNION European Union negotiated import price for raw unpackaged sugar from African, Caribbean and
Pacific (ACP) under Lome Conventions, c.I.f. European ports. The price is in nominal US dollars.
Select “World” in “Geographies selection” to view data.
Source: World Bank
Frequency: Monthly and quarterly
Seasonal adjustment: Only NSA data is available
SUGAR PRICE, USA United States, nearby futures contract, c.i.f. The price is in nominal US dollars. Select “World” in
“Geographies selection” to view data.
Source: World Bank
Frequency: Monthly and quarterly
Seasonal adjustment: Only NSA data is available
SUGAR PRICE, WORLD International Sugar Agreement (ISA) daily price, raw, f.o.b. and stowed at greater Caribbean
ports. The price is in nominal US dollars. Select “World” in “Geographies selection” to view data.
Source: World Bank
Frequency: Monthly and quarterly
Seasonal adjustment: Only NSA data is available

TEA PRICE Mombasa/Nairobi auctions, African origin, all tea, arithmetic average of weekly quotes. The price
is in nominal US dollars. Data is not country specific, so in “Geographies selection” select “World” to
view data.
Source: World Bank
Frequency: Monthly and quarterly
Seasonal adjustment: Only NSA data is available
TIN PRICE London Metal Exchange, refined, 99.85% purity, settlement price. The price is in nominal US
dollars. Data is not country specific, so in “Geographies selection” select “World” to view data.
Source: World Bank
Frequency: Monthly and quarterly
Seasonal adjustment: Only NSA data is available
TOBACCO PRICE Tobacco of any origin, unmanufactured, general import price in the USA, CIF. The price is in
nominal US dollars. Data is not country specific, so in “Geographies selection” select “World” to view
data.
Source: World Bank
Frequency: Monthly and quarterly
Seasonal adjustment: Only NSA data is available
TOTAL GROSS LOANS Total gross loans include those financial assets created through the direct lending of funds by a
creditor to a debtor through an arrangement in which the lender either receives no security
evidencing the transactions or receives a non-negotiable document or instrument. Collateral, in the
form of either a financial asset (such as a security) or nonfinancial asset (such as land or a building),
may be provided under a loan transaction, though it is not an essential feature. Loans include
commercial loans, instalment loans, hire-purchase credit, loans to finance trade credit and
advances, financial leases, repurchase agreements not classified as a deposit, and overdrafts.
Source: International Monetary Fund
Frequency: Quarterly
Seasonal adjustment: Both SA and NSA data is available
TOTAL PRECIPITATION Total precipitation amount for the period in millimetres.
Sources: NOAA NCEI (National Oceanic and Atmospheric Administration's National Centers for
Environmental Information), Weatherbase
Frequency: Monthly and quarterly
Seasonal adjustment: Only NSA data is available
TRADE BALANCE Exports of goods minus Imports of goods.
Sources: Customs Departments, National Statistics Offices, OECD, IMF
Frequency: Monthly and quarterly
Seasonal adjustment: Both SA and NSA data is available
TURMERIC PRICE Average spot price of primary or secondary rhizomes of Curcuma Longa L of minimum length of 3
cm, which were soaked in boiling water and dried, with acceptable level of moisture up to 12%,
damage from moisture or over boiling up to 1.2%, not boiled matter up to 0.3%, foreign matter up to
0.75%, bulbs up to 3% and free of fungus, ex warehouse Nizamabad exclusive of Sales Tax/VAT.
The price is in nominal US dollars. Data is not country specific, so in “Geographies selection” select
“World” to view data.
Source: NCDEX (National Commodity and Derivatives Exchange Limited)
Frequency: Monthly and quarterly
Seasonal adjustment: Only NSA data is available
UNEMPLOYMENT RATE The number of unemployed persons expressed as a percentage of the total economically active
population (the total number of people employed plus unemployed). The ILO international standard
definition of unemployment is based on the following three criteria which should be satisfied
simultaneously: "without work", "currently available for work" and "seeking work". Accordingly: The
unemployed comprise all persons above a specific age who during the reference period were: (a)
"without work", i.e. were not in paid employment or self-employed; (b) "currently available for work",
i.e. were available for paid employment or self-employment during the reference period, and (c)
"seeking work", i.e. had taken specific steps in a specified reference period to seek paid employment
or self-employment.
Sources: National Statistics Offices, Eurostat, OECD, IMF
Frequency: Monthly and quarterly
Seasonal adjustment: Both SA and NSA data is available
UNIT LABOUR COST INDEX Unit labour costs measure the average cost of labour per unit of output and are calculated as the
ratio of total labour costs to labour productivity. Unit labour costs represent a direct link between
productivity and the cost of labour used in generating output. A rise in an economy’s unit labour
costs represents an increased reward for labour’s contribution to output. However, a rise in labour
costs higher than the rise in labour productivity may be a threat to an economy's cost
competitiveness, if other costs are not adjusted in compensation.
Sources: OECD
Frequency: Quarterly
Seasonal adjustment: Both SA and NSA data is available
USUAL/ACTUAL WEEKLY WORKING HOURS Actual weekly working hours are the number of hours actually worked during the reference week,
including overtime but excluding meal breaks and hours paid for but not worked (e.g. paid annual
leave, paid sick leave, public holidays etc.). Usual weekly working hours are the modal value of
hours actually worked per week over a long reference period.
The difference between the concepts of usual and actual working hours is that usual hours refer to
the typical hours worked over a week, while actual hours represent the exact number of hours
worked over a week. Both usual and actual working hours refer to total employment (both full-time
and part-time) in all the industry sectors.
Sources: National Statistics Offices, Eurostat
Frequency: Quarterly
Seasonal adjustment: Only NSA data is available
WAGE PER HOUR Wages per hour refer to remuneration paid per hour worked to employees, together with overtime
payments, premiums, bonuses, allowances and remuneration for time not worked, such as for
annual vacation, other paid leave or holidays. Wage data exclude employers’ contributions in
respect of their employees paid to social security and pension schemes and also the benefits
received by employees under these schemes. Wages also exclude severance and termination pay.
Wages relate to employees’ gross remuneration, i.e. the total before any deductions are made by
the employer in respect of taxes, contributions of employees to social security and pension
schemes, life insurance premiums, union dues and other obligations of employees. Data for total
economy and manufacturing sector is available.
Sources: National Statistics Offices, ILOSTAT
Frequency: Monthly and quarterly
Seasonal adjustment: Both SA and NSA data is available
WHEAT PRICE United States, no. 1, hard red winter, ordinary protein, export price delivered at the US Gulf port
for prompt or 30 days shipment. The price is in nominal US dollars. Data is not country specific, so in
“Geographies selection” select “World” to view data.
Source: World Bank
Frequency: Monthly and quarterly
Seasonal adjustment: Only NSA data is available
WOOL PRICE Australian Wool Exchange, Eastern Market Indicator monthly average. The price is in nominal US
dollars. Data is not country specific, so in “Geographies selection” select “World” to view data.
Source: Australian Wool Innovation Limited
Frequency: Monthly and quarterly
Seasonal adjustment: Only NSA data is available

ZINC PRICE London Metal Exchange, high grade, minimum 99.95% purity, settlement price. The price is in
nominal US dollars. Data is not country specific, so in “Geographies selection” select “World” to view
data.
Source: World Bank
Frequency: Monthly and quarterly
Seasonal adjustment: Only NSA data is available
SEASONAL ADJUSTMENT Seasonal adjustment is a statistical technique to remove the effects of seasonal calendar
influences impacting on a series. Seasonal effects usually reflect the influence of the seasons
themselves either directly (e.g. there is less construction in winter) or through social conventions
(e.g. moving holidays such as Easter and Eid have an impact on working days and Christmas has a
huge impact on retail sales). For the datasets that include countries with missing seasonally
adjusted data, we model the missing series using STL/X-12 seasonal decomposition procedures. To
correctly detect and remove the seasonal component, the decomposition procedures are not
implemented if the time series is shorter than 3 years.
POINT INCREASE Simple arithmetic increase over previous period, or same period of previous year.
GROWTH RATES Growth rates and indices for the following datasets are calculated in national currency and in
current/nominal terms: Current Account Balance; Exports; Exports of Goods and Services; Foreign
Exchange Reserves; GDP; Government Expenditure; Government Final Consumption Expenditure;
Government Net Lending/Borrowing; Government Revenue; Gross Fixed Capital Formation; Gross
Loans to Nonfinancial Corporations; Household Debt; Imports; Imports of Goods and Services;
Increases in Stocks; International Reserves; Market Capitalisation; Money Supply; Private Final
Consumption Expenditure; Total Gross Loans; Trade Balance; Wage per Hour and Wage per Hour,
Manufacturing. Growth rates and indices for all commodity prices are calculated in current/nominal
US$.

4. FORECASTING METHODOLOGY
Our short-term forecasts are a combination of model-based projections and qualitative input.
Depending on the series, the country-specific forecasts are produced using either the Euromonitor
Macro Model, Vector Error Correction Model or univariate time series methods. The commodity
prices are forecasted using a semi-structural econometric model. The obtained results are then
checked against the additional economic information gathered from a network of our in-country
experts. In addition, certain restrictions are imposed to ensure internal consistency of the forecasts.
I. EUROMONITOR MACRO MODEL Euromonitor Macro Model (EMM) is a small generic open economy model that describes the joint
determination of output, unemployment, inflation, short-term interest rate and exchange rate for a
group of economies. The model is fundamentally a gap model, in which the gaps of the variables
from their equilibrium values play the crucial role in the functioning of the system. A number of
definitions and identities are used to complete the model. There could be some specific differences
in model structure for various countries, e.g. incorporation of the US Bank Lending Tightening
variable to the US output gap equation, fixed exchange rate policy structures, etc., however the
basic model equations are the same for all covered countries.
Country coverage:
Africa and Middle East: Egypt, Iran, Israel, Saudi Arabia, South Africa, Vietnam;
Asia Pacific: China, Hong Kong, India, Indonesia, Japan, Kazakhstan, Malaysia, Pakistan,
Singapore, South Korea, Taiwan, Thailand;
Australasia: Australia, New Zealand;
Eastern Europe: Bulgaria, Croatia, Czech Republic, Estonia, Hungary, Latvia, Lithuania, Poland,
Romania, Russia, Slovakia, Ukraine;
Western Europe: Austria, Belgium, Denmark, Finland, France, Germany, Greece, Ireland, Italy,
Netherlands, Norway, Portugal, Slovenia, Spain, Sweden, Switzerland, Turkey, United Kingdom;
Latin America: Argentina, Brazil, Chile, Colombia, Mexico, Peru;
North America: Canada, USA.
Forecasted indicators:
Real GDP growth;
Index of consumer prices/inflation;
Unemployment rate;
Central bank policy rate.
II. VECTOR ERROR CORRECTION MODEL Many economic variables exhibit persistent upward or downward movement. This feature can be
generated by stochastic trends in integrated variables. If the same stochastic trend is driving a set of
integrated variables jointly, they are called cointegrated. In this case certain linear combinations of
integrated variables are stationary. Such linear combinations that link the variables to a common
trend path are called cointegrating relationships. They sometimes may be interpreted as equilibrium
relationships in economic models.
Cointegrating relationships can be imposed by reparameterizing the VAR model as a vector error
correction model (VECM). We use the VECM approach to forecast a set of variables with a long-
term equilibrium relationship: GDP expenditure components. In addition, several auxiliary indicators
are forecasted in the same framework.
The VECM approach forecasts all GDP expenditure components simultaneously, including the
relations between variables and making an assumption that there is a long-term equilibrium equation
which insures short-term shocks will be eliminated in the long run. Subsequently, Government
Expenditure is forecasted using an autoregressive model with exogenous regressors. The main
regressor is Government Final Consumption Expenditure from GDP expenditure component model.
Next, Government Net Lending/Borrowing is forecasted as % of GDP using time series models with
quarter-on-quarter growth. Finally, Government Revenue is calculated from Government
Expenditure and Government Net Lending/Borrowing. In addition, Actual Weekly Working Hours are
calculated using time series models; Usual Weekly Working Hours are forecasted as a ratio of
Actual Weekly Working Hours using linear regression.
III. ARIMA MODELS We use ARIMA forecasting method to find the most appropriate models for the rest of economic
indicators (not forecasted under EMM or VECM frameworks), forecast them and check whether the
obtained forecasts are reliable.
For each country-economic indicator combination, a suitable ARIMA model is selected and the
forecasts are generated using the selected model.
Data pre-processing
Each economic indicator usually has several units (level, growth, index etc.). All these units can
be derived from each other. We forecast only one unit and forecasts for all other units (of the same
economic indicator) are derived accordingly. Some economic indicators are derived from other
indicators (e.g. Trade Balance); in that case, we derive the forecast for such indicators from
corresponding indicators using the original relationships. This way data integrity is ensured.
To improve the reliability of forecasts, the indicators starting after Q1 2008 (for quarterly time
series)/M1 2010 (for monthly time series) are not forecasted.
Model selection
ARIMA models are very flexible and particularly suitable for short-term forecasting of economic
indicators. For each country-economic indicator combination multiple ARIMA models are fitted and
then one model is chosen according to the following criteria:
The model has to have high AIC and BIC value. AIC and BIC are correspondingly Akaike
and Bayesian information criteria. These criteria are measures of the relative goodness of fit of a
statistical model.
The model must reasonably satisfy the theoretical assumptions of the ARIMA model.
The model must be non-trivial, simple random walks are not used for forecasting.
Forecast validation Checking model and forecast reliability
The selected model is tested to ensure reliability. First, the model coefficient stability is tested.
This is done by sequentially dropping observations from the end of the data sample and re-
estimating the model. The idea is that if we selected the true model which represents the data,
removal of few observations should not result in major changes in the coefficients.
We also test model forecasting performance. This is done by dividing the available data for
economic indicator into test and train parts. The model is estimated using only the test data, then
forecasts are generated and they are compared to the train data. The division is done to simulate
real forecasting exercise, i.e. the splitting of the data is done at some time period. The train data is
the data before that period and the test data is the data after the period. If, for example, the
economic indicator is of monthly frequency, then the test data covers up to 12 last months. Having
calculated the forecasts for the test data we calculate MAPE – mean average percentage error and
MASE – mean average scaled error. In case where the original data is measured in percent, MAE –
mean average absolute error – is used instead of MAPE.
For some economic indicators, the long-run averages and ranges are known from economic
theory or from research. In these cases we check whether long-term forecasts of chosen models
conform to these averages and ranges.
Finally, we check our forecasts against the economic evidence gathered by a team of in-country
experts in order to see the range of our predictions in the context of other sources.
Iterative procedure
All model selection and validation procedures are done iteratively. If selected model fails any of
the checks, the data is investigated for outliers and other irregularities. Then depending on the
situation, measures are taken to fix it. Usually a failure to pass one or another criterion is unique to
each separate case. The most effective fixes are changing the historical period for model selection,
changing the unit of the indicator which is used for forecasting and changing seasonality modelling.
Note on seasonality
When data indicates the presence of seasonality, it is either directly modelled via an extension of
ARIMA, SARIMA, or the seasonal component is removed using industry-standard algorithms
(STL/X-12 seasonal decomposition procedures). To correctly detect and remove the seasonal
component, the decomposition procedures are not implemented if the time series is shorter than 3
years.

Data post-processing
It is common that some economic indicators are interrelated. After producing forecasts, we
calculate pairwise correlations of all the economic indicators for all countries for historical data and
for historical data coupled with forecasts, and check the results to ensure that the correlations did
not change drastically.
IV. COMMODITY FORECASTS In order to forecast commodity prices and price indices, we have developed an economic model
that is useful for assessing and quantifying major economic drivers behind commodity price trends:
We develop an economic model in a sense that the model consists of a coherent system of
economic relationships among commodity price indices and explanatory economic variables.
Our analysis focuses on development of a structural econometric model for a group of commodity
indices (namely energy, metals, food, agricultural raw materials and beverages) compiled and
published on a monthly basis by the World Bank.
The purpose of the model is its use for short-term commodity price forecasts. The forecasting
process requires making projections of explanatory macroeconomic and financial variables and
running the current model to obtain conditional commodity price forecasts.
The model explains in-sample dynamics and produces forecasts of several quite broad commodity
price indices. The output of the model is further used in ARIMA statistical models designed
specifically for individual commodities.
Some specific economic ideas applied in the model
A number of economic ideas are utilised in developing the model:
Relative prices of different commodity groups exhibit certain regularities that could be successfully
exploited in commodity price modelling. There is a well-known economic rationale behind the
correlation among different commodity prices.
Given the recently increased correlation among price movements of different commodity groups, it
is clear that commodity groups are strongly affected by common (systemic) factors emanating from
the macroeconomic and financial sphere.
Commodity groups are also affected by specific (idiosyncratic) factors, such as supply or demand
indicators for a specific commodity group. Some of such factors are conveniently included in
regressions for certain commodity groups. However, in many cases such factors cannot be easily
incorporated in the quantitative analysis due to lack of timely data of sufficient regularity.
Indicators obtained from commodity futures markets reflect market expectations and in some
cases contain useful information content that can improve regressions for some commodity groups.
Commodity groups are explicitly modelled as constituents of the commodity complex (the broad
index), which is thus an endogenous variable in the model but also impacts prices of constituent
commodity groups. This bi-directional relation enhances internal consistency of the model.
Basic modelling framework
In creating the model, we try to exploit the existing correlations among different commodity prices.
In order to avoid modelling an excessive number of pair-wise correlations, we examine the
relationship between each commodity group and the broad commodity index (thus we have only 5
pair-wise relationships in our case).

We find the standard econometric error-correction modelling technique particularly useful for
modelling fundamentals of commodity prices. Error-correction models are usually estimated in two
phases: at first the long-term, or equilibrium, relationships among variables are determined and then
short term deviations from long-term trends are examined.
The basic structure of the current error-correction type model is as follows:
Long-run relationship for commodity group i:
Long-run trend for commodity price index i is a function of:
Broad index excluding commodity index i
Systemic factors
Idiosyncratic factors
Short-run relationship for commodity group i:
Change in commodity price index i is a function of:
Last period’s deviation from the long-run trend
Changes in systemic factors
Changes in idiosyncratic factors
Slopes of the futures curve from earlier periods
Broad commodity price index is sum of individual weighted indices i.
In the above description i stands for energy, metal, food, agricultural materials, and beverages. All
of the equations are included in a unified model, which predicts endogenous commodity indices for
given values of exogenous variables.
Outcomes of model solution
The relationships outlined above are estimated for each commodity index over the sample from
1992M01 to the latest month by simple ordinary least squares estimation method. They are
combined together in one econometric model, which is then dynamically solved.
After the forecasts for each commodity index are obtained, individual commodity prices are
predicted by running a suitable ARIMAX model with 5 commodity indices used as regressors.
Estimated paths for commodity price indices can be interpreted as commodity fundamentals based
on the current model, and large positive deviations of actual commodity prices from estimated
fundamentals may be indicative of commodity bubble formation.

5. BUSINESS CONFIDENCE INDICES: METHODOLOGY & SOURCES
AUSTRALIA
Name of survey
Monthly Business Survey
Source
National Australia Bank
Frequency
Monthly
Scope
The sample consists of 400-500 firms in non-farm sector.
Survey questions
Not available
Index construction
The index values range from -100 (when all respondents have negative confidence) to +100
(when all respondents have positive confidence).
AUSTRIA
Name of survey
Joint Harmonised EU Programme of Business and Consumer Surveys
Source
European Commission; Directorate-General for Economic and Financial Affairs (DG ECFIN)
Frequency
Monthly
Scope
Random sample of 925 firms in manufacturing sector. Firms on the frame list are contacted on a
regular basis and are asked whether they are willing to participate.
Survey questions
The industry survey is largely qualitative. The main questions refer to an assessment of recent
trends in production, of the current levels of order books and stocks, as well as expectations about
production, selling prices and employment. For qualitative questions, answers are usually given
according to a three-option ordinal scale: “increase” (+), “remain unchanged” (=), “decrease” (-); or

“more than sufficient” (+), “sufficient” (=), “not sufficient” (-); or “too large” (+), “adequate” (=), “too
small” (-). In some cases, respondents have the choice between four, five or six options.
Index construction
On the basis of the distribution of the various options for each question, aggregate balances are
calculated for each question. Balances are the difference between positive and negative answering
options, measured as percentage points of total answers. In particular, if a question has three
alternative options, “positive” (“up”, “more”, “more than sufficient”, “good”, “too large”, “increase”,
“improve”, etc.), “neutral” (“unchanged”, “as much”, “sufficient”, “satisfactory”, “adequate”, etc.) and
“negative” (“down”, “less”, “not sufficient”, “too small”, “decline”, etc.), and if P, E and M (with P+E+M
= 100) denote the percentages of respondents having chosen respectively the option positive,
neutral, and negative, the balance is calculated as
B = P - M
In the case of questions with six options, i.e. the three options above plus “very positive” (“got/get
a lot better”, “very much higher”, “increase sharply”, etc.), “very negative” (“got/get a lot worse”, “very
unfavourable”, “fall sharply”, etc.) and “don’t know”, the balances are calculated on the basis of
weighted averages. If P, E and M have the same meaning as in the previous paragraph, while PP
denotes the percentage of respondents having chosen the option “very positive”, MM the percentage
of respondents having chosen the option “very negative” and N is the percentage of respondents
without any opinion (so that PP+P+E+M+MM+N=100), balances are calculated as
B = (PP + 1⁄2 P) - (1⁄2 M + MM)
The balance values range from -100, when all respondents choose the negative option (or the
most negative one in the case of six option questions) to +100, when all respondents choose the
positive (or the most positive) option.
The industrial confidence indicator is the arithmetic average of the balances (in percentage points)
of the answers to the questions on production expectations, order books and stocks of finished
products (the last with inverted sign).
BELGIUM
Name of survey
Business Survey
Source
National Bank of Belgium
Frequency
Monthly
Scope
The sample consists of the same 6000 firms in industry, building, trade and business-related
services.
Survey questions
The qualitative questions concern subjects such as production, order books, employment and
prices. They centre on three main aspects. Businesses are first questioned about the latest
developments: has there been an increase, a decrease, or no change? Next, businesses are asked
to assess each reported change: is it normal, greater than normal or less than normal? Finally,
business leaders indicate what trend they expect to see in the next three months.
Index construction
The responses of each firm form the basis for calculating, for each question, the percentage of
business leaders reporting improvement (positive responses), the percentage reporting deterioration
(negative responses) and the percentage stating that there has been no change. In calculating these
three percentages, account is taken of the relative importance of each firm within each activity
covered by the surveys. The results for each firm (individual results) are then aggregated on the
basis of the value added of each activity. For each aggregation level, a balance is determined for
each question: this is the difference between the percentage of firms reporting improvement
(positive responses) and the percentage reporting deterioration (negative responses). For example,
if the number of positive responses equals the number of negative responses the balance for the
question is zero; conversely, a balance of +10 means that positive responses outnumbered negative
responses by 10 percentage points.
Each balance is then adjusted for seasonal variations. After that, a synthetic indicator is calculated
for each sector and for each branch of activity by finding the arithmetical mean of the seasonally
adjusted balances of the responses to all the questions, except those concerning prices. The overall
synthetic curve is the weighted average of the synthetic indicators for industry, building and trade.
Weights are: 65% - manufacturing industry, 15% - building industry, 5% - trade, 15 - business-
related services.
The index values range from -100 (when all respondents have negative confidence) to +100
(when all respondents have positive confidence).
BRAZIL
Name of survey
Industrial Confidence Survey
Source
National Confederation of Industry Brazil
Frequency
Monthly
Scope
Random sample of firms in industrial sector
Survey questions
The index is built on four basic questions concerning current and expected conditions of the
general economy and current and expected conditions of the company.
Index construction
The ICEI is an indicator of diffusion ranging from 0 to 100, with 50 representing neutral
confidence. For each industry sector, initial indicators for each of the four basic questions are

calculated. Each question allows five exclusive alternatives. Each alternative is given a weight of
0.0, 0.25, 0.50, 0.75, and 1.0 (from the most negative to the most positive respectively). The
indicator for each question is the average of these scores, weighted by the relative frequency of
response. The total confidence index is a weighted average of all the indicators, with weights based
on the company size.
BULGARIA
Name of survey
Business Survey in Industry
Source
National Statistical Institute of Bulgaria
Frequency
Monthly
Scope
Stratified sample of the enterprises in the industry sector
Survey questions
The first type of questions of business surveys is related to the present or expected direction of
change of economic variables such as production, competitive position on the market, selling prices,
etc. The replies are presented in a three-option ordinal scale formulated as follows: “Increase”, “No
change”, “Decrease” or “Improve”, “No change”, “Deteriorate”.
The second type of questions is related to the level of the economic variable compared to an ideal
level called “normal”, “sufficient”, “satisfying for the season”. In the same manner are formulated the
replies: “Above normal”, “Normal”, “Below normal” or “More than sufficient”, “Sufficient”, “Not
sufficient”, etc.
The third type of questions as an exception requires quantitative information as for example the
percent of the enterprise’s capacity utilization, where the replies are tabulated as “from” and “to” a
certain percent. Another quantitative question is related to the production assurance with orders
measured in number of months. The investment inquiry in industry also gathers quantitative
information about the investment plans of industrial enterprises.
Index construction
In order to use the variables from the business survey as short-term economic indicators, it is
necessary to transform the qualitative replies into quantitative indicators. The indicator which is
perceived as the most appropriate is called the balance of opinions. This indicator is a function of the
shares (percentages) of different variants of replies (P – positive (+), E – neutral (=), and M –
negative (-)), i.e.:
B = 1 x (P)% + 0 x (E)% - 1 x (M)%
The index values range from -100 (when all respondents have negative confidence) to +100
(when all respondents have positive confidence).
CANADA
Name of survey
Index of Business Confidence
Source
The Conference Board of Canada
Frequency
Quarterly
Scope
Approximately 1,500 Canadian business organizations
Survey questions
1. Do you expect overall economic conditions in Canada six months from now to be better, same or worse?
2. Do you expect prices, in general, in Canada to increase over the next six months at an annual rate of how many percent?
3. Over the next six months, do you expect your firm's financial position to improve, worsen or remain the same?
4. Over the next six months, do you expect your firm's profitability to improve, worsen or remain the same?
5. Would you say the present is a good or a bad time to undertake expenditures to expand your plant or add to your stock of machinery and equipment?
6. What change in the level of your capital investment expenditures do you expect over the next 6 months?
7. In which region(s) of the country do you expect the bulk of your planned investment expenditures for the next six months to take place?
8. How do you assess your current level of operations relative to optimal capacity?
Index construction
Not available
CHILE
Name of survey
Business Confidence Survey
Source
Instituto Chileno de Administración Racional de Empresas (ICARE)
Frequency
Monthly
Scope
A panel of approximately 600 business executives from manufacturing, mining, construction and
trade industries
Survey questions
The questions include present and future view on general business conditions, production trend,
demand, inventory levels and employment situation.
Index construction
Confidence indicator generated by the survey is constructed from the response balances based
on the percentage of answers ("favourable", "unfavourable" and "neutral"). The balance of
responses is constructed as the difference between the percentage of favourable and unfavourable
responses, so that such balances are contained in the interval [-100; 100]. The balances are
presented in the form of diffusion rates, adding 100 to each balance and dividing the result by two.
This transformation allows all indicators to have positive values in the range [0; 100], with 50 being
the "neutral barrier." The total index is a weighted average of four sector-specific confidence
indicators (manufacturing, mining, construction, trade), with the weights corresponding to the share
of each sector in GDP.
CHINA
Name of survey
Business Climate Index
Source
National Bureau of Statistics of China
Frequency
Quarterly
Scope
The survey covers eight sectors: industry, construction, wholesale and retail trade, transportation,
storage and postal services, hotel and catering industry, information transmission, software and IT
services, real estate, and social services. The national total sample size is approximately 21,000
enterprises.
Survey questions
Survey involves questions on the business running, enterprises operation, profitability,
employment, investment, financing, inventory and other production and management problems.
Index construction
Business Climate Index = 0.4 × Current BCI + 0.6 × Expected BCI
Current BCI = the proportion of “positive” answers regarding the operating conditions in the
current quarter - the proportion of “negative” answers + 100
Expected BCI = the proportion of “positive” answers regarding the operating conditions in the next
quarter - the proportion of “negative” answers + 100
The index values range from 0 (when all respondents have negative confidence) to 200 (when all
respondents have positive confidence).
COLOMBIA
Name of survey
Business Opinion Survey
Source
Centro de Investigacion Economica y Social
Frequency
Monthly
Scope
Not available
Survey questions
Not available
Index construction
The index values range from -100 (when all respondents have negative confidence) to +100
(when all respondents have positive confidence).
COSTA RICA
Name of survey
Pulso Empresial
Source
Unión Costarricense de Camaras y Asociaciones del Sector Empresial Privado (UCCAEP)
Frequency
Quarterly
Scope
Covers companies in agriculture, services, tourism, commerce, construction, industry and
financial sectors
Survey questions
The questionnaires contain questions regarding the expected and running business tendencies:
assessment of economic situation, demand, stocks, expected development of activity and
employment. Questions are put in the form of evaluation scales, mostly with five possible
alternatives of answers such as improvement, constancy, worsening, and the like.
Index construction
Each response for each variable in each sector is assigned a value. The minimum value is equal
to 0 (the answer “worse”); the maximum value is equal to 10 (the answer “better”). After that the

weighted average is calculated in each sector. Business Confidence Index is calculated for separate
sectors and the whole economy as well.
CROATIA
Name of survey
Joint Harmonised EU Programme of Business and Consumer Surveys
Source
European Commission; Directorate-General for Economic and Financial Affairs (DG ECFIN)
Frequency
Monthly
Scope
A panel of 400 firms in manufacturing sector
Survey questions
The industry survey is largely qualitative. The main questions refer to an assessment of recent
trends in production, of the current levels of order books and stocks, as well as expectations about
production, selling prices and employment. For qualitative questions, answers are usually given
according to a three-option ordinal scale: “increase” (+), “remain unchanged” (=), “decrease” (-); or
“more than sufficient” (+), “sufficient” (=), “not sufficient” (-); or “too large” (+), “adequate” (=), “too
small” (-). In some cases, respondents have the choice between four, five or six options.
Index construction
On the basis of the distribution of the various options for each question, aggregate balances are
calculated for each question. Balances are the difference between positive and negative answering
options, measured as percentage points of total answers. In particular, if a question has three
alternative options, “positive” (“up”, “more”, “more than sufficient”, “good”, “too large”, “increase”,
“improve”, etc.), “neutral” (“unchanged”, “as much”, “sufficient”, “satisfactory”, “adequate”, etc.) and
“negative” (“down”, “less”, “not sufficient”, “too small”, “decline”, etc.), and if P, E and M (with P+E+M
= 100) denote the percentages of respondents having chosen respectively the option positive,
neutral, and negative, the balance is calculated as
B = P - M
In the case of questions with six options, i.e. the three options above plus “very positive” (“got/get
a lot better”, “very much higher”, “increase sharply”, etc.), “very negative” (“got/get a lot worse”, “very
unfavourable”, “fall sharply”, etc.) and “don’t know”, the balances are calculated on the basis of
weighted averages. If P, E and M have the same meaning as in the previous paragraph, while PP
denotes the percentage of respondents having chosen the option “very positive”, MM the percentage
of respondents having chosen the option “very negative” and N is the percentage of respondents
without any opinion (so that PP+P+E+M+MM+N=100), balances are calculated as
B = (PP + 1⁄2 P) - (1⁄2 M + MM)
The balance values range from -100, when all respondents choose the negative option (or the
most negative one in the case of six option questions) to +100, when all respondents choose the
positive (or the most positive) option.
The industrial confidence indicator is the arithmetic average of the balances (in percentage points)
of the answers to the questions on production expectations, order books and stocks of finished
products (the last with inverted sign).
CZECH REPUBLIC
Name of survey
Business Cycle Surveys
Source
Czech Statistical Office
Frequency
Monthly
Scope
Covers companies in industry, construction, trade and selected services sectors
Survey questions
The questionnaires contain questions regarding the expected and running business tendencies:
assessment of economic situation, demand, stocks, expected development of activity and
employment. Questions are put in the form of evaluation scales, mostly with three possible
alternatives of answers such as improvement, constancy, worsening, and the like.
Index construction
Evaluation of the results is made as a summary of the questions in individual alternatives; a clear
expression of tendencies is business cycle balance, which is the difference between the answers
“improvement” and “worsening” expressed in percent. The higher the positive balance of answers
the more optimistic is the evaluation of the answer obtained.
The business confidence indicator is a weighted average of seasonally adjusted confidence
indicators in industry, construction, trade and in selected services. The confidence indicator for
industry is the average of seasonally adjusted balances of three indicators (the assessment of total
demand, assessment of stocks of final production (with inverted sign) and the expected
development of production activity). The confidence indicator for construction is the average of two
indicators (the assessment of total demand and the expected development of employment). The
confidence indicator for trade is the average of three indicators (the assessment of economic
situation, assessment of stocks (with inverted sign) and the expected development of economic
situation). The confidence indicator for selected services is the average of three indicators (the
assessment of economic situation, the assessment of demand and expected demand).
The index values range from -100 (when all respondents have negative confidence) to +100
(when all respondents have positive confidence).
DENMARK
Name of survey
Industry Tendency Survey
Source
Statistics Denmark
Frequency
Monthly
Scope
The survey is based on returns from about 500 major manufacturing enterprises, representing just
over 50% of total employment in the sector and covering about 1,000 establishments (local units).
Survey questions
It is a characteristic feature of the method used that the management of the responding
enterprises should be able to answer the questions without any elaborate analysis, since they are
primarily requested to indicate by a checkmark whether a given economic variable, e.g. production is
up, largely unchanged or down for the survey period, compared to the preceding period. The
questions concern both future expectations and current judgment over the preceding period.
In answering other questions the responding enterprises are asked to measure, e.g. their stocks
of unfilled orders at the end of the period in relation to the normal situation. The respondents are
also requested to indicate any limits to total production activities, and if so, indicate the causes of
these.
Index construction
The results from each establishment are being weighted in relation to the size of employment of
the establishments. In distributing information over the groups of industries, the results are first
aggregated for establishments in the same industry group. Calculations are first made for some 35
industry groups. These are then weighted in relation to total employment for the groups and are then
distributed over 14 industry groups, 4 sectors and the total manufacturing industry.
The index values range from -100 (when all respondents have negative confidence) to +100
(when all respondents have positive confidence).
ECUADOR
Name of survey
Business Opinion Survey
Source
Banco Central del Ecuador
Frequency
Monthly
Scope
The survey covers a sample of companies in trade, construction, industrial and service sectors.

Survey questions
The questions cover present and expected situation with regard to business conditions, sales
volume, employment situation, selling prices, new orders etc.
Index construction
For each sector, the sum of the responses for each question is calculated, with each company’s
answer weighted by its share in total industry revenue. The total index is calculated as a weighted
average of all sector indicators, with weights assigned according to the share of each sector in the
Gross Domestic Product for year 2005.
ESTONIA
Name of survey
Joint Harmonised EU Programme of Business and Consumer Surveys
Source
European Commission; Directorate-General for Economic and Financial Affairs (DG ECFIN)
Frequency
Monthly
Scope
A panel of 275 firms in manufacturing sector
Survey questions
The industry survey is largely qualitative. The main questions refer to an assessment of recent
trends in production, of the current levels of order books and stocks, as well as expectations about
production, selling prices and employment. For qualitative questions, answers are usually given
according to a three-option ordinal scale: “increase” (+), “remain unchanged” (=), “decrease” (-); or
“more than sufficient” (+), “sufficient” (=), “not sufficient” (-); or “too large” (+), “adequate” (=), “too
small” (-). In some cases, respondents have the choice between four, five or six options.
Index construction
On the basis of the distribution of the various options for each question, aggregate balances are
calculated for each question. Balances are the difference between positive and negative answering
options, measured as percentage points of total answers. In particular, if a question has three
alternative options, “positive” (“up”, “more”, “more than sufficient”, “good”, “too large”, “increase”,
“improve”, etc.), “neutral” (“unchanged”, “as much”, “sufficient”, “satisfactory”, “adequate”, etc.) and
“negative” (“down”, “less”, “not sufficient”, “too small”, “decline”, etc.), and if P, E and M (with P+E+M
= 100) denote the percentages of respondents having chosen respectively the option positive,
neutral, and negative, the balance is calculated as
B = P - M
In the case of questions with six options, i.e. the three options above plus “very positive” (“got/get
a lot better”, “very much higher”, “increase sharply”, etc.), “very negative” (“got/get a lot worse”, “very
unfavourable”, “fall sharply”, etc.) and “don’t know”, the balances are calculated on the basis of
weighted averages. If P, E and M have the same meaning as in the previous paragraph, while PP
denotes the percentage of respondents having chosen the option “very positive”, MM the percentage
of respondents having chosen the option “very negative” and N is the percentage of respondents
without any opinion (so that PP+P+E+M+MM+N=100), balances are calculated as
B = (PP + 1⁄2 P) - (1⁄2 M + MM)
The balance values range from -100, when all respondents choose the negative option (or the
most negative one in the case of six option questions) to +100, when all respondents choose the
positive (or the most positive) option.
The industrial confidence indicator is the arithmetic average of the balances (in percentage points)
of the answers to the questions on production expectations, order books and stocks of finished
products (the last with inverted sign).
FINLAND
Name of survey
Joint Harmonised EU Programme of Business and Consumer Surveys
Source
European Commission; Directorate-General for Economic and Financial Affairs (DG ECFIN)
Frequency
Monthly
Scope
Random sample of 700 firms in manufacturing sector
Survey questions
The industry survey is largely qualitative. The main questions refer to an assessment of recent
trends in production, of the current levels of order books and stocks, as well as expectations about
production, selling prices and employment. For qualitative questions, answers are usually given
according to a three-option ordinal scale: “increase” (+), “remain unchanged” (=), “decrease” (-); or
“more than sufficient” (+), “sufficient” (=), “not sufficient” (-); or “too large” (+), “adequate” (=), “too
small” (-). In some cases, respondents have the choice between four, five or six options.
Index construction
On the basis of the distribution of the various options for each question, aggregate balances are
calculated for each question. Balances are the difference between positive and negative answering
options, measured as percentage points of total answers. In particular, if a question has three
alternative options, “positive” (“up”, “more”, “more than sufficient”, “good”, “too large”, “increase”,
“improve”, etc.), “neutral” (“unchanged”, “as much”, “sufficient”, “satisfactory”, “adequate”, etc.) and
“negative” (“down”, “less”, “not sufficient”, “too small”, “decline”, etc.), and if P, E and M (with P+E+M
= 100) denote the percentages of respondents having chosen respectively the option positive,
neutral, and negative, the balance is calculated as
B = P - M
In the case of questions with six options, i.e. the three options above plus “very positive” (“got/get
a lot better”, “very much higher”, “increase sharply”, etc.), “very negative” (“got/get a lot worse”, “very
unfavourable”, “fall sharply”, etc.) and “don’t know”, the balances are calculated on the basis of

weighted averages. If P, E and M have the same meaning as in the previous paragraph, while PP
denotes the percentage of respondents having chosen the option “very positive”, MM the percentage
of respondents having chosen the option “very negative” and N is the percentage of respondents
without any opinion (so that PP+P+E+M+MM+N=100), balances are calculated as
B = (PP + 1⁄2 P) - (1⁄2 M + MM)
The balance values range from -100, when all respondents choose the negative option (or the
most negative one in the case of six option questions) to +100, when all respondents choose the
positive (or the most positive) option.
The industrial confidence indicator is the arithmetic average of the balances (in percentage points)
of the answers to the questions on production expectations, order books and stocks of finished
products (the last with inverted sign).
FRANCE
Name of survey
Business Climate Survey
Source
National Institute of Statistics and Economics Studies
Frequency
Monthly
Scope
The survey covers manufacturing, construction, retail, wholesale and services industries in
metropolitan France.
Survey questions
The 26 balances of opinion that compose confidence index are:
• Manufacturing industry survey: general prospects, past production trend, expected production
trend, stock levels, foreign order books, overall order books
• Services survey: past turnover trend, expected turnover trend, general prospects, expected
demand, past operating income trend, expected operating income trend
• Building survey: past activity trend, expected activity trend, level of order books, past workforce
trends, production capacity utilization
• Retail survey: overall order books, general prospects, past sales trend, expected staffing trend
• Wholesale trade survey: past sales trend, past foreign sales trend, ordering intentions, general
prospects, deliveries received from abroad
Index construction
The business climate indicator describes the common component of the selected balances of
opinion in a single variable. It is constructed using factor analysis techniques. This makes it possible
to summarise the concomitant trends of several variables whose movements are highly correlated.
Changes in the business climate composite indicator summarize the cyclical phase affecting the
different balances of opinion from the tendency surveys: the higher its value, the more industrialists
consider the outlook to be favourable.

The methodology used is based on a representation in the form of an unobserved components
model: in each month t, each balance of opinion is expressed as the sum of two unobserved
components, a term proportional to the common factor and a component specific to the balance of
opinion considered, also known as the residual. The index is standardized to have a mean of 100
and a standard deviation of 10.
GEORGIA
Name of survey
ISET Business Confidence Survey
Source
ISET Policy Institute
Frequency
Quarterly
Scope
Business confidence for Georgia is measured by seven sector-specific indices focusing on 1)
services, 2) retail trade, 3) agriculture, 4) manufacturing industry, 5) financial service 6) construction
and 7) other sectors. For each sector, confidence is measured through a simple survey instrument
targeted at top business executives.
Survey questions
Business confidence index is calculated as a weighted average of the balances induced from all
the answers about production/sales/turnover, competition, order books, volume of stock, demand
evaluation, operation costs, profit, employment, and sales price setting.
Index construction
Answers obtained from the surveys are aggregated in the form of "balances". Balances are
constructed as the difference between the percentages of respondents giving positive and negative
replies. Using this method, a Confidence Index of +100 would indicate that all survey respondents
were much more confident about future prospects, while -100 would indicate that all survey
respondents were much less confident about future prospects.
The methodology of compiling the indices is based on the Joint Harmonised EU Programme of
Business and Consumer Surveys.
GERMANY
Name of survey
Business Climate Survey
Source
CESifo Group Munich
Frequency
Monthly
Scope
The Ifo Business Climate Index is based on about 7,000 monthly survey responses of firms in
manufacturing, construction, wholesaling and retailing.
Survey questions
The firms are asked to assess their current business situation and their expectations for the next
six months. They can characterize their situation as "good", "satisfactory" or "poor" and their
business expectations for the next six months as "more favourable", "unchanged" or "more
unfavourable".
Index construction
The balance value of the current business situation is the difference of the percentages of the
responses "good" and "bad"; the balance value of the expectations is the difference of the
percentages of the responses "more favourable" and "unfavourable". The Business Climate Index is
the mean of the balances of business situation and expectations.
The index values range from -100 (when all respondents have negative confidence) to +100
(when all respondents have positive confidence).
GREECE
Name of survey
Joint Harmonised EU Programme of Business and Consumer Surveys
Source
European Commission; Directorate-General for Economic and Financial Affairs (DG ECFIN)
Frequency
Monthly
Scope
Random sample of 1065 firms in manufacturing sector
Survey questions
The industry survey is largely qualitative. The main questions refer to an assessment of recent
trends in production, of the current levels of order books and stocks, as well as expectations about
production, selling prices and employment. For qualitative questions, answers are usually given
according to a three-option ordinal scale: “increase” (+), “remain unchanged” (=), “decrease” (-); or
“more than sufficient” (+), “sufficient” (=), “not sufficient” (-); or “too large” (+), “adequate” (=), “too
small” (-). In some cases, respondents have the choice between four, five or six options.
Index construction
On the basis of the distribution of the various options for each question, aggregate balances are
calculated for each question. Balances are the difference between positive and negative answering
options, measured as percentage points of total answers. In particular, if a question has three
alternative options, “positive” (“up”, “more”, “more than sufficient”, “good”, “too large”, “increase”,
“improve”, etc.), “neutral” (“unchanged”, “as much”, “sufficient”, “satisfactory”, “adequate”, etc.) and
“negative” (“down”, “less”, “not sufficient”, “too small”, “decline”, etc.), and if P, E and M (with P+E+M
= 100) denote the percentages of respondents having chosen respectively the option positive,
neutral, and negative, the balance is calculated as
B = P - M
In the case of questions with six options, i.e. the three options above plus “very positive” (“got/get
a lot better”, “very much higher”, “increase sharply”, etc.), “very negative” (“got/get a lot worse”, “very
unfavourable”, “fall sharply”, etc.) and “don’t know”, the balances are calculated on the basis of
weighted averages. If P, E and M have the same meaning as in the previous paragraph, while PP
denotes the percentage of respondents having chosen the option “very positive”, MM the percentage
of respondents having chosen the option “very negative” and N is the percentage of respondents
without any opinion (so that PP+P+E+M+MM+N=100), balances are calculated as
B = (PP + 1⁄2 P) - (1⁄2 M + MM)
The balance values range from -100, when all respondents choose the negative option (or the
most negative one in the case of six option questions) to +100, when all respondents choose the
positive (or the most positive) option.
The industrial confidence indicator is the arithmetic average of the balances (in percentage points)
of the answers to the questions on production expectations, order books and stocks of finished
products (the last with inverted sign).
HONG KONG, CHINA
Name of survey
Business Tendency Survey
Source
Census and Statistics Department of Hong Kong
Frequency
Quarterly
Scope
The survey gathers views on short-term business performance from the senior management of
about 500 to 600 prominent establishments in ten major sectors in Hong Kong: manufacturing,
construction, import/export trade and wholesale, retail, accommodation and food services (mainly
covering services rendered by hotels and restaurants), transportation, storage and courier services,
information and communications, financing and insurance, real estate and professional and
business services sectors.
Survey questions
The survey solicits views from respondents regarding expected changes of a number of economic
variables (including business situation, volume of business/output, number of persons engaged and
selling price/service charge), situation regarding orders and inventories, as well as factors limiting
increase in business activities. Views collected refer only to those of respondents on their own
establishments rather than those on the respective sectors they are engaged in; and are limited to
the expected direction of quarter-to-quarter change (e.g. "up", "same" or "down") but not the
magnitude of change. In collecting views on the quarter-to-quarter changes, if the variable in
question is subject to seasonal variations, respondents are asked to provide the expected changes
after excluding the normal seasonal variations.
Index construction
In compiling the survey results, the percentages of establishments choosing individual response
categories within each stratum, which is mainly at industry grouping level, are first computed to
arrive at stratum estimates. These stratum estimates are then weighted and summed up to give the
percentages of establishments choosing individual responses for the corresponding sectors. Overall
estimates are weighted averages of all sectorial estimates. Weights for the variable on employment
are "number of persons engaged" of various strata, while weights for all other variables are "value
added".
Survey results are presented as "net balance", i.e. the difference between the percentage of
respondents choosing "up" and that choosing "down". The percentage distribution of respondents
among various response categories (e.g. "up", "same" and "down") reflects how varied their
business expectations are. The "net balance", with its appropriate sign, indicates the direction of
expected change in the variable concerned. A positive sign indicates a likely upward trend while a
negative sign, a likely downward trend. However, the magnitude of the "net balance" reflects only
the prevalence of optimism or pessimism but not the magnitude of expected change, since
information relating to such magnitude is not collected in the survey.
The index values range from -100 (when all respondents have negative confidence) to +100
(when all respondents have positive confidence).
HUNGARY
Name of survey
Business Cycle Survey
Source
GKI Economic Research Co.
Frequency
Monthly
Scope
Based on 1,300 questionnaires, GKI Co. prepares surveys on the business cycle in industry, retail
trade, construction and services sectors.
Survey questions
The industry survey is largely qualitative. The main questions refer to an assessment of recent
trends in production, of the current levels of order books and stocks, as well as expectations about
production, selling prices and employment. For qualitative questions, answers are usually given
according to a three-option ordinal scale: “increase” (+), “remain unchanged” (=), “decrease” (-); or
“more than sufficient” (+), “sufficient” (=), “not sufficient” (-); or “too large” (+), “adequate” (=), “too
small” (-). In some cases, respondents have the choice between four, five or six options.
Index construction
On the basis of the distribution of the various options for each question, aggregate balances are
calculated for each question. Balances are the difference between positive and negative answering
options, measured as percentage points of total answers. In particular, if a question has three
alternative options, “positive” (“up”, “more”, “more than sufficient”, “good”, “too large”, “increase”,
“improve”, etc.), “neutral” (“unchanged”, “as much”, “sufficient”, “satisfactory”, “adequate”, etc.) and
“negative” (“down”, “less”, “not sufficient”, “too small”, “decline”, etc.), and if P, E and M (with P+E+M
= 100) denote the percentages of respondents having chosen respectively the option positive,
neutral, and negative, the balance is calculated as
B = P - M
In the case of questions with six options, i.e. the three options above plus “very positive” (“got/get
a lot better”, “very much higher”, “increase sharply”, etc.), “very negative” (“got/get a lot worse”, “very
unfavourable”, “fall sharply”, etc.) and “don’t know”, the balances are calculated on the basis of
weighted averages. If P, E and M have the same meaning as in the previous paragraph, while PP
denotes the percentage of respondents having chosen the option “very positive”, MM the percentage
of respondents having chosen the option “very negative” and N is the percentage of respondents
without any opinion (so that PP+P+E+M+MM+N=100), balances are calculated as
B = (PP + 1⁄2 P) - (1⁄2 M + MM)
The balance values range from -100, when all respondents choose the negative option (or the
most negative one in the case of six option questions) to +100, when all respondents choose the
positive (or the most positive) option.
The industrial confidence indicator is the arithmetic average of the balances (in percentage points)
of the answers to the questions on production expectations, order books and stocks of finished
products (the last with inverted sign). Balances are seasonally adjusted.
INDIA
Name of survey
Business Outlook Survey
Source
Confederation of Indian Industry
Frequency
Quarterly
Scope
Business Outlook Survey is based on a large sample size of 250 companies covering all industry
sectors, including small, medium and large enterprises from different regions. The survey also
enumerated responses across industry groups both in public and private sectors engaged in
manufacturing and services sector.
Survey questions
Indices are based on three questions on the performance of the economy, respondent’s industry
and respondent’s company. Respondents are asked to rate the current and expected performance
on a scale of 0 to 100. A score above 50 indicates positive confidence while a score above 75
indicates strong positive confidence.
Index construction
Business confidence index is calculated as a weighted average of the Current Situation Index
(CSI) and the Expectation Index (EI), with greater weight given to EI as compared to CSI. In the
construction of the two sub-indices, the highest weight is given to the questions related to the
performance of the individual company, and the lowest weight is assigned to the questions on the
economy. The weights are assigned on the basis of the premise that the average respondent would
possess more detailed and accurate knowledge on the current and expected performance of their
own company than the economy as a whole.
INDONESIA
Name of survey
Business & Consumer Tendency Survey
Source
Badan Pusat Statistik (Statistics Indonesia)
Frequency
Quarterly
Scope
Not available
Survey questions
Not available
Index construction
Business Tendency Index consists of two types of indicators: Current Situation Index and Future
Expectations Index.
The index values range from 0 (when all respondents have negative confidence) to 200 (when all
respondents have positive confidence).
IRELAND
Name of survey
SME Business Trends
Source
Irish Small and Medium Enterprises Association
Frequency
Quarterly
Scope
Not available
Survey questions
Not available
Index construction
The index values range from -100 (when all respondents have negative confidence) to +100
(when all respondents have positive confidence).
ISRAEL
Name of survey
Business Tendency Survey
Source
Central Bureau of Statistics of Israel
Frequency
Monthly
Scope
Covers businesses in the industry, construction, retail trade, hotels and services sectors.
Survey questions
Questionnaires include questions on present and expected view on business conditions, financial
situation, capacity utilization, volume of sales/production, stocks, employment situation, order books
etc.
Index construction
The index values range from -100 (when all respondents have negative confidence) to +100
(when all respondents have positive confidence).
ITALY
Name of survey
Business Confidence Survey
Source
The Italian National Institute of Statistics
Frequency
Monthly

Scope
The survey conducted on a panel that currently includes about 4,000 companies. It covers
industry, construction, services and retail trade sectors.
Survey questions
The survey questionnaire includes questions designed to obtain qualitative information on the
current status and short-term expectations in terms of orders, production and stocks of finished
goods, cash, employment, prices, and an assessment of the general trend of the Italian economy.
Index construction
The indicator of confidence is developed as the average of seasonally adjusted data related to
questions regarding opinions on the level of total orders, the level of stocks (with inverted sign) and
the short-term expectations on production. The index is rebased to 2010=100.
JAPAN
Name of survey
Short-Term Economic Survey of Enterprises in Japan
Source
Bank of Japan
Frequency
Quarterly
Scope
The population of the survey is approximately 210 thousand private enterprises (excluding
financial institutions) in Japan with at least 20 million yen in capital.
Survey questions
The survey covers topics such as business conditions, domestic and foreign supply and demand,
inventory levels, production capacity, employment conditions, financial position, credit conditions.
Index construction
Responses are aggregated into Diffusion Index (DI) as follows:
DI (percent points) = Percentage share of enterprises responding positively – Percentage share of
enterprises responding negatively.
The index values range from -100 (when all respondents have negative confidence) to +100
(when all respondents have positive confidence).
LATVIA
Name of survey
Joint Harmonised EU Programme of Business and Consumer Surveys
Source
European Commission; Directorate-General for Economic and Financial Affairs (DG ECFIN)
Frequency
Monthly
Scope
Random sample of 810 firms in manufacturing sector
Survey questions
The industry survey is largely qualitative. The main questions refer to an assessment of recent
trends in production, of the current levels of order books and stocks, as well as expectations about
production, selling prices and employment. For qualitative questions, answers are usually given
according to a three-option ordinal scale: “increase” (+), “remain unchanged” (=), “decrease” (-); or
“more than sufficient” (+), “sufficient” (=), “not sufficient” (-); or “too large” (+), “adequate” (=), “too
small” (-). In some cases, respondents have the choice between four, five or six options.
Index construction
On the basis of the distribution of the various options for each question, aggregate balances are
calculated for each question. Balances are the difference between positive and negative answering
options, measured as percentage points of total answers. In particular, if a question has three
alternative options, “positive” (“up”, “more”, “more than sufficient”, “good”, “too large”, “increase”,
“improve”, etc.), “neutral” (“unchanged”, “as much”, “sufficient”, “satisfactory”, “adequate”, etc.) and
“negative” (“down”, “less”, “not sufficient”, “too small”, “decline”, etc.), and if P, E and M (with P+E+M
= 100) denote the percentages of respondents having chosen respectively the option positive,
neutral, and negative, the balance is calculated as
B = P - M
In the case of questions with six options, i.e. the three options above plus “very positive” (“got/get
a lot better”, “very much higher”, “increase sharply”, etc.), “very negative” (“got/get a lot worse”, “very
unfavourable”, “fall sharply”, etc.) and “don’t know”, the balances are calculated on the basis of
weighted averages. If P, E and M have the same meaning as in the previous paragraph, while PP
denotes the percentage of respondents having chosen the option “very positive”, MM the percentage
of respondents having chosen the option “very negative” and N is the percentage of respondents
without any opinion (so that PP+P+E+M+MM+N=100), balances are calculated as
B = (PP + 1⁄2 P) - (1⁄2 M + MM)
The balance values range from -100, when all respondents choose the negative option (or the
most negative one in the case of six option questions) to +100, when all respondents choose the
positive (or the most positive) option.
The industrial confidence indicator is the arithmetic average of the balances (in percentage points)
of the answers to the questions on production expectations, order books and stocks of finished
products (the last with inverted sign).
LITHUANIA
Name of survey
Joint Harmonised EU Programme of Business and Consumer Surveys
Source
European Commission; Directorate-General for Economic and Financial Affairs (DG ECFIN)
Frequency
Monthly
Scope
Random sample of 795 firms in manufacturing sector
Survey questions
The industry survey is largely qualitative. The main questions refer to an assessment of recent
trends in production, of the current levels of order books and stocks, as well as expectations about
production, selling prices and employment. For qualitative questions, answers are usually given
according to a three-option ordinal scale: “increase” (+), “remain unchanged” (=), “decrease” (-); or
“more than sufficient” (+), “sufficient” (=), “not sufficient” (-); or “too large” (+), “adequate” (=), “too
small” (-). In some cases, respondents have the choice between four, five or six options.
Index construction
On the basis of the distribution of the various options for each question, aggregate balances are
calculated for each question. Balances are the difference between positive and negative answering
options, measured as percentage points of total answers. In particular, if a question has three
alternative options, “positive” (“up”, “more”, “more than sufficient”, “good”, “too large”, “increase”,
“improve”, etc.), “neutral” (“unchanged”, “as much”, “sufficient”, “satisfactory”, “adequate”, etc.) and
“negative” (“down”, “less”, “not sufficient”, “too small”, “decline”, etc.), and if P, E and M (with P+E+M
= 100) denote the percentages of respondents having chosen respectively the option positive,
neutral, and negative, the balance is calculated as
B = P - M
In the case of questions with six options, i.e. the three options above plus “very positive” (“got/get
a lot better”, “very much higher”, “increase sharply”, etc.), “very negative” (“got/get a lot worse”, “very
unfavourable”, “fall sharply”, etc.) and “don’t know”, the balances are calculated on the basis of
weighted averages. If P, E and M have the same meaning as in the previous paragraph, while PP
denotes the percentage of respondents having chosen the option “very positive”, MM the percentage
of respondents having chosen the option “very negative” and N is the percentage of respondents
without any opinion (so that PP+P+E+M+MM+N=100), balances are calculated as
B = (PP + 1⁄2 P) - (1⁄2 M + MM)
The balance values range from -100, when all respondents choose the negative option (or the
most negative one in the case of six option questions) to +100, when all respondents choose the
positive (or the most positive) option.
The industrial confidence indicator is the arithmetic average of the balances (in percentage points)
of the answers to the questions on production expectations, order books and stocks of finished
products (the last with inverted sign).
MACEDONIA
Name of survey
Joint Harmonised EU Programme of Business and Consumer Surveys
Source
European Commission; Directorate-General for Economic and Financial Affairs (DG ECFIN)
Frequency
Monthly
Scope
Random sample of 795 firms in manufacturing sector
Survey questions
The industry survey is largely qualitative. The main questions refer to an assessment of recent
trends in production, of the current levels of order books and stocks, as well as expectations about
production, selling prices and employment. For qualitative questions, answers are usually given
according to a three-option ordinal scale: “increase” (+), “remain unchanged” (=), “decrease” (-); or
“more than sufficient” (+), “sufficient” (=), “not sufficient” (-); or “too large” (+), “adequate” (=), “too
small” (-). In some cases, respondents have the choice between four, five or six options.
Index construction
On the basis of the distribution of the various options for each question, aggregate balances are
calculated for each question. Balances are the difference between positive and negative answering
options, measured as percentage points of total answers. In particular, if a question has three
alternative options, “positive” (“up”, “more”, “more than sufficient”, “good”, “too large”, “increase”,
“improve”, etc.), “neutral” (“unchanged”, “as much”, “sufficient”, “satisfactory”, “adequate”, etc.) and
“negative” (“down”, “less”, “not sufficient”, “too small”, “decline”, etc.), and if P, E and M (with P+E+M
= 100) denote the percentages of respondents having chosen respectively the option positive,
neutral, and negative, the balance is calculated as
B = P - M
In the case of questions with six options, i.e. the three options above plus “very positive” (“got/get
a lot better”, “very much higher”, “increase sharply”, etc.), “very negative” (“got/get a lot worse”, “very
unfavourable”, “fall sharply”, etc.) and “don’t know”, the balances are calculated on the basis of
weighted averages. If P, E and M have the same meaning as in the previous paragraph, while PP
denotes the percentage of respondents having chosen the option “very positive”, MM the percentage
of respondents having chosen the option “very negative” and N is the percentage of respondents
without any opinion (so that PP+P+E+M+MM+N=100), balances are calculated as
B = (PP + 1⁄2 P) - (1⁄2 M + MM)
The balance values range from -100, when all respondents choose the negative option (or the
most negative one in the case of six option questions) to +100, when all respondents choose the
positive (or the most positive) option.
The industrial confidence indicator is the arithmetic average of the balances (in percentage points)
of the answers to the questions on production expectations, order books and stocks of finished
products (the last with inverted sign).

MALAYSIA
Name of survey
Business Conditions Survey
Source
Malaysian Institute of Economic Research
Frequency
Quarterly
Scope
The survey covers a sample of over 350 manufacturing businesses incorporated locally and
foreign manufacturing concerns operating in Malaysia, covering 11 industries.
Survey questions
Questions posed in the survey questionnaire are based on key determinants such as production
level, new order bookings, sales performance, inventory build-up and new job openings.
Index construction
The index values range from 0 (when all respondents have negative confidence) to 200 (when all
respondents have positive confidence).
MEXICO
Name of survey
Monthly Survey of Business Opinion
Source
Instituto Nacional de Estadística, Geografía e Informática (INEGI)
Frequency
Monthly
Scope
The sample is a stratified random selection of a number of companies in the manufacturing
sector.
Survey questions
The questionnaire includes questions that measure the economic activity through five exclusive
response alternatives for each variable: much higher, somewhat higher, equal, somewhat lower and
much lower, while those related to the economic environment are captured by the response options
much better, somewhat better, same, somewhat worse and much worse.
Information is collected for the following variables: production; use of plant and equipment; total
orders; domestic demand; external demand (exports); inventories of supplies; delivery of inputs;
timeliness of delivery of inputs; inventories of finished goods; sales prices; input prices; investment;
employed personnel; expectations of the exchange rate and inflation; situation of the country today,
compared to twelve months ago; situation of the country within twelve months, compared to the
current; status of the company today, compared to twelve months ago; status of the company within
twelve months, compared to the current.
Index construction
For each question, a response rate is calculated, which is then multiplied by the weighting
assigned. The total index is a simple average of all component indicators.
The index values range from 0 (when all respondents have negative confidence) to 100 (when all
respondents have positive confidence).
NETHERLANDS
Name of survey
Producer Confidence Survey
Source
Statistics Netherlands
Frequency
Monthly
Scope
The sample covers companies in the manufacturing industry.
Survey questions
The questions concern the expected activity in the next three months, opinion on order books and
opinion on stocks of finished products.
Index construction
The indicator is a weighted arithmetic average of three component indicators from the Business
sentiment survey of the manufacturing industry. Before the Producer confidence is calculated,
seasonal and bias effects are removed from the three component indicators.
The index values range from -100 (when all respondents have negative confidence) to +100
(when all respondents have positive confidence).
NEW ZEALAND
Name of survey
Business Outlook Survey
Source
ANZ Bank New Zealand

Frequency
Monthly
Scope
The Business Outlook is a monthly survey with around 500 respondents. Each firm self-selects its
business sector, region of residence, and firm size.
Survey questions
The survey covers questions on the present and expected future situation regarding the general
business conditions, employment, selling prices, investment activities, capacity utilization, credit
conditions etc.
Index construction
Although the survey itself is qualitative in nature, the reported statistic for each question is a single
net balance number. That is, for each question the respondent is asked to indicate ‘improved’ or
‘increased’, ‘deteriorated’ or ‘decreased’, or ‘remain the same’. The responses are then converted
into a net balance statistic via the calculation:
where i is the number of ‘improved’ responses; d is the number of ‘deteriorated’ responses; rts is
the number of ‘remain the same’ responses.
The index values range from -100 (when all respondents have negative confidence) to +100
(when all respondents have positive confidence).
NIGERIA
Name of survey
Business Expectations Survey
Source
Central Bank of Nigeria
Frequency
Quarterly
Scope
Respondents are drawn from the companies in the industrial, construction, wholesale/retail trade
and services sectors.
Survey questions
Not available
Index construction
The Confidence Index is computed as the percentage of firms that answered affirmatively less the
percentage of firms that answered negatively with respect to their view on a given indicator. A
positive Confidence Index indicates a favourable view, except for the average inflation rate and the
average naira borrowing rate, while a negative Confidence Index indicates the opposite.
The index values range from -100 (when all respondents have negative confidence) to +100
(when all respondents have positive confidence).
NORWAY
Name of survey
Business Tendency Survey
Source
Statistics Norway
Frequency
Quarterly
Scope
The gross sample includes about 800 units and represents about 3.5 per cent of the total
population of branch units. The sample units cover about 40 per cent of the total level of
employment for the industries covered by the survey. The sample includes all branch units with 300
employees or more. The remaining units are drawn by methods based on stratification and optimal
allocation with probability proportional to the size of the unit measured by the number of employees.
The sample does not include establishments with fewer than 10 employees. The survey covers all
branch units in mining, quarrying and manufacturing.
Survey questions
Not available
Index construction
Employment weighted results (response distribution) are calculated for each question. The
sample units are classified in different strata depending on the number of employees in the branch
unit and in which industry they belong to (3-digit NACE). For each question by stratum a response
distribution is estimated using employment data as weights. The response for each branch unit is
given a weight equal to the number of employees. For aggregation to the industrial group level and
totals, the stratum results carry a weight equal to the stratum population employment.
The index values range from -100 (when all respondents have negative confidence) to +100
(when all respondents have positive confidence).
PERU
Name of survey
Índice de confianza empresarial (Business Confidence Index)
Source
Banco Central de Reserva del Perú
Frequency
Monthly
Scope
Not available
Survey questions
Not available
Index construction
The index is constructed as a diffusion index, with values above 50 indicating positive confidence
and values below 50 – negative confidence. The index reflects the business managers’ expectations
about the state of economy in the next three months.
PHILIPPINES
Name of survey
Business Expectations Survey
Source
Central Bank of Philippines
Frequency
Quarterly
Scope
The Business Expectations Survey uses the stratified random sampling design covering
corporations from the SEC’s Top 7000 Corporations (ranked based on gross revenues) as sampling
units.
Survey questions
Not available
Index construction
The Confidence Index is computed as the percentage of firms that answered affirmatively less the
percentage of firms that answered negatively with respect to their views on a given indicator. A
positive Confidence Index indicates a favourable view, except for the inflation rate and the peso-
borrowing rate, while a negative Confidence Index indicates the opposite.
The index values range from -100 (when all respondents have negative confidence) to +100
(when all respondents have positive confidence).
POLAND
Name of survey
Business Tendency Survey

Source
Central Statistical Office of Poland
Frequency
Monthly
Scope
3,500 manufacturing entities pertaining to C section according to the Polish Classification of
Activities (PKD 2007) compiled on the basis of NACE Rev.2; 5,000 entities carrying out construction
and assembly activities pertaining to F section according to PKD 2007 compiled on the basis of
NACE Rev.2.; 5,200 entities representing retail trade activities pertaining to G section (divisions 45
and 47) according to PKD 2007 compiled on the basis of NACE Rev.2.; 5,000 entities carrying out
service activities pertaining to sections from H to S (without O section ) according to PKD 2007
compiled on the basis of NACE Rev.2.
Survey questions
The questionnaires cover questions related to the basic features of economic situation in
manufacturing, construction, retail trade and services:
• Manufacturing – current overall order books, current stock of finished products, expected
production;
• Construction – current overall order books, expected employment;
• Retail trade – business activity (sales) in the past 3 months, volume of stock, expected business
activity;
• Services – business situation in the past 3 months, demand in the past 3 months, expected
demand.
Index construction
Indicators for each economy sector are calculated as a standardized arithmetic average of
selected (seasonally adjusted) two (construction) or three balances of answers (other business
tendency surveys). For computation of the synthetic indicator particular weights are allocated to the
different sectors – manufacturing industry (50%), services (38%), retail trade (6%), construction
(6%).
PORTUGAL
Name of survey
Business and Consumer Survey
Source
National Institute of Statistics of Portugal
Frequency
Monthly

Scope
All enterprises with over 200 employed persons are included in the sample; companies with below
200 employed persons are stratified by size of companies with the Neyman (optimum) allocation.
Survey questions
The industry survey is largely qualitative. The main questions refer to an assessment of recent
trends in production, of the current levels of order books and stocks, as well as expectations about
production, selling prices and employment. For qualitative questions, answers are usually given
according to a three-option ordinal scale: “increase” (+), “remain unchanged” (=), “decrease” (-); or
“more than sufficient” (+), “sufficient” (=), “not sufficient” (-); or “too large” (+), “adequate” (=), “too
small” (-). In some cases, respondents have the choice between four, five or six options.
Index construction
On the basis of the distribution of the various options for each question, aggregate balances are
calculated for each question. Balances are the difference between positive and negative answering
options, measured as percentage points of total answers. In particular, if a question has three
alternative options, “positive” (“up”, “more”, “more than sufficient”, “good”, “too large”, “increase”,
“improve”, etc.), “neutral” (“unchanged”, “as much”, “sufficient”, “satisfactory”, “adequate”, etc.) and
“negative” (“down”, “less”, “not sufficient”, “too small”, “decline”, etc.), and if P, E and M (with P+E+M
= 100) denote the percentages of respondents having chosen respectively the option positive,
neutral, and negative, the balance is calculated as
B = P - M
In the case of questions with six options, i.e. the three options above plus “very positive” (“got/get
a lot better”, “very much higher”, “increase sharply”, etc.), “very negative” (“got/get a lot worse”, “very
unfavourable”, “fall sharply”, etc.) and “don’t know”, the balances are calculated on the basis of
weighted averages. If P, E and M have the same meaning as in the previous paragraph, while PP
denotes the percentage of respondents having chosen the option “very positive”, MM the percentage
of respondents having chosen the option “very negative” and N is the percentage of respondents
without any opinion (so that PP+P+E+M+MM+N=100), balances are calculated as
B = (PP + 1⁄2 P) - (1⁄2 M + MM)
The balance values range from -100, when all respondents choose the negative option (or the
most negative one in the case of six option questions) to +100, when all respondents choose the
positive (or the most positive) option.
The industrial confidence indicator is the arithmetic average of the balances (in percentage points)
of the answers to the questions on production expectations, order books and stocks of finished
products (the last with inverted sign).
QATAR
Name of survey
Dun & Bradstreet’s Business Optimism Index – Qatar
Source
Dun & Bradstreet

Frequency
Quarterly
Scope
A random sample is selected from Dun & Bradstreet’s commercial database for conducting this
survey. This sample is divided into hydrocarbon and non-hydrocarbon segments to eliminate the
dominance of the former over the latter and understand their dynamics individually. The hydrocarbon
segment includes Qatar’s mining, oil and gas companies whereas the non-hydrocarbon segment
encapsulates in its purview the following sectors:
• Manufacturing (90 units)
• Construction (110 units)
• Trade & Hospitality (80 units)
• Transport & Communications (65 units)
• Finance, Real Estate & Business Services (115 units)
Survey questions
The survey respondents are asked if they expect an increase, decrease or no change regarding
the following parameters: volume of sales, net profits, level of selling prices, new orders received,
level of stock, and number of employees.
Additional poll questions are asked relating to the current economic scenario and are aimed at
gauging the business sentiments with regards to several key current issues.
The index values range from -100 (when all respondents have negative confidence) to +100
(when all respondents have positive confidence).
Index construction
Not available
ROMANIA
Name of survey
Joint Harmonised EU Programme of Business and Consumer Surveys
Source
European Commission; Directorate-General for Economic and Financial Affairs (DG ECFIN)
Frequency
Monthly
Scope
Random sample of 2338 firms in manufacturing sector
Survey questions
The industry survey is largely qualitative. The main questions refer to an assessment of recent
trends in production, of the current levels of order books and stocks, as well as expectations about
production, selling prices and employment. For qualitative questions, answers are usually given
according to a three-option ordinal scale: “increase” (+), “remain unchanged” (=), “decrease” (-); or

“more than sufficient” (+), “sufficient” (=), “not sufficient” (-); or “too large” (+), “adequate” (=), “too
small” (-). In some cases, respondents have the choice between four, five or six options.
Index construction
On the basis of the distribution of the various options for each question, aggregate balances are
calculated for each question. Balances are the difference between positive and negative answering
options, measured as percentage points of total answers. In particular, if a question has three
alternative options, “positive” (“up”, “more”, “more than sufficient”, “good”, “too large”, “increase”,
“improve”, etc.), “neutral” (“unchanged”, “as much”, “sufficient”, “satisfactory”, “adequate”, etc.) and
“negative” (“down”, “less”, “not sufficient”, “too small”, “decline”, etc.), and if P, E and M (with P+E+M
= 100) denote the percentages of respondents having chosen respectively the option positive,
neutral, and negative, the balance is calculated as
B = P - M
In the case of questions with six options, i.e. the three options above plus “very positive” (“got/get
a lot better”, “very much higher”, “increase sharply”, etc.), “very negative” (“got/get a lot worse”, “very
unfavourable”, “fall sharply”, etc.) and “don’t know”, the balances are calculated on the basis of
weighted averages. If P, E and M have the same meaning as in the previous paragraph, while PP
denotes the percentage of respondents having chosen the option “very positive”, MM the percentage
of respondents having chosen the option “very negative” and N is the percentage of respondents
without any opinion (so that PP+P+E+M+MM+N=100), balances are calculated as
B = (PP + 1⁄2 P) - (1⁄2 M + MM)
The balance values range from -100, when all respondents choose the negative option (or the
most negative one in the case of six option questions) to +100, when all respondents choose the
positive (or the most positive) option.
The industrial confidence indicator is the arithmetic average of the balances (in percentage points)
of the answers to the questions on production expectations, order books and stocks of finished
products (the last with inverted sign).
RUSSIA
Name of survey
Business Confidence Index
Source
Federal State Statistics Service
Frequency
Monthly
Scope
A sample of over 4,000 companies (except for small enterprises) in the manufacturing, mining and
quarrying, electricity, gas and water supply industries
Survey questions
The questions cover the expected output, actual demand and stocks of production on hand.

Index construction
The total index is an arithmetic average of balances of all the survey questions. The balance is
calculated as the difference between positive (“up”, “better” etc.) and negative (“down”, “worse” etc.)
answers.
The index values range from -100 (when all respondents have negative confidence) to +100
(when all respondents have positive confidence).
SAUDI ARABIA
Name of survey
Business Optimism Index
Source
Dun & Bradstreet
Frequency
Quarterly
Scope
A sample of companies in non-hydrocarbon sector (manufacturing, construction, trade and
hospitality, transportation, finance and business services)
Survey questions
The questions cover the expected volume of sales, net profit, level of selling prices, new orders
received, level of stock and number of employees.
Index construction
The individual indices for each of the parameters (volume of sales, net profit, level of selling
prices, new orders received, level of stock and number of employees) are calculated by subtracting
the percentage of respondents expecting decrease from those expecting increase. A composite
index is then calculated, capturing the aggregate weighted behaviour of all the six individual indices
in the non-hydrocarbon sector.
SINGAPORE
Name of survey
Business Expectations Survey
Source
Statistics Singapore
Frequency
Quarterly
Scope
A sample of companies in the manufacturing sector

Survey questions
Surveyed establishments are asked to indicate their expectation of general business conditions
and other indicators such as output and employment. Their views are expressed in terms of
directional change (i.e. “up”, “same” or “down).
Index construction
Individual responses provided by the establishments are weighted by their contribution to
employment and value added. These responses are then aggregated at cluster, sub-cluster and
overall manufacturing level, and presented in terms of weighted percentages. The net weighted
balance is commonly used to reflect the direction and extent of the business sentiments. It is the
difference between the weighted percentage of 'up' responses and the weighted percentage of
'down' responses. For example, if weighted responses for overall manufacturing output yields a net
weighted balance of +30 per cent, the plus sign before the percentage figure indicates a positive
balance or net upward movement, and not a 30 per cent increase in output. Similarly, a minus sign
before the percentage indicates a downward trend and not a decline by that amount.
The index values range from -100 (when all respondents have negative confidence) to +100
(when all respondents have positive confidence).
SLOVAKIA
Name of survey
The Economic Sentiment Indicator
Source
Statistical Office of the Slovak Republic
Frequency
Monthly
Scope
Random sample of 756 firms in manufacturing sector
Survey questions
The industry survey is largely qualitative. The main questions refer to an assessment of recent
trends in production, of the current levels of order books and stocks, as well as expectations about
production, selling prices and employment. For qualitative questions, answers are usually given
according to a three-option ordinal scale: “increase” (+), “remain unchanged” (=), “decrease” (-); or
“more than sufficient” (+), “sufficient” (=), “not sufficient” (-); or “too large” (+), “adequate” (=), “too
small” (-). In some cases, respondents have the choice between four, five or six options.
Index construction
On the basis of the distribution of the various options for each question, aggregate balances are
calculated for each question. Balances are the difference between positive and negative answering
options, measured as percentage points of total answers. In particular, if a question has three
alternative options, “positive” (“up”, “more”, “more than sufficient”, “good”, “too large”, “increase”,
“improve”, etc.), “neutral” (“unchanged”, “as much”, “sufficient”, “satisfactory”, “adequate”, etc.) and
“negative” (“down”, “less”, “not sufficient”, “too small”, “decline”, etc.), and if P, E and M (with P+E+M
= 100) denote the percentages of respondents having chosen respectively the option positive,
neutral, and negative, the balance is calculated as
B = P - M
In the case of questions with six options, i.e. the three options above plus “very positive” (“got/get
a lot better”, “very much higher”, “increase sharply”, etc.), “very negative” (“got/get a lot worse”, “very
unfavourable”, “fall sharply”, etc.) and “don’t know”, the balances are calculated on the basis of
weighted averages. If P, E and M have the same meaning as in the previous paragraph, while PP
denotes the percentage of respondents having chosen the option “very positive”, MM the percentage
of respondents having chosen the option “very negative” and N is the percentage of respondents
without any opinion (so that PP+P+E+M+MM+N=100), balances are calculated as
B = (PP + 1⁄2 P) - (1⁄2 M + MM)
The balance values range from -100, when all respondents choose the negative option (or the
most negative one in the case of six option questions) to +100, when all respondents choose the
positive (or the most positive) option.
The industrial confidence indicator is the arithmetic average of the balances (in percentage points)
of the answers to the questions on production expectations, order books and stocks of finished
products (the last with inverted sign).
SLOVENIA
Name of survey
Business Tendency Survey
Source
Statistical Office of the Republic of Slovenia
Frequency
Monthly
Scope
The panel includes all large enterprises and share of medium and small enterprises in
manufacturing sector.
Survey questions
The questions cover the present and expected situation on order books, production pace, stocks,
selling prices, employment situation, demand, capacity utilization.
Index construction
The results are shown as the balance of individual questions. The balance is the difference
between positive and negative answers expressed in percentage. The balance shows the movement
of observed economic variables (present situation and future expectations).
The confidence indicator in manufacturing is defined as the arithmetic mean of the balances to the
questions on production expectation, assessment of overall order books and assessment of stocks
of finished products (the latter with inverted sign).

The index values range from -100 (when all respondents have negative confidence) to +100
(when all respondents have positive confidence).
SOUTH AFRICA
Name of survey
RMB/BER Business Confidence Index
Source
Bureau for Economic Research
Frequency
Quarterly
Scope
The survey results are obtained from questionnaires completed by senior executives in the trade,
manufacturing and building sector. Questionnaires are sent to 1,400 senior executives in the
building sector, 1,400 in the trade sector and 1,000 in manufacturing.
Survey questions
The business survey questionnaire contains a small number of questions. These questions are
qualitative in nature, e.g. “Compared to the same quarter a year ago, are the volume of sales up, the
same or down?”. No figures are requested.
Index construction
The index values range from 0 (when all respondents have negative confidence) to 100 (when all
respondents have positive confidence).
SOUTH KOREA
Name of survey
Business Survey Index
Source
The Bank of Korea
Frequency
Monthly
Scope
The survey covers 2,862 corporations in various industries which are selected using stratified
systematic sampling
Survey questions
Items surveyed: business conditions (overall conditions), inventories, facilities investment,
production facilities, labour force situation, new orders, production, sales (domestic and exports),

capacity utilization, sales prices, raw material purchase prices, profitability, financial situation,
operational difficulties.
Index construction
The survey responses are translated into indices in accordance with the following formulas:
Where:
ωi – each sub-sector’s GDP weight
BSIi – each sub-sector’s BSI
SPAIN
Name of survey
Business Confidence Indicator
Source
National Statistics Institute of Spain
Frequency
Quarterly
Scope
The sample is comprised of about 8,000 establishments.
Survey questions
Not available
Index construction
The following indicators are published from the question regarding performance of business in the
establishment:
1. Harmonised situation indicator: Situation balance (difference between the % of positive and negative responses). This is abbreviated as "Situation”.
2. Harmonised expectation indicator: Balance of expectations (difference between the % of positive and negative responses). This is abbreviated as "Expectations”.
3. Harmonised Business Confidence Index (HBCI): Geometric average of the situation balance and expectations, suitably standardising the results.
Details of the calculation for each quarter would be specifically as follows:

Confidence may, therefore, fluctuate between the extremes of -100 and +100. When rebased to
Q1 2013=100 according to the source methodology, the index ranges are approximately [66; 198].
SWEDEN
Name of survey
Monthly Business Tendency Survey
Source
National Institute of Economic Research of Sweden
Frequency
Monthly
Scope
Each month, around 6,000 firms are interviewed. Sampling of firms takes place through the
Business Register of Statistics Sweden and is renewed each year. This is done by replacing some
firms while all firms are assigned new weights. Firms with more than 100 employees are used
permanently for all surveys. Samples are stratified by size and industry.
Survey questions
The survey covers the present and expected future situation in business conditions, including
demand, output volume, new orders, inventories, selling prices, employment situation.
Index construction
Survey responses are processed by the sample's industry and stratum (size category) by
weighing the response of each firm by company size. The weights vary depending on the question
and industry. For the manufacturing industry, value added is the main weight used, but the number
of employees is also used for questions referring to employment. For the construction industry, the
retail trade and service sectors, the number of employees is used. The weights for the various
response alternatives are subsequently totalled for each stratum. Before the responses are totalled
by industry, the different size categories are weighted relative to the population. While calculating
the confidence indicators, the net balances for the questions are seasonally adjusted and
transformed (standardised) so that they have the same mean and standard deviation. In the next
step, these seasonally-adjusted and standardised net balances are averaged. This standardisation
process avoids movements in the confidence indicators being dominated by the questions that
historically vary the most. Finally, the confidence indicators are standardised to a mean of 100 and a
standard deviation of 10.
SWITZERLAND
Name of survey
Switzerland Business Tendency Survey in Manufacturing
Source
OECD

Frequency
Monthly
Scope
The sample comprises 1600 enterprises and the response rate is 80%. The manufacturing
industries are covered by the survey. The survey covers 22% of total employment in the
manufacturing sector.
Survey questions
Not available
Index construction
Data is presented as the balance of positive ("will increase", "increased", "too large") over
negative ("will decrease", "decreased", "too small") replies expressed as a percentage of total
replies. Responses are weighted according to the number of persons engaged in the production
process. The replies to questions relating to economic activity on the domestic market or abroad are
weighted by the corresponding shares of enterprises on each of these two markets. The indicator for
the whole industry is obtained by weighting each industry branch indicator, the weight being the
share of the branch in the total value added.
The index values range from -100 (when all respondents have negative confidence) to +100
(when all respondents have positive confidence).
THAILAND
Name of survey
Business Expectation Index
Source
Bureau of Trade and Economic Indices of Thailand
Frequency
Quarterly
Scope
Sample includes companies from various business branches, 30 samples per province.
Survey questions
Topics covered in the survey include:
• General business situation
• Business situation in the same sector
• Results of business operations
• Cost per unit of goods or services
• Employment situation
• Expansion of organization
In each topic, there are three types of questions:
• Compare present quarter of this year with the same quarter last year
• Compare present quarter with previous quarter of the present year
• Forecast next quarter
Index construction
Calculation steps:
1. Raw data is translated to quantity data. For answers “better/increase”, score is 1; for “unchanged”, score is 0.5; for “worse/decrease”, score is 0.
2. The estimated percentage is used to calculate the index according to the formula:
Index = % of answers “better” + (% of answers “unchanged” / 2)
The index can vary from 0 to 100, with the score of 50 meaning that the business is expected to
remain unchanged.
TURKEY
Name of survey
Real Sector Confidence Index
Source
Central Bank of the Republic of Turkey
Frequency
Monthly
Scope
The survey covers opinions of senior managers of the major private sector firms.
Survey questions
The questions cover topics on the present and expected situation of production, demand,
investment, sales, employment, capacity utilization and inflation expectations.
Index construction
The responses which are in the form of “more optimistic, the same, more pessimistic” or “up, the
same, down” are coded. The responses indicating improvement (better off) for a particular variable
are scored 1, while the responses showing no change are scored 0, and the responses showing a
worsening condition are scored -1. The questions affecting the industrial production index positively
are coded in the same direction, while those affecting adversely are coded in the reverse direction.
The diffusion index is then constructed by summing up the related encoded responses obtained
from the respondent firms.
There is no need for trend adjustment since the diffusion indexes formed by the survey data
display cyclical patterns. While choosing the appropriate questions, the economic significance is
considered, as well as the statistical methods such as the performance for leading the industrial
production index, low volatility and cross correlation. The composite index is calculated as the
equally weighted average of the sub-indices in line with the applications in the EU countries. No
base-year adjustment has been made to the index.
The index values range from 0 (when all respondents have negative confidence) to 200 (when all
respondents have positive confidence).
UNITED ARAB EMIRATES
Name of survey
Dubai Business Survey
Source
Department of Economic Development
Frequency
Quarterly
Scope
The sample includes a mix of small, medium and large enterprises in the Emirate of Dubai,
ensuring adequate representation from manufacturing, trading and services, proportionately to their
respective contributions to Dubai’s GDP.
Survey questions
In order to tap “business outlook” or expectations, the survey focuses on key indicators, such as
sales, selling prices, volumes sold, profits and number of employees. Respondents are asked to
indicate if they expected an “increase”, “decrease” or “no change” in these indicators.
Index construction
The Business Confidence Index (BCI) is calculated as a weighted average score of the following
“business outlook” indicators:
1. Selling Prices 2. Volumes Sold 3. Number of Employees 4. Profits
For each indicator, “resulting scores” are calculated using the net balance method: (% of positive
responses - % of negative responses) + 100. For the Composite Business Confidence Index, the
resulting scores are multiplied with their corresponding weights to arrive at a weighted average
Index score. This index is finally rebased so that Q2, 2011 = 100. Taking account of the economy’s
composition by firm size, the index is weighted by the relative contributions of SMEs and large
businesses to Dubai’s GDP. The final result is the following index:
Overall Index = 60% x (Large enterprise Index) + 40% x (SME Index).
UNITED KINGDOM
Name of survey
BDO Monthly Business Trends
Source
BDO
Frequency
Monthly

Scope
Over 4,000 different respondents from companies in a range of different industries
Survey questions
Not available
Index construction
The indices are calculated by taking a weighted average of the results of the UK main business
surveys. It incorporates the results of the quarterly CBI Industrial Trends Survey (and the CBI
Monthly Trends Enquiry which is carried out in the intervening months); the Bank of England Agents’
summary of business conditions; and the Chartered Institute of Purchasing and Supply’s Surveys of
Manufacturing and of Services.
The surveys are weighted together by a three-stage process. First, the results of each individual
survey are correlated against the relevant economic cycles for manufacturing and services. This
determines the extent of the correlations between each set of survey results and the relevant timing
relationships. Then the surveys are weighted together based on their scaling, on the extent of these
correlations and the timing of their relationships with the relevant reference cycles. Finally, the
weighted total is scaled into an index with 100 as the mean, the average of the past two cyclical
peaks as 110 and the average of the past two cyclical troughs as 90.
USA
Name of survey
Small Business Economic Trends
Source
National Federation of Independent Business
Frequency
Monthly
Scope
Survey respondents are drawn from NFIB's membership
Survey questions
• Do you think the next three months will be a good time for small business to expand
substantially? Why?
• About the economy in general, do you think that six months from now general business
conditions will be better than they are now, about the same, or worse?
• Were your net earnings or “income” (after taxes) from your business during the last calendar
quarter higher, lower, or about the same as they were for the quarter before?
• If higher or lower, what is the most important reason?
• During the last calendar quarter, was your dollar sales volume higher, lower, or about the same
as it was for the quarter before?

• Overall, what do you expect to happen to real volume (number of units) of goods and/or services
that you will sell during the next three months?
• How are your average selling prices compared to three months ago?
• In the next three months, do you plan to change the average selling prices of your goods and/or
services?
• During the last three months, did the total number of employees in your firm increase, decrease,
or stay about the same?
• If you have filled or attempted to fill any job openings in the past three months, how many
qualified applicants were there for the position(s)?
• Do you have any job openings that you are not able to fill right now?
• In the next three months, do you expect to increase or decrease the total number of people
working for you?
• Over the past three months, did you change the average employee compensation?
• Do you plan to change average employee compensation during the next three months?
• Are loans easier or harder to get than they were three months ago?
• During the last three months, was your firm able to satisfy its borrowing needs?
• Do you expect to find it easier or harder to obtain your required financing during the next three
months?
• If you borrow money regularly (at least once every three months) as part of your business
activity, how does the rate of interest payable on your most recent loan compare with that paid three
months ago?
• If you borrowed within the last three months for business purposes, and the loan maturity
(payback period) was 1 year or less, what interest rate did you pay?
• During the last three months, did you increase or decrease your inventories?
• At the present time, do you feel your inventories are too large, about right, or inadequate?
• Looking ahead to the next three months to six months, do you expect, on balance, to add to your
inventories, keep them about the same, or decrease them?
• During the last six months, has your firm made any capital expenditures to improve or purchase
equipment, buildings, or land?
• If [your firm made any capital expenditures], what was the total cost of all these projects?
• Looking ahead to the next three to six months, do you expect to make any capital expenditures
for plant and/or physical equipment?
• What is the single most important problem facing your business today?
• Please classify your major business activity, using one of the categories of example below
• How many employees do you have full and part-time, including yourself?
Index construction
Not available

6. CONSUMER CONFIDENCE INDICES: METHODOLOGY & SOURCES
ALGERIA
Name of survey
Bayt.com Middle East Consumer Confidence Index
Source
Bayt.com
Frequency
Quarterly
Scope
Adult males and females aged 18 plus years
Survey questions
The survey questions include topics such as current and future views on personal financial
situation, country’s economy, business conditions, job availability and satisfaction.
Index construction
The index values range from 0 (when all respondents have negative confidence) to 200 (when all
respondents have positive confidence).
ARGENTINA
Name of survey
Consumer Confidence Index (Indice de Confianza del Consumidor)
Source
Universidad Torcuato di Tella
Frequency
Monthly
Scope
Households from Capital Federal, Interior and Gran Buenos Aires.
Survey questions
1. How is your personal economic situation in relation to the past year: would you say it got
better, stayed equal or got worse?
2. What do you think would happen to your economic situation one year from now: will it get
better, stay equal or get worse?

3. What will the economic situation of the country be one year from now: better, stay equal or
be worse than now?
4. What will the economic situation of the country be three years from now: better, stay equal
or be worse than now?
5. Do you think this is a good time to make purchases let's say of white goods: yes/no/don’t
know?
6. Do you think this is a good time to make more important purchases like cars, or to move
home: yes/no/don’t know?
Index construction
For each question, the options Better/Yes are considered "positive" answers, and the options
Worse/No are considered "negative" answers. The Index for each question is based on the
proportion of "positive" answers (p) and "negative" answers (n) out of the total number of individuals
surveyed. According to the formula below, a "positive" answer takes a value of 100 and a "negative"
answer takes a value of 0:
Partial Index = 50 * {p - n + 1}
Once the Partial Index is calculated, the results for the two questions of each category are
averaged and the three results are averaged again to obtain a regional average, which are
compounded to obtain a national average according to the following formula:
National Index = IndexCapital * 0.1667 + IndexInterior * 0.3666 + IndexGBA * 0.4667
The index values range from 0 (when all respondents have negative confidence) to 100 (when all
respondents have positive confidence).
AUSTRALIA
Name of survey
Consumer Sentiment Index
Source
Melbourne Institute of Applied Economic and Social Research
Frequency
Monthly
Scope
In most months the survey covers 1,200 people stratified by sex and location. In the third month of
each quarter, ie March, June, September and December, 1,410 people are surveyed.
Survey questions
The five questions include people’s assessment of:
1. Current family finances compared to a year ago;
2. Family finances over the coming 12 months;
3. Economic conditions in Australia over the coming 12 months;
4. Economic conditions in Australia over the next five years;
5. Whether it is a good or bad time to buy major household items.
Index construction
Each question can be represented by an index that is equal to the per cent of optimists minus per
cent of pessimists plus 100. The Consumer Sentiment Index is an average of the five component
indices. The index is transformed so that its average since 1980 is 100. The data are seasonally
adjusted.
AUSTRIA
Name of survey
The Joint Harmonized EU Consumer Confidence Indicator
Source
European Commission; Directorate-General for Economic and Financial Affairs (DG ECFIN)
Frequency
Monthly
Scope
Random sample of 1,500 Austrian households
Survey questions
The Joint Harmonized EU Consumer Confidence Indicator is based on answers to four questions:
1. How do you expect the financial position of your household to change over the next 12
months?
2. How do you expect the general economic situation in this country to develop over the
next 12 months?
3. How do you expect the number of people unemployed in this country to change over the
next 12 months?
4. Over the next 12 months, how likely is it that you will save any money?
Index construction
The Joint Harmonized EU Consumer Confidence Indicator is based on answers to four questions
with five answer alternatives to each question (a lot better, a little better, the same, a little worse, a
lot worse). The index is constructed with double weights on the extremes. Responses “a lot better”
and “a lot worse” get the weight 1 and “a little better” and “a little worse” get the weight 1/2, and “the
same” has zero weight. Values range from −100, when all respondents choose the most negative
option, to +100, when all respondents choose the most positive answers.
BELGIUM
Name of survey
The Joint Harmonized EU Consumer Confidence Indicator
Source
European Commission; Directorate-General for Economic and Financial Affairs (DG ECFIN)
Frequency
Monthly
Scope
Random sample of 1,600 Belgian households
Survey questions
The Joint Harmonized EU Consumer Confidence Indicator is based on answers to four questions:
1. How do you expect the financial position of your household to change over the next 12
months?
2. How do you expect the general economic situation in this country to develop over the
next 12 months?
3. How do you expect the number of people unemployed in this country to change over the
next 12 months?
4. Over the next 12 months, how likely is it that you will save any money?
Index construction
The Joint Harmonized EU Consumer Confidence Indicator is based on answers to four questions
with five answer alternatives to each question (a lot better, a little better, the same, a little worse, a
lot worse). The index is constructed with double weights on the extremes. Responses “a lot better”
and “a lot worse” get the weight 1 and “a little better” and “a little worse” get the weight 1/2, and “the
same” has zero weight. Values range from −100, when all respondents choose the most negative
option, to +100, when all respondents choose the most positive answers.
BRAZIL
Name of survey
Consumer Confidence Index (Indice de Confiança do Consumidor)
Source
Fundação Getulio Vargas
Frequency
Monthly
Scope
Households in the main urban centres.
Survey questions
Current Situation:
1. Situation of the local economy;
2. Financial situation of the family.
Expectations:
3. Situation of the local economy;

4. Purchase intention;
5. Financial situation of the family.
Index construction
The Consumer Confidence Index comprises 1) the Index of the Current Situation and 2) the Index
of Expectations, for the respective timeframe.
The formula for the calculation is the following:
Where:
i =1,....,5 represents each of the 5 questions
RFi = Favourable responses to the question "i"
RDi = Unfavourable responses to the question "i"
This number is rebased to 2005=100.
BULGARIA
Name of survey
The Joint Harmonized EU Consumer Confidence Indicator
Source
European Commission; Directorate-General for Economic and Financial Affairs (DG ECFIN)
Frequency
Monthly
Scope
Random sample of 1,000 Bulgarian households
Survey questions
The Joint Harmonized EU Consumer Confidence Indicator is based on answers to four questions:
1. How do you expect the financial position of your household to change over the next 12
months?
2. How do you expect the general economic situation in this country to develop over the
next 12 months?
3. How do you expect the number of people unemployed in this country to change over the
next 12 months?
4. Over the next 12 months, how likely is it that you will save any money?
Index construction
The Joint Harmonized EU Consumer Confidence Indicator is based on answers to four questions
with five answer alternatives to each question (a lot better, a little better, the same, a little worse, a
lot worse). The index is constructed with double weights on the extremes. Responses “a lot better”
and “a lot worse” get the weight 1 and “a little better” and “a little worse” get the weight 1/2, and “the
same” has zero weight. Values range from −100, when all respondents choose the most negative
option, to +100, when all respondents choose the most positive answers.
CANADA
Name of survey
Index of Consumer Confidence
Source
The Conference Board of Canada
Frequency
Monthly
Scope
Random sample of Canadian households across provinces.
Survey questions
Data is collected on each respondent's age, sex, marital status, occupation and geographic
location of residence. The four questions are:
1. Considering everything, would you say that your family is better or worse off financially
than six months ago?
2. Again, considering everything, do you think that your family will be better off, the same
or worse off financially six months from now?
3. How do you feel the job situation and overall employment will be in this community six
months from now?
4. Do you think that right now is a good or bad time for the average person to make a
major outlay for items such as a home, car or other major item?
Index construction
The percentage of respondents who stated positive and negative opinions is calculated by
question for each of the socio-economic and regional classifications as well as for the national
aggregate. Positive (negative) opinions are beliefs that a consumer's financial situation improved
(worsened) over the past six months or will improve (get worse) over the next six months, that more
(less) jobs will be available over the near term or that it is a good (bad) time to make a major
purchase.
Each Index of Consumer Confidence is then derived by adding the percentage of positive
responses, subtracting the percentage of negative responses, adding a scalar equal to 400 and
indexing the resulting series to a base year of 2002. The scalar is introduced to force the value of
the Index to zero if all responses are negative.
CHILE
Name of survey
Index of Economy Perception (Índice de Percepción de la Economía)
Source
Adimark GfK
Frequency
Monthly
Scope
Random sample of over 1,000 households living in the major cities of Chile
Survey questions
1. Would you say that the economic situation of you and your family is better, worse or the
same as a year ago?
2. Speaking of the country as a whole, would you say that the current economic situation of
the country is good, fair or poor?
3. Within the next 12 months, do you think that the economic situation of the country will be
good, fair or poor?
4. What do you think will most likely happen with the economic situation of the country in the
next five years?
5. Would you say that we are currently in a good time or a bad time to buy household items?
Index construction
The percentage of "positive" and "negative" answers for each question is counted. A score for
each question is calculated with the following procedure: the percentage of negative responses is
subtracted from the percentage of positive responses, and 100 are added to the result. This is in
order to avoid negative numbers occurring when the negative response rate is higher than the
percentage of positive responses. Then the scores to the 5 questions of the questionnaire are added
up and the result is divided by 10. This operation allows the rate to vary between a minimum of 0
and a maximum of 100 points. Finally, in order to adjust the rate to methodological changes that
were made in the year 2002, a "joint factor" or correction consisting of a constant of –2 points is
applied. This factor was decreasing at a rate of two-tenths per month to disappear completely in May
2006.
The final value of IPEC is the sum of scores calculated for each of the five questions in the
manner described above. The index values range from 0 (when all respondents have negative
confidence) to 100 (when all respondents have positive confidence).
CHINA
Name of survey
Consumer Confidence Index
Source
National Bureau of Statistics of China

Frequency
Monthly
Scope
Based on a survey of 700 individuals over 15 years old from 20 cities all over the country.
Survey questions
The index measures the consumers' degree of satisfaction about the current economic situation
and expectation on the future economic trend. The index values range from 0 (when all respondents
have negative confidence) to 200 (when all respondents have positive confidence).
Index construction
Not available
COLOMBIA
Name of survey
Consumer Confidence Index (Indice de Confianza del Consumidor)
Source
Fedesarrollo
Frequency
Monthly
Scope
600 adults are interviewed, with the sample structured to be nationally representative of all adults
in term of age, sex and socio-economic group.
Survey questions
The topics asked in the survey include:
1. Household’s financial situation, present and future
2. The economic situation of the country, present and future
3. The expected changes in prices
4. The expected change in the number of unemployed
5. The expected change in the interest in loans
6. Conditions for major purchases and savings
Index construction
The index values range from -100 (when all respondents have negative confidence) to 100 (when
all respondents have positive confidence).

COSTA RICA
Name of survey
Consumer Confidence Index (Indice de Confianza del Consumidor)
Source
Universidad de Costa Rica
Frequency
Quarterly
Scope
About 700 households with fixed telephone line are interview throughout the country.
Survey questions
The question block for CCI calculation consists of five questions: two relating to current economic
conditions and three relating to economic expectations.
Index construction
The CCI is calculated considering two dimensions: the first is the Current Economic Conditions
Index (ICEA) and the second is the Index of Economic Expectations (IEE).
To calculate the index value 100 is assigned if the answer is positive, 50 neutral or "do not know"
and zero to unfavourable responses. Then the average of five scores is calculated. The minimum is
zero, the lowest value of the CCI, i.e. the more pronounced pessimism. The maximum is reached at
100, the highest degree of optimism. The intermediate position (neither optimistic nor pessimistic,
neutral, undecided or uncertainty) is at 50.
CROATIA
Name of survey
The CNB Consumer Confidence Indicator
Source
The Croatian National Bank
Frequency
Monthly
Scope
Not available
Survey questions
The CNB Consumer Confidence Survey is carried out in accordance with the methodology of the
European Commission, the Joint Harmonized EU Programme of Business and Consumer Surveys.
Consumer Confidence Indicator is based on answers to four questions:

1. How do you expect the financial position of your household to change over the next 12
months?
2. How do you expect the general economic situation in this country to develop over the
next 12 months?
3. How do you expect the number of people unemployed in this country to change over the
next 12 months?
4. Over the next 12 months, how likely is it that you will save any money?
Index construction
The Joint Harmonized EU Consumer Confidence Indicator is based on answers to four questions
with five answer alternatives to each question (a lot better, a little better, the same, a little worse, a
lot worse). The index is constructed with double weights on the extremes. Responses “a lot better”
and “a lot worse” get the weight 1 and “a little better” and “a little worse” get the weight 1/2, and “the
same” has zero weight. Values range from −100, when all respondents choose the most negative
option, to +100, when all respondents choose the most positive answers.
CZECH REPUBLIC
Name of survey
The Joint Harmonized EU Consumer Confidence Indicator
Source
European Commission; Directorate-General for Economic and Financial Affairs (DG ECFIN)
Frequency
Monthly
Scope
Random sample of 1,000 Czech households
Survey questions
The Joint Harmonized EU Consumer Confidence Indicator is based on answers to four questions:
1. How do you expect the financial position of your household to change over the next 12
months?
2. How do you expect the general economic situation in this country to develop over the
next 12 months?
3. How do you expect the number of people unemployed in this country to change over the
next 12 months?
4. Over the next 12 months, how likely is it that you will save any money?
Index construction
The Joint Harmonized EU Consumer Confidence Indicator is based on answers to four questions
with five answer alternatives to each question (a lot better, a little better, the same, a little worse, a
lot worse). The index is constructed with double weights on the extremes. Responses “a lot better”
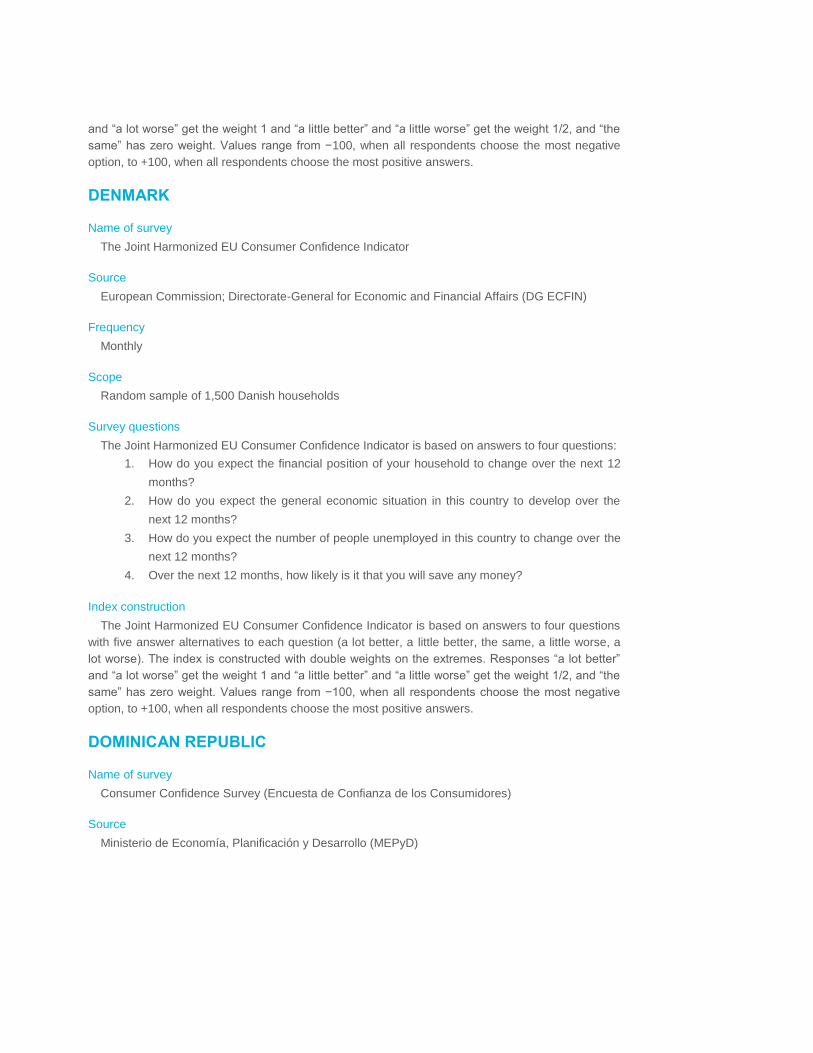
and “a lot worse” get the weight 1 and “a little better” and “a little worse” get the weight 1/2, and “the
same” has zero weight. Values range from −100, when all respondents choose the most negative
option, to +100, when all respondents choose the most positive answers.
DENMARK
Name of survey
The Joint Harmonized EU Consumer Confidence Indicator
Source
European Commission; Directorate-General for Economic and Financial Affairs (DG ECFIN)
Frequency
Monthly
Scope
Random sample of 1,500 Danish households
Survey questions
The Joint Harmonized EU Consumer Confidence Indicator is based on answers to four questions:
1. How do you expect the financial position of your household to change over the next 12
months?
2. How do you expect the general economic situation in this country to develop over the
next 12 months?
3. How do you expect the number of people unemployed in this country to change over the
next 12 months?
4. Over the next 12 months, how likely is it that you will save any money?
Index construction
The Joint Harmonized EU Consumer Confidence Indicator is based on answers to four questions
with five answer alternatives to each question (a lot better, a little better, the same, a little worse, a
lot worse). The index is constructed with double weights on the extremes. Responses “a lot better”
and “a lot worse” get the weight 1 and “a little better” and “a little worse” get the weight 1/2, and “the
same” has zero weight. Values range from −100, when all respondents choose the most negative
option, to +100, when all respondents choose the most positive answers.
DOMINICAN REPUBLIC
Name of survey
Consumer Confidence Survey (Encuesta de Confianza de los Consumidores)
Source
Ministerio de Economía, Planificación y Desarrollo (MEPyD)

Frequency
Semiannual
Scope
A sample of about 2,000 individuals
Survey questions
The survey includes questions about the economic situation in the last 12 months and the
expectations about the next 12 months.
Index construction
Consumer Confidence Index assesses consumer opinion on the current state and future
expectations of personal and country economic situation. The index calculation is done in three
stages. Firstly, the answers to each question are transformed into a balance measure (S). For
questions with three possible answers (positive (P), neutral (R) and negative (N)) the balance is
calculated as the difference between the proportion of people who gave a positive answer less the
proportion of people who were negative: S = P – N. For questions with five possible answers (very
positive (PP), positive (P), neutral (R), negative (N), very negative (NN)), the balance is calculated
as: S = (PP + 0.5P) – (0.5N + NN). Secondly, the balance S is multiplied by 100 and added to 100
so that the possible ranges would fall in the interval [0; 200]. Thirdly, the overall index is calculated
as the arithmetic average of the balances.
The index values range from 0 (when all respondents have negative confidence) to 200 (when all
respondents have positive confidence).
ECUADOR
Name of survey
Indice de Confianza del Consumidor ICC-BCE
Source
Banco Central del Ecuador
Frequency
Monthly
Scope
Monthly sample of approximately 3800 households in the cities of Quito, Guayaquil, Ambato,
Cuenca and Machala
Survey questions
The Present Situation Index is based on three questions:
1. Household economic situation in the previous month
2. Household consumption on entertainment in the previous month
3. Country's economic situation in the previous month
The Future Expectations Index is based on three questions:
1. Household economic situation in the next three months

2. Household consumption on entertainment in the next three months
3. Country’s economic situation in the next 3 months
Index construction
The Consumer Confidence Index is constructed as a weighted average of the Present Situation
Index and the Future Expectations Index. This index is bounded between 0 and 100 points.
EGYPT
Name of survey
Bayt.com Middle East Consumer Confidence Index
Source
Bayt.com
Frequency
Quarterly
Scope
Adult males and females aged 18 plus years
Survey questions
The survey questions include topics such as current and future views on personal financial
situation, country’s economy, business conditions, job availability and satisfaction. The index values
range from 0 (when all respondents have negative confidence) to 200 (when all respondents have
positive confidence).
Index construction
Not available
ESTONIA
Name of survey
The Joint Harmonized EU Consumer Confidence Indicator
Source
European Commission; Directorate-General for Economic and Financial Affairs (DG ECFIN)
Frequency
Monthly
Scope
Random sample of 800 Estonian households
Survey questions
The Joint Harmonized EU Consumer Confidence Indicator is based on answers to four questions:

1. How do you expect the financial position of your household to change over the next 12
months?
2. How do you expect the general economic situation in this country to develop over the
next 12 months?
3. How do you expect the number of people unemployed in this country to change over the
next 12 months?
4. Over the next 12 months, how likely is it that you will save any money?
Index construction
The Joint Harmonized EU Consumer Confidence Indicator is based on answers to four questions
with five answer alternatives to each question (a lot better, a little better, the same, a little worse, a
lot worse). The index is constructed with double weights on the extremes. Responses “a lot better”
and “a lot worse” get the weight 1 and “a little better” and “a little worse” get the weight 1/2, and “the
same” has zero weight. Values range from −100, when all respondents choose the most negative
option, to +100, when all respondents choose the most positive answers.
FINLAND
Name of survey
The Joint Harmonized EU Consumer Confidence Indicator
Source
European Commission; Directorate-General for Economic and Financial Affairs (DG ECFIN)
Frequency
Monthly
Scope
Random sample of 2,200 Finnish households
Survey questions
The Joint Harmonized EU Consumer Confidence Indicator is based on answers to four questions:
1. How do you expect the financial position of your household to change over the next 12
months?
2. How do you expect the general economic situation in this country to develop over the
next 12 months?
3. How do you expect the number of people unemployed in this country to change over the
next 12 months?
4. Over the next 12 months, how likely is it that you will save any money?
Index construction
The Joint Harmonized EU Consumer Confidence Indicator is based on answers to four questions
with five answer alternatives to each question (a lot better, a little better, the same, a little worse, a
lot worse). The index is constructed with double weights on the extremes. Responses “a lot better”
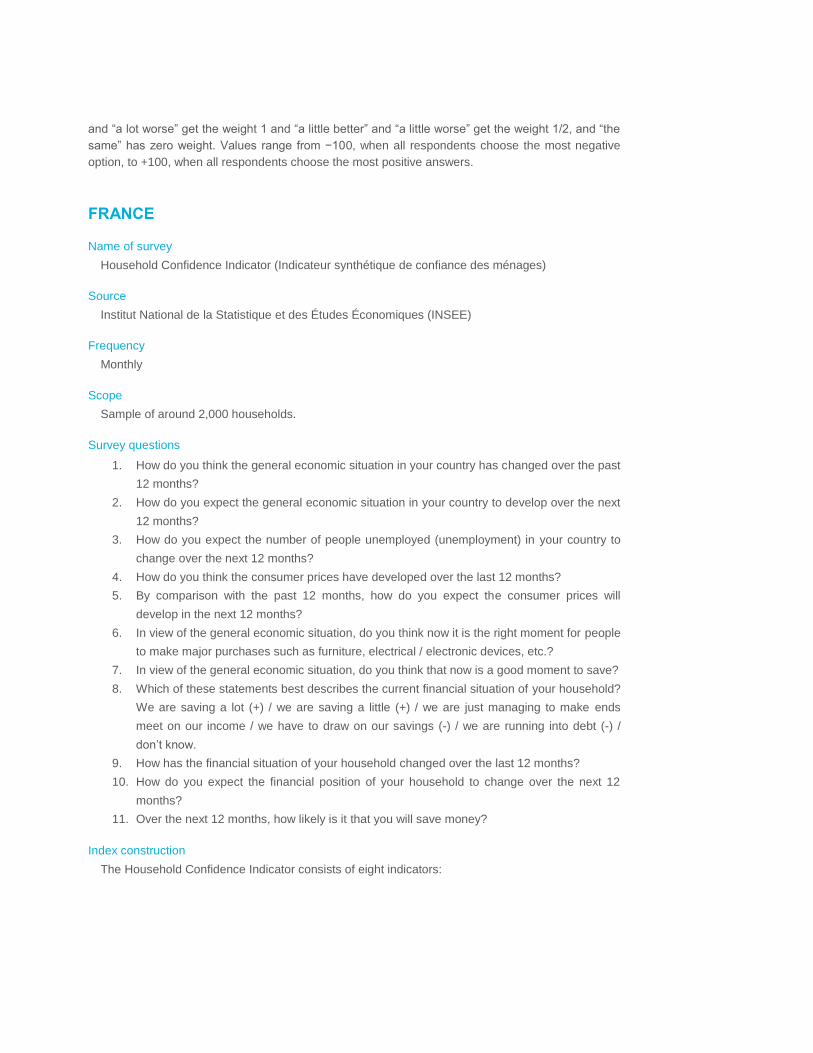
and “a lot worse” get the weight 1 and “a little better” and “a little worse” get the weight 1/2, and “the
same” has zero weight. Values range from −100, when all respondents choose the most negative
option, to +100, when all respondents choose the most positive answers.
FRANCE
Name of survey
Household Confidence Indicator (Indicateur synthétique de confiance des ménages)
Source
Institut National de la Statistique et des Études Économiques (INSEE)
Frequency
Monthly
Scope
Sample of around 2,000 households.
Survey questions
1. How do you think the general economic situation in your country has changed over the past
12 months?
2. How do you expect the general economic situation in your country to develop over the next
12 months?
3. How do you expect the number of people unemployed (unemployment) in your country to
change over the next 12 months?
4. How do you think the consumer prices have developed over the last 12 months?
5. By comparison with the past 12 months, how do you expect the consumer prices will
develop in the next 12 months?
6. In view of the general economic situation, do you think now it is the right moment for people
to make major purchases such as furniture, electrical / electronic devices, etc.?
7. In view of the general economic situation, do you think that now is a good moment to save?
8. Which of these statements best describes the current financial situation of your household?
We are saving a lot (+) / we are saving a little (+) / we are just managing to make ends
meet on our income / we have to draw on our savings (-) / we are running into debt (-) /
don’t know.
9. How has the financial situation of your household changed over the last 12 months?
10. How do you expect the financial position of your household to change over the next 12
months?
11. Over the next 12 months, how likely is it that you will save money?
Index construction
The Household Confidence Indicator consists of eight indicators:

1. Living standards in France – past change;
2. Living standards in France – outlook;
3. Personal financial position – past change;
4. Personal financial position – outlook;
5. Prospects of unemployment;
6. Opportunity to make major purchases;
7. Ability to save in the present;
8. Ability to save in the months to come.
Each indicator is calculated by subtracting the percentage of negative responses from the
percentage of positive responses. “Don’t know” responses are ignored. The Household Confidence
indicator unites the eight balances of opinion into a single variable, which is calculated using the
technique of factor analysis. The result is a weighted average of the selected balances of opinion,
with the weights re-estimated in January each year. The indicator is normalized to have a mean of
100 and a standard error of 10 over the estimation period of 1987-2010. The data are seasonally
adjusted.
GEORGIA
Name of survey
ISET Consumer Confidence Survey
Source
ISET Policy Institute
Frequency
Monthly
Scope
Random sample of 300-350 individuals
Survey questions
The survey includes questions on the financial situation of households, the general economic
situation, unemployment expectations (with inverted sign) and savings, all over the next 12 months.
Index construction
The ISET Consumer Confidence Survey follows the standard EU methodology.
The consumer confidence indicator is the arithmetic average of the balances (in percentage
points) of the answers to the survey questions. On the basis of the distribution of the various options
for each question, aggregate balances are calculated for each question. Balances are the difference
between positive and negative answering options, measured as percentage points of total answers.
In particular, if a question has three alternative options: "positive", "neutral" and "negative", and if P,
E and M (with P+E+M=100) denote the percentages of respondents having chosen respectively the
option positive, neutral, and negative, the balance is calculated as: B = P – M.

In the case of questions with six options, i.e. the three options above plus "very positive", "very
negative" and "don’t know", the balances are calculated on the basis of weighted averages. If P, E
and M have the same meaning as in the previous paragraph, while PP denotes the percentage of
respondents having chosen the option "very positive", MM the percentage of respondents having
chosen the option “very negative” and N is the percentage of respondents without any opinion (so
that PP+P+E+M+MM+N=100), balances are calculated as: B = (PP + 0.5P) − (0.5M + MM).
It is clear from the expressions above that balance values range from −100, when all respondents
choose the negative option (or the most negative one in the case of five-option questions) to +100,
when all respondents choose the positive (or the most positive) option.
GERMANY
Name of survey
The Joint Harmonized EU Consumer Confidence Indicator
Source
European Commission; Directorate-General for Economic and Financial Affairs (DG ECFIN)
Frequency
Monthly
Scope
Random sample of 2,000 German households
Survey questions
The Joint Harmonized EU Consumer Confidence Indicator is based on answers to four questions:
1. How do you expect the financial position of your household to change over the next 12
months?
2. How do you expect the general economic situation in this country to develop over the
next 12 months?
3. How do you expect the number of people unemployed in this country to change over the
next 12 months?
4. Over the next 12 months, how likely is it that you will save any money?
Index construction
The Joint Harmonized EU Consumer Confidence Indicator is based on answers to four questions
with five answer alternatives to each question (a lot better, a little better, the same, a little worse, a
lot worse). The index is constructed with double weights on the extremes. Responses “a lot better”
and “a lot worse” get the weight 1 and “a little better” and “a little worse” get the weight 1/2, and “the
same” has zero weight. Values range from −100, when all respondents choose the most negative
option, to +100, when all respondents choose the most positive answers.
GREECE
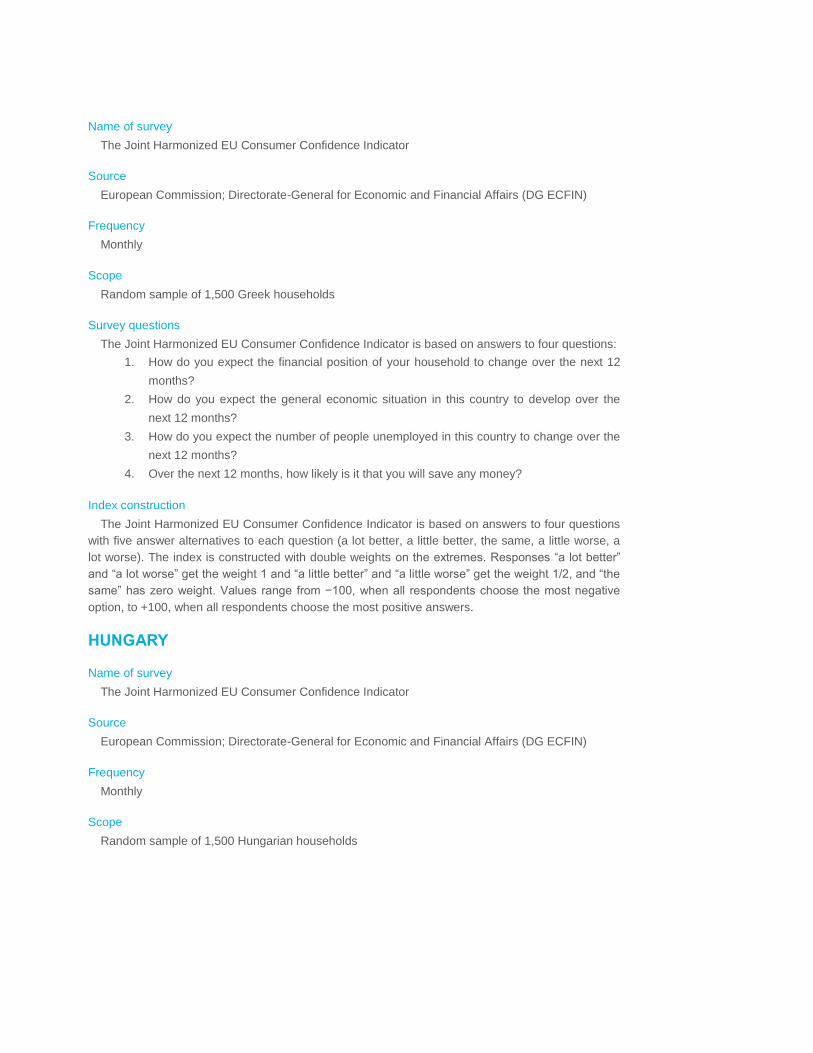
Name of survey
The Joint Harmonized EU Consumer Confidence Indicator
Source
European Commission; Directorate-General for Economic and Financial Affairs (DG ECFIN)
Frequency
Monthly
Scope
Random sample of 1,500 Greek households
Survey questions
The Joint Harmonized EU Consumer Confidence Indicator is based on answers to four questions:
1. How do you expect the financial position of your household to change over the next 12
months?
2. How do you expect the general economic situation in this country to develop over the
next 12 months?
3. How do you expect the number of people unemployed in this country to change over the
next 12 months?
4. Over the next 12 months, how likely is it that you will save any money?
Index construction
The Joint Harmonized EU Consumer Confidence Indicator is based on answers to four questions
with five answer alternatives to each question (a lot better, a little better, the same, a little worse, a
lot worse). The index is constructed with double weights on the extremes. Responses “a lot better”
and “a lot worse” get the weight 1 and “a little better” and “a little worse” get the weight 1/2, and “the
same” has zero weight. Values range from −100, when all respondents choose the most negative
option, to +100, when all respondents choose the most positive answers.
HUNGARY
Name of survey
The Joint Harmonized EU Consumer Confidence Indicator
Source
European Commission; Directorate-General for Economic and Financial Affairs (DG ECFIN)
Frequency
Monthly
Scope
Random sample of 1,500 Hungarian households
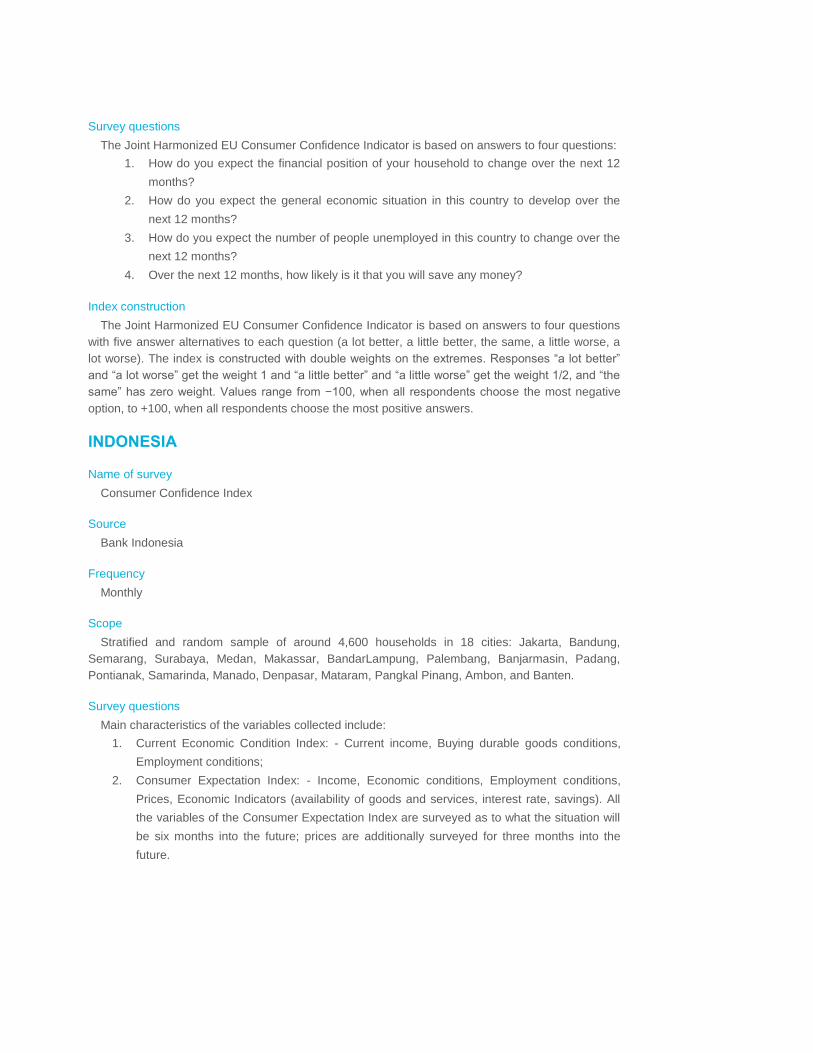
Survey questions
The Joint Harmonized EU Consumer Confidence Indicator is based on answers to four questions:
1. How do you expect the financial position of your household to change over the next 12
months?
2. How do you expect the general economic situation in this country to develop over the
next 12 months?
3. How do you expect the number of people unemployed in this country to change over the
next 12 months?
4. Over the next 12 months, how likely is it that you will save any money?
Index construction
The Joint Harmonized EU Consumer Confidence Indicator is based on answers to four questions
with five answer alternatives to each question (a lot better, a little better, the same, a little worse, a
lot worse). The index is constructed with double weights on the extremes. Responses “a lot better”
and “a lot worse” get the weight 1 and “a little better” and “a little worse” get the weight 1/2, and “the
same” has zero weight. Values range from −100, when all respondents choose the most negative
option, to +100, when all respondents choose the most positive answers.
INDONESIA
Name of survey
Consumer Confidence Index
Source
Bank Indonesia
Frequency
Monthly
Scope
Stratified and random sample of around 4,600 households in 18 cities: Jakarta, Bandung,
Semarang, Surabaya, Medan, Makassar, BandarLampung, Palembang, Banjarmasin, Padang,
Pontianak, Samarinda, Manado, Denpasar, Mataram, Pangkal Pinang, Ambon, and Banten.
Survey questions
Main characteristics of the variables collected include:
1. Current Economic Condition Index: - Current income, Buying durable goods conditions,
Employment conditions;
2. Consumer Expectation Index: - Income, Economic conditions, Employment conditions,
Prices, Economic Indicators (availability of goods and services, interest rate, savings). All
the variables of the Consumer Expectation Index are surveyed as to what the situation will
be six months into the future; prices are additionally surveyed for three months into the
future.

Index construction
The Balance Score Method (net balance + 100) has been adopted to construct the index, where
the index is above 100 points indicate optimism (positive responses) and vice versa.
The sample has a significance level of 99% and a sampling error of 2%.
Components of Consumer Confidence Index are calculated by a weighted average method, i.e.
with adding city weight based on the number of households and contribution of Gross Regional
Domestic Product household consumptions per province. The index values range from 0 (when all
respondents have negative confidence) to 200 (when all respondents have positive confidence).
IRELAND
Name of survey
KBC Bank Ireland/ESRI Irish consumer sentiment survey
Source
KBC Bank Ireland; Economic and Social Research Institute
Frequency
Monthly
Scope
Random sample of a minimum of 1,100 Irish households
Survey questions
The questionnaire used in the monthly survey contains a series of questions that record
respondents’ perceptions on recent and likely future trends in the economy. The areas addressed
include the following:
1. assessment of changes in the general economy in the previous 12 months as well as
expectations about likely future trends in the next 12 months;
2. perceptions of recent trends in unemployment;
3. views on recent trends and likely future outturns in terms of consumer prices;
4. recent trends and likely future trends in the financial situation of the respondent’s
household;
5. views on whether or not the respondent thinks it is currently a good or bad time to incur
expenditure on a number of major household items;
6. likely future outturns in terms of the respondent’s ability to save.
Index construction
The data is obtained during the first two weeks of the month. The data is re-weighted in line with
gender, age and level of educational attainment to ensure the data is fully representative of the
national population of adults. Each index is calculated by computing the relative scores (the percent
giving favourable replies minus the percent giving unfavourable replies (the balance), plus 100) for
each question used in the different indices. Those who reply “Don’t Know”, “Remain the same” are
excluded from the index calculations. Each relative score is rounded to the nearest whole number.
The sum of the relative scores is then divided by the base period total (Q4 1995 = 100).

ISRAEL
Name of survey
Bank Hapoalim and TNS Teleseker Israeli Consumer Confidence Index
Source
Bank Hapoalim and TNS Teleseker
Frequency
Monthly
Scope
Random sample of 1,000 Israeli households
Survey questions
The survey questions about:
1. Current Economic Conditions.
2. Current Employment situation in the country.
3. Economic Condition expectations in 6 months.
4. Employment expectations in 6 months.
5. Income expectations in 6 months.
6. Shopping Climate.
7. Public feeling regarding the nation’s general direction.
Index construction
Index is expressed as the balance of positive minus negative answers with the base April 2002 =
100. Three answer choices are given: positive, neutral and negative.
ITALY
Name of survey
Consumer Confidence Climate Indicator (Indicatore del Clima di Fiducia dei Consumatori)
Source
Istituto di Studi e Analisi Economica (Isae)
Frequency
Monthly
Scope
Random sample of households across four regions: North West, North East, Centre and
Mezzogiorno.

Survey questions
The categories include:
1. General and households' economic situations;
2. Unemployment forecast;
3. Present ability and future opportunity to save;
4. Propensity to purchase consumer durables;
5. Households' budget.
Index construction
The Italian consumer confidence indicator is an overall synthetic indicator of the consumer survey.
It is elaborated on the basis of nine questions considered most suitable to evaluate consumers'
optimism/pessimism about the economy. (Net balance + 100) has been adopted to construct the
index. The index is rebased to 2010=100.
JAPAN
Name of survey
Consumer Confidence Index
Source
Economic and Social Research Institute of the Cabinet Office of the Government of Japan
Frequency
Monthly
Scope
6,720 households (4,704 households with more than two-persons, 2,016 one-person households)
are sampled using a three-level stratified random sampling method of city/town/village, local unit and
household.
Survey questions
Consumer perceptions of the following four categories are surveyed: overall livelihood, income
growth, employment and willingness to buy durable goods. Respondents are asked to evaluate on a
scale of one to five what they consider the prospects to be for the subjects over the next six months.
Index construction
The consumer confidence index is then calculated by simply averaging the four consumer
perception indexes (original figures). The index values range from 0 (when all respondents have
negative confidence) to 100 (when all respondents have positive confidence).
JORDAN
Name of survey
Bayt.com Middle East Consumer Confidence Index
Source
Bayt.com
Frequency
Quarterly
Scope
Adult males and females aged 18 plus years
Survey questions
The survey questions include topics such as current and future views on personal financial
situation, country’s economy, business conditions, job availability and satisfaction.
Index construction
The index values range from 0 (when all respondents have negative confidence) to 200 (when all
respondents have positive confidence).
KUWAIT
Name of survey
ARA Consumer Confidence Index
Source
ARA Marketing Research & Consultancy
Frequency
Monthly
Scope
Not available
Survey questions
Not available
Index construction
The general Consumer Confidence Index is based on six indices which the researchers at ARA
use to measure the level of the consumer satisfaction and optimism. These are:
1. Current Economic Situation Index
2. Expected Economic Situation Index
3. Current Personal Income Index
4. Expected Personal Income Index
5. Current Employment Opportunities Index
6. Purchase of Durables Index

LATVIA
Name of survey
The Joint Harmonized EU Consumer Confidence Indicator
Source
European Commission; Directorate-General for Economic and Financial Affairs (DG ECFIN)
Frequency
Monthly
Scope
Random sample of 1,000 Latvian households
Survey questions
The Joint Harmonized EU Consumer Confidence Indicator is based on answers to four questions:
1. How do you expect the financial position of your household to change over the next 12
months?
2. How do you expect the general economic situation in this country to develop over the
next 12 months?
3. How do you expect the number of people unemployed in this country to change over the
next 12 months?
4. Over the next 12 months, how likely is it that you will save any money?
Index construction
The Joint Harmonized EU Consumer Confidence Indicator is based on answers to four questions
with five answer alternatives to each question (a lot better, a little better, the same, a little worse, a
lot worse). The index is constructed with double weights on the extremes. Responses “a lot better”
and “a lot worse” get the weight 1 and “a little better” and “a little worse” get the weight 1/2, and “the
same” has zero weight. Values range from −100, when all respondents choose the most negative
option, to +100, when all respondents choose the most positive answers.
LITHUANIA
Name of survey
The Joint Harmonized EU Consumer Confidence Indicator
Source
European Commission; Directorate-General for Economic and Financial Affairs (DG ECFIN)
Frequency
Monthly

Scope
Random sample of 1,200 Lithuanian households
Survey questions
The Joint Harmonized EU Consumer Confidence Indicator is based on answers to four questions:
1. How do you expect the financial position of your household to change over the next 12
months?
2. How do you expect the general economic situation in this country to develop over the
next 12 months?
3. How do you expect the number of people unemployed in this country to change over the
next 12 months?
4. Over the next 12 months, how likely is it that you will save any money?
Index construction
The Joint Harmonized EU Consumer Confidence Indicator is based on answers to four questions
with five answer alternatives to each question (a lot better, a little better, the same, a little worse, a
lot worse). The index is constructed with double weights on the extremes. Responses “a lot better”
and “a lot worse” get the weight 1 and “a little better” and “a little worse” get the weight 1/2, and “the
same” has zero weight. Values range from −100, when all respondents choose the most negative
option, to +100, when all respondents choose the most positive answers.
MALAYSIA
Name of survey
Consumer Sentiments Index
Source
Malaysian Institute of Economic Research
Frequency
Quarterly
Scope
Sample of over 1,200 households in Peninsular Malaysia
Survey questions
Respondents are asked about perceptions on their household's current and expected financial
positions and their employment outlook. The survey also seeks to uncover general economic
conditions such as inflation as seen from the consumers' perspective. Questions relating to their
plans to buy houses, new or used cars and other major consumer durables are also asked.
Index construction
The index values range from 0 (when all respondents have negative confidence) to 200 (when all
respondents have positive confidence).

MEXICO
Name of survey
Consumer Confidence Index (Indice de Confianza del Consumidor)
Source
Instituto Nacional de Estadistica y Geografia (Inegi)
Frequency
Monthly
Scope
2,336 urban households at national level.
Survey questions
1. Compared to the economic situation that the members of the household had 1 year ago,
how do you rate your economic situation today?
2. How do you consider the economic situation of the members of the household will be 12
months from now, compared to the current situation?
3. How do you think the economic situation of the country is today compared to 12 months
ago?
4. How do you consider the economic situation of the country will be 12 months from now,
compared to the current situation?
5. Comparing your current economic situation with that one year ago, how do you rate the
possibility that you or one of the members of the household make purchases like furniture,
TV set, washing machine, other white goods, etc.?
Index construction
In each of the first four questions, consumers have five options to choose an answer from: Much
better, Better, The same, Worse and Much worse. In the fifth question the options are: Higher, Equal
and Lower. The monthly value of the indicator for a given question results of the monthly average of
the (expanded) percentages of the answers of households to that question. The overall index
averages all five indicators.
NETHERLANDS
Name of survey
The Joint Harmonized EU Consumer Confidence Indicator
Source
European Commission; Directorate-General for Economic and Financial Affairs (DG ECFIN)
Frequency
Monthly

Scope
Random sample of 1,500 Dutch households
Survey questions
The Joint Harmonized EU Consumer Confidence Indicator is based on answers to four questions:
1. How do you expect the financial position of your household to change over the next 12
months?
2. How do you expect the general economic situation in this country to develop over the
next 12 months?
3. How do you expect the number of people unemployed in this country to change over the
next 12 months?
4. Over the next 12 months, how likely is it that you will save any money?
Index construction
The Joint Harmonized EU Consumer Confidence Indicator is based on answers to four questions
with five answer alternatives to each question (a lot better, a little better, the same, a little worse, a
lot worse). The index is constructed with double weights on the extremes. Responses “a lot better”
and “a lot worse” get the weight 1 and “a little better” and “a little worse” get the weight 1/2, and “the
same” has zero weight. Values range from −100, when all respondents choose the most negative
option, to +100, when all respondents choose the most positive answers.
NEW ZEALAND
Name of survey
The Westpac McDermott Miller survey of consumer confidence
Source
Westpac McDermott Miller
Frequency
Quarterly
Scope
Random sample of 1,500 New Zealand households
Survey questions
The following questions are asked:
1. Are you better or worse off financially now than a year ago?
2. Do you expect to be better or worse off financially this time next year?
3. Do you expect good or bad economic times over the next 12 months in New Zealand?
4. Do you expect good or bad economic times over the next 5 years in New Zealand?
5. Is this a good or bad time to buy a major household item?

Index construction
Index is expressed as percentage of “positive” responses minus the percentage of “negative”
responses, plus 100. Neutral responses are counted as zero. Values range from 0, when all
respondents choose the negative option to +200, when all respondents choose the positive option.
NIGERIA
Name of survey
Consumer Expectations Survey
Source
Central Bank of Nigeria
Frequency
Quarterly
Scope
Random sample of about 1,800 Nigerian households
Survey questions
The survey questions cover the expectations of macroeconomic conditions, family financial
situation (level of savings, investments, other assets including cash at hand and outstanding debts)
and family income.
Index construction
The total index is determined as the average of three measures (macroeconomic conditions,
family financial situation and family income). Each of the three sub-indices is computed as the
percentage share of respondents that answered affirmatively less the percentage share of
respondents that answered negatively for a given indicator. The index values range from -100 (when
all respondents have negative confidence) to 100 (when all respondents have positive confidence).
NORWAY
Name of survey
Forventningsbarometeret (Expectations Survey)
Source
TNS Gallup; Finance Norway
Frequency
Quarterly
Scope
Sample of about 1,100 Norwegian households

Survey questions
The following questions are asked:
1. Would you say that the economy of your household is better or worse than a year ago, or is
there no difference?
2. Do you think that the economy of your household is going to be better or worse in a year or
will there be no difference?
3. If we look at the economic situation in Norway, would you say that the economy of the
country in general is better or worse than a year ago, or is there no difference?
4. Do you think that the economic situation in Norway is going to be better or worse in a year,
or will there be no difference?
5. Do you think that now is a good time for the population to buy large household items or do
you think it is a bad time?
Index construction
The index is the difference between the percentage of optimistic and pessimistic responses for
each question divided by 5. The index values range from -100 (when all respondents have negative
confidence) to 100 (when all respondents have positive confidence). The data are seasonally
adjusted.
PERU
Name of survey
Apoyo Consultoria Consumer Confidence Index (Indice de Confianza del Consumidor de Apoyo
Consultoria)
Source
Apoyo Consultoria
Frequency
Monthly
Scope
Not available
Survey questions
Not available
Index construction
Not available
PHILIPPINES
Name of survey
Consumer Expectations Survey

Source
Bangko Sentral ng Pilipinas; National Statistics Office
Frequency
Quarterly
Scope
Sample of over 5,000 households
Survey questions
Survey questions are based on three topics concerning the present situation and future
expectations of the households: overall conditions of the economy, household finances and
household income.
Index construction
The index is computed as the percentage of households that answered affirmatively less the
percentage of households that answered negatively with respect to their views on a given indicator.
The index values range from -100 (when all respondents have negative confidence) to 100 (when
all respondents have positive confidence).
POLAND
Name of survey
The Joint Harmonized EU Consumer Confidence Indicator
Source
European Commission; Directorate-General for Economic and Financial Affairs (DG ECFIN)
Frequency
Monthly
Scope
Sample of 1,000 households
Survey questions
The Joint Harmonized EU Consumer Confidence Indicator is based on answers to four questions:
1. How do you expect the financial position of your household to change over the next 12
months?
2. How do you expect the general economic situation in this country to develop over the
next 12 months?
3. How do you expect the number of people unemployed in this country to change over the
next 12 months?
4. Over the next 12 months, how likely is it that you will save any money?
Index construction
The Joint Harmonized EU Consumer Confidence Indicator is based on answers to four questions
with five answer alternatives to each question (a lot better, a little better, the same, a little worse, a
lot worse). The index is constructed with double weights on the extremes. Responses “a lot better”
and “a lot worse” get the weight 1 and “a little better” and “a little worse” get the weight 1/2, and “the
same” has zero weight. Values range from −100, when all respondents choose the most negative
option, to +100, when all respondents choose the most positive answers.
PORTUGAL
Name of survey
The Joint Harmonized EU Consumer Confidence Indicator
Source
European Commission; Directorate-General for Economic and Financial Affairs (DG ECFIN)
Frequency
Monthly
Scope
Random sample of 2,100 Portuguese households
Survey questions
The Joint Harmonized EU Consumer Confidence Indicator is based on answers to four questions:
1. How do you expect the financial position of your household to change over the next 12
months?
2. How do you expect the general economic situation in this country to develop over the
next 12 months?
3. How do you expect the number of people unemployed in this country to change over the
next 12 months?
4. Over the next 12 months, how likely is it that you will save any money?
Index construction
The Joint Harmonized EU Consumer Confidence Indicator is based on answers to four questions
with five answer alternatives to each question (a lot better, a little better, the same, a little worse, a
lot worse). The index is constructed with double weights on the extremes. Responses “a lot better”
and “a lot worse” get the weight 1 and “a little better” and “a little worse” get the weight 1/2, and “the
same” has zero weight. Values range from −100, when all respondents choose the most negative
option, to +100, when all respondents choose the most positive answers.
QATAR
Name of survey
Consumer Confidence Index
Source
Ministry of Development Planning and Statistics
Frequency
Monthly
Scope
Not available
Survey questions
The index is based on five questions of which two sub-indices are composed as follows:
1. The present situation index, which is composed of: a. The respondents’ evaluation of the present economic situation; b. The respondents’ evaluation of the present job opportunities.
2. The future expectations index, which is composed of: a. The respondents’ expectations of the future situation of the economy (12 months in
the future); b. The respondents’ expectations of the future job opportunities (12 months in the
future); c. The respondents’ expectations of the future financial status for them and for their
households (12 months in the future).
Index construction
The index is calculated based on the balance of assessments of the responses of the relevant
questions. The index value ranges from 0 to 200 points. It reaches its maximum if all the
respondents’ opinions are positive. The index becomes neutral (100) when the positive and negative
opinions are equal. If it is lower than 100 points, then it corresponds to a negative evaluation of the
economic situation of Qatar.
ROMANIA
Name of survey
The Joint Harmonized EU Consumer Confidence Indicator
Source
European Commission; Directorate-General for Economic and Financial Affairs (DG ECFIN)
Frequency
Monthly
Scope
Random sample of 1,000 Romanian households
Survey questions
The Joint Harmonized EU Consumer Confidence Indicator is based on answers to four questions:
1. How do you expect the financial position of your household to change over the next 12
months?

2. How do you expect the general economic situation in this country to develop over the
next 12 months?
3. How do you expect the number of people unemployed in this country to change over the
next 12 months?
4. Over the next 12 months, how likely is it that you will save any money?
Index construction
The Joint Harmonized EU Consumer Confidence Indicator is based on answers to four questions
with five answer alternatives to each question (a lot better, a little better, the same, a little worse, a
lot worse). The index is constructed with double weights on the extremes. Responses “a lot better”
and “a lot worse” get the weight 1 and “a little better” and “a little worse” get the weight 1/2, and “the
same” has zero weight. Values range from −100, when all respondents choose the most negative
option, to +100, when all respondents choose the most positive answers.
RUSSIA
Name of survey
Index of Consumer Confidence
Source
Federal State Statistics Service
Frequency
Quarterly
Scope
Territorial multistage sample of 5,000 people aged 16 and over living in private households in all
the regions of Russia.
Survey questions
The topics asked in the survey include:
1. The economic situation of Russia (current status and expected changes in the short
and long term)
2. The economic situation of the administrative division where the household lives
3. The expected changes in prices
4. The expected change in the number of unemployed
5. The personal financial situation (current, past and expected changes)
6. Conditions for major purchases and savings
The specific answers to the questions are provided by the following options:
1. Definitely positive/negative (very good, very favourable/very bad, very unfavourable)
2. Rather positive/negative (good, rather good/bad, rather bad)
3. Neutral (average, about the same)

Index construction
Individual indexes are calculated based on the balance of assessments of the responses (in
percentages) of the relevant questions. Definitely positive/negative responses are weighted by 1;
rather positive/negative by 1/2; and neutral responses are disregarded.
The Index of Consumer Confidence is the arithmetic mean of five Individual Indexes covering Past
and Current (1) and Expected Changes (2) to the personal financial situation; Past and Current (3)
and Expected Changes (4) to the economic situation in Russia; and Conditions for major purchases
(5).
The index values range from -100 (when all respondents have negative confidence) to 100 (when
all respondents have positive confidence).
SAUDI ARABIA
Name of survey
Bayt.com Middle East Consumer Confidence Index
Source
Bayt.com
Definition
Consumer confidence is a measure of the economic well-being of a country. It is a reflection of
consumer satisfaction levels and expectations based on various factors in the economy - inflation,
stock market performance, job opportunities/salary structures, unemployment, investment
avenues/returns, business growth, state economic policies, infrastructure, cost of living, interest
rates, exchange rates etc.
Frequency
Quarterly
Scope
Adult males and females aged 18 plus years
Reporting method
Online data collection
Survey questions
The survey questions include topics such as current and future views on personal financial
situation, country’s economy, business conditions, job availability and satisfaction.
Index construction
The index values range from 0 (when all respondents have negative confidence) to 200 (when all
respondents have positive confidence).
SLOVAKIA

Name of survey
The Joint Harmonized EU Consumer Confidence Indicator
Source
European Commission; Directorate-General for Economic and Financial Affairs (DG ECFIN)
Frequency
Monthly
Scope
Random sample of 1,400 Slovak households
Survey questions
The Joint Harmonized EU Consumer Confidence Indicator is based on answers to four questions:
1. How do you expect the financial position of your household to change over the next 12
months?
2. How do you expect the general economic situation in this country to develop over the
next 12 months?
3. How do you expect the number of people unemployed in this country to change over the
next 12 months?
4. Over the next 12 months, how likely is it that you will save any money?
Index construction
The Joint Harmonized EU Consumer Confidence Indicator is based on answers to four questions
with five answer alternatives to each question (a lot better, a little better, the same, a little worse, a
lot worse). The index is constructed with double weights on the extremes. Responses “a lot better”
and “a lot worse” get the weight 1 and “a little better” and “a little worse” get the weight 1/2, and “the
same” has zero weight. Values range from −100, when all respondents choose the most negative
option, to +100, when all respondents choose the most positive answers.
SLOVENIA
Name of survey
The Joint Harmonized EU Consumer Confidence Indicator
Source
European Commission; Directorate-General for Economic and Financial Affairs (DG ECFIN)
Frequency
Monthly
Scope
Random sample of 1,500 Slovenian households
Survey questions
The Joint Harmonized EU Consumer Confidence Indicator is based on answers to four questions:
1. How do you expect the financial position of your household to change over the next 12
months?
2. How do you expect the general economic situation in this country to develop over the
next 12 months?
3. How do you expect the number of people unemployed in this country to change over the
next 12 months?
4. Over the next 12 months, how likely is it that you will save any money?
Index construction
The Joint Harmonized EU Consumer Confidence Indicator is based on answers to four questions
with five answer alternatives to each question (a lot better, a little better, the same, a little worse, a
lot worse). The index is constructed with double weights on the extremes. Responses “a lot better”
and “a lot worse” get the weight 1 and “a little better” and “a little worse” get the weight 1/2, and “the
same” has zero weight. Values range from −100, when all respondents choose the most negative
option, to +100, when all respondents choose the most positive answers.
SOUTH AFRICA
Name of survey
Consumer Confidence Index
Source
Bureau for Economic Research (BER)
Frequency
Quarterly
Scope
Area-stratified probability sample of 2,500 households
Survey questions
1. How do you expect the general economic position in South Africa to develop during the
next 12 months? Will it improve considerably, improve slightly, deteriorate slightly,
deteriorate considerably or don’t know?
2. How do you expect the financial position in your household to develop in the next 12
months? Will it improve considerably, improve slightly, deteriorate slightly, deteriorate
considerably or don’t know?
3. What is your opinion of the suitability of the present time for the purchase of domestic
appliances such as furniture, washing machines, refrigerators etc? Do you think that for
people in general it is the right time, neither a good nor a bad time or the wrong time?

Index construction
The net balance is derived as the percentage of respondents expecting an improvement less the
percentage expecting a deterioration. The answers of the first and second question are weighted as
follows: improve considerably (+10), improve slightly (+5), deteriorate slightly (-5) and deteriorate
considerably (-10). The responses of the third question are weighted in the following manner: right
time to buy (+10) and wrong time to buy (-10). The composite consumer confidence index is the
average of the results of the above three questions.
The index values range from -100 (when all respondents have negative confidence) to 100 (when
all respondents have positive confidence).
SOUTH KOREA
Name of survey
Consumer Survey Index
Source
The Bank of Korea
Frequency
Monthly (Quarterly from 3Q 1995 to 2Q 2008)
Scope
Covers 2,200 from a total of about 12 million urban households
Survey questions
Consumer Survey asks consumers about domestic economic situations, living standards,
valuation of assets, etc. (the current situation and expectation for next six months or a year).
Categories included are:
1. Domestic economic situations
2. Living standards
3. Total family income
4. Spending plans
Index construction
Individual consumer indices are calculated according to the formula:
Individual CSI = (very positive x 1.0 + somewhat positive x 0.5 + similar x 0.0 – somewhat
negative x 0.5 – very negative x 1.0) / (total number of households surveyed) x 100 + 100
The composite index is calculated as the sum of the six individual indices standardised so that the
historical average is equal to 100 and the standard deviation is equal to 10.
SPAIN
Name of survey
The Joint Harmonized EU Consumer Confidence Indicator

Source
European Commission; Directorate-General for Economic and Financial Affairs (DG ECFIN)
Frequency
Monthly
Scope
Random sample of 2,000 Spanish households
Survey questions
The Joint Harmonized EU Consumer Confidence Indicator is based on answers to four questions:
1. How do you expect the financial position of your household to change over the next 12
months?
2. How do you expect the general economic situation in this country to develop over the
next 12 months?
3. How do you expect the number of people unemployed in this country to change over the
next 12 months?
4. Over the next 12 months, how likely is it that you will save any money?
Index construction
The Joint Harmonized EU Consumer Confidence Indicator is based on answers to four questions
with five answer alternatives to each question (a lot better, a little better, the same, a little worse, a
lot worse). The index is constructed with double weights on the extremes. Responses “a lot better”
and “a lot worse” get the weight 1 and “a little better” and “a little worse” get the weight 1/2, and “the
same” has zero weight. Values range from −100, when all respondents choose the most negative
option, to +100, when all respondents choose the most positive answers.
SWEDEN
Name of survey
The Joint Harmonized EU Consumer Confidence Indicator
Source
European Commission; Directorate-General for Economic and Financial Affairs (DG ECFIN)
Frequency
Monthly
Scope
Random sample of 1,500 Swedish households
Survey questions
The Joint Harmonized EU Consumer Confidence Indicator is based on answers to four questions:
1. How do you expect the financial position of your household to change over the next 12
months?
2. How do you expect the general economic situation in this country to develop over the next
12 months?
3. How do you expect the number of people unemployed in this country to change over the
next 12 months?
4. Over the next 12 months, how likely is it that you will save any money?
Index construction
The Joint Harmonized EU Consumer Confidence Indicator is based on answers to four questions
with five answer alternatives to each question (a lot better, a little better, the same, a little worse, a
lot worse). The index is constructed with double weights on the extremes. Responses “a lot better”
and “a lot worse” get the weight 1 and “a little better” and “a little worse” get the weight 1/2, and “the
same” has zero weight. Values range from −100, when all respondents choose the most negative
option, to +100, when all respondents choose the most positive answers.
SWITZERLAND
Name of survey
Index of Consumer Sentiment
Source
Swiss Institute for Business Cycle Research
Frequency
Quarterly
Scope
Not available
Survey questions
Not available
Index construction
Data for each question are expressed as the balance of positive over negative answers. The
Consumer Sentiment Index is then calculated as an average of three separate indexes: economic
development in the past, financial situation in the past, expected financial situation.
The index values range from -100 (when all respondents have negative confidence) to 100 (when
all respondents have positive confidence).
TAIWAN
Name of survey
Consumer Confidence Index
Source
Research Center for Taiwan Economic Development, National Central University
Frequency
Monthly
Scope
Random sample of over 2,000 individuals aged 20+.
Survey questions
The questions cover topics such as expectations about the domestic price level, household
economic conditions, domestic employment, overall economic conditions, investing in stocks and
buying durable goods.
Index construction
The index is calculated as an average of 6 sub-indices related to 6 various topics. Each of the
sub-indices is calculated according to the following formulas:
Domestic price level over the next 6 months:
Sub-index = 100 + [(100 × % of answers “expected to fall”) + (50 × % of answers “expected to be
stable”) – (50 × % of answers “expected to rise slightly”) – (100 × % of answers “expected to rise
sharply”)]
Household economic conditions over the next 6 months; domestic employment over the next 6 months; overall economic conditions over the next 6 months:
Sub-index = 100 + [(100 × % of answers “much better”) + (50 × % of answers “slightly better”) + (0
× % of answers “unchanged”) – (50 × % of answers “slightly worse”) – (100 × % of answers “much
worse”)]
Are the next 6 months good for investing in stocks:
Sub-index = 100 + [(100 × % of answers “good”) + (0 × % of answers “do not know”) – (100 × %
of answers “bad”)]
Are the next 6 months good for buying durable goods:
Sub-index = 100 + [(100 × % of answers “very good”) + (50 × % of answers “good”) + (0 × % of
answers “neutral”) – (50 × % of answers “bad”) – (100 × % of answers “very bad”)]
The overall index can range between 0 and 200, with 100 indicating a neutral confidence level.
THAILAND
Name of survey
Consumer Confidence Index
Source
Bureau of Trade and Economic Indices
Frequency
Monthly
Scope
Sample of about 1,100 households in Thailand
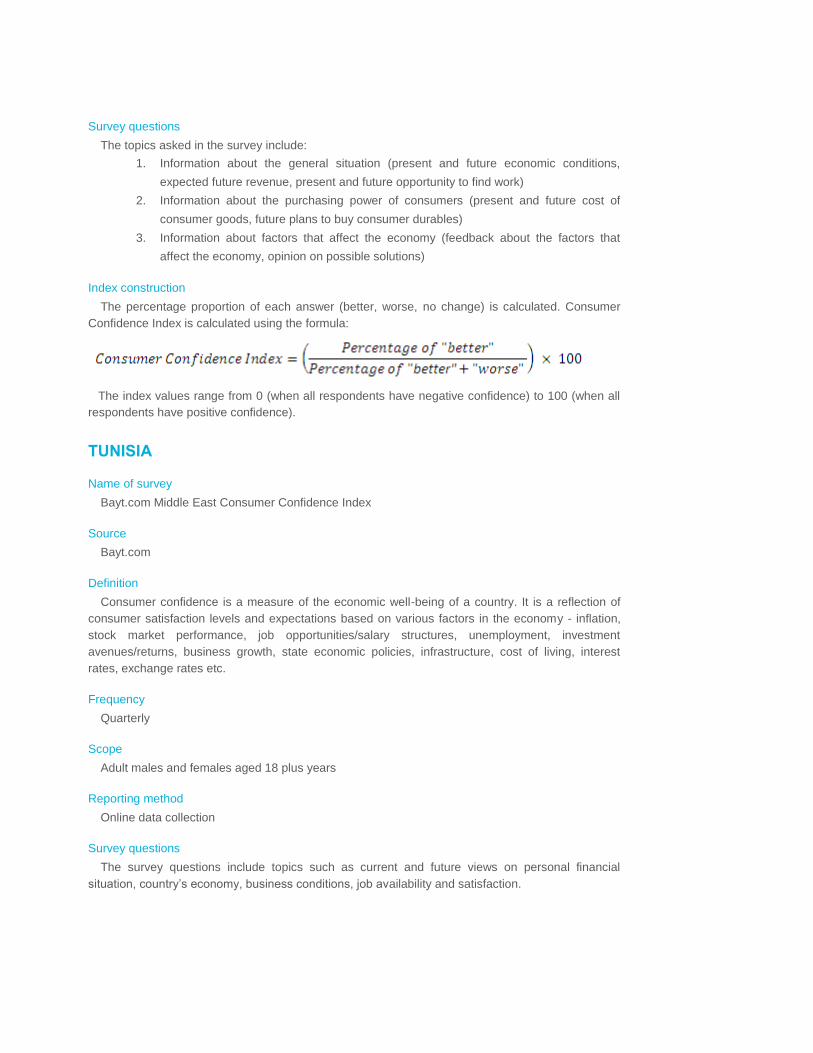
Survey questions
The topics asked in the survey include:
1. Information about the general situation (present and future economic conditions,
expected future revenue, present and future opportunity to find work)
2. Information about the purchasing power of consumers (present and future cost of
consumer goods, future plans to buy consumer durables)
3. Information about factors that affect the economy (feedback about the factors that
affect the economy, opinion on possible solutions)
Index construction
The percentage proportion of each answer (better, worse, no change) is calculated. Consumer
Confidence Index is calculated using the formula:
The index values range from 0 (when all respondents have negative confidence) to 100 (when all
respondents have positive confidence).
TUNISIA
Name of survey
Bayt.com Middle East Consumer Confidence Index
Source
Bayt.com
Definition
Consumer confidence is a measure of the economic well-being of a country. It is a reflection of
consumer satisfaction levels and expectations based on various factors in the economy - inflation,
stock market performance, job opportunities/salary structures, unemployment, investment
avenues/returns, business growth, state economic policies, infrastructure, cost of living, interest
rates, exchange rates etc.
Frequency
Quarterly
Scope
Adult males and females aged 18 plus years
Reporting method
Online data collection
Survey questions
The survey questions include topics such as current and future views on personal financial
situation, country’s economy, business conditions, job availability and satisfaction.

Index construction
The index values range from 0 (when all respondents have negative confidence) to 200 (when all
respondents have positive confidence).
TURKEY
Name of survey
Consumer Confidence Index
Source
Central Bank of Turkey
Frequency
Monthly
Scope
2,000 individuals at the age of 15 and above who have an income from economic activity.
Survey questions
Categories included:
1. General Economic Situation: Consumers’ assessments on current general economic
situation in Turkey compared to past 3 months and their expectations for the general
economic
2. Situation in Turkey over the next 3 months, their expectations for job opportunities in
Turkey over the next 6 months, their assessments on timing of setting aside savings
and buying durable consumption goods.
3. Expenditures: Consumers’ expenditure plans for buying durable and semi-durable
goods, car, house and spending on house renovation.
4. Price Expectations: Consumers’ expectations for the direction of changes in prices
over the next 12 months.
Index construction
Indices are compiled in accordance with the balance method of European Union. The balance is
calculated as the difference between the percentages of positive and negative responses and 100 is
added to this difference, thus forming a separate diffusion index for each question. Then, the general
index is calculated by taking arithmetic means of diffusion indices of the questions included in
consumer confidence index.
The index is evaluated between 0 and 200. If it is above 100, it means consumer confidence is
optimistic. If it is below 100, consumer confidence is pessimistic. 100 refer to neutral opinion in
consumer confidence.
UKRAINE
Name of survey
GfK Ukraine Consumer Confidence Survey
Source
GfK Ukraine
Frequency
Monthly
Scope
Random survey of 1,000 individuals aged 15-59
Survey questions
1. How has the financial standing of your family changed over the last six months?
2. How do you think your family’s financial standing will change in the next six months?
3. Looking at economic conditions in the country as a whole, do you think the next 12 months
will be good or bad?
4. Looking at the next five years, will they be good ones or bad ones for the country’s
economy?
5. In terms of large purchases for your home, do you think now is generally a good time or a
bad time to make such purchases?
Index construction
For each of the five questions, an index is calculated: the share of negative answers is deducted
from the share of positive answers, and 100 is added to this difference in order to eliminate negative
values. Consumer Confidence Index is calculated as the arithmetic average of these five indices.
The index value can range from 0 to 200.
UNITED ARAB EMIRATES
Name of survey
Bayt.com Middle East Consumer Confidence Index
Source
Bayt.com
Frequency
Quarterly
Scope
Adult males and females aged 18 plus years
Survey questions
The survey questions include topics such as current and future views on personal financial
situation, country’s economy, business conditions, job availability and satisfaction.
Index construction
The index values range from 0 (when all respondents have negative confidence) to 200 (when all
respondents have positive confidence).
UNITED KINGDOM
Name of survey
The Joint Harmonized EU Consumer Confidence Indicator
Source
European Commission; Directorate-General for Economic and Financial Affairs (DG ECFIN)
Frequency
Monthly
Scope
Random sample of 2,000 households
Survey questions
The Joint Harmonized EU Consumer Confidence Indicator is based on answers to four questions:
1. How do you expect the financial position of your household to change over the next 12
months?
2. How do you expect the general economic situation in this country to develop over the next
12 months?
3. How do you expect the number of people unemployed in this country to change over the
next 12 months?
4. Over the next 12 months, how likely is it that you will save any money?
Index construction
The Joint Harmonized EU Consumer Confidence Indicator is based on answers to four questions
with five answer alternatives to each question (a lot better, a little better, the same, a little worse, a
lot worse). The index is constructed with double weights on the extremes. Responses “a lot better”
and “a lot worse” get the weight 1 and “a little better” and “a little worse” get the weight 1/2, and “the
same” has zero weight. Values range from −100, when all respondents choose the most negative
option, to +100, when all respondents choose the most positive answers.
URUGUAY
Name of survey
Indice de Confianza del Consumidor (Consumer Confidence Index)
Source
Universidad Catolica del Uruguay - Departamento de Economia

Frequency
Monthly
Scope
A sample of 400 individuals aged 18 years or more living in the country’s urban areas
Survey questions
1. What do you think will be the country’s economic situation in a year: better, the same or
worse than currently?
2. What do you think will be the country’s economic situation in 3 years: better, the same or
worse than currently?
3. What is your current personal economic situation compared to a year ago: better, the same
or worse?
4. What do you think will be your personal economic situation in a year: better, the same or
worse than currently?
5. Do you think it is a good time to make purchases such as household appliances?
6. Do you think it is a good time to make major purchases such as cars, or to change a
house?
Index construction
The survey questions form three sub-indices: questions 1 and 2 – the index of country economic
situation; questions 3 and 4 – the index of personal economic situation index; questions 5 and 6 –
the index of predisposition to purchase durable goods. The Consumer Confidence Index is a simple
average of the three sub-indices.
The index values range from 0 (when all respondents have negative confidence) to 100 (when all
respondents have positive confidence).
USA
Name of survey
University of Michigan Index of Consumer Sentiment (ICS)
Source
University of Michigan
Frequency
Monthly
Scope
Random sample of 500 households across states, excluding Alaska and Hawaii.
Survey questions
5 questions are asked:
1. Would you say that you (and your family living there) are better off or worse off financially
than you were a year ago?

2. Looking ahead – do you think that a year from now you (and your family living there) will be
better off financially, or worse off, or just about the same as now?
3. Turning to business conditions in the country as a whole – do you think that during the next
twelve months we will have good times financially, or bad times, or what?
4. Looking ahead, which would you say is more likely – that in the country as a whole we will
have continuous good times during the next five years or so, or that we will have periods of
widespread unemployment or depression, or what?
5. About the big things people buy for their homes – such as furniture, a refrigerator, stove,
television, and things like that. Generally speaking, do you think now is a good or bad time
for people to buy major household items?
Index construction
The ICS is calculated by computing the “relative scores” for each of the five index questions: the
percent giving favourable replies minus the percent giving unfavourable replies, plus 100. Each
relative score is then rounded to the nearest whole number. All five relative scores are then summed
and the sum is divided by 6.7558 (the 1966 base period) and the result is added 2 (a constant to
correct for sample design changes from the 1950s). First Quarter 1966 =100.
VIETNAM
Name of survey
ANZ Roy Morgan Consumer Confidence Survey
Source
ANZ-Roy Morgan
Frequency
Monthly
Scope
A sample of 1,000 individuals
Survey questions
5 questions are asked:
1. Would you say you and your family are better off financially or worse off than you were at
this time last year?
2. This time next year, do you and your family expect to be better off financially or worse off
than you are now?
3. Thinking of economic conditions in Vietnam as a whole, in the next 12 months do you
expect we'll have good times financially, or bad times, or some good and some bad?
4. Looking ahead, what would you say is more likely, than in Vietnam as a whole, we'll have
continuous good times during the next five years or so - or we'll have bad times?
5. Generally, do you think now is a good time - or a bad time - for people to buy major
household items?

Index construction
The overall index is computed as an average of the five questions net balance plus 100.

7. HOUSE PRICE INDICES: METHODOLOGY & SOURCES
ARGENTINA
Name of survey
Indice de Precios Vivienda Usada (Used Housing Price Index)
Source
Cdi Consult
Definition
The index reflects changes in the sales price of used residential dwellings at national level.
Frequency
Monthly
Index scope and construction
Not available
AUSTRALIA
Name of survey
Residential Property Price Index
Source
Australian Bureau of Statistics
Definition
The Residential Property Price Index measures the price change in all residential dwellings within
the eight greater capital city statistical areas over a period of time.
Frequency
Quarterly
Index scope and construction
The Residential Property Price Index covers the cities of Sydney, Melbourne, Brisbane, Adelaide,
Perth, Hobart, Darwin and Canberra. The index is an aggregation of two indices: the Established
House Price Index (covering all established detached houses on their own block of land) and the
Attached Dwellings Price Index (covering flats, units, apartments, semi-detached, row and terrace
houses). The scope is restricted to those dwellings where the primary purpose is residential (i.e.
excluding commercial properties) regardless of ownership and tenure of the occupants (i.e. including
government owned properties and properties owned by private landlords).
The ABS employs a stratification approach to compile the Residential Property Price Index. The
stratification approach separates the total sample of residential properties into a number of sub-
samples or strata. Dwelling transactions are stratified by dwelling type, long term median price and
Socio-economic Index for Areas score. Each quarter, the strata are re-valued by applying a price
relative (i.e. the current period median price of the stratum compared to the previous period median
price of the same stratum) to the value of the dwelling stock for that stratum to produce a current
period stratum value. The current period values of each stratum are then summed to derive the
current value of the total dwelling stock in the capital city. Index numbers are subsequently derived
from the total values. When the number of price observations available for a stratum is nil or
extremely low in a quarter, a price movement for the stratum is derived using imputation methods
based on price movements of other strata.
AUSTRIA
Name of survey
Residential Property Price Index
Source
Österreichische Nationalbank; European Central Bank
Definition
The index reflects the changes in the dwelling prices (new and used condominiums and single-
family homes) in Austria.
Frequency
Quarterly
Index scope and construction
For the calculation of the real estate price index, the prices of new and used condominiums and
detached homes are used. The data is gathered from Austria Real Estate Exchange (Austria
Immobilienbörse), a platform bringing together 17 real estate agencies. The data pool consists of
more than 27 000 records of transactions and offer prices. The indices for Vienna and Austria
without Vienna are calculated by Österreichische Nationalbank using a hedonic regression model
with a fixed structure over time. Using these two indices, the aggregate index for Austria is
calculated by European Central Bank as a weighted average of mean indices, with the weights
corresponding to the population weights of Vienna and Austria without Vienna.
BELARUS
Name of survey
Minsk Apartment Price Statistics
Source
Realt.by

Definition
The index reflects changes in the average price per square meter of apartments in Minsk.
Frequency
Monthly
Index scope and construction
The data on apartment prices in Minsk is gathered daily based on the Realt.by database and is
averaged at the end of each week and each month. The data covers 1-room to 4-room apartments
in 9 districts of Minsk. The outliers are eliminated from the data sample.
BELGIUM
Name of survey
Sales price statistics of ordinary residential houses
Source
Statistics Belgium
Definition
The index reflects changes in the average sales price of an ordinary residential house across
Belgium.
Frequency
Quarterly
Index scope and construction
Sales price statistics are based on all property transactions in which the registration fees have
been paid. Data is collected from Cadastre du SPF Finances.
BRAZIL
Name of survey
Residential Real Estate Collateral Value Index
Source
Banco Central do Brasil
Definition
The Residential Real Estate Collateral Value Index measures the long-run trend in the residential
real estate prices.
Frequency
Monthly

Index scope and construction
The index is calculated using the values of property tied to mortgages of individuals with
guaranteed residential mortgage on property in the 11 metropolitan areas (Belém, Belo Horizonte,
Brasília, Curitiba, Fortaleza, Goiânia, Porto Alegre, Recife, Rio de Janeiro, Salvador and São
Paulo). Each metropolitan area is subdivided into geographical areas, composed of adjacent
municipalities and that together comprise a minimum monthly amount of grant mortgages. The
median value of property valuation tied to mortgages issued during the past three months in each
geographical area is the representative value of the month for that area. The long-term trend of each
series of monthly medians in each geographical area is obtained by Hodrick-Prescott filter. The
monthly change in the trend of each area is weighted by the number of households obtained from
the IBGE Census 2010 to form the corresponding variation of the metropolitan region. The series of
11 regions are again weighted by the number of households, forming the national index.
BULGARIA
Name of survey
Price Index of Dwellings
Source
National Statistical Institute
Definition
The index is constructed to obtain representative data on average price index of old flats in district
centers and for the total country.
Frequency
Quarterly
Index scope and construction
The coverage of the survey is defined by two samples:
1. A sample of sold dwellings (flats) built up by standard plans and comparable by predefined
parameters (new flats are excluded from the sample);
2. A sample of real estate agencies with Bulstat registration and main income for the last year
based on the real estate sales.
Information on the prices and indices calculations is obtained by the quarterly survey on the
market prices of dwellings. Survey is carried out on an inquiry principle. Registration of prices is
done by qualified personnel (registrars) from RSO who collect information on the real sales of
dwellings (flats) with predefined parameters which characterize the market most precisely.
CANADA
Name of survey
Teranet - National Bank National Composite House Price Index
Source
Teranet; National Bank of Canada
Definition
The index is an independently developed representation of the rate of change of home prices in
eleven metropolitan areas, namely Ottawa-Gatineau, Toronto, Calgary, Vancouver, Montreal,
Halifax, Victoria, Edmonton, Winnipeg, Hamilton and Quebec. The metropolitan areas are combined
to form a composite national index.
Frequency
Monthly
Index scope and construction
The index is estimated by tracking the sale prices of condominiums, row/town houses and single
family homes within the eleven metropolitan areas. The estimation of the index is based on the
assumption of constant level quality of the single family dwellings and that any price changes are
driven only by market trends. Thus, the indices attempt to reflect market prices by minimizing or
eliminating the influence of any changes in the physical characteristics (e.g., renovations) of the
houses.
The estimation of the indices is based on the “repeat sales methodology”. Properties with at least
two sales are required in the calculations. Such a “sales pair” measures the increase or decrease of
the property value in the period between the sales in a linear fashion. Properties that are affected by
endogenous factors are not considered in the estimation. These factors may include: a) non-arms-
length sale, b) change of type of property, for example after renovations, c) data error, and d) high
turnover frequency (biannual or higher). In the repeat sales methodology, the averaging of price
appreciation from different pairs of sales is done using a complex estimation process in which each
pair is a separate observation.
CHILE
Name of survey
Residential Property Price Index
Source
Central bank of Chile
Definition
The index reflects changes in the price of new and second-hand houses and apartments in Chile.
Frequency
Quarterly
Index scope and construction
The Residential Property Price Index (RPPI) is compiled using unnamed administrative records
collected by the Internal Revenue Service (IRS). These records correspond to effective transactions
of new and second-hand properties covering the entire national territory. The used method is
stratification or also known as mix adjustment method. It responds to the specifics characteristics of
the available information in Chile, and it is in accordance to the best international practices. Fourteen

different groups were established, which are the result of combining seven geographical zones and
two kinds of properties (houses and apartments). The RPPI is a weighted average from the fourteen
groups’ price indicators - indexation unit (Unidad de Fomento) by square meter - which corresponds
to the simple average of the price indicator within each group. The weights are defined as square
meters traded on the previous year.
CHINA
Name of survey
Shanghai Second-hand House Price Index
Source
eHomeday
Definition
The index tracks changes in the second-hand residential house prices in Shanghai.
Frequency
Monthly
Index scope and construction
Not available
COLOMBIA
Name of survey
Used Housing Price Index (Índice de precios de la vivienda usada)
Source
Banco de la República
Definition
The Used Housing Price Index measures the variation in the prices of used housing. It is based
on the information of mortgage loan assessment provided by selected entities of the financial system
(Davivienda, BBVA, Av. Villas, Bancolombia, Colmena BCSC and Colpatria).
Frequency
Quarterly
Index scope and construction
The index covers the cities of Bogotá, Medellín, Cali, and municipalities of Soacha in
Cundinamarca, and Bello, Envigado and Itaguí in Antioquia. The index is calculated using an
adaptation of weighted repeat sales methodology proposed by Case and Shiller. The appraisals of
the same housing units in different periods of time are used for the index construction, according to
the information gathered from loan's appraisals reported by the leading mortgage providers in the
country (Davivienda, BBVA, Av. Villas, Bancolombia, Colmena BCSC and Colpatria).

CROATIA
Name of survey
Property Price Index
Source
Centar Nekretnina
Definition
The index is based on the largest monthly sample of current real estate asking prices in Croatia.
The index tracks changes on a monthly basis and provides comprehensive insight into the current
state of the real estate market in Croatia.
Frequency
Monthly
Index scope and construction
The index is based on real estate asking prices. Centar Nekretnina only takes into consideration
the real estate for which the price was clearly marked in real estate advertisements published on the
CentarNekretnina.net website in the current month.
CZECH REPUBLIC
Name of survey
House Price Index
Source
Czech Statistical Office
Definition
The price index is a synthetic index measuring the development of price levels of residential real
estate in Czech Republic under harmonized EU standards.
Frequency
Quarterly
Index scope and construction
The index measures price development of both new and second-hand flats and houses including
related land. Only household purchases are considered; other sector purchases are excluded.
DENMARK
Name of survey
Price Index for Sales of Property
Source
Statistics Denmark
Definition
The index shows the developments in the prices of one-family houses in Denmark.
Frequency
Quarterly
Index scope and construction
The current statistics cover sales in ordinary free trade, intra-family sales and other sales (e.g.
forced sales). The data is collected via registers by the Ministry of Taxation.
All sales, which meet the following conditions are included:
There are no special conditions, i.e. partial property sold, more than one property sold, seller is a
public authority (with the exception of building sites), sales information is missing or price is
exorbitant
The buyer is a private person
Average price per property is calculated as an ordinary average of the sales included in the
number of sales in the price calculation
ESTONIA
Name of survey
Dwelling Price Index
Source
Statistical Office of Estonia
Definition
The index reflects changes in the average price per square meter of new and existing dwellings in
Estonia.
Frequency
Quarterly
Index scope and construction
For calculations, the geometric mean of the square meter prices of dwellings is used.
The index covers apartments and houses (including detached, semi-detached and
terraced houses). To improve the comparability of data, transactions with apartments
smaller than 18 m2 and bigger than 250 m
2 were left out. To avoid the inclusion of extreme
prices, 2% of transactions with the lowest and the highest square metre prices were cut
off. Transactions with houses and apartments in the Old Town of Tallinn were also
excluded as too exclusive.
FINLAND

Name of survey
Prices of Dwellings Index
Source
Statistics Finland; European Central Bank
Definition
The statistics on the prices of dwellings describe the development in the prices of dwellings in
second-hand blocks of flats and terraced houses.
Frequency
Quarterly
Index scope and construction
Statistics are compiled from the taxation authority’s asset transfer tax statements. The index
calculation combines the classical approach based on classification of data and regression analysis
(so-called hedonic method). Because location, type of building and number of rooms are the most
important price determinants, the composition of sold dwellings is first standardized for these
variables by classification. The largest municipalities are divided into several sub-areas, and the
smallest municipalities where few transactions take place have been combined. Dwellings in blocks
of flats are classified by number of rooms into dwellings with one room, dwellings with two rooms
and dwellings with three or more rooms. The overall index point-number for the whole country is
obtained via aggregated price changes in every index class and price adjustments using a so-called
log-Laspeyres formula. The weights for old dwellings are derived as value-shares of stock of
apartments in 2005.
FRANCE
Name of survey
Second-Hand Dwelling Price Index
Source
Institut national de la statistique et des études économiques
Definition
The index is defined as the ratio of the current value of housing to its reference value in the base
period. It refers only to second-hand houses and apartments, which are more than 5 years old or
which have had a second transfer. In addition, only the following types of property are included:
unoccupied at the time of sale (or occupied by the seller);
with a full ownership acquired in an over-the-counter sale;
residential use properties only.
To avoid non-typical transactions, non-standard goods such as rooms, lofts, workshops or castles
and acquisitions made by real estate professionals are excluded.
Frequency
Quarterly
Index scope and construction
The index covers flats and houses in central cities as well as in suburban and rural areas across
France (Île-de-France and the province). The index is calculated based on transactions completed
during the quarter. The price used is the net disposal price, excluding transfer duties, legal fees and
agency commissions. The methodology is based on econometric models for each zone, explaining
the price of a house based on its characteristics (neighborhood, time of construction, number of
rooms, average area per unit etc). Using these models, the value of housing stock reference price
for the current period is estimated.
GEORGIA
Name of survey
ISET Policy Institute Real Estate Price Index
Source
ISET Policy Institute
Definition
The index reflects the changes in sale prices of residential property in Tbilisi.
Frequency
Monthly
Index scope and construction
Firstly, the characteristics of a “typical” real estate unit in each month are determined. To
determine a typical flat in any given month the following metrics are calculated: the median of the log
area of the property advertised in that month, mode of renovation type, mode of district, median of
the number of bedrooms, median of the number of bathrooms, and median of the number of
balconies.
Secondly, a linear regression model on the data in each month is constructed using unit price in
log form as a dependent variable and controlling for various characteristics of the real estate unit.
The control for the following measures is implemented: the log area of the property, type of
renovation, district, number of bedrooms, number of bathrooms and number of balconies.
The regression coefficients tell us how different characteristics of the real estate unit (e.g. location,
number of rooms, etc.) affect the price of the property. The coefficient estimates and the
characteristics of a “typical” real estate unit are then combined to calculate the Laspeyres and
Paasche monthly indices. Both measures are then reconciled by calculating a Fisher-type hedonic
imputation index – the geometric average of the Laspeyres and Paasche indices. The Fisher index
is used as the main indicator of real estate price movement.
GERMANY
Name of survey
Hedonic House Price Index
Source
Hypoport AG
Definition
Hedonic House Price Index monitors price changes in residential dwellings across the country.
Frequency
Monthly
Index scope and construction
The index is based on home-loans transaction data generated on the EUROPACE platform. It is
calculated using a statistical procedure developed in conjunction with Finpolconsult. The hedonic
regression technique is used to ensure a better standardization of the individual characteristics of
real estate. The aim of hedonic regression analysis is to highlight the pure price effect for each
reporting period.
The index includes apartment transactions, newly built and existing homes.
GREECE
Name of survey
Index of Prices of Dwellings
Source
Bank of Greece
Definition
The index reflects the development in residential dwelling prices across Greece, covering Athens
and other urban areas.
Frequency
Quarterly
Index scope and construction
The Bank of Greece collects data from other banks about the detailed data on the value and
quality characteristics of residential properties underlying loan agreements (based on appraisal
reports by the banks). Before the data is processed to construct the index, a more thorough test of
their plausibility is conducted, using logical and statistical rules. Values outside a plausible range for
each variable are excluded, while values close to the limits are treated as “outliers”; in addition,
values with more than 2.5 standard deviations from the average value of each substrate are also
excluded.
After concretizing individual strata, the first step is to estimate analytical indices for each stratum.
For a group of homogenous properties in each stratum, the price index equals the ratio of average
prices per square meter. The average price per square meter for each property group of the stratum
is calculated using the geometric mean. The real estate price index for quarter t, as against the basis
quarter 0 (if I0,t), is given by the formula:
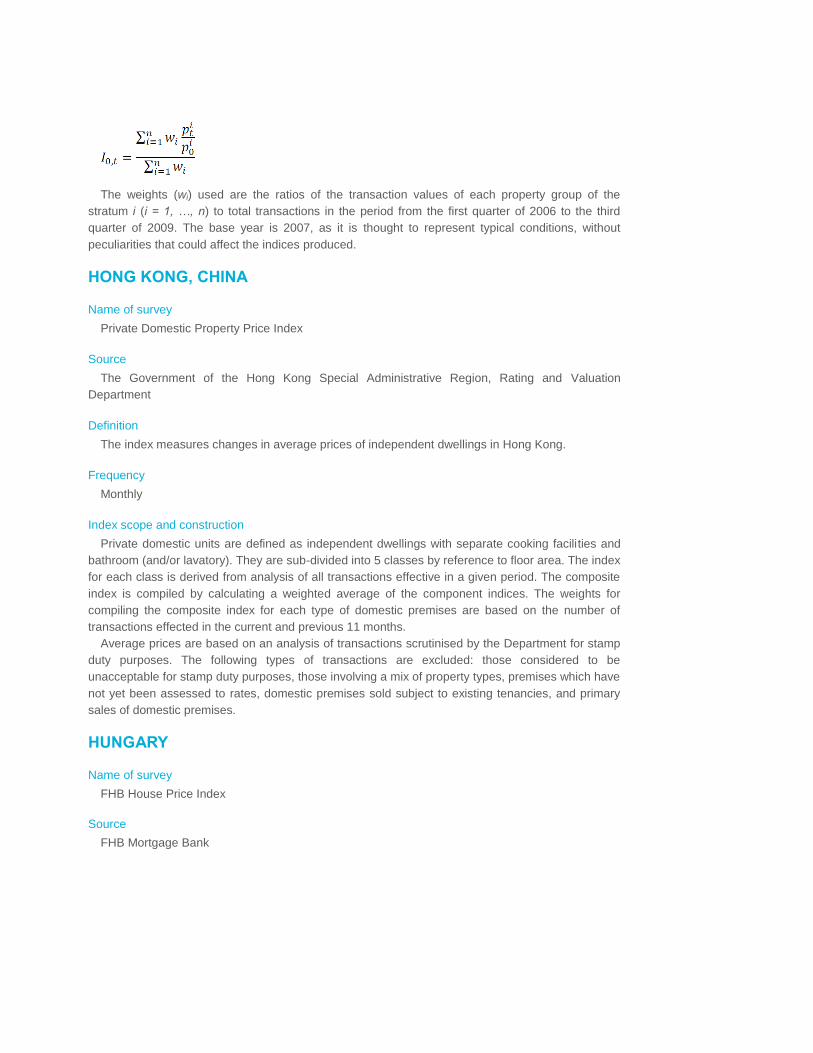
The weights (wi) used are the ratios of the transaction values of each property group of the
stratum i (i = 1, …, n) to total transactions in the period from the first quarter of 2006 to the third
quarter of 2009. The base year is 2007, as it is thought to represent typical conditions, without
peculiarities that could affect the indices produced.
HONG KONG, CHINA
Name of survey
Private Domestic Property Price Index
Source
The Government of the Hong Kong Special Administrative Region, Rating and Valuation
Department
Definition
The index measures changes in average prices of independent dwellings in Hong Kong.
Frequency
Monthly
Index scope and construction
Private domestic units are defined as independent dwellings with separate cooking facilities and
bathroom (and/or lavatory). They are sub-divided into 5 classes by reference to floor area. The index
for each class is derived from analysis of all transactions effective in a given period. The composite
index is compiled by calculating a weighted average of the component indices. The weights for
compiling the composite index for each type of domestic premises are based on the number of
transactions effected in the current and previous 11 months.
Average prices are based on an analysis of transactions scrutinised by the Department for stamp
duty purposes. The following types of transactions are excluded: those considered to be
unacceptable for stamp duty purposes, those involving a mix of property types, premises which have
not yet been assessed to rates, domestic premises sold subject to existing tenancies, and primary
sales of domestic premises.
HUNGARY
Name of survey
FHB House Price Index
Source
FHB Mortgage Bank

Definition
The FHB House Price Index measures the run of Hungarian residential real estate prices.
Frequency
Quarterly
Index scope and construction
For computing the index, the process based on the hedonic method is applied. The hedonic
method is the most widespread statistical way to measure aggregate property price change, and is
based on the theoretical consideration that the value of houses/flats can be divided into the values of
their attributes. The values of FHB House Price Index are computed by making sample parts that
comprise 5 consecutive quarters from the complete database containing 46 quarters. That means
consecutive sample parts overlap for 4 quarters. The hedonic regression is estimated using these
sample parts with 5 quarters, and the value of the index is always calculated based on the
estimation, in the sample of which the given quarter is the last datum. This method ensures that after
one and a half years, we can seal the past, as from now on the new data do not modify the
previously estimated index values any more.
INDIA
Name of survey
NHB Residex
Source
National Housing Bank
Definition
NHB Residex index tracks the movement of prices in the residential housing segment.
Frequency
Quarterly
Index scope and construction
Index covers residential housing in Delhi. Primary data on housing prices is collected from real
estate agents by commissioning the services of private consultancy/research organizations of
national repute. In addition, data on housing prices is also collected from the housing finance
companies and banks; it is based on housing loans contracted by these institutions. The index is
constructed using the weighted average methodology with the Price Relative Method (modified
Laspeyres approach).
INDONESIA
Name of survey
Residential Property Price Survey
Source
Bank Indonesia
Definition
Residential Property Price Index reflects changes in Indonesian residential property prices as
represented by the development project house sales.
Frequency
Quarterly
Index scope and construction
Residential Property Price Survey started in 1999 based on development projects from 12 cities,
i.e. Medan Padang, Palembang, Bandar Lampung, Bandung, Semarang, Yogyakarta, Surabaya,
Denpasar, Banjarmasin, Manado, and Makassar. At the first quarter of 2002, coverage expanded to
13 cities including Jabotabek (Jakarta, Bogor, Tangerang, and Bekasi) area. At the first quarter of
2004, coverage became 14 cities
(Pontianak was included). Since 2007 the coverage survey area has been extended including
Banten area (Serang and Cilegon). This survey covers 45 main developers in Jabodebek-Banten,
and about 215 developers in 13 Bank Indonesia Regional Offices. Data collected directly from
developers’ covers price and total sales in the recent quarter and prediction for the next quarter.
Data is processed by type of building, which are small type (≤36 square meters), medium type (>36
and ≤70 square meters), and large type (>70 square meters). Composite Index is developed by
simple average chain index weighted by the city weight resulting from Cost Living Survey of 2007 by
BPS Statistics Indonesia.
IRELAND
Name of survey
Residential Property Price Index
Source
Central Statistics Office
Definition
The Residential Property Price Index is designed to measure the change in the average level of
prices paid for residential properties sold in Ireland.
Frequency
Monthly
Index scope and construction
The Residential Property Price Index is compiled using data on mortgage drawdowns provided on
a monthly basis by 8 of the main Mortgage Lending Institutions under Section 13 of the Housing Act
(2002). This data provides details on the characteristics of properties bought (such as building type
and size) as well as the price paid. It is transactions based; meaning that prices are recorded only

where a sale occurs. Not all residential property transactions are funded by a mortgage (i.e. they are
cash based) and these transactions are excluded from the scope of the index.
The hedonic method is the prevalent statistical process for the measurement of residential price
change. In this method, a number of characteristics which influence prices are analysed so that we
can estimate and exclude the part of the price change that can be attributed to them. These
characteristics are: location, building type, floor area, number of bedrooms, new or old and first time
buyer or not. By excluding the price change determined by these characteristics we are left with an
index of pure price change for a consistent set of characteristics. This index uses the rolling year
hedonic regression model.
Weights are calculated at the beginning of each year based on the value of transactions during
the previous year as given by the mortgage drawdown data. The index is an annual chain-linked
Laspeyres-type index. It is calculated by updating the previous month’s weights by the estimated
monthly changes in their average prices.
ISRAEL
Name of survey
Prices of Dwellings Index
Source
Central Bureau of Statistics
Definition
The Prices of Dwellings Index measures changes in the owner-occupied apartment prices in
Israel.
Frequency
Monthly
Index scope and construction
Information on purchasing of owner-occupied dwellings is regularly collected by tax offices across
the country. The sample covers 40 localities in 9 geographical areas: Jerusalem, Tel Aviv, Haifa,
Gush Dan, Center, South, Sharon, North and its suburbs. The information includes purchases of
new apartments and acquisitions of second-hand apartments that have changed ownership. The
sample does not include homes that have been self-constructed, homes purchased by purchasing
groups and public companies, and apartments with no market value. The price index is calculated
based on the methodology that takes into account various housing properties (location, number of
rooms, age, area of the dwelling etc.)
ITALY
Name of survey
House price Index
Source
Banca D’Italia; Tecnoborsa; Agenzia del Territorio
Definition
The index reflects changes in house prices according to a survey of real estate agents in Italy.
Frequency
Quarterly
Index scope and construction
Not available
JAPAN
Name of survey
Monthly Data of Real Estate Economy
Source
The Land Institute of Japan
Definition
The index reflects changes in the average cost per square meter of sold new condominiums in
Tokyo metropolitan area.
Frequency
Monthly
Index scope and construction
Not available
KAZAKHSTAN
Name of survey
Developed housing resale prices
Source
The Agency of Statistics of the Republic of Kazakhstan
Definition
Developed housing resale price index measures the inflation or deflation of the price of resold
second-hand flats over a period of time.
Frequency
Monthly
Index scope and construction
The index covers 18 cities: Astana, Almaty, Aktau, Aktobe, Atyrau, Jezkazgan, Kokshetau,
Karagandy, Kostanay, Kyzylorda, Oral, Oskemen, Pavlodar, Petropavl, Semey, Taldykorgan, Taraz,
and Shymkent.
The housing categories included in the survey are one-flat houses (separate houses that have
their own roof and a separate entrance, including cottage houses), and houses with two or more
flats (dwellings in blocks of flats). The data is collected for three types of flats: standard, high-quality
and elite. The information is gathered from the authorities responsible for registering real estate
sales. The data is collected if the characteristics of the flats have not changed during the observed
period. The dwelling characteristics are:
- Flat condition
- Number of rooms
- Construction materials
- Date of construction
- Urban area where the flat is located
The average price of a square meter of dwelling for each city is calculated as a weighted average
based on the data on actual transaction prices; the weights are derived from the total amount of
square meters of sold flats. The average price across the country is calculated as a weighted
average of all cities, with the weights based on the share of the total amount of flats entering the
market in each region (shares are differentiated by construction materials, flat sizes).
LATVIA
Name of survey
Average price of standard-type apartments
Source
Arco Real Estate
Definition
The index reflects changes in the average price of standard-type apartments (1 to 4 rooms) in
Riga.
Frequency
Monthly
Index scope and construction
The information sources for the analysis are the SIA “Arco Real Estate” real estate transactions
database, the analysis of the clients’ demand and supply, information provided by the partners of
“Arco Real Estate” and publicly available information sources.
LITHUANIA
Name of survey
Ober-Haus Lithuanian Apartment Price Index

Source
Ober-Haus Real Estate Advisors
Definition
Ober-Haus Real Estate Lithuanian apartment price index shows a summary of apartment price
changes in the five largest Lithuanian cities (Vilnius, Kaunas, Klaipėda, Šiauliai, and Panevėžys).
Frequency
Monthly
Index scope and construction
The index covers five cities: Vilnius, Kaunas, Klaipėda, Šiauliai, and Panevėžys. In order to
ensure the accuracy and efficiency of results, the index is calculated using a large variety of
information and data sources: Ober-Haus Real Estate gained information and databases, the data
from public and private institutions, and other information and data sources that may influence the
final outcome.
To construct the index, a certain weighting system is used. For each property group (apartments
in different cities), appropriate weights are assigned, which determine the generalized prices. The
construction of the weighting system is based on the following parameters: the amount of
apartments and the number of transactions in different geographical segments (different urban areas
and district groups) and qualitative housing characteristics (area, age, completeness). In the event of
significant changes in the real estate market or housing characteristics, the weighting system can be
adjusted according to the significance of these changes.
MACEDONIA
Name of survey
Index of Housing Prices
Source
National Bank of the Republic of Macedonia
Definition
The index reflects changes in the apartment prices in the territory of Skopje.
Frequency
Quarterly
Index scope and construction
The index is developed on the basis of data relating to notices of sale published by real estate
agencies. The calculation of the index is made by using the hedonic method. Hedonic price
indices are based on hedonic pricing models, whereby the price of a product is a function
arising from its features. The price of the apartment is a function arising from the size of
the apartment, the neighbourhood in which it is located, the floor, whether the apartment
has central heating and whether the apartment is new.

MALAYSIA
Name of survey
Malaysian House Price Index
Source
Ministry of Finance, Valuation and Property Services Department
Definition
The Malaysian House Price Index is a transaction-based house price index which captures the
change in prices paid for an “average” house.
Frequency
Quarterly
Index scope and construction
The index covers terraced, high-rise, detached and semi-detached housing units. The price
change is estimated by pricing a basket of house characteristics of the “average” house transacted
in the current period and comparing this price with the price of the same basket of house
characteristics in the base year (2010). Fundamentally, it is a ratio that shows how much the cost of
housing has changed between two periods (the base and the current periods) if the house buyers
maintain the standard of living in the latter period.
The hedonic methodology is used as the basic approach to price measurement of an “average”
house whereby houses are not priced for themselves as such but for the set of fixed characteristics
which are embodied in the assets. The fixed set of house characteristics is mainly comprised from
location, physical and legal characteristics. The “average” house is constructed by a statistical
method based on house transactions selected according to the sampling frame that was estimated
from the population of housing transactions in the base year (2010).
The Valuation Information System (VIS) of the Valuation and Property Services Department and
the Memorandum of Transfers of Land and Survey Department, Sarawak are the main sources of
data for the index computation. They provide sales data of housing properties that people buy and
sell in the 14 states and Federal Territories throughout the country every day. On average, the size
of data is about 20,000 observations per quarter. They contain information on the location, physical
and legal characteristics of various types of houses sold.
MEXICO
Name of survey
Index of Housing Prices
Source
Sociedad Hipotecaria Federal

Definition
The index reflects changes in the housing prices in the metropolitan areas of Mexico City,
Guadalajara, Monterrey, Puebla-Tlaxcala and Toluca.
Frequency
Quarterly
Index scope and construction
Not available
NETHERLANDS
Name of survey
House Price Index
Source
Statistics Netherlands
Definition
The House Price Index aims to evaluate price changes of existing residential dwellings situated on
Dutch territory sold to private buyers.
Frequency
Monthly
Index scope and construction
For the calculation of the index, selling prices as registered by Dutch Land Registry Office are
used, and for the appraisals the Property Assessment Act values from the most recent period are
used. The index is calculated on the basis of the so-called Sale Price Appraisal Ratio (SPAR)
method. The method uses matched pairs, i.e. it combines (officially) estimated selling prices with
actual prices. The following formula reflects the SPAR method:
Where It is the price index over the period t, Sj,t the selling price of dwelling j in period t, Aj,0 is the
appraised selling prices (appraisal) of dwelling j on reference moment 0 and n is the number of
transactions. Due to the fact that the selling prices of most dwellings sold in a particular period are
unknown in the base period, selling prices are estimated by using appraisal data. The numerator
reflects the price developments of dwellings sold in a particular month relative to the appraisals from
base period of these dwellings. The denominator corrects for under- and overestimation of the
appraisal relative to the actual selling price in the reference period.
NEW ZEALAND
Name of survey
House Price Index

Source
Reserve Bank of New Zealand
Definition
The HPI measures the movement in house prices for local council areas throughout New Zealand,
providing an indicator of capital growth and how prices are trending in an area. House prices are
sourced from PropertyIQ.
Frequency
Quarterly
Index scope and construction
Not available
NORWAY
Name of survey
House Price Index
Source
Statistics Norway
Definition
The house price index measures the development of the value of the total housing stock in
Norway, based on price information from dwellings sold on the free market.
Frequency
Quarterly
Index scope and construction
The index covers three types of housing: detached houses, row houses and multi-dwelling.
Dwellings with particularly small or large useful floor spaces or very high or low square meter prices
are not included in the calculation of index. Sub-indices for three housing classes and eleven
geographical regions are calculated by using the hedonic method. These 33 sub-indices are
weighted into total indices for each region and for the country as a whole. The weights are the
estimated total value of housing stock of each housing class and within each region.
Statistics Norway receives the house price data from FINN.no AS through cooperation with the
Norwegian Association of Real Estate Agents (NEF) and the Association of Real Estate
Undertakings (EFF). FINN.no cooperates with the most important real estate agencies in Norway.
PERU
Name of survey
Apartment Price Index
Source
Banco Central de Reserva del Perú
Definition
The index measures the development of the price of apartments per square meter in the main
districts of Lima (La Molina, Miraflores, San Borja, San Isidro and Surco).
Frequency
Quarterly
Index scope and construction
Not available
PHILIPPINES
Name of survey
Manila residential condominium price statistics
Source
Colliers International
Definition
The index reflects changes in the average price per square meter of condominiums in Manila.
Frequency
Quarterly
Index scope and construction
The index covers comparative values of luxury 3-bedroom condominiums in Manila central
business district.
POLAND
Name of survey
Home price index
Source
Narodowy Bank Polski
Definition
The index reflects changes in the housing price in 7 largest cities in Poland.
Frequency
Quarterly

Index scope and construction
The index covers average transaction price per square meter of housing in 7 major cities
(Gdańsk, Gdynia, Łódź, Kraków, Poznań, Warszawa and Wrocław).
PORTUGAL
Name of survey
Average Value of Bank Evaluation on Housing
Source
Statistics Portugal
Definition
The index tracks the developments in the residential market in Portugal. The index is based on
the evaluation of houses and apartments reflecting both the qualitative characteristics of dwellings
and the effect of inflation.
Frequency
Monthly
Index scope and construction
The information for constructing the index is provided by a set of credit institutions operating in
Portugal. The received data is used to calculate the indicators of average value of dwellings for each
property type, period (t) and territorial unit (i) using the formula:
where
Ytij – value of the assessment of a certain type property j, in period t, in the territorial unit i;
Atij – corresponding floor area of a certain type property j, in period t, in the territorial unit i;
n – number of assessments of certain type properties in period t, in the territorial unit i.
QATAR
Name of survey
Real Estate Price Index
Source
Qatar Central Bank
Definition
The Real Estate Price Index measures percentage changes in transacted property prices
(including land, villa and residential sales).

Frequency
Monthly
Index scope and construction
Qatar Central Bank gathers information on sale transactions of real estate property from the
Ministry of Justice. The gathered data cover the municipalities of Doha Al Rayyan, Umm Salal, Al
Wakrah, Al Khor, Al A Dayeen, and Al Shamal. Based on this data (i.e. suburb-level real estate
transactions data) a monthly series of Real Estate Index (REI) is developed. Given the inherent
limitations of the data (e.g., lack of information on the location and age of building, number of rooms,
available amenities such as furnished or unfurnished), the information is first adjusted for outliers
and heterogeneity. Subsequently, a mix-adjusted real estate measure is developed, after seasonally
decomposing the data to isolate the effects of seasonal trends. Percentage changes of the Real
Estate Price Index show changes relative to the base period (year 2009-2010 (April-March) was
chosen as base year).
ROMANIA
Name of survey
Residential Property Price Index
Source
National Institute of Statistics
Definition
The index reflects changes in the average residential property price across Romania.
Frequency
Quarterly
Index scope and construction
The Residential Property Price Index is a Laspeyres-type index which involves measuring the
evolution of prices in the current period as against a base period (2009) for residential properties.
Given the existing limitations for real estate sales, the qualitative changes that occur over time, the
method used to estimate the indices is the “hedonic” method. The hedonic method takes into
account the fact that the heterogeneous goods can be described by a set of characteristics or
attributes. In the case of dwellings, this set may include both characteristics related to the structure
of the dwelling and characteristics relating to the location of the property.
RUSSIA
Name of survey
Housing Price Index
Source
Federal State Statistics Service
Definition
The index reflects changes in the average price of different types of used apartments across
Russia.
Frequency
Quarterly
Index scope and construction
The primary data is gathered from real estate agencies across Russia. The data covers
transactions of low-quality, standard, high-quality and elite apartments with different number of
rooms in various types of houses. Only urban housing is included in the data.
For calculating the average price per square meter of sold apartments for each city, a fixed
weighting system is used, where the weights are annual shares of sold apartments by type relative
to the total sales volume in the previous year for each city. For the total index calculation, the
weights are based on the information of the urban population in the covered cities at the beginning
of the year.
SERBIA
Name of survey
Price statistics of dwellings in new construction
Source
Statistical Office of the Republic of Serbia
Definition
The index reflects changes in the average price per square meter of dwellings in new construction
in Serbia.
Frequency
Quarterly
Index scope and construction
The index is calculated based on the average price per square meter of dwellings in new
construction. The data refer to prices of newly built dwellings that were sold by legal and physical
persons in the reference period. It covers all newly built dwellings in urban settlements for which sale
contracts were signed between the customer and seller. The total price of a dwelling covers
construction price, land price and other costs.
SINGAPORE
Name of survey
Residential Property Price Index
Source
Urban Redevelopment Authority

Definition
Residential Property Price Index is used to monitor movements of residential property in
Singapore and is defined as a ratio of the current price per square meter compared to the price in
the reference period.
Frequency
Quarterly
Index scope and construction
The information used to compute the property price index is obtained from caveats lodged with
the Singapore Land Registry. A caveat is usually lodged by the purchaser to protect his/her interest
soon after an option to purchase a property is exercised or a sale and purchase agreement is
signed. The price of the property is the agreed purchase price of the property between the purchaser
and the vendor as entered in the caveat form.
To compute the price index, transactions are first grouped by property type and locality. The
grouping is selected on the basis of frequent transactions and similar prices ($ per sq m). The
median price in each group is used to compute a sub-index. The price index of a particular property
type is the weighted average of all the sub-indices of that property type in the various planning
areas.
From the 4th quarter of 1998, the price indices are computed based on the Moving Average
method. This means the weights are computed based on the moving average of the value of
transactions over the last 12 quarters, instead of being based on the value of transactions in a
particular year. The weights in the price indices are therefore updated quarterly so that they are as
current as possible.
SLOVAKIA
Name of survey
Index of Residential Property Prices
Source
National Bank of Slovakia
Definition
The Index of Residential Property Prices reflects movements in prices per square meter of flats
and houses in Slovak Republic.
Frequency
Quarterly
Index scope and construction
The National Bank of Slovakia has signed an agreement with the National Association of Real
Estate Offices of Slovakia (NARKS) on ensuring the processing of data on real estate prices. The
output compilations of prices for existing apartments and houses are made on the basis of classified
advertisement records. A weighted arithmetic average is used to calculate the average prices per

square meter for particular types of apartments and houses in individual regions. The weights are
the total number of transactions involving the particular types of apartments and houses in districts
of the respective region. Then an average offer price per square meter for particular types of
apartments and houses in Slovakia is calculated. Using a weighted arithmetic average, this value is
calculated by taking the sum of the multiples of the prices per square meter for particular apartment
and house types in individual regions and the selected weight coefficients (in %) for the individual
regions, and dividing this figure by 100 (the individual regions as the sum of their relative shares in
the assumed real transactions in apartments for the whole of Slovakia, in %). Using the stated
weighting, the average price per square meter of the respective residential property is calculated for
the whole of Slovakia.
SLOVENIA
Name of survey
Residential Housing Price Index
Source
Statistical Office of the Republic of Slovenia
Definition
The index measures changes in new and second-hand flat and family house prices in Slovenia.
Frequency
Quarterly
Index scope and construction
For calculating the price index, only transactions of the following flats are used:
flats that are larger than 17 m2 but smaller than 250 m
2;
flats that were constructed less than 250 years ago but more than three years ago;
flats whose average price per square meter of usable floor area is not lower than EUR 300 but not
higher than EUR 6 000.
For calculating the price index, only transactions of the following family houses are used:
houses that are larger than 40 m2 but smaller than 300 m
2;
houses that were constructed less than 250 years ago but more than three years ago (new houses
are excluded);
houses whose average price per square metre of usable floor area is not lower than EUR 300 but
not higher than EUR 5 000;
houses whose associated building plot is not larger than 5 000 m2.
The data is processed according to the so-called hedonic principle. The core of this approach is
multiple regression analysis of real estate characteristics influencing price formation. Regression
coefficients of individual real estate characteristics indicate the impact of individual characteristics on
the formation of the total real estate price. The next step is the final calculation of the price index
according to the selected method, i.e. characteristics price index, which is based on the use of
calculated regression coefficients in the formula for the Laspeyres index. The basis for weighting in
the formula is average values of real estate characteristics in the fourth quarter of the previous year.
For calculation of pooled price index of several types of residential real estate the value of
transactions is used for weighting.
SOUTH AFRICA
Name of survey
ABSA House Price Index
Source
ABSA
Definition
The ABSA House Price Index is based on the total purchase price of residential houses in the
medium-size category, in respect of which mortgage loan applications were approved by ABSA.
Data is seasonally adjusted.
Frequency
Monthly
Index scope and construction
Not available
SOUTH KOREA
Name of survey
Housing Purchase Price Index
Source
Kookmin Bank; The Bank of Korea
Definition
The index reflects changes in the purchase price of various types of dwellings across Korea.
Frequency
Monthly
Index scope and construction
The index includes single houses, row houses and apartments.
SPAIN
Name of survey
House Price Index (Índice de Precios de la Vivienda)
Source
Banco de España, Instituto Nacional de Estadística
Definition
The House Price Index (HPI) is intended to measure the evolution of the transaction prices of
free-sector housing, both new and second-hand, over time.
Frequency
Quarterly
Index scope and construction
The HPI reference population or stratum includes the entire population (individuals), resident both
inside and outside Spain, who have acquired a dwelling during the reference period. Merchantings
carried out by legal entities or financial institutions do not form part of the HPI population scope.
The information used for calculating the HPI is taken from the General Council of Notaries, with
whom the INE has signed a partnership agreement aimed at enabling the use of data from notaries
for statistical purposes. Pursuant to this, the General Council of Notaries, via the Notarial
Certification Agency (ANCERT), provides the data making up the main source of information for this
indicator.
The HPI calculation system is based on the combining of two basic elements reflecting the
features of the property market: housing prices, which represent the convergence of market supply
and demand, and weightings, or relative importance of each type of housing, by expenditure by
households when buying a dwelling. The combining of these two elements in order to obtain the HPI
is carried out by means of the chain-linked Laspeyres index formula. The period used for linking is
the fourth quarter of each year.
SWEDEN
Name of survey
Real Estate Price Index
Source
Statistics Sweden
Definition
The index reflects price changes of one- and two-dwelling buildings for permanent living in
Sweden.
Frequency
Quarterly
Index scope and construction
One-or two-dwelling buildings for permanent living include detached one-or two-dwelling
buildings, terraced houses and linked buildings. Real estate with site leasehold rights is included.
Price changes are estimated using the purchase price coefficient (K/T). K/T is the ratio between the
price and the assessed value for a certain time and is counted as an unweighted mean value.

SWITZERLAND
Name of survey
Asking Price Index of Rented Apartments
Source
Swiss National Bank; Wüest & Partner
Definition
Asking Price Index of Rented Apartments is a nationwide index of asking prices for rented
apartments, measuring price changes over time.
Frequency
Quarterly
Index scope and construction
To construct the index, real estate deals for eight geographic regions are gathered. For most of
the deals, additional information is also collected (e.g. size (number of rooms), macro situation
(community) and state (new or old)). The price index is calculated as a weighted average.
Specifically, the dwellings are divided into homogenous groups using the available information. In
each group, an average price is determined. This information is then combined to form a so-called
Lowe index, which uses an average weight (as opposed to a past or a present weighting).
TAIWAN
Name of survey
Lutheran House Price Index
Source
Sinyi Realty Estate
Definition
Lutheran House Price Index provides a measure of price trends of residential dwellings in Taiwan.
Frequency
Quarterly
Index scope and construction
The sample covers Taipei City, Taipei County, Taichung, Kaohsiung and several other Taiwan
regions.
THAILAND
Name of survey
Housing Price Index

Source
Government Housing Bank
Definition
Housing price index captures the change in prices of condominiums in Thailand.
Frequency
Monthly
Index scope and construction
The index covers condominiums in Bangkok and its vicinity (Bangkok, Nonthaburi and
Pathumthani). The data from assessment of collateral by Government Housing Bank is used for
index construction; the method implemented is the hedonic approach. The data mostly covers
medium- to low-end of the housing market and is concentrated mostly on the periphery of the central
BKK and vicinity.
TURKEY
Name of survey
TCMB House Price Index
Source
Central Bank of the Republic of Turkey
Definition
The HPI, which covers the whole country, is constructed for the purpose of monitoring price
movements in the Turkish housing market.
Frequency
Monthly
Index scope and construction
Price data related to all houses subject to sale, regardless of the construction year are used to
develop the HPI. The HPI, which is constructed on a countrywide basis, covers data pertaining to all
appraised houses in 75 cities.
The “Stratified Median Price Method” has been implemented in constructing the HPI to develop a
measure for price movements in the heterogeneous housing market. In the scope of the current HPI
implementation, in which the geographical stratification approach is applied, houses with different
characteristics are grouped together to form homogenous strata and the median unit price for each
stratum is weighted by the number of houses sold to reach the overall price index.
HPI (2010=100), which measures changes in the house prices compared with the base year, is
calculated using the Chain Laspeyres Index method. The reason for implementing the chain index
method is that the weights are updated each year.
UKRAINE
Name of survey
Kiev Apartment Price Statistics
Source
Blagovest
Definition
The index reflects changes in the average price per square meter of apartments in Kiev.
Frequency
Monthly
Index scope and construction
The index covers the apartments of 1 to 3 rooms in Kiev. The data is gathered at the end of each
month from the information in the database of Blagovest. In order to get more reliable results, the
data do not include apartments located in the same district and having the same number of rooms, if
their amount in the database is less than six.
UNITED ARAB EMIRATES
Name of survey
Dubai House Price Index
Source
Colliers International
Definition
The index reflects changes in the prices of residential property in Dubai.
Frequency
Quarterly
Index scope and construction
The index covers prices of apartments, villas and townhouses in Dubai.
UNITED KINGDOM
Name of survey
House Price Index
Source
Nationwide
Definition
The House Price Index is a measure for tracking a representative house price over time.
Frequency
Monthly
Index scope and construction
Nationwide house price series utilize only owner-occupied property information. In addition,
properties that are not typical and may distort the series are also removed from the data set.
Therefore, the following criteria are used to select which properties to include:
House purchases - remortgages and further advances are excluded
Owner occupied properties – buy to let properties are excluded
Properties sold at true market prices - right to buy sales at discounted price are excluded
Floor size has to be within specified limits for a give type of property
The number of cases that are used to calculate the average price for a given month will depend
on the volume of monthly mortgage activity and out of these the cases that meet the criteria in the
cleaning process. The monthly sample size varies from month to month.
All house price information is derived using Nationwide mortgage data. This data is extracted
monthly for mortgages that are at the approvals stage and after the corresponding valuation report
has been completed. Approvals data is used as opposed to mortgage completions since it should
give an earlier indication of current trends in prices in the housing market.
The price of a property depends on the characteristics of the property. Using mortgage data, the
Nationwide house price system relates all the observed combinations of these characteristics and
relates them to the price of which the house was sold for. From this, the model can estimate how
much on average a house would cost given a set value for these characteristics, in particular a set of
characteristics that describes the ‘typical’ house. This typical house does not physically exist; it is an
‘average’ house across all the characteristics that the model uses. This method is repeated on data
sets at different points in time and changes in the price of this typical house reflect only the price
changes over the same time periods, and not the mixture of properties sold in the current or
previous periods.
USA
Name of survey
Purchase-Only House Price Index
Source
Federal Housing Finance Agency
Definition
The House Price Index is a measure designed to capture changes in the value of single-family
houses in the U.S.
Frequency
Monthly
Index scope and construction
The House Price Index (HPI) covers all nine Census Divisions, the 50 states and the District of
Columbia, and every Metropolitan Statistical Area (MSA) in the U.S., excluding Puerto Rico. The HPI
is based on transactions involving conforming, conventional mortgages purchased or securitized by
Fannie Mae or Freddie Mac. Only mortgage transactions on single-family properties are included.
Each month, Fannie Mae and Freddie Mac provide Federal Housing Finance Agency with
information on their most recent mortgage transactions. These data is combined with the data from
previous periods to establish price differentials on properties where more than one mortgage
transaction has occurred. The data is merged, creating an updated historical database that is then
used to estimate the HPI.
The national index is constructed using quarterly growth rates for the Census Divisions. After
setting the base quarter, the national index for the following quarter is increased (or decreased) by
the weighted average quarterly price change for the nine Census Divisions. Then, in each
subsequent quarter, the national index grows by a rate equal to the average quarterly growth rate for
relevant quarter.
The weights used in constructing the weighted average quarterly growth rates reflect an estimate
of the Census Division’s contemporary share of one-unit detached properties in the U.S. For years in
which a Census was taken, the share from the relevant Census is used. For intervening years, a
Census Division’s share is the weighted average of the relevant shares in the prior and subsequent
Censuses, where the weights are changed by ten percentage points each year. Until the 2010
Census data become available, for years between 2001 and 2009, Census Division weights will be
set to the relevant shares in the 2000 Census.
The monthly indexes are calculated in the same way as the quarterly indexes are constructed,
except transactions from the same quarter are no longer aggregated. To construct the quarterly
index, all transactions from the same quarter are aggregated and index values are estimated using
the assigned quarters. In the monthly indexing model, all transactions for the same month are
aggregated and separate index values are estimated for each month.
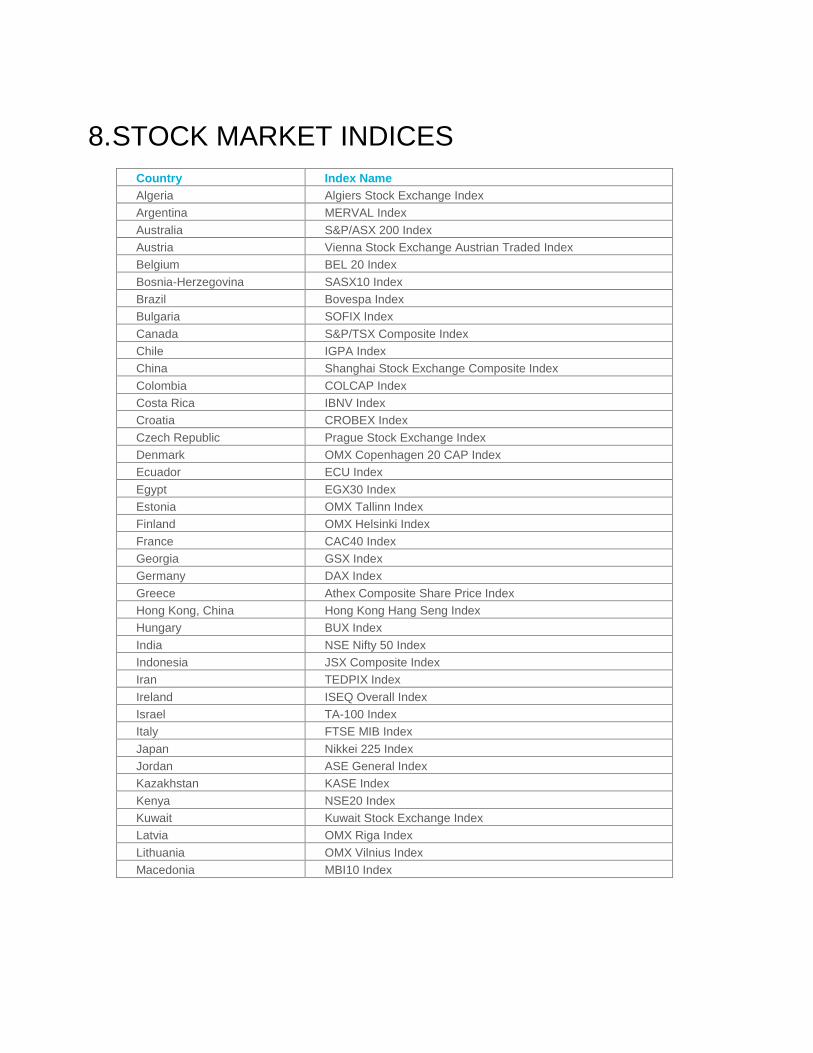
8. STOCK MARKET INDICES
Country Index Name
Algeria Algiers Stock Exchange Index
Argentina MERVAL Index
Australia S&P/ASX 200 Index
Austria Vienna Stock Exchange Austrian Traded Index
Belgium BEL 20 Index
Bosnia-Herzegovina SASX10 Index
Brazil Bovespa Index
Bulgaria SOFIX Index
Canada S&P/TSX Composite Index
Chile IGPA Index
China Shanghai Stock Exchange Composite Index
Colombia COLCAP Index
Costa Rica IBNV Index
Croatia CROBEX Index
Czech Republic Prague Stock Exchange Index
Denmark OMX Copenhagen 20 CAP Index
Ecuador ECU Index
Egypt EGX30 Index
Estonia OMX Tallinn Index
Finland OMX Helsinki Index
France CAC40 Index
Georgia GSX Index
Germany DAX Index
Greece Athex Composite Share Price Index
Hong Kong, China Hong Kong Hang Seng Index
Hungary BUX Index
India NSE Nifty 50 Index
Indonesia JSX Composite Index
Iran TEDPIX Index
Ireland ISEQ Overall Index
Israel TA-100 Index
Italy FTSE MIB Index
Japan Nikkei 225 Index
Jordan ASE General Index
Kazakhstan KASE Index
Kenya NSE20 Index
Kuwait Kuwait Stock Exchange Index
Latvia OMX Riga Index
Lithuania OMX Vilnius Index
Macedonia MBI10 Index
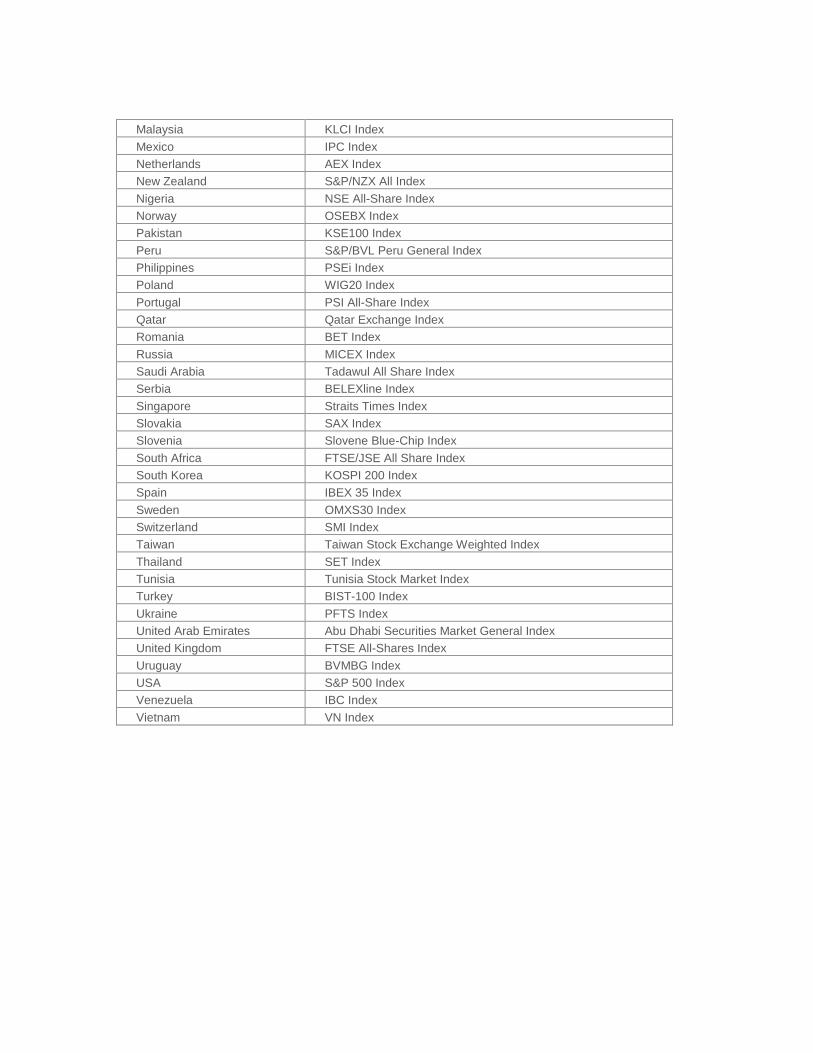
Malaysia KLCI Index
Mexico IPC Index
Netherlands AEX Index
New Zealand S&P/NZX All Index
Nigeria NSE All-Share Index
Norway OSEBX Index
Pakistan KSE100 Index
Peru S&P/BVL Peru General Index
Philippines PSEi Index
Poland WIG20 Index
Portugal PSI All-Share Index
Qatar Qatar Exchange Index
Romania BET Index
Russia MICEX Index
Saudi Arabia Tadawul All Share Index
Serbia BELEXline Index
Singapore Straits Times Index
Slovakia SAX Index
Slovenia Slovene Blue-Chip Index
South Africa FTSE/JSE All Share Index
South Korea KOSPI 200 Index
Spain IBEX 35 Index
Sweden OMXS30 Index
Switzerland SMI Index
Taiwan Taiwan Stock Exchange Weighted Index
Thailand SET Index
Tunisia Tunisia Stock Market Index
Turkey BIST-100 Index
Ukraine PFTS Index
United Arab Emirates Abu Dhabi Securities Market General Index
United Kingdom FTSE All-Shares Index
Uruguay BVMBG Index
USA S&P 500 Index
Venezuela IBC Index
Vietnam VN Index