Embed Size (px)
Citation preview

93 (2007) 66–78www.elsevier.com/locate/schres
Schizophrenia Research
Abnormalities of cingulate gyrus neuroanatomy in schizophrenia
Lei Wang a,⁎, Malini Hosakere f, Joshua C.L. Trein a, Alex Miller a,J. Tilak Ratnanather f,g, Deanna M. Barch b, Paul A. Thompson c, Anqi Qiu f,
Mokhtar H. Gado d, Michael I. Miller f,g, John G. Csernansky a,e
a Department of Psychiatry, Washington University School of Medicine, Box 8134, 660 S. Euclid Ave., St. Louis MO 63110, United Statesb Department of Psychology, Washington University School of Medicine, St. Louis MO, United Statesc Division of Biostatistics, Washington University School of Medicine, St. Louis MO, United Statesd Department of Radiology, Washington University School of Medicine, St. Louis MO, United States
e Department of Anatomy and Neurobiology, Washington University School of Medicine, St. Louis MO, United Statesf Center for Imaging Science, The Johns Hopkins, University, Baltimore MD, United States
g Institute for Computational Medicine, The Johns Hopkins, University, Baltimore MD, United States
Received 27 September 2006; received in revised form 17 February 2007; accepted 20 February 2007Available online 11 April 2007
Abstract
Objective and methods: Abnormalities of the neuroanatomy of the gray matter of the cingulate gyrus, especially its anteriorsegment, have been suggested to be an important characteristic of schizophrenia. In this study, T1-weighted magnetic resonancescans were collected in 53 individuals with schizophrenia and 68 comparison subjects matched for age, gender, race and parentalsocioeconomic status. We applied Labeled Cortical Mantle Distance Mapping to assess the volume, surface area and thickness ofthe cortical mantle within the anterior (AC) and posterior (PC) segments of the cingulate gyrus, excluding the paracingulate gyrus,and related these anatomical measures to measures of psychopathology and illness duration.Results: After covarying for total cerebral volume, individuals with schizophrenia showed smaller AC gray matter volume(p=0.024), thickness (trend, p=0.081), but not surface area (p=0.16), than comparison subjects. Similar group differences werefound for PC gray matter volume (p=0.0005) and thickness (trend, p=0.055), but not surface area (p=0.15). Across both groups,there was a significant L>R asymmetry in thickness of the AC, and a significant L>R asymmetry in the surface area of the PC.However, there were no significant group-by-hemisphere interactions. In the individuals with schizophrenia, thinning of the AC,but not the PC, was correlated with a longer duration of illness and a greater severity of psychotic symptoms.Conclusions: Individuals with schizophrenia showed smaller gray matter volumes across the entire cingulate gyrus, mostly due to areduction in cortical mantle thickness. However, structural measures of the AC were more closely related to clinical features of theillness.© 2007 Elsevier B.V. All rights reserved.
Keywords: Depth Map; Thickness; Surface area; Cortex; Thinning
⁎ Corresponding author. Tel.: +1 314 362 2417.E-mail address: [email protected] (L. Wang).
0920-9964/$ - see front matter © 2007 Elsevier B.V. All rights reserved.doi:10.1016/j.schres.2007.02.021
1. Introduction
Post-mortem studies of individuals with schizophre-nia have revealed cellular abnormalities in the cingulategyrus, especially its anterior segment (Benes, 1991;
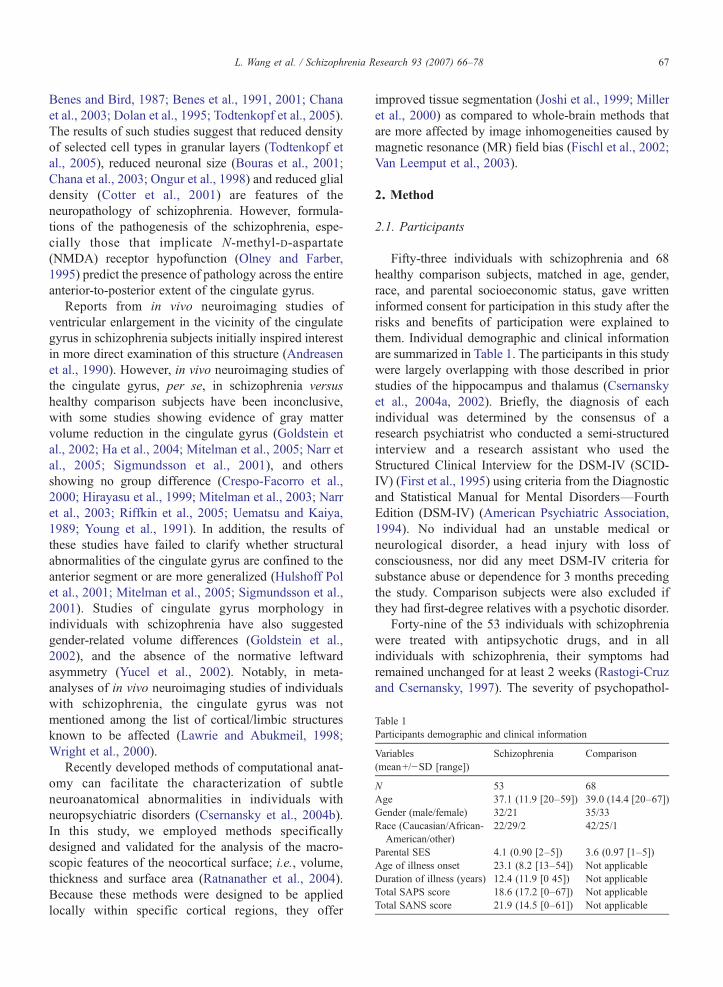
Table 1Participants demographic and clinical information
Variables(mean+/−SD [range])
Schizophrenia Comparison
N 53 68Age 37.1 (11.9 [20–59]) 39.0 (14.4 [20–67])Gender (male/female) 32/21 35/33Race (Caucasian/African-
American/other)22/29/2 42/25/1
Parental SES 4.1 (0.90 [2–5]) 3.6 (0.97 [1–5])Age of illness onset 23.1 (8.2 [13–54]) Not applicableDuration of illness (years) 12.4 (11.9 [0 45]) Not applicableTotal SAPS score 18.6 (17.2 [0–67]) Not applicableTotal SANS score 21.9 (14.5 [0–61]) Not applicable
67L. Wang et al. / Schizophrenia Research 93 (2007) 66–78
Benes and Bird, 1987; Benes et al., 1991, 2001; Chanaet al., 2003; Dolan et al., 1995; Todtenkopf et al., 2005).The results of such studies suggest that reduced densityof selected cell types in granular layers (Todtenkopf etal., 2005), reduced neuronal size (Bouras et al., 2001;Chana et al., 2003; Ongur et al., 1998) and reduced glialdensity (Cotter et al., 2001) are features of theneuropathology of schizophrenia. However, formula-tions of the pathogenesis of the schizophrenia, espe-cially those that implicate N-methyl-D-aspartate(NMDA) receptor hypofunction (Olney and Farber,1995) predict the presence of pathology across the entireanterior-to-posterior extent of the cingulate gyrus.
Reports from in vivo neuroimaging studies ofventricular enlargement in the vicinity of the cingulategyrus in schizophrenia subjects initially inspired interestin more direct examination of this structure (Andreasenet al., 1990). However, in vivo neuroimaging studies ofthe cingulate gyrus, per se, in schizophrenia versushealthy comparison subjects have been inconclusive,with some studies showing evidence of gray mattervolume reduction in the cingulate gyrus (Goldstein etal., 2002; Ha et al., 2004; Mitelman et al., 2005; Narr etal., 2005; Sigmundsson et al., 2001), and othersshowing no group difference (Crespo-Facorro et al.,2000; Hirayasu et al., 1999; Mitelman et al., 2003; Narret al., 2003; Riffkin et al., 2005; Uematsu and Kaiya,1989; Young et al., 1991). In addition, the results ofthese studies have failed to clarify whether structuralabnormalities of the cingulate gyrus are confined to theanterior segment or are more generalized (Hulshoff Polet al., 2001; Mitelman et al., 2005; Sigmundsson et al.,2001). Studies of cingulate gyrus morphology inindividuals with schizophrenia have also suggestedgender-related volume differences (Goldstein et al.,2002), and the absence of the normative leftwardasymmetry (Yucel et al., 2002). Notably, in meta-analyses of in vivo neuroimaging studies of individualswith schizophrenia, the cingulate gyrus was notmentioned among the list of cortical/limbic structuresknown to be affected (Lawrie and Abukmeil, 1998;Wright et al., 2000).
Recently developed methods of computational anat-omy can facilitate the characterization of subtleneuroanatomical abnormalities in individuals withneuropsychiatric disorders (Csernansky et al., 2004b).In this study, we employed methods specificallydesigned and validated for the analysis of the macro-scopic features of the neocortical surface; i.e., volume,thickness and surface area (Ratnanather et al., 2004).Because these methods were designed to be appliedlocally within specific cortical regions, they offer
improved tissue segmentation (Joshi et al., 1999; Milleret al., 2000) as compared to whole-brain methods thatare more affected by image inhomogeneities caused bymagnetic resonance (MR) field bias (Fischl et al., 2002;Van Leemput et al., 2003).
2. Method
2.1. Participants
Fifty-three individuals with schizophrenia and 68healthy comparison subjects, matched in age, gender,race, and parental socioeconomic status, gave writteninformed consent for participation in this study after therisks and benefits of participation were explained tothem. Individual demographic and clinical informationare summarized in Table 1. The participants in this studywere largely overlapping with those described in priorstudies of the hippocampus and thalamus (Csernanskyet al., 2004a, 2002). Briefly, the diagnosis of eachindividual was determined by the consensus of aresearch psychiatrist who conducted a semi-structuredinterview and a research assistant who used theStructured Clinical Interview for the DSM-IV (SCID-IV) (First et al., 1995) using criteria from the Diagnosticand Statistical Manual for Mental Disorders—FourthEdition (DSM-IV) (American Psychiatric Association,1994). No individual had an unstable medical orneurological disorder, a head injury with loss ofconsciousness, nor did any meet DSM-IV criteria forsubstance abuse or dependence for 3 months precedingthe study. Comparison subjects were also excluded ifthey had first-degree relatives with a psychotic disorder.
Forty-nine of the 53 individuals with schizophreniawere treated with antipsychotic drugs, and in allindividuals with schizophrenia, their symptoms hadremained unchanged for at least 2 weeks (Rastogi-Cruzand Csernansky, 1997). The severity of psychopathol-

68 L. Wang et al. / Schizophrenia Research 93 (2007) 66–78
ogy was assessed using the Scale for the Assessment ofPositive Symptoms (SAPS) (Andreasen, 1984) and theScale for the Assessment of Negative Symptoms(SANS) (Andreasen, 1983). Using the factor loadingsreported by Andreasen and colleagues (Andreasen et al.,1995), we used the SAPS and SANS items to computescores for three dimensions of psychopathology (i.e.,negative symptoms, psychosis and thought disorganiza-tion) in each of the individuals with schizophrenia.
2.2. Image collection
MR scans were collected on a Magnetom SP-40001.5-Tesla Siemens imaging system with a standard headcoil using a turbo-FLASH sequence (TR=20 ms,TE=5.4 ms, flip angle=30°, 180 slices, 256-mm fieldof view, matrix=256×256, number of acquisitions=1,scanning time=13.5 min) that acquired three-dimen-sional datasets with 1 mm3 isotropic voxels across theentire cranium (Venkatesan and Haacke, 1997). MRdatasets were reformatted using Analyze™ software(Analyze-AVW, 2004), and signed 16-bit MR datasetswere compressed to unsigned 8-bit MR datasets bylinearly rescaling voxel intensities such that voxels withintensity levels at two standard deviations above themean of white matter (corpus callosum) were mapped to255, and voxels with intensity levels at two standarddeviations below the mean of CSF (lateral ventricle)were mapped to 0. The white matter and CSF means andstandard deviations were obtained by sampling voxelsfrom these respective regions. MR scans were thentrilinearly interpolated into 0.5 mm3 isotropic resolutionto produce smoother intensity histograms for moreaccurate segmentation. Prior to image processing, MRscans were coded and stripped of diagnostic groupinformation. All subsequent processing including deli-neating cingulate gyrus surfaces (below) was performedon de-identified data. Clinical and demographic infor-mation was merged with imaging data in the statisticalanalysis step only after the cingulate gyrus measureswere generated.
2.3. Anatomic definition of the cingulate gyrus
The medial limit of the cingulate gyrus was definedas the cortical surface within the interhemisphericfissure (Duvernoy, 1991). In coronal MR sections, thecaudal end of the cingulate gyrus was defined by theisthmus, which lay below the splenium. The cingulategyrus then followed the upper bank of the calcarinesulcus rostrally until the calcarine sulcus branched intothe parietooccipital fissure. The cingulate gyrus was
separated from the precuneus by the subparietal sulcuswhere the cingulate sulcus turned upward to become themarginal sulcus. The superior limit of the cingulategyrus was defined by the inferior bank of the cingulatesulcus. The inferior limit of the cingulate gyrus wasformed by the superior bank of the callosal sulcus.Finally, the rostral end of the cingulate gyrus wasdefined as the most rostral coronal section through theseptum pellucidum, the appearance of the paraolfactorysulcus being the delimiting landmark. The anteriorsegment of the cingulate gyrus (AC) was divided fromthe posterior segment (PC) of the structure using a planepassing through the anterior commissure (The planepasses through the anterior commissure at the pointwhere it intersects the inter-hemisphere plane; this planealso is perpendicular to the line connecting the anteriorand posterior commissures.). This border approximatesthe boundary between Brodmann areas (BA) 24 and 23(Crosson et al., 1999; Heckers et al., 2004; Yucel et al.,2001).
The sulci and gyri within the AC may appear“doubled-up” in some individuals (Vogt et al., 1995). Insome cases, the doubling-up consists of an intralimbicsulcus ventral to the cingulate sulcus; in other cases, thedoubling-up consists of the paracingulate gyrus (PCG)dorsal to the cingulate sulcus (Paus et al., 1996; Yucel etal., 2001). According to Brodman, the PCG, whenpresent, consists of a cortical region (BA 32) that isseparable from the AC (Heckers et al., 2004; Paus et al.,1996). More specifically, BA 24 and 25 occupy the AC,while BA 32 is rostral and dorsal to BA 24b, dorsal toBA 24c and 24c′, and terminates near BA 24c′g. BA 32has a mixture of cytoarchitectural features of cingulatecortex and adjacent frontal and parietal cortical areas.Whenever PCG is absent, BA 32 is always limited to thedorsal bank of the cingulate sulcus (Heckers et al., 2004;Vogt et al., 1995). In the current study, 21 of the 53individuals with schizophrenia had a left PCG and 10had a right PCG; six individuals with schizophrenia hadPGC in both hemispheres. Twenty-three of the 68comparison subjects had a left PCG, and 17 had a rightPCG; seven had PCG on both sides. There was nosignificant group difference in the frequency of PCG ineither hemisphere: left χ2 =0.43, df=1, p=0.5; rightχ2 =0.65, df=1, p=0.42.
2.4. Labeled cortical mantle distance mapping(LCMDM)
The development and implementation of LCMDMcan be found in previous publications (Miller et al.,2003, 2000). In addition, the validation and application
69L. Wang et al. / Schizophrenia Research 93 (2007) 66–78
of LCMDM to the analysis of the cingulate gyrus isdescribed in detail in Ratnanather et al. (2004).
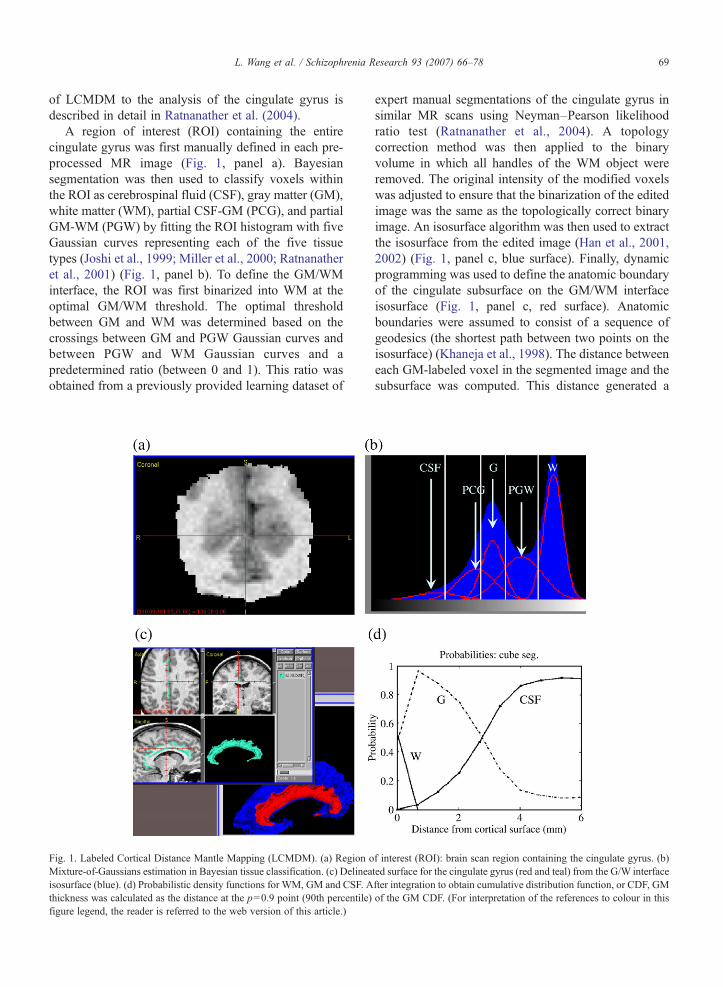
A region of interest (ROI) containing the entirecingulate gyrus was first manually defined in each pre-processed MR image (Fig. 1, panel a). Bayesiansegmentation was then used to classify voxels withinthe ROI as cerebrospinal fluid (CSF), gray matter (GM),white matter (WM), partial CSF-GM (PCG), and partialGM-WM (PGW) by fitting the ROI histogram with fiveGaussian curves representing each of the five tissuetypes (Joshi et al., 1999; Miller et al., 2000; Ratnanatheret al., 2001) (Fig. 1, panel b). To define the GM/WMinterface, the ROI was first binarized into WM at theoptimal GM/WM threshold. The optimal thresholdbetween GM and WM was determined based on thecrossings between GM and PGW Gaussian curves andbetween PGW and WM Gaussian curves and apredetermined ratio (between 0 and 1). This ratio wasobtained from a previously provided learning dataset of
Fig. 1. Labeled Cortical Distance Mantle Mapping (LCMDM). (a) Region oMixture-of-Gaussians estimation in Bayesian tissue classification. (c) Delineaisosurface (blue). (d) Probabilistic density functions for WM, GM and CSF. Athickness was calculated as the distance at the p=0.9 point (90th percentile)figure legend, the reader is referred to the web version of this article.)
expert manual segmentations of the cingulate gyrus insimilar MR scans using Neyman–Pearson likelihoodratio test (Ratnanather et al., 2004). A topologycorrection method was then applied to the binaryvolume in which all handles of the WM object wereremoved. The original intensity of the modified voxelswas adjusted to ensure that the binarization of the editedimage was the same as the topologically correct binaryimage. An isosurface algorithm was then used to extractthe isosurface from the edited image (Han et al., 2001,2002) (Fig. 1, panel c, blue surface). Finally, dynamicprogramming was used to define the anatomic boundaryof the cingulate subsurface on the GM/WM interfaceisosurface (Fig. 1, panel c, red surface). Anatomicboundaries were assumed to consist of a sequence ofgeodesics (the shortest path between two points on theisosurface) (Khaneja et al., 1998). The distance betweeneach GM-labeled voxel in the segmented image and thesubsurface was computed. This distance generated a
f interest (ROI): brain scan region containing the cingulate gyrus. (b)ted surface for the cingulate gyrus (red and teal) from the G/W interfacefter integration to obtain cumulative distribution function, or CDF, GMof the GM CDF. (For interpretation of the references to colour in this
70 L. Wang et al. / Schizophrenia Research 93 (2007) 66–78
histogram associated with GM labels (Miller et al.,2000; Ratnanather et al., 2001), which gave rise toprobability and cumulative distribution functions (PDF,CDF) used in the analyses (Fig. 1, panel d, showingPDFs).
The inter-rater and intra-rater variabilities of deli-neating the cingulate gyrus subsurface were alsoexamined, as previously described (Ratnanather et al.,2004). In ten randomly selected scans, two raters eachdelineated the cingulate gyrus surfaces. The surfaceareas had a mean absolute error of 0.077 with anintraclass correlation coefficient of 0.82. We randomlyselected a scan to generate three slightly differentregions of interest: the original ROI, and two additionalROIs by dilating the original ROI subvolume by1×1×1 and 3×3×3 voxels. This produced threeslightly different intensity histograms, which in turnproduced three slighted different GM/WM boundarythresholds. As a result, we generated three surfaces fromwhich one rater delineated all three cingulate gyrussurfaces. The coefficient of variation for the areas of thethree surfaces was 0.043 and the pair-wise 90th-percentile distances between the three surfaces rangedfrom 0.14 to 0.21 mm.
2.5. Cingulate gyrus mantle measures
Trigonometry was used to calculate the surface areaof the cingulate gyrus subsurface (Ratnanather et al.,2003, 2001). Gray matter volumes of the cingulate gyruswere calculated by integrating the GM distance histo-gram and then multiplying by the voxel dimensions. The90th-percentile point of the CDF was used to representthe thickness of the cingulate gyrus gray matter mantle.The 90th-percentile point included 90% of the totalcortical gray matter voxels encountered (i.e., distancefrom the G/W interface surface). The CDF generated onthe surface of the selected gyral surfaces was used toestimate the “mean thickness” across those subregions.
Total cerebral volumes were derived using Freesurfer(Desikan et al., 2006; Fischl et al., 2004) as the volumewithin the pial surface subtracting the volumes of thelateral ventricles and the ventral diencephalons. Thestructural measures of the cingulate gyrus werecompared across groups using total cerebral volume asa covariate.
2.6. Statistical analyses
Because volume is a function of thickness andsurface area (i.e., in the simplest case, volume is theproduct of the latter two variables), we first performed a
primary group comparison of the volume of the twosegments of the cingulate gyrus (i.e., AC and PC) usingone-way, repeated measures, mixed model ANOVA(SAS Institute Inc., 2000), with diagnosis as thebetween-individual factor and hemisphere as therepeated within-individual factor. Significance wasreported for alpha=0.025 (i.e. adjusting for multiplecomparisons). Group differences in surface area, andthickness were then performed post-hoc, and signifi-cance was reported for one-tailed test of least squaresmeans with unadjusted p values. Because of the variablepresence of the PCG, all analyses of anterior cingulatemeasures were adjusted for the presence of the PCG. AllANOVA procedures were performed also with totalcerebral brain volume as a covariate.
The relationships between the clinical variables andstructural measures were examined in the individualswith schizophrenia using an exploratory correlationanalysis. All correlations were estimated using non-parametric statistics (Spearman's rho) after partialingout total cerebral brain volume, and all correlationsinvolving AC measures were done after partialing outthe presence of the PCG. The significance of thesecorrelations was reported after adjusting for multiplecomparisons.
3. Results
The volume, surface area and thickness measures forthe anterior and posterior segments of the left and rightcingulate gyri are summarized in Table 2.
3.1. Cingulate gyrus volume
Individuals with schizophrenia had significantlysmaller AC volumes than comparison subjects (F=5.2,df=1118, p=0.024). However, there was no significanteffect of hemisphere (F=1.8, df=1118, p=0.18), norwas there a diagnosis-by-hemisphere interaction (F=0.38,df=1118, p=0.54). Post-hoc correlations between leftand right AC volumes and total cerebral volumes weresignificant within the groups of individuals withschizophrenia (only right) and comparison subjects (seeTable 3).
Individuals with schizophrenia also had significantlysmaller PC volumes than comparison subjects (F=14,df=1118, p=0.0005). Again, there was no significanteffect of hemisphere (F=2.4, df=1119, p=0.13), norwas there a significant diagnosis-by-hemisphere inter-action (F=0.20, df=1119, p=0.65). Post-hoc correla-tions between the gray matter volumes of the PC andtotal cerebral volumes were significant within the

Table 2Cingulate gyrus mantle measures: mean (SD) volume, surface area and thickness
Schizophrenia Comparison
L R L R
Volume (cm3) AC ⁎ 37.7 (16.3) 40.1 (11.6) 44.8 (17.0) 43.10 (13.3)PC⁎ 58.1 (11.0) 60.7 (11.4) 65.4 (11.1) 66.8 (11.4)
Surface area (cm2) AC 15.5 (6.2) 16.8 (5.5) 17.3 (6.4) 17.6 (5.7)PC 33.6 (7.4) 32.3 (7.5) 36.4 (6.4) 34.4 (6.0)
Thickness (mm) AC⁎ 2.38 (0.43) 2.10 (0.41) 2.44 (0.37) 2.13 (0.32)PC⁎ 1.91 (0.34) 1.82 (0.34) 1.95 (0.26) 1.90 (0.29)
Total cerebral brain volume (cm3) 952 (120) 1000 (108)
⁎ p<0.05, schizophrenia versus controls, repeated measures ANOVA.
71L. Wang et al. / Schizophrenia Research 93 (2007) 66–78
groups of individuals with schizophrenia and compar-ison subjects (see Table 3).
3.2. Cingulate gyrus thickness
Individuals with schizophrenia showed a trendtoward significant difference in the thickness of theAC (schizophrenia<comparison subject: t=1.40,df=118, p=0.081). Also, there was a significant effectof hemisphere (F=43, df=1118, p<0.0001), but not asignificant diagnosis-by-hemisphere interaction(F=0.06, df=1118, p=0.80). Post-hoc correlationsbetween the AC thickness and total cerebral volumeswere not significant in either the group of schizophreniaor comparison subjects (see Table 3).
Individuals with schizophrenia also showed a trendtoward significant difference in the thickness of the PC(schizophrenia<comparison subject: t=1.60, df=118,p=0.055). There was no significant effect of hemisphere(F=3.5, df=1119, p=0.066), nor a significant diagnosis-by-hemisphere interaction (F=0. 27, df=1119, p=0.61).Post-hoc correlations between the thickness of the PC andtotal cerebral volumes were not significant in either thegroup of schizophrenia or comparison subjects (see Table 3).
Table 3Correlations (Spearman's rho) between structural measures of the cingulatevolume
Cingulate gyrusmantle measures a
Schizophrenia
L R
Volume ACb 0.033 p=0.82 0.2PC 0.36 p=0.012 0.3
Surface area ACb 0.20 p=0.17 0.3PC 0.50 p< .0001 0.4
Thickness ACb −0.16 p=0.25 −0PC −0.18 p=0.21 −0
a Significant (p<0.05) correlations are shown in bold face.b Correlations with anterior measures were adjusted for presence of paraci
3.3. Cingulate gyrus surface area
The effect of diagnosis on the surface area of the ACwas not significant (schizophrenia<comparison sub-ject: t=1.00, df=118, p=0.16). Also, there was nosignificant effect of hemisphere (F=0.05, df=1118,p=0.83), nor was there a significant diagnosis-by-hemisphere interaction (F=0.04, df=1118, p=0.84).Post-hoc correlations between the surface area of theAC and total cerebral volume were significant in theindividuals with schizophrenia (right only) and compar-ison subjects (see Table 3).
The effect of diagnosis on the surface area of the PC alsodid not reach significance (schizophrenia<comparisonsubject: t=1.00, df=118, p=0.15). There was a significanteffect of hemisphere (F=4.3, df=1119, p=0.041), but nota significant diagnosis-by-hemisphere interaction(F=0.17, df=1119, p=0.68). Post-hoc correlationsbetween the surface area of the PC and total cerebralvolumes were significant in individuals with schizophreniaand comparison subjects (see Table 3).
Non-parametric correlations (Spearman's rho) amongstructural measures of the cingulate gyrus (volume,surface area and thickness) are summarized in Table 4.
gyrus (volume, surface area and thickness) and total cerebral brain
Comparison
L R
9 p=0.045 0.33 p=0.0072 0.31 p=0.0113 p=0.020 0.50 p< .0001 0.49 p<0.0019 p=0.006 0.37 p=0.0028 0.25 p=0.0475 p< .0001 0.55 p< .0001 0.44 p< .0001.21 p=0.16 −0.16 p=0.19 −0.13 p=0.29.08 p=0.55 −0.12 p=0.30 0.024 p=0.85
ngulate gyrus.
72 L. Wang et al. / Schizophrenia Research 93 (2007) 66–78
Cingulate gyrus volume was generally correlated withboth cingulate gyrus surface area and thickness.
3.4. Sex effect
When sex was included as a between-individualfactor in the ANOVA analyses (in addition to diagnosis),a significant effect of sex was found for the volume ofthe AC (m< f , p=0.0003), the thickness of the AC(m< f , p<0.0001), the thickness of the PC (m< f ,p< .0001), and for area of the PC (m> f , p=0.0005).There was no gender by group interactions in anymeasures. Also, the diagnosis effect remained signifi-cant for the volume of the AC (p=0.05) and PC(p=0.003) after taking sex into account.
3.5. Relationships between neuroanatomical andclinical measures
Correlations between clinical features and structuralmeasures were assessed in the individuals with schizo-phrenia in a post-hoc, exploratory analysis. There weretrends toward inverse correlations between the durationof illness and the thickness of the left AC (r=−0.29,p=0.068), right AC (r=−0.29, p=0.074) and left PC(r=−0.31, p=0.054). There were no other correlationsbetween the structural measures and age of onset ofillness or duration of illness.
Total SAPS scores were inversely correlated with thevolume of the left AC (r=−0.37, p=0.033). There werealso trends toward inverse correlations between totalSANS scores and volume of the left AC (r=−0.29,p=0.091) and the thickness of the right AC (r=−0.29,p=0.088). Also, the SAPS/SANS psychosis factormeasure was inversely correlated with the volume ofthe left AC (r=−0.39, p=0.021). The SAPS/SANSnegative symptom factor measure also showed a trendtoward an inverse correlation with the volume of the leftAC (r=−0.30, p=0.089). There were no other correla-tions between any other SAPS/SANS factor measures
Table 4Correlations (Spearman's rho) among structural measures of the cingulate gyand AC and PC
Cingulate measures a L
Area Thicknes
ACb Volume 0.82 (p< .0001) 0.36 (p<
Area – −0.057 (PC Volume 0.50 (p< .0001) 0.53 (p<
Area – −0.33 (pa Correlations greater than 0.50 are shown in bold face.b Correlations of anterior measures were adjusted for presence of paracing
and any structural measures of the PC. However, noneof these correlations remained significant after correc-tion of p values for multiple comparisons.
4. Discussion
The results of this study suggest that there is areduction in the gray matter volume of the entirecingulate gyrus in individuals with schizophrenia; i.e.,this gray matter volume reduction is not confined tothe anterior segment of the cingulate gyrus. Thecomparison of thickness and surface area measures inthe individual groups suggest that this decrease incingulate gyrus gray matter volume may be accountedfor mostly by a decrease in the thickness of the corticalmantle. Interestingly, measures of illness severity,especially positive symptoms, and duration wereassociated with decreases in the gray matter volumeof the AC, but not the PC. As expected, cingulategyrus gray matter volume was highly correlated withboth cingulate gyrus surface area and thickness, whilesurface area and thickness were only very weaklycorrelated.
The results of this study extend and perhaps help toresolve the contradictory results of prior in vivoneuroimaging studies of the cingulate gyrus in indivi-duals with schizophrenia (Goldstein et al., 2002; Riffkinet al., 2005). Because of the variable convolutions of thecingulate gyrus, the precise delineation of the cingulategyrus apart from neighboring cortical regions ischallenging, and to the extent that this delineation isnot precise, group differences can be obscured. Also, inmany of the reported studies (Crespo-Facorro et al.,2000; Hirayasu et al., 1999; Mitelman et al., 2003, 2005;Narr et al., 2003; Sigmundsson et al., 2001), thedescription of the methods do not indicate whether thePCG was included or excluded in the measurement. Ifone were to include the PCG, this would result in theinclusion of BA 32, but only in those individuals with aPCG. Excluding the PCG eliminates this potential
rus (volume, surface area and thickness), separately in each hemisphere
R
s Area Thickness
.0001) 0.73 (p< .0001) 0.22 (p=0.016)p=0.53) – −0.39 (p< .0001).0001) 0.54 (p< .0001) 0.51 (p< .0001)=0.0003) – −0.29 (p=0.0013)
ulate gyrus.

73L. Wang et al. / Schizophrenia Research 93 (2007) 66–78
confound. Moreover, because the retrosplenial (BA29and BA30) cortex is consistently located on the ventralbank of the PC (BA 23 and 31) within the callosalsulcus, we included it as part of the PC. Even though theretrosplenial cortex and PC may subserve somewhatdifferent functions, its inclusion with the PC in thisstudy is supported by recent neuroanatomical studies ofthe two cortical regions (Mitelman et al., 2005; Vogt etal., 2005). Nonetheless, caution should be used ininterpreting the results of any study of cortical structurewhere gross neuroanatomical landmarks, such as sulcalpatterns, are used to delineate the boundaries of specificcortical regions, including our own. There is substantialnormal variability in sulcal patterns and the relationshipbetween such patterns and the true boundaries ofspecific cortical regions is not always consistent.
As mentioned above, cingulate gyrus gray mattervolume loss in the individuals with schizophreniaappeared to be mostly accounted for by thinning ofthe cortical mantle, although a weaker trend toward areduction in surface area was also observed. Anillustration of the patterns of cortical thinning observedin the individual subjects with schizophrenia, and thedistribution of cortical thickness values over thecingulate surface in a selection of schizophrenia andcomparison subjects with extreme overall thicknessvalues are shown in Figs. 2 and 3.
Although our analysis was exploratory, we foundpreliminary evidence for correlations between structuralmeasures of the AC and clinical variables. In particular,reductions of surface area, gray matter volume andthickness in the left AC appeared to be related to theduration of illness as well as the severity of psychoticsymptoms. An inverse correlation was also foundbetween duration of illness and PC thickness. Thesepreliminary findings suggest that there may be progres-sive changes in cingulate structure with increasingillness duration and that such changes may be related toworsening psychotic symptoms. Animal studies haveshown that NMDA antagonists can selectively damagethe PC (Olney and Farber, 1995). Also, increasedNMDA receptor binding has been reported in the PC ofschizophrenia patients, perhaps as the result of NMDAreceptor hypofunction (Newell et al., 2005). Finally,decreased NAA/Cr ratios in the PC have been reportedin patients with chronic schizophrenia that exhibitcognitive deficits (Shimizu et al., 2007). These findings,taken together with reports that NMDA receptorantagonists such as phencyclidine (PCP) and ketaminecan cause schizophrenia-like psychosis and cognitivedysfunction in healthy humans (Andine et al., 1999;Javitt and Zukin, 1991; Malhotra et al., 1996) are
consistent with the more general hypothesis that NMDAreceptor dysfunction could be the basis for neurode-generative changes in the cingulate gyrus of patientswith schizophrenia.
Since participants in this study had been treated withantipsychotic medications, it is unknown whether ourcorrelational findings reflect relationships betweenneuroanatomical structure and the original severity ofsuch symptoms or the degree to which antipsychoticmedications affected them. Additional studies ofindividuals with schizophrenia who are untreated andin their first episode of illness or the family members ofschizophrenia patients who are at increased risk fordeveloping the disorder could be helpful in resolvingsuch issues.
In this study, we used one of the new tools ofcomputational anatomy (i.e., Labeled Cortical MantleDepth Mapping) to analyze the structural features of thecingulate gyrus. This method depends on the accuracyof both tissue classification and surface generation.Tissue misclassification rate is low — it usually occurswithin one 0.5 mm3-voxel of the gray/white boundary.Surface generation is dependent on the accuracy of thethreshold derived from the segmentation, and validsegmentation and surface reconstruction have beendemonstrated in a variety of cortical regions includingthe cingulate gyrus (Miller et al., 2000; Ratnanather etal., 2003, 2001, 2004). Other potential sources of errorare the definition of the anatomical boundaries of thecingulate proper (see above) and the possibility thatsome gray matter voxels are incorrectly incremented inthe LCMDM histograms.
In sum, our results suggest that loss of gray matter,best represented by cortical mantle thinning, occursacross the entire contour of the cingulate gyrus inschizophrenia. However, measures of illness severityand duration appeared to be better correlated withthinning of the anterior segment of the cingulate gyrus.The cellular basis for thinning of the cortical mantleversus its surface area in disorders such as schizophreniais unknown. However, we speculate that loss ofpyramidal neurons or their processes would likely resultin a reduction in both surface area and thickness, whilethe loss of nonpyramidal neurons (i.e., interneurons) andtheir processes with a mainly vertical organizationwould likely result in a reduction of thickness alone. Arecent meta-analysis of post-mortem studies of thecingulate gyrus in individuals with schizophrenia foundthat decreases in both pyramidal and non-pyramidalneurons and their processes is associated with schizo-phrenia (Todtenkopf et al., 2005) while the mechanismby which changes in neuronal architecture occurs in

Fig. 2. Examples of cortical depth profile — comparison subjects. Examples of cortical gray matter thickness distribution (maps) over the cingulatesurface as generated via LCMDM, in comparison subjects. Rows (a–c) show maps from three individuals with large thickness values in the right AC.Rows (d–f) show maps from three individuals with small thickness values in the right AC. For visualization, the maps have been smoothed via splineinterpretations of the eigenfunctions of the Laplace–Beltrami operator (Qiu et al., 2005 (in revision)). (For interpretation of the references to colour inthis figure legend, the reader is referred to the web version of this article.)
74 L. Wang et al. / Schizophrenia Research 93 (2007) 66–78

Fig. 3. Examples of cortical depth profile — schizophrenia individuals. Examples of cortical gray matter thickness distribution (maps) over thecingulate surface as generated via LCMDM, in schizophrenia individuals. Rows (a–c) show maps from three individuals with large thickness valuesin the right AC. Rows (d–f) show maps from three individuals with small thickness values in the right AC.
75L. Wang et al. / Schizophrenia Research 93 (2007) 66–78

76 L. Wang et al. / Schizophrenia Research 93 (2007) 66–78
schizophrenia (i.e., neurodevelopmental or neurodegen-erative or both) remains unknown. NMDA receptordysfunction has been implicated in both post-mortemstudies of individuals with schizophrenia and animalmodels of disease pathogenesis.
Role of funding source
Funding for this study was provided by NIMH grantsR01-MH056584, the Conte Center for the Neuroscienceof Mental Disorders at Washington University School ofMedicine (P20-MH071616) and P41-RR15241; thefunding agencies had no further role in study design;in the collection, analysis and interpretation of data; inthe writing of the report; and in the decision to submitthe paper for publication.
Contributors
Study design: Lei Wang, J. Tilak Ratnanather,Mokhtar H. Gado, Michael I. Miller, and John G.Csernansky.
Data collection: Lei Wang, Malini Hosakere, JoshuaC. L. Trein, and Alex Miller.
Analyses: Lei Wang and Anqi Qiu.Statistical analysis: Lei Wang, Deanna M. Barch, and
Paul A. Thompson.Literature Search: Lei Wang, Mokhtar H. Gado, and
John G. Csernansky.Manuscript draft: Lei Wang and John G. Csernansky.All authors contributed to and have approved the
final manuscript.
References
American Psychiatric Association, 1994. Diagnostic and statisticalmanual of mental disorders: DSM-IV, vol. xxvii. AmericanPsychiatric Association, Washington, DC. 886 pp.
Analyze-AVW, 2004. Analyze-AVW. Mayo Medical Foundation,Rochester, Minnesota.
Andine, P., Widermark, N., Axelsson, R., Nyberg, G., Olofsson, U.,Martensson, E., Sandberg, M., 1999. Characterization of MK-801-induced behavior as a putative rat model of psychosis. J.Pharmacol. Exp. Ther. 290, 1393–1408.
Andreasen, N.C., 1983. The Scale for Assessment of NegativeSymptoms (SANS). The University of Iowa, Iowa City, Iowa.
Andreasen, N.C., 1984. The Scale for Assessment of PositiveSymptoms (SAPS). The University of Iowa, Iowa City, Iowa.
Andreasen, N.C., Swayze II, V.W., Flaum, M., Yates, W.R., Arndt, S.,McChesney, C., 1990. Ventricular enlargement in schizophreniaevaluated with computed tomographic scanning. Effects of gender,age, and stage of illness. Arch. Gen. Psychiatry 47, 1008–1015.
Andreasen, N.C., Arndt, S., Alliger, R., Miller, D., Flaum, M., 1995.Symptoms of schizophrenia. Methods, meanings, and mechan-isms. Arch. Gen. Psychiatry 52, 341–351.
Benes, F.M., 1991. Evidence for neurodevelopment disturbances inanterior cingulate cortex of post-mortem schizophrenic brain.Schizophr. Res. 5, 187–188.
Benes, F.M., Bird, E.D., 1987. An analysis of the arrangement ofneurons in the cingulate cortex of schizophrenic patients. Arch.Gen. Psychiatry 44, 608–616.
Benes, F.M., McSparren, J., Bird, E.D., SanGiovanni, J.P., Vincent, S.L.,1991. Deficits in small interneurons in prefrontal and cingulatecortices of schizophrenic and schizoaffective patients. Arch. Gen.Psychiatry 48, 996–1001.
Benes, F.M., Vincent, S.L., Todtenkopf, M., 2001. The density ofpyramidal and nonpyramidal neurons in anterior cingulate cortexof schizophrenic and bipolar subjects. Biol. Psychiatry 50,395–406.
Bouras, C., Kovari, E., Hof, P.R., Riederer, B.M., Giannakopoulos, P.,2001. Anterior cingulate cortex pathology in schizophrenia andbipolar disorder. Acta Neuropathol. (Berl) 102, 373–379.
Chana, G., Landau, S., Beasley, C., Everall, I.P., Cotter, D., 2003.Two-dimensional assessment of cytoarchitecture in the anteriorcingulate cortex in major depressive disorder, bipolar disorder, andschizophrenia: evidence for decreased neuronal somal size andincreased neuronal density. Biol. Psychiatry 53, 1086–1098.
Cotter, D., Mackay, D., Landau, S., Kerwin, R., Everall, I., 2001.Reduced glial cell density and neuronal size in the anteriorcingulate cortex in major depressive disorder. Arch. Gen.Psychiatry 58, 545–553.
Crespo-Facorro, B., Kim, J., Andreasen, N.C., O'Leary, D.S.,Magnotta, V., 2000. Regional frontal abnormalities in schizo-phrenia: a quantitative gray matter volume and cortical surface sizestudy. Biol. Psychiatry 48, 110–119.
Crosson, B., Sadek, J.R., Bobholz, J.A., Gokcay, D., Mohr, C.M.,Leonard, C.M., Maron, L., Auerbach, E.J., Browd, S.R., Freeman,A.J., Briggs, R.W., 1999. Activity in the paracingulate andcingulate sulci during word generation: an fMRI study offunctional anatomy. Cereb. Cortex 9, 307–316.
Csernansky, J.G., Wang, L., Jones, D., Rastogi-Cruz, D., Posener, J.A.,Heydebrand, G., Miller, J.P., Miller, M.I., 2002. Hippocampaldeformities in schizophrenia characterized by high dimensionalbrain mapping. Am. J. Psychiatry 159, 2000–2006.
Csernansky, J.G., Schindler, M.K., Splinter, N.R., Wang, L., Gado, M.,Selemon, L.D., Rastogi-Cruz, D., Posener, J.A., Thompson, P.A.,Miller, M.I., 2004a. Abnormalities of thalamic volume and shapein schizophrenia. Am. J. Psychiatry 161, 896–902.
Csernansky, J.G., Wang, L., Joshi, S.C., Ratnanather, J.T., Miller, M.I.,2004b. Computational anatomy and neuropsychiatric disease:probabilistic assessment of variation and statistical inference ofgroup difference, hemispheric asymmetry, and time-dependentchange. NeuroImage 23 (Suppl 1), S56–S68.
Desikan, R.S., Segonne, F., Fischl, B., Quinn, B.T., Dickerson, B.C.,Blacker, D., Buckner, R.L., Dale, A.M., Maguire, R.P., Hyman,B.T., Albert, M.S., Killiany, R.J., 2006. An automated labelingsystem for subdividing the human cerebral cortex on MRIscans into gyral based regions of interest. NeuroImage 31,968–980.
Dolan, R.J., Fletcher, P., Frith, C.D., Friston, K.J., Frackowiak, R.S.,Grasby, P.M., 1995. Dopaminergic modulation of impairedcognitive activation in the anterior cingulate cortex in schizo-phrenia. Nature 378, 180–182.
Duvernoy, H.M., 1991. The Human Brain: Surface, Three-Dimen-sional Anatomy and MRI. Springer-Verlag, Wien, New York.
First, M., Spitzer, R., Gibbon, M., Williams, J., 1995. StructuredClinical Interview for DSM-IVAxis I Disorders— Patient Edition

77L. Wang et al. / Schizophrenia Research 93 (2007) 66–78
(SCID-I/P, Version 2.0). Biometrics Research Department, NewYork State Psychiatric Institute, New York, NY.
Fischl, B., Salat, D.H., Busa, E., Albert, M., Dieterich, M., Haselgrove,C., van der Kouwe, A., Killiany, R., Kennedy, D., Klaveness, S.,Montillo, A., Makris, N., Rosen, B., Dale, A.M., 2002. Wholebrain segmentation: automated labeling of neuroanatomicalstructures in the human brain. Neuron 33, 341–355.
Fischl, B., Salat, D.H., van der Kouwe, A.J., Makris, N., Segonne, F.,Quinn, B.T., Dale, A.M., 2004. Sequence-independent segmentationof magnetic resonance images. NeuroImage 23 (Suppl 1), S69–S84.
Goldstein, J.M., Seidman, L.J., O'Brien, L.M., Horton, N.J., Kennedy,D.N., Makris, N., Caviness Jr., V.S., Faraone, S.V., Tsuang, M.T.,2002. Impact of normal sexual dimorphisms on sex differences instructural brain abnormalities in schizophrenia assessed bymagnetic resonance imaging. Arch. Gen. Psychiatry 59, 154–164.
Ha, T.H., Youn, T., Ha, K.S., Rho, K.S., Lee, J.M., Kim, I.Y., Kim, S.I.,Kwon, J.S., 2004. Gray matter abnormalities in paranoid schizo-phrenia and their clinical correlations. Psychiatry Res. 132, 251–260.
Han, X., Xu, C., Prince, J.L., 2001. A Topology PreservingDeformable Model Using Level Set, CVPR'2001. Kauai, HI,IEEE, pp. 765–770.
Han, X., Xu, C.Y., Braga-Neto, U., Prince, J.L., 2002. Topologycorrection in brain cortex segmentation using a multiscale, graph-based algorithm. IEEE Trans. Med. Imag. 21, 109–121.
Heckers, S., Weiss, A.P., Deckersbach, T., Goff, D.C., Morecraft, R.J.,Bush, G., 2004. Anterior cingulate cortex activation duringcognitive interference in schizophrenia. Am. J. Psychiatry 161,707–715.
Hirayasu, Y., Shenton, M.E., Salisbury, D.F., Kwon, J.S., Wible, C.G.,Fischer, I.A., Yurgelun-Todd, D., Zarate, C., Kikinis, R., Jolesz, F.A.,McCarley, R.W., 1999. Subgenual cingulate cortex volume in first-episode psychosis. Am. J. Psychiatry 156, 1091–1093.
Hulshoff Pol, H.E., Schnack, H.G., Mandl, R.C., van Haren, N.E.,Koning, H., Collins, D.L., Evans, A.C., Kahn, R.S., 2001. Focalgray matter density changes in schizophrenia. Arch. Gen.Psychiatry 58, 1118–1125.
Javitt, D.C., Zukin, S.R., 1991. Recent advances in the phencyclidinemodel of schizophrenia. Am. J. Psychiatry 148, 1301–1308.
Joshi, M., Cui, J., Doolittle, K., Joshi, S., Van Essen, D., Wang, L.,Miller, M.I., 1999. Brain segmentation and the generation ofcortical surfaces. NeuroImage 9, 461–476.
Khaneja, N., Grenander, U., Miller, M.I., 1998. Dynamic Program-ming Generation of Curves on Brain Surfaces. IEEE Trans. PatternAnal. Mach. Intell. 20, 1260–1264.
Lawrie, S.M., Abukmeil, S.S., 1998. Brain abnormality in schizophrenia.A systematic and quantitative review of volumetric magneticresonance imaging studies. Br. J. Psychiatry 172, 110–120.
Malhotra, A.K., Pinals, D.A., Weingartner, H., Sirocco, K., Missar, C.D.,Pickar, D., Breier, A., 1996. NMDA receptor function and humancognition: the effects of ketamine in healthy volunteers. Neuropsy-chopharmacology 14, 301–307.
Miller, M.I., Massie, A.B., Ratnanather, J.T., Botteron, K.N.,Csernansky, J.G., 2000. Bayesian construction of geometricallybased cortical thickness metrics. NeuroImage 12, 676–687.
Miller, M.I., Hosakere, M., Barker, A.R., Priebe, C.E., Lee, N.,Ratnanather, J.T., Wang, L., Gado, M., Morris, J.C., Csernansky,J.G., 2003. Labeled cortical mantle distance maps of the cingulatequantify differences between dementia of the Alzheimer type andhealthy aging. Proc. Natl. Acad. Sci. U. S. A. 100, 15172–15177.
Mitelman, S.A., Shihabuddin, L., Brickman, A.M., Hazlett, E.A.,Buchsbaum, M.S., 2003. MRI assessment of gray and white matterdistribution in Brodmann's areas of the cortex in patients with
schizophrenia with good and poor outcomes. Am. J. Psychiatry160, 2154–2168.
Mitelman, S.A., Shihabuddin, L., Brickman, A.M., Hazlett, E.A.,Buchsbaum, M.S., 2005. Volume of the cingulate and outcome inschizophrenia. Schizophr. Res. 72, 91–108.
Narr, K.L., Sharma, T., Woods, R.P., Thompson, P.M., Sowell, E.R.,Rex, D., Kim, S., Asuncion, D., Jang, S., Mazziotta, J., Toga, A.W.,2003. Increases in regional subarachnoid CSF without apparentcortical gray matter deficits in schizophrenia: modulating effects ofsex and age. Am. J. Psychiatry 160, 2169–2180.
Narr, K.L., Toga, A.W., Szeszko, P., Thompson, P.M., Woods, R.P.,Robinson, D., Sevy, S., Wang, Y., Schrock, K., Bilder, R.M., 2005.Cortical thinning in cingulate and occipital cortices in first episodeschizophrenia. Biol. Psychiatry 58, 32–40.
Newell, K.A., Zavitsanou, K., Huang, X.F., 2005. Ionotropicglutamate receptor binding in the posterior cingulate cortex inschizophrenia patients. NeuroReport 16, 1363–1367.
Olney, J.W., Farber, N.B., 1995. Glutamate receptor dysfunction andschizophrenia. Arch. Gen. Psychiatry 52, 998–1007.
Ongur, D., Drevets, W.C., Price, J.L., 1998. Glial reduction in thesubgenual prefrontal cortex in mood disorders. Proc. Natl. Acad.Sci. U. S. A. 95, 13290–13295.
Paus, T., Otaky, N., Caramanos, Z., MacDonald, D., Zijdenbos, A.,D'Avirro, D., Gutmans, D., Holmes, C., Tomaiuolo, F., Evans, A.C.,1996. In vivomorphometry of the intrasulcal graymatter in the humancingulate, paracingulate, and superior-rostral sulci: hemisphericasymmetries, gender differences and probability maps. J. Comp.Neurol. 376, 664–673.
Qiu, A., Bitouk, D., Miller, M.I., 2005. Smooth Functional andStructural Maps on the Neocortex via Orthonormal Bases of theLaplace–Beltrami Operator. IEEE Trans. Med. Imag. (in revision).
Rastogi-Cruz, D., Csernansky, J., 1997. Clinical rating scales. In:Guze, S. (Ed.), Adult Psychiatry. Mosby, Inc., St. Louis.
Ratnanather, J.T., Botteron, K.N., Nishino, T., Massie, A.B., Lal, R.M.,Patel, S.G., Peddi, S., Todd, R.D., Miller, M.I., 2001. Validatingcortical surface analysis of medial prefrontal cortex. NeuroImage14, 1058–1069.
Ratnanather, J.T., Barta, P.E., Honeycutt, N.A., Lee, N., Morris, H.M.,Dziorny, A.C., Hurdal, M.K., Pearlson, G.D., Miller, M.I., 2003.Dynamic programming generation of boundaries of local coordi-natized submanifolds in the neocortex: application to the planumtemporale. NeuroImage 20, 359–377.
Ratnanather, J.T., Wang, L., Nebel, M.B., Hosakere, M., Han, X.,Csernansky, J.G., Miller, M.I., 2004. Validation of semiautomatedmethods for quantifying cingulate cortical metrics in schizophre-nia. Psychiatry Res. 132, 53–68.
Riffkin, J., Yucel, M., Maruff, P., Wood, S.J., Soulsby, B., Olver, J.,Kyrios, M., Velakoulis, D., Pantelis, C., 2005. A manual andautomated MRI study of anterior cingulate and orbito-frontalcortices, and caudate nucleus in obsessive-compulsive disorder:comparison with healthy controls and patients with schizophrenia.Psychiatry Res. 138, 99–113.
SAS Institute Inc., 2000. SAS System for Windows, V8. SAS InstituteInc., Cary, North Carolina.
Shimizu, E., Hashimoto, K., Ochi, S., Fukami, G., Fujisaki, M., Koike,K., Okamura, N., Ohgake, S., Koizumi, H., Matsuzawa, D., Zhang,L., Watanabe, H., Nakazato, M., Shinoda, N., Komatsu, N., Morita,F., Iyo, M., 2007. Posterior cingulate gyrus metabolic changes inchronic schizophrenia with generalized cognitive deficits. J. Psychiatr.Res. 41, 49–56.
Sigmundsson, T., Suckling, J., Maier, M., Williams, S., Bullmore, E.,Greenwood, K., Fukuda, R., Ron, M., Toone, B., 2001. Structural

78 L. Wang et al. / Schizophrenia Research 93 (2007) 66–78
abnormalities in frontal, temporal, and limbic regions andinterconnecting white matter tracts in schizophrenic patients withprominent negative symptoms. Am. J. Psychiatry 158, 234–243.
Todtenkopf, M.S., Vincent, S.L., Benes, F.M., 2005. A cross-studymeta-analysis and three-dimensional comparison of cell countingin the anterior cingulate cortex of schizophrenic and bipolar brain.Schizophr. Res. 73, 79–89.
Uematsu, M., Kaiya, H., 1989. Midsagittal cortical pathomorphologyof schizophrenia: a magnetic resonance imaging study. PsychiatryRes. 30, 11–20.
Van Leemput, K., Maes, F., Vandermeulen, D., Suetens, P., 2003. Aunifying framework for partial volume segmentation of brain MRimages. IEEE Trans. Med. Imag. 22, 105–119.
Venkatesan, R., Haacke, E., 1997. Role of high resolution in magneticresonance (MR) imaging: applications for MR angiography,intracranial T1-weighted imaging, and image interpolation. Int. J.Imaging Syst. Technol. 8, 529–543.
Vogt, B.A., Nimchinsky, E.A., Vogt, L.J., Hof, P.R., 1995. Humancingulate cortex: surface features, flat maps, and cytoarchitecture.J. Comp. Neurol. 359, 490–506.
Vogt, B.A., Vogt, L., Laureys, S., 2005. Cytology and functionallycorrelated circuits of human posterior cingulate areas. NeuroImage.
Wright, I.C., Rabe-Hesketh, S., Woodruff, P.W., David, A.S., Murray,R.M., Bullmore, E.T., 2000. Meta-analysis of regional brainvolumes in schizophrenia. Am. J. Psychiatry 157, 16–25.
Young, A.H., Blackwood, D.H., Roxborough, H., McQueen, J.K.,Martin, M.J., Kean, D., 1991. A magnetic resonance imaging studyof schizophrenia: brain structure and clinical symptoms. Br. J.Psychiatry 158, 158–164.
Yucel, M., Stuart, G.W., Maruff, P., Velakoulis, D., Crowe, S.F.,Savage, G., Pantelis, C., 2001. Hemispheric and gender-relateddifferences in the gross morphology of the anterior cingulate/paracingulate cortex in normal volunteers: an MRI morphometricstudy. Cereb. Cortex 11, 17–25.
Yucel, M., Stuart, G.W., Maruff, P., Wood, S.J., Savage, G.R., Smith,D.J., Crowe, S.F., Copolov, D.L., Velakoulis, D., Pantelis, C.,2002. Paracingulate morphologic differences in males withestablished schizophrenia: a magnetic resonance imaging morpho-metric study. Biol. Psychiatry 52, 15–23.


![The neurobiological differences in the cerebrum(MTG), (v) fusiform gyrus, (vi) parahippocampal gyri, and (vii) posterior cingulate gyrus [33,34]. These brain regions are also associated](https://img.dokumen.tips/doc/110x75/6046bc593787a201440b6bce/the-neurobiological-differences-in-the-cerebrum-mtg-v-fusiform-gyrus-vi.jpg)