Embed Size (px)
Citation preview

AAMA/WDMA 2008-2009U.S. National Statistical
Review and Forecast
FENESTRATIONPRODUCTS

2008/2009 U.S. National Statistical Review and Forecast
Copyright © 2009- Co-published by:
Researched and Edited in March 2009 by: Ducker Worldwide, LLC 1250 Maplelawn Dr. Troy, MI 48084 (248) 644-0086 www.ducker.com
Introduction Market estimates in the U.S. Industry Statistical Review and Forecast are driven not only by statistics published by the Census Bureau and other construction statistics organizations, but also from primary interviews with leading manufacturers of windows, doors and skylights, as well as component suppliers. All forecasts are based on projections of construction activity as of March 2009 and appropriate usage factors and tabulations developed by Ducker Worldwide LLC, which is solely responsible for the data. Any questions on the Review or its contents should be directed to Ducker. Ducker has been conducting residential and nonresidential market studies continuously since 1982 for the American Architectural Manufacturers Association (AAMA). From 1978 to 1981, studies were conducted for the Sealed Insulating Glass Manufacturers Association (SIGMA- (currently referred to as IGMA). Ducker has been conducting the update study of the U.S. residential and nonresidential window and door markets for AAMA in combination with the Window and Door Manufacturers Association (WDMA) since October of 1994. The U.S. Industry Statistical Review and Forecast is published annually. Additional and much more detailed information on window, door and skylight markets is contained in the (2007) Study of the U.S. Market for Windows, Doors and Skylights, and The Distribution of Residential and Nonresidential Windows and Doors in the 2007 U.S. Market, as well as individual Statistical Review and Forecast market overview reports for each of the 11 major U.S. regional markets. All reports are available from AAMA, WDMA, or Ducker.
Contents
Residential Construction Activity Privately owned housing 1 New housing by type of structure 1 Residential construction activity 2 Improvement expenditures 3 Manufactured housing shipments 4 Existing home sales 4 Residential Product Statistics Prime windows 5-6 Storm doors 7 Skylights 7 Patio doors 8 Entry and passage door usage 9-10 Door forecast 11 Nonresidential Product Statistics Entry and passage door usage 10 Door forecast 11 Insulating glass statistics 12 Nonresidential Construction Activity Contract awards 13-14 Regional construction 15 Window usage 16-17 U.S. Map of Geographic Division 18
American Architectural Manufacturers Association (AAMA) 1827 Walden Office Square, Suite 550 Schaumburg, Illinois 60173 Tel: (847) 303-5664/Fax: (847) 303-5774 www.aamanet.org
Window & Door Manufacturers Association (WDMA) 401 North Michigan Avenue Chicago, Illinois 60611 Tel: (312) 321-6802 www.wdma.com

2008/2009 U.S. National Statistical Review and Forecast
1
Review of New Residential Construction Activity
Total New Residential Housing (Thousands of Units)
New Residential Construction 2007 2008% Change'08 vs. '07
2009(F)% Change
'09(F) vs. '08SINGLE FAMILY STARTS 1,046 622 -40.5% 360 -42.1%MULTI FAMILY STARTS 309 284 -8.3% 150 -47.1%MFD. HOUSING SHIPMENTS 96 82 -14.3% 65 -20.7%TOTAL 1,451 988 -31.9% 575 -41.8%
Total housing starts continued to decline in 2008, dropping to the lowest level since the Census Bureau began tracking the data in 1959. Single family starts showed the largest drop, declining by 40.5 percent to 622,000 units. Multifamily housing starts and manufactured home shipments showed a more moderate decline, but these segments declined by 8.3 and 14.3 percent respectively. Regionally, the West showed the steepest decline in conventional starts during this timeframe at 38.9 percent. The Northeast showed the most resilience and declined by only 15.3 percent due to a higher percentage of multifamily in this market. The Midwest and South declined at a similar rate to the national total at 35.8 and 33.4 percent respectively. For 2009, starts are expected to continue to decline by nearly 42 percent as both single and multifamily starts decline significantly. The residential new construction market is forecast to improve in 2010.
New Housing by Type of Structure
Total New Housing Starts
2003 - 2012F (Thousands of Units)
Units % Units % Units % Units % Units %
2003 1,979 100% 131 7% 1,848 93% 1,498 76% 350 18%2004 2,087 100% 131 6% 1,956 94% 1,611 77% 345 17%
2005 2,215 100% 147 7% 2,068 93% 1,716 77% 353 16%2006 1,918 100% 117 6% 1,801 94% 1,465 76% 336 17%
2007 1,451 100% 96 7% 1,355 93% 1,046 72% 309 21%2008 988 100% 82 8% 906 92% 622 63% 284 29%2009F 575 100% 65 11% 510 89% 360 63% 150 26%
2010F 770 100% 70 9% 700 91% 525 68% 175 23%2011F 1,005 100% 75 7% 930 93% 710 71% 220 22%2012F 1,150 100% 80 7% 1,070 93% 830 72% 240 21%
Single Family Multi-FamilyYear
Total ShelterManufactured
HousingTotal Conventional
Source: History: U.S. Bureau of the Census Forecast: Ducker Research Company, Inc.
RESIDENTIAL

2008/2009 U.S. National Statistical Review and Forecast
2
Review of New Residential Construction Activity
Total New Residential Housing Single and Multi-Family Starts
2003 Through 2012F (Thousands of Units)
Year Total2003 1,848 163 8.8% 374 20.2% 839 45.4% 472 25.6%2004 1,956 175 9.0% 356 18.2% 909 46.5% 516 26.4%2005 2,068 190 9.2% 357 17.3% 996 48.2% 525 25.4%2006 1,801 167 9.3% 280 15.5% 910 50.5% 444 24.6%2007 1,355 143 10.5% 210 15.5% 681 50.3% 321 23.7%2008 906 121 13.4% 135 14.9% 453 50.1% 196 21.7%2009F 510 51 10.0% 77 15.0% 255 50.0% 128 25.0%2010F 700 67 9.6% 106 15.1% 351 50.1% 176 25.2%2011F 930 87 9.4% 140 15.1% 467 50.2% 235 25.3%2012F 1,070 102 9.5% 161 15.0% 537 50.2% 271 25.3%
Northeast Midwest South West
Source: History: U.S. Bureau of the Census
Forecast: Ducker Research Company, Inc.
0
250
500
750
1,000
1,250
1,500
1,750
2,000
2,250
2003 2004 2005 2006 2007 2008 2009F 2010F 2011F 2012F
Single Family Multi-Family Manufactured Housing
RESIDENTIAL

2008/2009 U.S. National Statistical Review and Forecast
3
Total Residential Improvement Expenditures
The Bureau of the Census ceased tracking and publishing data on the remodeling market in the fourth quarter of 2007. Ducker continues to estimate and track this market using data from the Harvard Joint Center for Housing Studies Leading Indicator of Remodeling Activity (LIRA) in additional to review of same store sales by large home improvement retailers. Based on these inputs the remodeling market is estimated to have declined by 12 percent to $124.5 billion in 2008. Declines in the overall sales of existing homes, double digit declines in home values, and much more stringent credit requirements for mortgages and home equity loans continue to adversely impact the remodeling market. 2009 residential improvement expenditures are expected to decline by an additional 14 percent, but the market should improve by 8 percent in 2010.
Note: Included in the total are additions, alterations, and major replacements. Excluded are maintenance, repairs, and outside additions/alterations
Total Residential Improvement Expenditures (Billions of Dollars)
Excluding additions and alterations to properties outside of structures
Year Source: History: U.S. Bureau of the Census, Harvard Joint Center for Housing Studies (LIRA)
Forecast: Ducker Research Company, Inc.
$0$10$20$30$40$50$60$70$80$90
$100$110$120$130$140$150
2003 2004 2005 2006 2007 2008 2009F 2010F 2011F 2012F
RESIDENTIAL
Bill
ions
Year Expenditures ($B) Growth Over Prior Year2003 112.7 4.9%2004 121.7 8.0%2005 133.4 9.6%2006 143.4 7.5%2007 141.4 -1.4%2008 124.5 -12.0%
2009F 107.0 -14.0%2010F 115.6 8.0%2011F 129.5 12.0%2012F 139.8 8.0%
2008/2009 U.S. National Statistical Review and Forecast
4
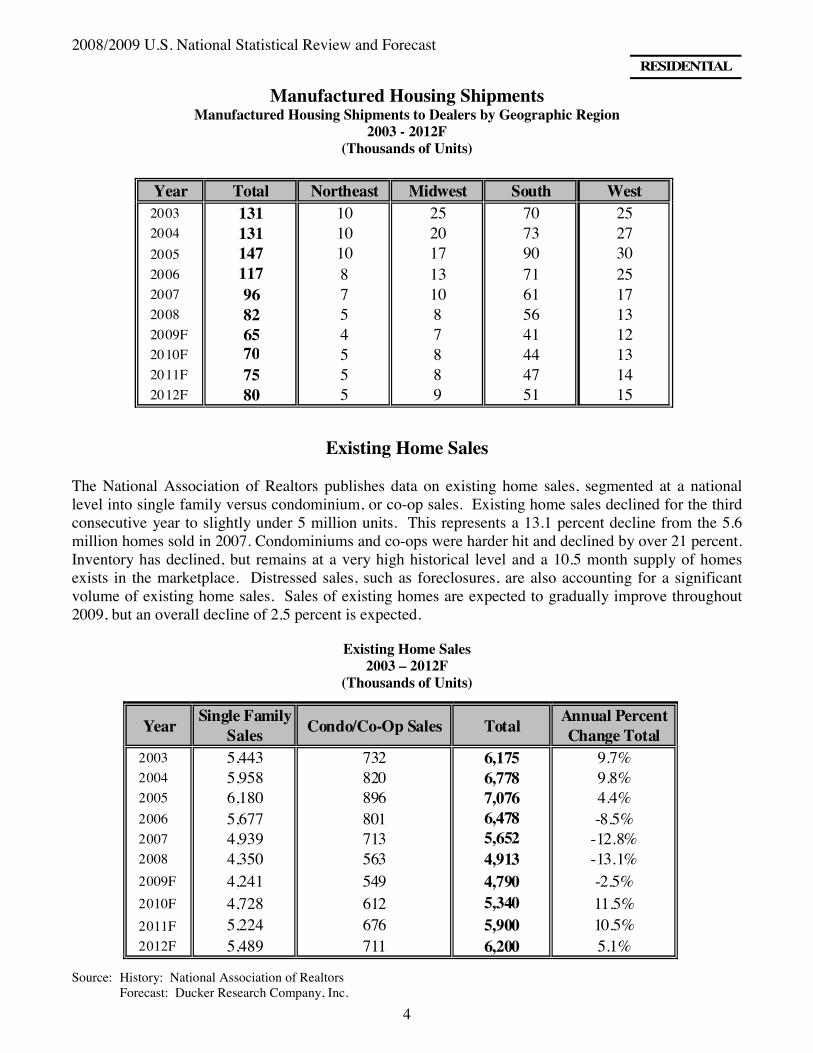
Manufactured Housing Shipments Manufactured Housing Shipments to Dealers by Geographic Region
2003 - 2012F (Thousands of Units)
Year Total Northeast Midwest South West2003 131 10 25 70 252004 131 10 20 73 272005 147 10 17 90 302006 117 8 13 71 252007 96 7 10 61 172008 82 5 8 56 132009F 65 4 7 41 122010F 70 5 8 44 132011F 75 5 8 47 142012F 80 5 9 51 15
Existing Home Sales The National Association of Realtors publishes data on existing home sales, segmented at a national level into single family versus condominium, or co-op sales. Existing home sales declined for the third consecutive year to slightly under 5 million units. This represents a 13.1 percent decline from the 5.6 million homes sold in 2007. Condominiums and co-ops were harder hit and declined by over 21 percent. Inventory has declined, but remains at a very high historical level and a 10.5 month supply of homes exists in the marketplace. Distressed sales, such as foreclosures, are also accounting for a significant volume of existing home sales. Sales of existing homes are expected to gradually improve throughout 2009, but an overall decline of 2.5 percent is expected.
Existing Home Sales
2003 – 2012F (Thousands of Units)
YearSingle Family
Sales Condo/Co-Op Sales TotalAnnual Percent Change Total
2003 5,443 732 6,175 9.7%2004 5,958 820 6,778 9.8%2005 6,180 896 7,076 4.4%2006 5,677 801 6,478 -8.5%2007 4,939 713 5,652 -12.8%2008 4,350 563 4,913 -13.1%2009F 4,241 549 4,790 -2.5%2010F 4,728 612 5,340 11.5%2011F 5,224 676 5,900 10.5%2012F 5,489 711 6,200 5.1%
Source: History: National Association of Realtors
Forecast: Ducker Research Company, Inc.
RESIDENTIAL

2008/2009 U.S. National Statistical Review and Forecast
5
Prime Windows The residential window market is classified into four main categories based on the predominant frame and sash materials: wood (including clad wood), vinyl, aluminum and fiberglass. A fifth category, “other” windows describes all other plastic materials including ABS plastics, cellular vinyl, and PVC/wood composites. The drastically declining new construction market coupled with the drop in remodeling expenditures continues to take a significant toll on nearly all the segments and regions of the residential window market. In total, the residential window market declined by over 18 percent. New construction applications declined by 27.1 percent from 2007 to 2008, while remodeling and replacement applications dropped by 11.8 percent. The conventional window market does not include an additional 3.8 million units used in light commercial and manufactured housing applications, which brings the total “residential-type” prime windows to 52.2 million units. Within this other segment, the light-commercial market declined by 7 percent and units for manufactured housing declined by an additional 15 percent.
Total Shipments of Conventional Prime Windows by Year
2003 – 2012F (Millions of Units)
Source: Ducker Research Company, Inc. *Includes vinyl clad and metal clad wood units.
05
1015202530354045505560657075
2003 2004 2005 2006 2007 2008 2009F 2010F 2011F 2012F
Wood* Aluminum Vinyl Other Fiberglass
RESIDENTIAL

2008/2009 U.S. National Statistical Review and Forecast
6
Prime Windows Marginal share shift continued in the total market away from wood and aluminum to vinyl, but much of this is an impact of overall application mix between new construction and remodeling and replacement. Vinyl windows declined by nearly 17 percent in aggregate. Aluminum products showed the steepest rate of decline at 26.6 percent, while wood windows declined by an additional 21.4 percent. Fiberglass continues to grow despite the downturn, showing a 6.2 percent rate of growth as this product becomes more available to and accepted by consumers and builders. Other windows also showed some growth on the remodeling side and this category grew by 3.4 percent in aggregate. The growing volume of foreclosures impacting both the resale and new construction housing market has created some uncertainty regarding the impact of recently announced incentives for new home buyers and tax credits for energy efficient window replacement. Replacement windows may receive the most direct boost in the short term, however the long term and indirect effects of the program remain challenging to forecast due to the unprecedented macro economic environment. Preliminarily, the market is expected to continue to decline by an additional 23.9 percent in 2009, but show marked improvement from 2010 to 2012. Shipments of Prime Windows
2003 – 2012F (Millions of Units)
New Construction 2003 2004 2005 2006 2007 2008 2009F 2010F 2011F 2012F
Wood 9.9 9.5 9.2 8.3 6.2 4.3 2.5 3.4 4.6 5.3
Aluminum 5.1 5.9 6.5 6.1 4.4 3.1 1.7 2.0 2.3 2.4
Vinyl 13.8 15.2 17.4 16.8 13.2 9.7 5.6 8.0 11.0 12.8
Fiberglass* 0.6 0.6 0.8 0.8 0.8 0.8 0.6 0.9 1.2 1.5
Other 0.2 0.2 0.2 0.2 0.2 0.2 0.1 0.2 0.2 0.3
Sub Total 29.5 31.4 34.1 32.3 24.9 18.1 10.5 14.5 19.3 22.3
Remodeling & Replacement
2003 2004 2005 2006 2007 2008 2009F 2010F 2011F 2012F
Wood 10.0 10.3 10.0 9.0 8.9 7.6 6.5 6.9 7.8 8.4
Aluminum 2.6 2.4 2.4 2.2 1.9 1.6 1.3 1.3 1.4 1.4
Vinyl 20.0 22.2 23.2 22.4 22.5 20.0 17.4 19.0 21.8 23.5
Fiberglass* 0.2 0.3 0.4 0.4 0.5 0.5 0.6 0.7 0.8 1.0
Other 0.5 0.5 0.5 0.5 0.5 0.6 0.6 0.6 0.7 0.7
Sub Total 33.3 35.7 36.4 34.5 34.3 30.2 26.3 28.6 32.5 35.0
Total Construction 2003 2004 2005 2006 2007 2008 2009F 2010F 2011F 2012F
Wood 19.9 19.7 19.2 17.3 15.1 11.9 8.9 10.3 12.4 13.6
Aluminum 7.7 8.3 8.8 8.3 6.4 4.7 3.0 3.3 3.6 3.8
Vinyl 33.8 37.4 40.6 39.2 35.7 29.7 23.0 27.1 32.8 36.4
Fiberglass* 0.8 0.9 1.1 1.21 1.28 1.36 1.2 1.6 2.0 2.5
Other 0.6 0.7 0.8 0.8 0.7 0.8 0.7 0.8 0.9 1.0
Total 62.8 67.1 70.5 66.7 59.1 48.4 36.8 43.1 51.8 57.3
* Due to rounding, totals may not equal the sums of individual values. Source: Ducker Research
RESIDENTIAL

2008/2009 U.S. National Statistical Review and Forecast
7
Storm Doors Shipments of storm doors decreased to approximately 4.4 million units, which was an 18.5 percent decline over 2007. Significant decreases in new construction and remodeling activity influenced the decline. A 25.5 percent decline in the market is expected for 2009. Conditions are expected to improve in 2010 through 2012, but increasing energy efficiency of entry doors and continued trends toward decorative entry doorlites may temper overall growth.
Storm Door Shipments
2003 - 2012F (Millions of Units)
*Other defined as “vinyl or metal cladding over wood, wood composite or foam core.”
Residential Type Unit Skylights Residential skylights saw a decline of over 22 percent from 2007 to 2008. The higher than expected decline was driven by sharp slowdowns in new construction and remodeling activity. As builders looked for ways to cut costs, discretionary products like skylights saw a more significant drop than entry doors and windows. For 2009, the market is expected to continue to decline by roughly 28.6 percent. As the market rebounds in 2010, shipments are expected to increase by over 21 percent over 2009 levels and the market should regain strong growth through 2012.
Residential-Type Skylight Unit Shipments
2003 - 2012F
(Thousands of Skylights)
RESIDENTIAL
Application 2003 2004 2005 2006 2007 2008 2009F 2010F 2011F 2012FNew 813 799 798 670 555 400 220 310 430 500R&R 917 910 832 815 707 580 480 540 630 700Total 1,730 1,709 1,630 1,485 1,262 980 700 850 1,060 1,200
Doors 2003 2004 2005 2006 2007 2008 2009F 2010F 2011F 2012FAluminum 4.4 4.4 4.4 4.3 3.9 3.2 2.3 2.7 3.2 3.4Other* 1.7 1.8 1.7 1.5 1.4 1.1 0.9 1.2 1.5 1.8Wood 0.1 0.1 0.1 0.1 0.1 0.1 0.1 0.1 0.1 0.1Total 6.2 6.3 6.2 5.9 5.4 4.4 3.3 4.0 4.8 5.3

2008/2009 U.S. National Statistical Review and Forecast
8
Residential Patio Doors Patio door shipments continue to correlate closely with the overall broader window market. The 2008 total patio door market declined by 18.1 percent from 2008 levels. The new construction market bore the brunt of the largest decline of 26.4 percent, while the remodeling and replacement market declined by 11.4 percent. During this time period vinyl products declined by 15 percent, while wood and aluminum doors declined by 21.3 and 25.8 percent respectively. These products are traditionally manufactured by window manufacturers, while steel and fiberglass products are made by traditional door manufacturers. The steel market declined by nearly 17 percent, while fiberglass products dropped by 10 percent. The 2009 market is expected to remain weak for both new construction and remodeling and replacement resulting in a 24.4 percent aggregate decline. This decline will likely impact all material types. Conditions are expected to improve in 2010, resulting in a forecasted 18 percent growth over 2009 levels. Shipments for 2010 are expected to remain significantly below recent historic levels of patio door shipments, but mark the beginning of a steady growth trend lasting though at least 2012.
Shipments of Patio Doors
2003 - 2012F (Thousands of Units)
Source: Ducker Research Company, Inc. Wood segment includes vinyl clad wood and metal clad wood units. Due to rounding, totals may not equal the sums of individual values
RESIDENTIAL
New Construction 2003 2004 2005 2006 2007 2008 2009F 2010F 2011F 2012F
Wood 842 893 915 810 670 480 275 390 530 605Aluminum 431 426 466 380 290 200 110 125 135 145Vinyl 677 802 875 860 695 530 310 445 615 720Steel 267 260 244 220 180 130 80 110 140 160Fiberglass 65 90 92 93 82 70 50 68 85 105Other 18 20 23 22 18 15 10 12 15 20
Sub Total 2,300 2,490 2,615 2,385 1,935 1,425 835 1,150 1,520 1,755
Remodeling & Replacement
2003 2004 2005 2006 2007 2008 2009F 2010F 2011F 2012F
Wood 593 607 615 587 575 500 430 465 530 575Aluminum 284 274 284 235 215 175 140 145 150 155Vinyl 974 1,058 1,095 1,130 1,091 985 870 960 1,100 1,200Steel 483 470 456 439 379 335 290 315 355 380Fiberglass 85 110 118 128 118 110 100 107 120 133Other 22 30 32 33 32 30 26 28 30 32
Sub Total 2,440 2,550 2,600 2,550 2,410 2,135 1,855 2,020 2,285 2,475
Total Construction 2003 2004 2005 2006 2007 2008 2009F 2010F 2011F 2012FWood 1,435 1,500 1,530 1,397 1,245 980 704 855 1,060 1,180Aluminum 715 700 750 615 505 375 250 270 285 300Vinyl 1,650 1,860 1,970 1,990 1,785 1,515 1,180 1,405 1,715 1,920Steel 750 730 700 658 560 465 371 425 495 540Fiberglass 150 200 210 221 200 180 150 175 205 238Other 40 50 55 55 50 45 36 40 45 52
Total 4,740 5,040 5,215 4,935 4,345 3,560 2,690 3,170 3,805 4,230

2008/2009 U.S. National Statistical Review and Forecast
9
Residential Entry/Interior Doors Steel continues to be the most widely used exterior door material; however, its share of market has fallen to 60 percent of entry doors in 2008. Fiberglass share continues to grow and is anticipated to continue to do so, though at a somewhat slower pace. Wood doors have found a niche in high-end construction which has slowed its loss of market share to fiberglass.
Entry Doors Residential Entry Doors Residential Entry Doors 2008 2012 Forecast Volume = 10.4 Million Units Volume = 11.0 Million Units Little change in the segments for interior door material types is expected over the next five years. Residential interior door volumes include both passage and closet doors.
Interior Doors Residential Interior Doors Residential Interior Doors 2008 2012 Forecast Volume = 44.6 Million Units Volume = 53.6 Million Units
RESIDENTIAL
60%
28%
12%
58%30%
12%
Steel
Wood
Fiberglass Fiberglass
Steel
Wood
97%
3%
97%
3%
Wood
Other
Wood
Other

2008/2009 U.S. National Statistical Review and Forecast
10
Steel is anticipated to remain the primary material used for entry doors in the nonresidential market, followed by aluminum, including aluminum framed storefront doors, which represent slightly more than one-third of the overall market.
Entry Doors Nonresidential Entry Doors Nonresidential Entry Doors 2008 2012 Forecast Volume = 3.3 Million Units Volume = 2.9 Million Units Nonresidential construction has slowed somewhat in 2008, tempering demand in the nonresidential entry and interior door categories. In 2008, wood sales were flat overall versus 2007, whereas steel volumes declined somewhat, thus increasing wood’s share of the 2008 market. It is important to note that interior passage doors are defined as all door applications within a building or structure, excluding closet/bifold, service, and other special purpose doors. Nonresidential interior doors include both interior passage and closet doors.
Interior Doors Nonresidential Interior Doors Nonresidential Interior Doors 2008 2012 Forecast Volume = 8.7 Million Units Volume = 7.9 Million Units
52%39%
6% 3%
54%36%
7% 3%
Steel
Aluminum
Wood Other
Steel
Aluminum
Wood Other
43%
30%
25%
2%
42%
30%
25%
3%
Wood
Aluminum
Steel
Other
Wood Aluminum
Steel
Other
NONRESIDENTIAL

2008/2009 U.S. National Statistical Review and Forecast
11
Door Shipments and Forecast Weak residential new construction starts in 2008 had a major impact on the residential entry door market and are expected to continue to have a significant impact in 2009. The residential replacement and remodeling market also experienced a decline in 2008, though to a lesser extent than new construction. Unit volume decreased by 18.1 percent to 10.4 million entry door units in 2008. Residential interior and passage doors also showed a decline of 20.9 percent over the past year. Entry and interior doors are expected to decline by approximately 16 and 22 percent respectively in 2009. Nonresidential door volumes have begun to experience a slight decline, decreasing by approximately one percent over 2007 for interior doors. A weakening of nonresidential activity is expected to slow door demand through 2011.
Shipments of Doors by Material and Application 2003– 2012F
(Millions of Units)
Residential Entry* 2003 2004 2005 2006 2007 2008 2009F 2010F 2011F 2012F
Steel 9.9 10.0 10.0 9.4 7.9 6.3 5.1 5.6 6.1 6.4Wood 2.0 2.0 1.7 1.6 1.4 1.2 1.1 1.2 1.3 1.3Fiberglass 1.9 2.5 3.5 3.7 3.4 2.9 2.4 2.7 3.0 3.3Subtotal 13.8 14.5 15.2 14.7 12.7 10.4 8.6 9.5 10.4 11.0
Residential Interior** 2003 2004 2005 2006 2007 2008 2009F 2010F 2011F 2012F
Wood 57.9 61.7 65.5 63.0 54.7 43.4 32.8 39.2 46.7 52.0Other 2.6 2.6 2.0 1.9 1.7 1.2 1.0 1.2 1.4 1.6Subtotal 60.5 64.3 67.5 64.9 56.4 44.6 33.8 40.4 48.1 53.6
Nonresidential Entry 2003 2004 2005 2006 2007 2008 2009F 2010F 2011F 2012F
Steel 1.7 1.8 1.7 1.8 1.8 1.7 1.6 1.5 1.5 1.6Aluminum 1.1 1.2 1.3 1.3 1.3 1.3 1.1 1.0 1.0 1.0Wood 0.2 0.2 0.2 0.2 0.2 0.2 0.2 0.2 0.2 0.2Other 0.1 0.1 0.1 0.1 0.1 0.1 0.1 0.1 0.1 0.1Subtotal 3.1 3.2 3.3 3.4 3.4 3.3 3.0 2.8 2.8 2.9
Nonresidential Interior** 2003 2004 2005 2006 2007 2008 2009F 2010F 2011F 2012F
Steel 2.2 2.3 2.5 2.7 2.7 2.6 2.4 2.2 2.3 2.4Aluminum 1.9 1.7 2.2 2.2 2.2 2.2 2.0 1.9 1.9 2.0Wood 2.9 3.2 3.3 3.4 3.7 3.7 3.3 3.2 3.2 3.3Other 0.6 0.6 0.2 0.2 0.2 0.2 0.2 0.2 0.2 0.2Subtotal 7.6 7.8 8.2 8.5 8.8 8.7 7.9 7.5 7.6 7.9
Source: Ducker Research Company, Inc *Excludes patio-designated units. **Interior door volume includes both passage and closet/bifold. Volume is counted by individual leaf, thus a single bifold
door includes 2 units while a double bifold includes 4 units
RESIDENTIAL/NONRESIDENTIAL

2008/2009 U.S. National Statistical Review and Forecast
12
Insulating Glass Usage The use of sealed insulating glass is a standard offering in residential and nonresidential window units with the exception of parts of southern Florida and other regions in the Southwestern U.S. No significant changes in the overall market penetration were seen in either the residential or the nonresidential market over the past year, but share shift continues in the types of spacer products used. Additionally, continued penetration of insulating glass is not expected going forward, but edge seal technologies continue to change to meet higher energy efficiency standards. The use of triple glazing is also expected to continue to grow. Within the residential market, non-rigid warm edge spacers continue to gain share against aluminum, as well as rigid warm edge products. The nonresidential market continues to use primarily aluminum spacers, but the use of warm edge products within this market is growing.
Insulating Glass Historical Penetration
2003 2004 2005 2006 2007
Residential 93% 94% 94% 94% 95%
Nonresidential 88% 88% 88% 88% 89%
Insulating Glass Forecast Penetration
2008 2009F 2010F 2011F 2012F
Residential 95% 95% 95% 95% 95%
Nonresidential 89% 89% 89% 89% 89%
Residential Insulating Glass Penetration Nonresidential Insulating Glass Penetration (Percent of Total Market) (Percent of Total Market)
0%
25%
50%
75%
100%
1998 2003 2008
Insulating Other
0%
25%
50%
75%
100%
1998 2003 2008
Insulating Other
RESIDENTIAL/NONRESIDENTIAL
2008/2009 U.S. National Statistical Review and Forecast
13
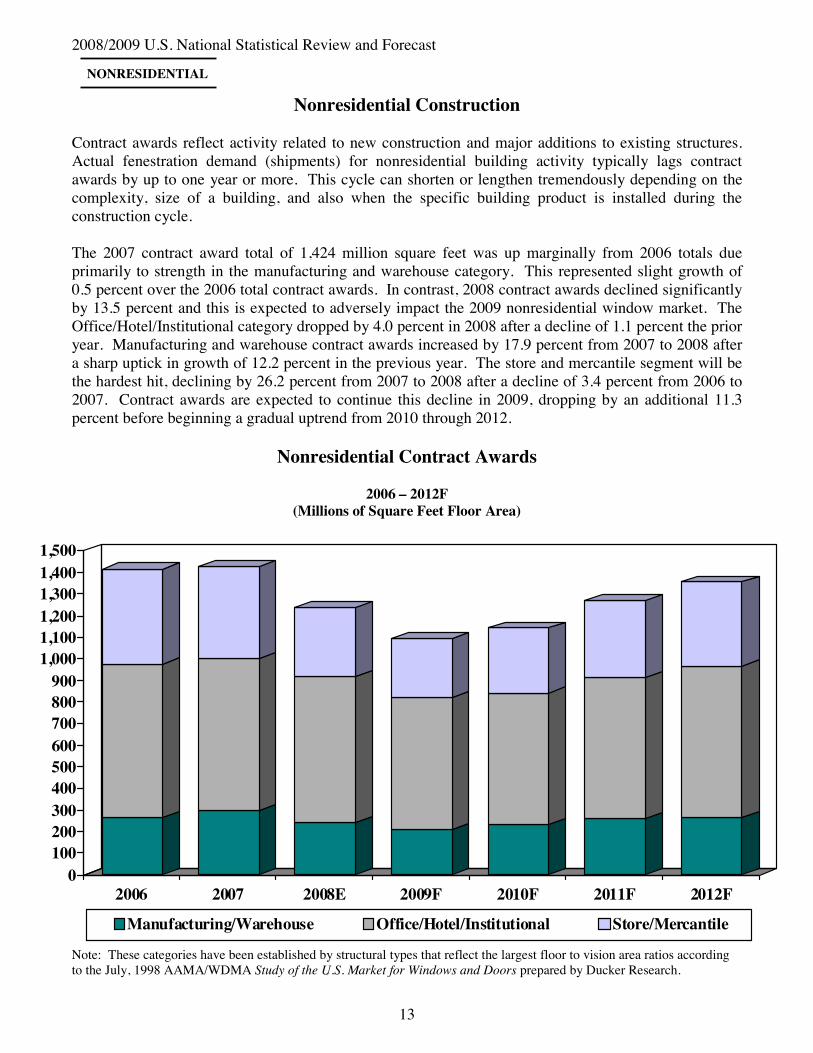
Nonresidential Construction Contract awards reflect activity related to new construction and major additions to existing structures. Actual fenestration demand (shipments) for nonresidential building activity typically lags contract awards by up to one year or more. This cycle can shorten or lengthen tremendously depending on the complexity, size of a building, and also when the specific building product is installed during the construction cycle. The 2007 contract award total of 1,424 million square feet was up marginally from 2006 totals due primarily to strength in the manufacturing and warehouse category. This represented slight growth of 0.5 percent over the 2006 total contract awards. In contrast, 2008 contract awards declined significantly by 13.5 percent and this is expected to adversely impact the 2009 nonresidential window market. The Office/Hotel/Institutional category dropped by 4.0 percent in 2008 after a decline of 1.1 percent the prior year. Manufacturing and warehouse contract awards increased by 17.9 percent from 2007 to 2008 after a sharp uptick in growth of 12.2 percent in the previous year. The store and mercantile segment will be the hardest hit, declining by 26.2 percent from 2007 to 2008 after a decline of 3.4 percent from 2006 to 2007. Contract awards are expected to continue this decline in 2009, dropping by an additional 11.3 percent before beginning a gradual uptrend from 2010 through 2012.
Nonresidential Contract Awards
2006 – 2012F (Millions of Square Feet Floor Area)
Note: These categories have been established by structural types that reflect the largest floor to vision area ratios according to the July, 1998 AAMA/WDMA Study of the U.S. Market for Windows and Doors prepared by Ducker Research.
0100200300400500600700800900
1,0001,1001,2001,3001,4001,500
2006 2007 2008E 2009F 2010F 2011F 2012F
Manufacturing/Warehouse Office/Hotel/Institutional Store/Mercantile
NONRESIDENTIAL

2008/2009 U.S. National Statistical Review and Forecast
14
2008 Nonresidential Contract Awards (Based on Millions of Square Feet Floor Area)
2012F Nonresidential Contract Awards (Based on Millions of Square Feet Floor Area)
Source: History: U.S. Bureau of the Census Forecast: Ducker Research Company, Inc.
47.5%19.2%
12.3%
21.0%
Midwest
South
West
Northeast
45.9%
23.1%
19.3%
11.7%
Midwest
South
West
Northeast
NONRESIDENTIAL

2008/2009 U.S. National Statistical Review and Forecast
15
Regional Nonresidential Construction
History and Forecast of Nonresidential Contract Awards By Selected Building Types and Region
2006 – 2012 Forecast (Millions of Square Feet Floor Area)
* Due to rounding, totals may not equal the sums of individual values
NONRESIDENTIAL
Manufacturing/Warehouse Northeast Midwest South West Total U.S.
2006 28 58 113 64 2632007 36 68 125 66 295
2008E 24 57 112 49 2422009F 25 47 92 44 2082010F 27 55 96 53 2312011F 31 58 109 59 2572012F 31 59 113 61 264
Office/Hotel/Institutional Northeast Midwest South West Total U.S.2006 89 142 311 169 7112007 73 140 327 162 703
2008E 89 125 329 132 6752009F 74 115 296 124 6092010F 70 113 296 129 6082011F 75 120 320 140 6562012F 80 128 338 153 700
Store/Mercantile Northeast Midwest South West Total U.S.2006 50 87 185 120 4422007 46 83 183 114 427
2008E 40 54 144 77 3152009F 34 51 122 69 2762010F 39 58 131 76 3042011F 44 68 155 88 3542012F 47 74 169 98 389
Total Nonresidential Northeast Midwest South West Total U.S.
2006 167 287 609 353 1,4162007 155 291 635 343 1,424
2008E 152 236 585 259 1,2322009F 133 213 509 237 1,0932010F 136 226 523 259 1,1432011F 150 246 584 287 1,2672012F 158 261 621 312 1,352

2008/2009 U.S. National Statistical Review and Forecast
16
Window Usage in Nonresidential Construction The nonresidential glazing continued growing in 2008, largely due to the continued growth of the curtainwall category. The overall market reached 542 million square feet, representing a growth of 1.2 percent over the 2007 total market of 536 million square feet. Curtainwall products grew by 18 percent, while storefront and other site fabricated products declined by 4.4 and 4.2 percent respectively. Shop fabricated windows grew by 2 percent during this time period. Looking forward, the market is forecast to decline by more than previously expected due to the sharp drop in nonresidential contract awards. The overall market is projected to decline by 15 percent in 2009 over 2008 levels. An additional decline of 12.7 percent is also projected for 2010. Due to weakness in office and particularly retail construction, storefront and site fabricated products are forecast to decline by 18.3 and 18.0 percent in 2009. Curtainwall is also set to decline by 16.5 percent after several consecutive years of double digit growth. Shop fabricated, or true architectural, windows are projected to decline by the smallest margin of 5 percent as institutional categories, such as schools and public buildings, are expected to remain the most resilient during the downturn. Growth is expected to resume in 2011 and is forecast to increase by 4.9 percent over 2010 levels. The market is forecast to show a more significant rebound in 2012, which is forecast to grow by 11.2 percent when compared to 2011.
Window Usage in Nonresidential Construction
New Construction and Major Additions* Replacement (Millions of Square Feet Vision Area) (Millions of Square Feet Vision Area)
*New construction and major additions also includes remodeling
NONRESIDENTIAL
0
20
40
60
80
100
120
2006 2007 2008 2009F 2010F 2011F 2012F
Site Fab WindowsShop Fab WindowsCurtain-wallStore Front
0
10
20
30
40
50
60
70
80
2006 2007 2008 2009F 2010F 2011F 2012F
Site Fab WindowsShop Fab WindowsCurtain-wallStore Front

2008/2009 U.S. National Statistical Review and Forecast
17
Window Usage in Nonresidential Buildings
2006-2012 Forecast
(Vision Area, Millions of Square Feet)
Site Fab Windows
Shop Fab Windows
Curtain-wall
Store Front Total
Site Fab Windows
Shop Fab Windows
Curtain-wall
Store Front Total
Site Fab Windows
Shop Fab Windows
Curtain-wall
Store Front Total
Northeast2006 21 12 15 20 68 7 21 2 9 39 28 32 18 29 1072007 21 12 17 20 71 7 22 3 9 40 28 34 20 29 1112008 19 12 19 18 68 6 21 3 8 38 25 33 22 25 106
2009F 18 13 18 16 64 6 22 3 7 38 24 35 21 23 1022010F 15 12 15 14 55 5 20 2 6 34 20 32 17 20 892011F 16 11 15 14 57 5 20 3 6 34 21 31 18 21 902012F 18 12 18 16 63 6 21 3 7 37 23 33 20 23 100
Midwest2006 21 11 14 22 67 7 19 2 9 37 28 29 16 31 1042007 21 11 15 21 68 7 20 3 9 38 28 31 18 30 1072008 20 12 18 20 70 7 20 3 9 38 27 32 21 29 108
2009F 15 10 14 15 55 5 17 2 7 31 20 27 16 22 862010F 14 10 12 13 48 4 17 2 6 29 18 26 14 19 772011F 15 10 13 15 52 5 17 2 6 30 19 26 15 21 822012F 16 10 15 16 57 5 17 2 7 32 21 28 17 23 89South2006 44 10 27 46 127 14 19 4 20 56 58 29 31 65 1832007 45 11 31 46 133 14 20 5 20 60 59 31 36 66 1932008 45 12 38 46 141 15 21 6 20 63 60 34 44 66 204
2009F 39 12 34 40 125 13 21 5 18 57 52 33 39 57 1822010F 33 11 28 34 106 11 20 4 15 50 44 31 32 49 1552011F 35 11 29 36 110 11 19 5 16 50 46 30 34 51 1612012F 39 12 34 40 124 13 20 5 18 56 52 32 39 58 181West2006 29 5 19 27 79 9 8 3 11 32 38 13 22 38 1112007 32 5 23 29 90 10 9 4 13 36 42 15 27 42 1262008 30 5 27 27 89 10 9 4 12 36 39 15 31 39 125
2009F 21 4 19 19 64 7 8 3 9 26 28 12 23 28 912010F 19 4 17 17 57 6 7 3 8 24 25 12 19 25 812011F 21 4 19 19 63 7 8 3 8 26 28 12 22 28 892012F 24 5 21 21 71 8 8 3 10 29 31 13 25 31 100Total2006 115 37 75 114 341 37 66 12 49 164 153 103 86 163 5052007 119 40 86 116 361 38 71 15 51 174 158 111 100 167 5362008 114 41 102 111 367 37 72 17 49 175 151 113 118 160 542
2009F 94 39 85 91 308 30 68 14 40 152 124 107 99 131 4612010F 81 37 71 78 266 26 64 12 35 136 106 101 82 113 4022011F 86 36 76 84 282 28 62 12 37 140 114 98 89 121 4222012F 97 38 87 94 316 31 67 14 41 154 128 105 101 135 469
Region/ Year
New Construction and Major Additions* Replacement Total
* Remodeling activity within nonresidential windows is nearly always represented as a major addition to an existing structure ** Due to rounding, totals may not equal the sums of individual values
NONRESIDENTIAL

2008/2009 U.S. National Statistical Review and Forecast
18
Geographic Division of the United States
In various sections of the U.S. National Statistical Review and Forecast, reference is made to U.S. Census Regions. These regions are illustrated on the map below.
WestMidwest
South
Northeast
Copyright © 2009 Co-published by:
Researched and edited in March 2009 by: Ducker Worldwide, LLC 1250 Maplelawn Dr. Troy, MI 48084 (248) 644-0086 www.ducker.com
American Architectural Manufacturers Association (AAMA) 1827 Walden Office Square, Suite 550 Schaumburg, Illinois 60173 Tel: (847) 303-5664/Fax: (847) 303-5774 www.aamanet.org
Window & Door Manufacturers Association (WDMA) 401North Michigan Avenue Chicago,, Illinois 60611 Tel: (312) 321-6802 www.wdma.com