Embed Size (px)
Citation preview

Aalborg Universitet
Papers, volume 5 - 1997-2000
Thoft-Christensen, Palle
Publication date:2006
Document VersionPublisher's PDF, also known as Version of record
Link to publication from Aalborg University
Citation for published version (APA):Thoft-Christensen, P. (2006). Papers, volume 5 - 1997-2000. Aalborg: Aalborg Universitetsforlag.
General rightsCopyright and moral rights for the publications made accessible in the public portal are retained by the authors and/or other copyright ownersand it is a condition of accessing publications that users recognise and abide by the legal requirements associated with these rights.
? Users may download and print one copy of any publication from the public portal for the purpose of private study or research. ? You may not further distribute the material or use it for any profit-making activity or commercial gain ? You may freely distribute the URL identifying the publication in the public portal ?
Take down policyIf you believe that this document breaches copyright please contact us at [email protected] providing details, and we will remove access tothe work immediately and investigate your claim.
Downloaded from vbn.aau.dk on: juli 09, 2018

Chapter 87
CHAPTER 87
REVIEW OF INDUSTRIAL APPLICATIONS OF STRUCTURAL RELIABILITY THEORY 1
P. Thoft-Christensen
University of Aalborg, Aalborg, Denmark.
1. INTRODUCTION For the last two decades we have seen an increasing interest in applying structural reliability theory to many different industries. However, the number of real practical applications is much smaller than what one would expect.
At the beginning most applications were in the design/analysis area especially for high-risk structures as used in the offshore and nuclear area. In many countries code calibration has been performed on a probabilistic basis. The newest example is the new EUROCODE. A relatively new and very promising area for application is probabilistically based management systems for inspection and repair of structures, and for justification of the lifetime extension of structures.
2. ESReDA WORKING GROUP In May 1995 ESReDA established a Working Group on Industrial Application of Structural Reliability Theory.
The aims and scope of the working group are: • to promote industrial application of structural reliability theory in Europe, • to advance European cooperation in the field of industrial application of structural
reliability theory, • to stimulate research and development of industrial application of structural
reliability theory,
1 Proceedings ESRA 1997, Takamatsu, Kagawa, Japan, November 21-23, 1997. Kagawa University, Japan, 1998, pp. 27-36.
1087

Chapter 87
• to further the dissemination and exchange of information on industrial application of structural reliability theory.
Members of the working group come from several industries, like: • Nuclear and fossil power plants (pipes, pressure tanks, etc.). • Offshore structures (platforms, pipes, installations, etc.). • Onshore structures (tall buildings, bridges, towers, chimneys, harbors, etc.). • Aerospace industry (aeroplanes, space ships, etc.). • Transportation (trains, ships, cars, etc.). • Military installations (submarines, aircrafts, tanks, etc.). • Chemical and petrochemical installations (pipes, structures, etc.).
A large number of practical applications are discussed by the working group: • Reliability based design of structures and structural elements. • Code calibration. • Updating reliability of existing old structures. • Reliability based inspection and maintenance strategies. • Reliability under construction and transportation. • Risk based inspection.
3.WORKING GROUP REPORT The Working Group published a report in October 1997; see figure 1.
This paper is mainly based on slightly modified extracts from the Working Group
report; see Thoft-Christensen [1]. 4. WORKING GROUP SEMINAR In October 1997, the Working Group organised a seminar on “Industrial Application of Structural Reliability Theory” in Paris, France. During the seminar 18 papers were presented within the following areas: • Bridges • Aerospace Structures • Nuclear Structures
Fig. 1. Working Group Report.
1088

Chapter 87
• Ships and Offshore Structures • Energy • Hydraulic Engineering Structures.
Fig. 2. Working Group Seminar 5. NUCLEAR INSTALLATIONS This section is based on a paper by Chapman, Pitner & Persoz [2] where five applications of structural reliability in the nuclear industry are presented: • Probability of Failure and Fatigue Life Monitoring for Life Extension • Maintenance Optimization and Life Prediction of Steam Generator Tube Bundle • ISI (In-Service Inspection) as a Confidence Builder • Integrity Analyses of Reactor Pressure Vessel subjected to Transient Conditions • Risk Based In-Service Inspection
Probabilistically based structural integrity analysis has been used for many years in the nuclear industry. It started as early as 1980-81 with the computer code PRAISE (Piping Reliability Analysis Including Seismic Events) developed by the United States Nuclear Regulatory Commission. Later it was expanded to include stress corrosion cracking initiation and growth to failure. Since then more similar codes have been developed.
The basic principle in these codes is to use the deterministic equations but to apply statistical distributions to uncertain quantities. Thereby, instead of giving a single yes or no statement to any given failure criterion (the deterministic approach), the probabilistic approach provides a probability of that criteria being met.
Probability of Failure and Fatigue Life Monitoring for Life Extension: In-service monitoring of transients may in certain cases be used to remove uncertainties related to operation of nuclear plants. From a safety standpoint this will provide a high level of coincidence that no unknown could give rise to possible failure. This knowledge means that a more accurate assessment of the so-called true ASME fatigue usage factor can be made.
In-service monitoring combined with service inspection is also of great
1089
Chapter 87
importance in questions like life extension of a nuclear plant.
Maintenance Optimization and Life Prediction of Steam Generator Tube Bundle: A serious problem for steam generators (SG) in pressurised water reactors (PWR) is degradation of their tubes. The main causes are corrosion and defect mechanical mechanisms. Therefore, there is a need for a very high degree of reliability. In-service inspections are used as a means of detecting and tracking defects before they reach a critical size.
Fig. 3. Schematic diagram of steps in analysis of reliability of PRAISE code.
Taken from Chapman, Pitner & Persoz [2]. Two main objectives are ascribed to SG tube maintenance:
• From the standpoint of safety, keeping the probability of a tube rupture at a very low level imposed by the design rules.
• From the standpoint of availability, limiting the number of shutdowns caused by primary-to-secondary leakages in excess of specifications.
In Chapman, Pitner & Persoz [2] two significant advantages using probabilistic fracture mechanics to assess the risk of failure of a tube are mentioned: • All factors of influence can be taken into account as random variables, rather than
using pessimistic, conservative, assumptions. • The influence of maintenance and inspection on risk of failure can be quantified.
1090

Chapter 87
Fig. 4. Relative influence of the sample size on the risk of tube rupture. Taken from
Chapman, Pitner & Persoz [2].
In Chapman, Pitner & Persoz [2] a number of interesting issues are investigated. Two will be mentioned here. Figure 4 shows the evolution of risks estimated for normal operating conditions with different random sample percentages. Note the small difference between inspection of one tube in eight (12.5%) and in one tube in two (50%). However, a 100% inspection is very effective at detecting and plugging large critical flaws. Figure 5 shows the degree of conservatism in the evaluation of the safety level when worst case values (deterministic approach) are used for the key parameters of the failure analysis.
Fig. 5. Relative benefit of the probabilistic approach applied to an evaluation of critical crack size for normal operating conditions. Taken from Chapman, Pitner & Persoz [2].
ISI as a Confidence Builder: In-Service Inspection (ISI) is an essential way of demonstrating that an operating plant is safe. Chapman, Pitner & Persoz [2] presents a probability of failure model which accepts that input parameters are not precisely defined. In the model these dates are considered unknown and the object of the ISI data is to obtain information about them.
Integrity Analyses of Reactor Pressure Vessel subjected to Transient Conditions: The reactor pressure vessel is of major importance for the safety of a PWR nuclear plant. Therefore, the integrity of this structure must be guaranteed, even in the case of the most severe accidents. Further its mechanical state can be decisive for the lifetime of the plant. The vessel wall is one of the most affected zones by embrittlement due to
1091

Chapter 87
neutron radiation damage. In Chapman, Pitner & Persoz [2] a probabilistic fracture mechanics model is described which can be used to: • estimate the likelihood of vessel failure and perform sensitivity studies, • identify the relative influence of key input parameters, • assess the effect of conservatism introduced in deterministic analysis, • help to define acceptability in-service criteria.
Risk Based In-Service Inspection. In Chapman, Pitner & Persoz [2] the application of software for structural reliability risk assessment developed by Rolls-Royce & Associated Ltd., UK is described. As an example the application on vessel welds is shown in figure 6. The probability of failure per year of a vessel is approximately 2.2*10-8 and is dominated by a circumferential weld. However, including the smaller details of the condensate increase this very low probability of failure to 2.5*10-6. The results of these assessments show that the probability of failure depends significantly on the vessel details.
Fig. 6. Evaluation of the probability of failure for vessel welds. Taken from Chapman, Pitner & Persoz [2].
6. OFFSHORE - PIPELINE FREE SPAN DESIGN This section is based on Hagen & Mørk [3]. Offshore subsea pipelines are often installed in areas of irregular seabed topography and in deep water. Therefore, free spans in such pipeline systems may occur and submarine currents or wave induced flow velocities may cause significant dynamic excitation of the free span sections. Further, amplified response due to resonant fluid-structure interaction may cause fatigue damage.
1092

Chapter 87
In 1994 the joint industry R&D MULTISPAN project was established by a number of companies and institutions to provide rational criteria for free spans. Appropriate target safety levels are fundamental to the process of developing new design criteria through the application of reliability methods. In the DNV design rules from 1996 the target safety levels shown in table 1 are recommended.
Table 1. Recommended target safety levels in DNV’96. Taken from Hagen & Mørk [3].
In the DNV’96 rules for submarine pipeline systems new safety classes are
defined by: • Low Safety Class, where failure implies no risk of human injury and minor
environmental and economic consequences. • Normal Safety Class, i.e. normal classification. • High Safety Class, where failure implies risk of human injury, significant
environmental pollution or very high economic or political consequences. A detailed presentation of a reliability based calibration study is given in Hagen
& Mørk [3]. One result of the calibration study is shown in figure 7. The five lines in figure 7 correspond to five design cases for the annual extreme current distribution and, the stars indicate proposed safety factors for annual probability of failure for the three safety classes.
Fig. 7. Onset criteria for cross-flow VIV. Calibration study for base case. Taken from Hagen & Mørk [3].
1093

Chapter 87
In Hagen & Mørk [3] significant cross-flow vortex induced vibrations are defined
as maximum oscillation amplitudes larger than 0.1D, where D is the diameter of the pipe. For the steady current case the cross-flow no-vibration criterion is given as:
uRDTonsetR
cnc DV
Uf ΨΨΨ≥ γ
,
,,0
where γ T is a safety factor given in table 2 and where the other quantities are defined in Hagen & Mørk [3].
Safety Class Low Normal High Temporary In-service In service γ T 1.7 2.0 2.3
Table 2. Recommended safety factors. Hagen & Mørk [3]. The work presented above is presently being extended to cover fatigue analysis
and onset-criteria for combined wave and current induced loads for unevenness induced and scour induced free spans. 7. OFFSHORE: REQUALIFICATION OF JACKET STRUCTURES This section is based on Sigurdsson, Cramer & Hagen [4]. The objective of a requalification is to establish: • that the structure is fit for its intended purpose over the residual service life, • that the consequences in terms of risk to human life, to the environment and to the
assets, in the event of structural failure, are acceptable from both a reliability and an economical point of view.
Some typical initiators for requalification are mentioned in Sigurdsson, Cramer & Hagen [4]: • repair of damage or excessive deterioration, • extension of service life, • new rules and regulations, • new load and strength models, • new analysis and calculation methods, • significant changes in the consequence of failure, • discovery of design or construction errors, • doubts about the safety of the structure/facility for any
other reasons, • detailed planning of I&M.
Fig. 8. Offshore jacket structure. Taken from Sigurdsson, Cramer & Hagen [4].
The requalification procedure presented in reference (4) is illustrated for the jacket structure shown in figure 8. The jacket was designed in the sixties on the basis of
1094

Chapter 87
data, which have been changed later. In reference (4) five requalification alternatives are defined. In brief, alternatives 1-4 are different modifications of the structure to reduce the loading and, except for alternative 3, demanning of the platform. Alternative 5 is platform elimination of the structure and replacing it by an underwater connection of the pipelines passing the platform.
The probabilities of collapse, damage and no-failure are shown in table 3 for all five alternatives.
Table 3. Annual occurrence probabilities for the five selected alternatives.
Taken from Sigurdsson, Cramer & Hagen [4].
The corresponding decision problem is formulated in detail in Sigurdsson, Cramer & Hagen [4]. Based on three attributes: Net profit, safety, and reputation and the corresponding utility functions, the conclusion is that alternative 5 should be chosen since this alternative has the largest estimate for its utility. 8. CONCRETE BRIDGES This section is based on Thoft-Christensen & Middleton [5].
Throughout the world, highway authorities are faced with the task of assessing the strength and safety of their existing bridges. There is a need for increasing the load limit for road bridges and it is a fact that thousands of bridges have deteriorated significantly. It is recognized in many countries that the management of the bridge stock would require knowledge of the overall condition of bridges.
Several highway authorities have identified the potential for applying reliability based methods for assessing existing bridges. One study is the development of reliability based codes of practice for the structural analysis of concrete bridges. The goal is to develop a methodology with which a typical short span concrete bridge could be realistically assessed, taking into account the age of the structure and different levels of deterioration. For concrete bridges the primary mechanism of deterioration is corrosion of the steel reinforcement and hence appropriate models were needed to describe this process.
The aim is eventually to develop a risk based assessment procedure for concrete bridges in which satisfactory structures will be defined in terms of a certain (low) probability of failure. By considering the risk of failure at different load levels a simplified assessment code suitable for general use by the profession might then be derived. Clearly such a procedure will need extensive calibration before being adopted but it does hold out the prospect for a rationally based approach to bridge assessment. In particular this methodology should enable bridge managers to allocate resources more rationally on the basis of risk of failure.
Several models can be used to model the deterioration of reinforcement steel in concrete slabs. However, there is a general agreement that the model presented below is acceptable in most cases. Corrosion initiation period refers to the time during which the
1095

Chapter 87
passivation of steel is destroyed and the reinforcement starts to corrode actively. Practical experience of bridges in wetter countries like UK shows that chloride ingress is far bigger a problem than carbonation.
The rate of chloride penetration into concrete, as a function of depth from the concrete surface and time, can be represented by Fick's law of diffusion. When corrosion has started the diameter of the reinforcement bars is modelled by a linear function in time. An important aspect of corrosion in addition to the average corrosion is the maximum penetration (pitting of reinforcement). Pitting of reinforcement may have more influence on the reliability than the average deterioration due to localised much higher weakening of the reinforcement.
Fig. 9. Normalised reinforcement area A A/ 0 as a function of time for low, medium, and
high deterioration. Taken from Thoft-Christensen & Middleton [5].
In Thoft-Christensen & Middleton [5] three levels of deterioration are proposed: low deterioration, medium deterioration and high deterioration. In figure 9 the sample realisations of the history of the reinforcement area for deterioration models: low, medium, high are shown for a specific case.
A collapse (yield line) limit state is used. 7 different failure modes are considered, see figure 10.
Fig. 10. Failure modes for simply supported slab bridges. Taken from Thoft-Christensen & Middleton [5].
0 20 40 60 80 100 1200.4
0.6
0.8
1
Reinforcement area as function of time
Are
a [A
/A_0
]
[ High ]
0 20 40 60 80 100 1200.4
0.6
0.8
1
Are
a [A
/A_0
]
[ Medium ]
0 20 40 60 80 100 1200.4
0.6
0.8
1
Time [years]
Are
a [A
/A_0
]
[ Low ]
1096

Chapter 87
The following example is used to illustrate the applied methodology. The example is based on an existing UK bridge built in 1975.
Fig. 11. Bridge data. Taken from Thoft-Christensen & Middleton [5].
Based on the corrosion data for the high corrosion model the expected area of the reinforcement as a function of time can be calculated, see figure 12.
Fig. 12. Reinforcement area as a function of time. Taken from Thoft-Christensen & Middleton [5].
Fig. 13. Reliability profiles using a yield line limit state. Taken from Thoft-Christensen & Middleton [5].
0 20 40 60 80 100 1200.5
0.6
0.7
0.8
0.9
1
1.1
Years
E[A
(t)] /
E[A
(0)]
Expected reinforcement area
0 20 40 60 80 100 1200.8
0.9
1
1.1
[Yield line limit state: Normalised Reliability Index]
Bet
a/B
eta_
0
Years
0 20 40 60 80 100 1200
1
2
3x 10-25 [Yield line limit state: Probability of failure]
P_f
Years
1097

Chapter 87
The normalised reliability profile for the yield line ULS (full width failure) and
the corresponding probability of failure profile are shown in figure 13. The reliability
index at the time t = 0 is β0 =11.5. Due to the size of the concrete cover (mean value 60 mm) the deterioration does not have any effect until year 70.
Fig.14. Sensitivity analysis for yield line limit state at t = 0 and t = 120 years. Taken from Thoft-Christensen & Middleton [5].
The results from a sensitivity analysis with regard to the mean values are shown
for t = 0 years and t =120 years in figure 14. The most important variables are, as expected, the thickness of the slab, the yield strength of the reinforcement, and the model uncertainty. Observe that the sensitivity with regard to the cover changes from negative at the time t = 0 years to positive at the time t =120 years due to the corrosion. 9. LAUNCH VEHICLE PROPULSION SYSTEM This section is based on Gerez et al. [6]. The overall cost of a launch system consists of several factors such as the expected potential due to catastrophic failure, the manufacturing costs, and the operational costs. The potential for catastrophic failure can be evaluated by a probabilistic risk assessment.
In Gerez et al. [6] the risk evaluation methodologies traditionally used in the aerospace industry are discussed and demonstrated on the US Space Shuttle. Aerospace propulsion has traditionally been based on non-redundant systems. Any failure e.g. in one of the engines or in the support systems would result in either failure of the mission, or catastrophic loss of the vehicle, depending on the severity of the failure.
The traditional propulsion concept changed with the design of the NASA Space Shuttle. The main propulsion in the Space Shuttle is based on three thrust generation systems. However, the main difference between this new concept and earlier designs is that it can tolerate certain failures in the main subsystems and/or their support systems, without endangering mission or crew.
Traditional risk analysis was used in the early stages of the Shuttle project. Traditional risk analysis only gave a qualitative estimate of the risk of loss of mission and catastrophic loss of vehicle, and of the major single point failures in the propulsion system design. However, the Challenger accident made it clear that a quantitative risk analysis is needed. At that time Probabilistic Risk Assessment (PRA) was being extensively applied by the nuclear power industry to evaluate risk levels. The PRA
0 2 4 6 8 10 12 14 16-1
-0.8
-0.6
-0.4
-0.2
0
0.2
0.4
0.6
0.8
1
Stochastic variable
Ela
stic
ity
Yield line limit state: Sens. analysis [mean]
T = 0 years
0 2 4 6 8 10 12 14 16-1
-0.8
-0.6
-0.4
-0.2
0
0.2
0.4
0.6
0.8
1
Stochastic variableE
last
icity
Yield line limit state: Sens. analysis [mean]
T = 120 years
1098

Chapter 87
methodology is a scenario-based technique which characterises accident sequences in an event tree format. Therefore, implementing a similar general strategy, the aerospace industry began applying PRA techniques to manned space vehicles.
The primary objective of the Space Shuttle PRA was to support management and engineering decision-making with respect to the Shuttle programme by producing (see Gerez et al. [6]): • a quantitative probabilistic risk model of the Space Shuttle during flight, • a quantitative assessment of in-flight safety risk, • an identification and prioritisation of the features of design and operations that
principally contribute to in-flight safety risk, and • a mechanism for risk-based evaluation of proposed modifications to the Shuttle
system. In addition PRA analyses are innately tailored for the following applications (see
reference Gerez et al. [6]): • Estimate the frequency of different undesired consequences (mission failure,
catastrophic loss, delay in the program, etc.) for a complex system throughout its lifecycle (design, manufacture, operation, maintenance).
• Determine where the project teams should concentrate their efforts, i.e. what factors generate the overall risk to the system.
• Evaluate which alternatives for design, operation and maintenance represent the least risk to the system.
• Analyse whether a proposed modification reduces the cost-risk ratio sufficiently to justify implementation.
• Identify factors for which uncertainty is high and can be reduced by further tests or analyses.
These capabilities clearly show that PRA has certain advantages over traditional reliability and safety analysis techniques.
Fig. 15. LOV risk uncertainty distributions for the total shuttle mission.
Taken from Gerez et al. [6].
1099

Chapter 87
Using importance analyses, each system component’s contribution to the vehicle
loss frequency can be estimated. This can also be used to evaluate the risk reduction effectiveness of a proposed modification to components, equipment or subsystem of the Shuttle. Figure 15 shows the LOV (Loss Of Vehicle) risk uncertainty distributions for total Shuttle missions for each of the main subsystems (STS, Orbiter, SSME (Space Shuttle Main Engines), ISRB (Solid Rocket), ET (External Tank), and Landing). 10. HYDRAULIC STEEL STRUCTURES This section is based on van Manen et al. [7]. Application of structural reliability theory in the design and assessment of hydraulic engineering structures and flood defence works in the Netherlands was enhanced during the damming of the Eastern Scheldt. Advanced techniques to assess the structural reliability were used during the design stage as well as during construction of the Eastern Scheldt Storm Surge Barrier.
Fig.16. Storm surge barrier in the New Waterway near Rotterdam. Taken from van Manen et al. [7].
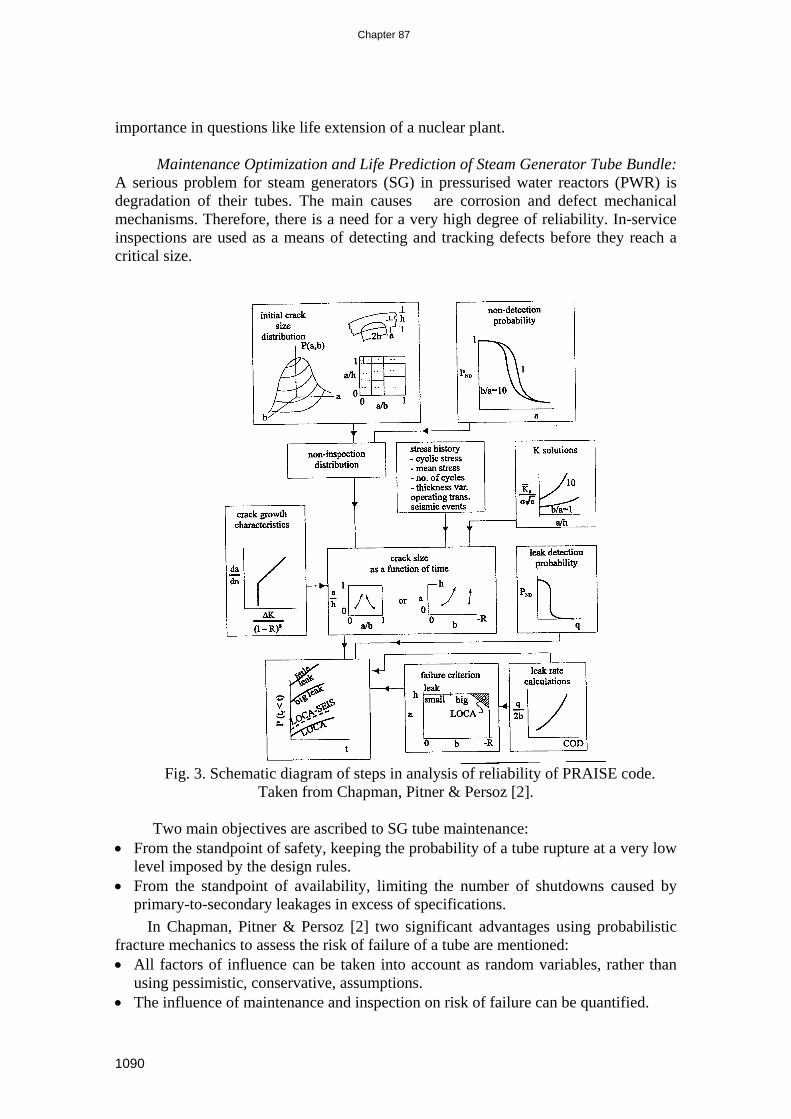
A target failure probability of 10-6 per year for the main event "failure of the
barrier" was chosen. The target failure probability was then split up into target reliabilitys for the different substructures by using the following equation
( ) ( )Φ Φ ∆- = - ,iss barrier ssβ β
Correlation between substructures is neglected. The value of ss ,i∆ has been defined by the structural engineer (designer) for each substructure and varies between zero and one. The sum of all ss ,i∆ should be less than or, at most, equal to one. A part of the adopted distribution is shown in Fig. 17.
1100
Chapter 87
Fig. 17. Distribution of failure probability to substructure and the design point approach
for some substructures. Taken from van Manen et al. [7].
For specific elements in the barrier non-linear finite element calculations were performed to investigate the ratio of the actual ultimate load capacity and the capacity according to the design code. The existing overcapacity in relation to the code for a specific limit state can be reduced by a modification of the partial safety factor by:
γγγ
expFEM-
codeM =
For the girders in the steel gate, physical and geometrical non-linear finite element calculations have been performed. In the calculations a load factor of 2.4 is achieved in relation to the basic loads on the model. The girder fails by shear failure of the web below a longitudinal stiffener. The admissible load factor according to the design code in relation to the basic loads on the model is e.g., 1.76. This gives an overcapacity of the structure in relation to the design loads of 2.4 / 1.76 = 1.36.
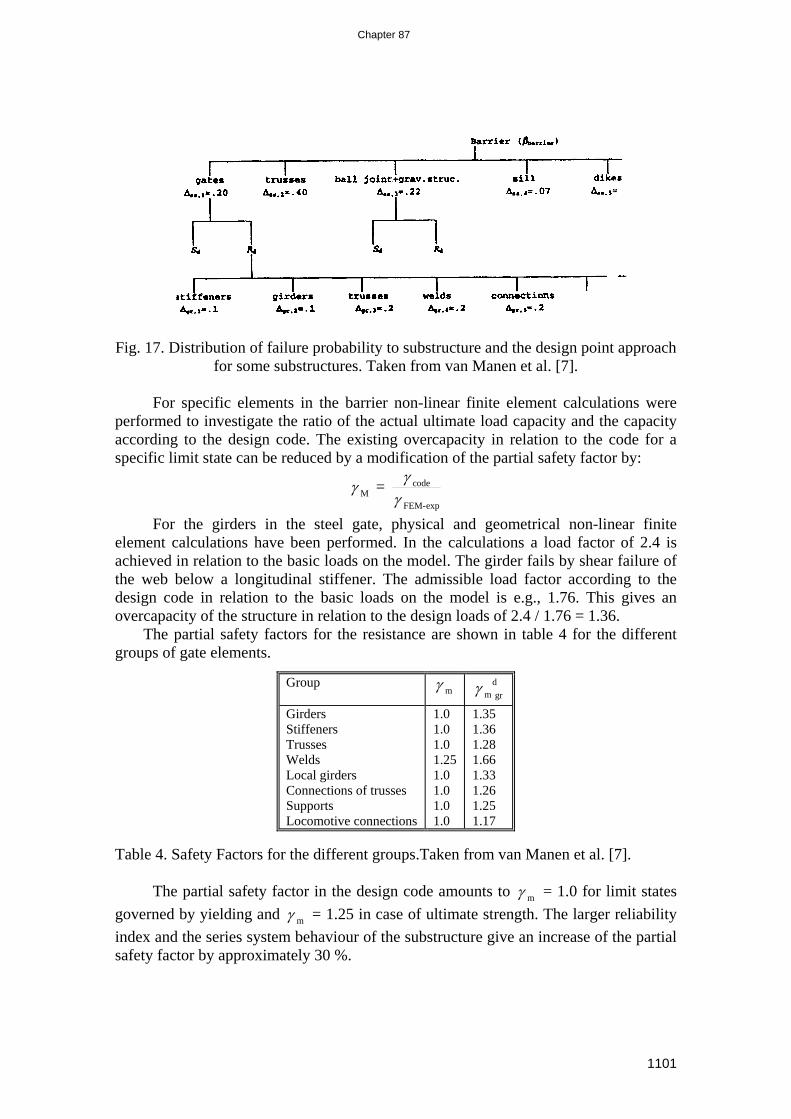
The partial safety factors for the resistance are shown in table 4 for the different groups of gate elements. Table 4. Safety Factors for the different groups.Taken from van Manen et al. [7].
The partial safety factor in the design code amounts to mγ = 1.0 for limit states governed by yielding and mγ = 1.25 in case of ultimate strength. The larger reliability index and the series system behaviour of the substructure give an increase of the partial safety factor by approximately 30 %.
Group mγ d
m grγ
Girders Stiffeners Trusses Welds Local girders Connections of trusses Supports Locomotive connections
1.0 1.0 1.0 1.25 1.0 1.0 1.0 1.0
1.35 1.36 1.28 1.66 1.33 1.26 1.25 1.17
1101

Chapter 87
11. DAMS This section is based on López-Hernández et al. [8]. Analysis of the reliability of dams is performed to quantify the frequency of possible failures of the dams. Risk analysis is performed to evaluate the potential consequences of risks. Failures are grouped according to type of dam, height and type of foundation and are analysed in terms of the source of the information, type of degradation, time of failure relative to the age of the dam, methods used to evaluate the damage and the corrective measures taken (see López-Hernández et al. [8]).
As mentioned the purpose of the reliability study of a dam is to perform a quantitative evaluation of dam safety in terms of failure probability expressed as failures/year. Therefore, the first step is to identify possible causes of dam failure. The required data include the type of dam, characteristics of the floodplain and terrain, and the existence or not of dams further upstream.
The next step is to quantify the possibility of occurrence. The global failure probability is obtained from the failure probability for each individual cause of failure: * Failures occurring as a result of hydrological action include dam top overspill,
erosion of the spillway and erosion of the dam downstream facing. * Failures occurring as a result of seismic activity include collapse due to earth
movement, high dynamic loads, soil liquefaction causing the structure fall over, displacement of embankments and the consequent water wave.
* Failures occurring as a result of inherent defects include failure of dam foundations, structure or abutments.
* Failure of a dam upstream may occur as a result of any of the aforementioned failures and will have an additional impact on the dam downstream.
The most commonly used approach is based on the collection of experimental data on dam behaviour, e.g. the ICOLD database. The failure is then analysed in terms of the source of the information, type of degradation, time of failure relative to the age of the dam, methods used to evaluate the damage and the corrective measures taken. This database was used to evaluate the failure probability of the dams discussed in this document.
Many factors must be taken into account in a probabilistic study of dams. Firstly, it can be stated that modern dams are safer than old ones. Next, the probability of failure is higher during construction and in the initial years after construction, when they are being filled for the first time. It then decreases and rises slightly at the end of the dams predictable life. Another important factor is the type of dam since the proportion of failure is higher in embankment dams than in concrete dams. The safety study should also take into account the level of technology of the country in question.
The following annual frequencies of failure were obtained for the three Spanish dams considered in López-Hernández et al. [8]:
Dam Annual Frequency of Failure Entrepeñas p = 2.09 x 10⁻⁶ incidents/year Buendía p = 2.16 x 10⁻⁶ incidents/year Bolarque p = 5.79 x 10⁻⁶ incidents/year
1102

Chapter 87
12. FATIGUE ASSESSMENT OF OFFSHORE STRUCTURE This section is based on Sigurdsson et al. [9]. In Sigurdsson et al. [9] an example of the fatigue assessment of an eight-legged North Sea jacket structure located at 107 m water depth is presented. The analysis is a level III reliability analysis, where the joint probability distribution of the uncertainty parameters is applied in the computation of the estimated fatigue failure probabilities.
A probabilistic S-N fatigue analysis is performed in Sigurdsson et al. [9] where the fatigue damage is calculated using the Miners sum and the S-N curve and the following limit state
g D D( , )∆ ∆= − where D is the damage accumulation and ∆ is the fatigue capacity.
The estimated fatigue reliability over the service life of the structure is shown in figure 18, applying transfer functions derived from both a dynamic and a quasi-static analysis. An importance factor analysis shows that the uncertainties related to the S-N curve and the estimation of the local stress response are the most important uncertainty contributions to the fatigue reliability assessment.
Fig. 18. Estimated S-N fatigue reliability of the critical joint as a function of the service
time. Taken from Sigurdsson et al. [9].
A probabilistic FM (Fracture Mechanics) fatigue analysis is also performed. The main advantage of using the FM fatigue model is that structural inspection results can be incorporated for updating the degree of fatigue damage accumulation. A 2-dimensional crack propagation model using Paris equation is used. The parameters describing the crack propagation were fitted on the basis of the application of the S-N approach.
In figure 19 the estimated fatigue reliability is shown as a function of time. For all inspections an MPI inspection technique is applied where no crack was detected.
1103

Chapter 87
Fig. 19. Estimated updated fatigue reliability having inspections with no crack
detection. Taken from Sigurdsson et al. [9]. 13. CONCLUSIONS In this paper it is shown that modern structural reliability theory is being successfully applied in a number of different industries: • the nuclear industry • design of offshore pipelines • requalification of offshore jackets • reliability assessment of concrete bridges • probabilistic risk assessment of launch vehicle propulsion systems • reliability assessment of hydraulic steel structures • safety assessment of dams • fatigue assessment of offshore structures.
The presentations of these applications are strongly based on chapters in reference [1]. More interesting applications can be seen in reference [1] and also in the proceedings of the ESReDA seminar on “Industrial Application of Structural Reliability Theory”, published in 1998 (see Thoft-Christensen [10]). Further applications can be found in the structural reliability literature. REFERENCES [1] Thoft-Christensen, P. (editor): Industrial Application of Structural Reliability
Theory. ESReDA Working Group Report, Aalborg University, Denmark, October 1997.
[2] Chapman, O.J.V., P.Pitner & M.Persoz: Probabilistic Structural Integrity in the Nuclear Industry. Chapter 2.1 in reference [1], 1997.
[3] Hagen, Ø. & K.Mørk: Offshore Application Code Calibration - Pipeline Free Span Design. Chapter 3.1 in reference [1], 1997.
1104

Chapter 87
[4] Sigurdsson, G., E.H.Cramer & Ø.Hagen: Offshore Application: Requalification of Offshore Structures. Chapter 3.2 in reference [1], 1997.
[5] Thoft-Christensen, P. & C.R. Middleton: Reliability Assessment of Concrete Bridges. Chapter 4.1 in reference [1], 1997.
[6] Gerez, L., A. Moreno González & G.Maggio: Risk-Based Evaluation of Launch Vehicle Propulsion System Designs. Chapter 5.2 in reference [1], 1997.
[7] van Manen, S.E., A.C. Vrouwenvelder & R.J. van Foeken: Probabilistic Design of the Steel Structure of the New Waterway Storm Surge Barrier. Chapter 6.1 in reference [1], 1997.
[8] López-Hernández, A., E. Salete Diaz & A. Moreno González: Reliability Study of Three Spanish Dams. Chapter 6.2 in reference [1], 1997.
[9] Sigurdsson, G., E.H.Cramer & I.Lotsberg. Fatigue Assessment of Structures. Chapter 7.2 in reference [1], 1997.
[10] Thoft-Christensen, P. (editor): Industrial Application of Structural Reliability Theory. ESReDA Working Group Report, Det Norske Veritas, Norway, 1998.
1105

Chapter 87
1106