Embed Size (px)
Citation preview

Aalborg Universitet
Binary Masking & Speech Intelligibility
Boldt, Jesper Bünsow
Publication date:2010
Document VersionEarly version, also known as pre-print
Link to publication from Aalborg University
Citation for published version (APA):Boldt, J. (2010). Binary Masking & Speech Intelligibility. Institut for Elektroniske Systemer, Aalborg Universitet.
General rightsCopyright and moral rights for the publications made accessible in the public portal are retained by the authors and/or other copyright ownersand it is a condition of accessing publications that users recognise and abide by the legal requirements associated with these rights.
? Users may download and print one copy of any publication from the public portal for the purpose of private study or research. ? You may not further distribute the material or use it for any profit-making activity or commercial gain ? You may freely distribute the URL identifying the publication in the public portal ?
Take down policyIf you believe that this document breaches copyright please contact us at [email protected] providing details, and we will remove access tothe work immediately and investigate your claim.
Downloaded from vbn.aau.dk on: marts 25, 2018

Binary Masking&
Speech Intelligibility
Ph.D. Thesis
JESPER BÜNSOW BOLDT
January, 2011
Department of Electronic SystemsAalborg UniversityFredrik Bajers Vej 7
9220 Aalborg Ø, Denmark

Boldt, Jesper BünsowBinary masking & Speech Intelligibility
ISBN 978-87-92328-50-2
Copyright c©2010 Jesper Bünsow Boldt, except where otherwise stated.All rights reserved.
Department of Electronic SystemsAalborg UniversityFredrik Bajers Vej 7DK-9220 Aalborg ØDenmark
This thesis was written in LATEX.

Abstract
The purpose of this thesis is to examine how binary masking can be used to increase in-telligibility in situations where hearing impaired listeners have difficulties understandingwhat is being said. The major part of the experiments carried out in this thesis can becategorized as either experiments under ideal conditions or as experiments under morerealistic conditions useful for real-life applications such as hearing aids. In the experi-ments under ideal conditions, the previously defined ideal binary mask is evaluated usinghearing impaired listeners, and a novel binary mask – the target binary mask – is intro-duced. The target binary mask shows the same substantial increase in intelligibility asthe ideal binary mask and is proposed as a new reference for binary masking. In the cat-egory of real-life applications, two new methods are proposed: a method for estimationof the ideal binary mask using a directional system and a method for correcting errors inthe target binary mask. The last part of the thesis proposes a new method for objectiveevaluation of speech intelligibility.
This thesis consists of an introduction followed by a collection of papers. The intro-duction begins with a description of the problem facing a hearing impaired person indifficult listening situations, which is followed by a general introduction to hearing im-pairment and hearing aids. After this outline, the concept of binary masking is introducedthrough descriptions of different reference masks (oracle masks), as well as methods forestimation and application of binary masks and comparison to the well-known Wiener fil-ter. Finally, the difference between speech intelligibility and speech quality is considered,and methods for evaluation of speech intelligibility are discussed.
The collection of papers is the main part of the thesis. The first three papers (A–C)evaluate the intelligibility of speech in noise under ideal conditions using the ideal binarymask and the target binary mask. The results presented in the first three papers showthe value of the ideal binary mask and the target binary mask for both hearing impairedlisteners and normal hearing listeners. Consequently, methods for estimation and error-correction of the ideal binary masks and target binary mask are proposed in Paper D andE. Finally, Paper F proposes a simple method for measuring the intelligibility of binarymasked noisy speech.
i

ii

Abstract (in Danish)
I denne afhandling undersøges, hvordan binære masker kan bruges til øge taleforståe-ligheden i situationer, hvor hørehæmmede har problemer med at forstå, hvad der bliversagt. Størstedelen af arbejdet kan kategoriseres som enten lytteforsøg under ideellebetingelser eller som algoritmeudvikling til brug i f.eks. hørerapparater. I lytteforsø-gene bliver den ideelle binære mask evalueret med hørehæmmede testpersoner og en nybinær maske bliver defineret. Denne nye binære maske giver de samme forbedringer påtaleforståelighed, som den ideelle binære maske og kan derfor ses som en ny referenceindenfor binære masker. Under mere realistiske betingelser bliver to nye algoritmer in-denfor binære masker evalueret. Den ene algoritme kan bruges til at estimere den ideellebinære maske med to mikrofoner, og den anden kan bruge til at rette fejl i den binæremaske. Den sidste del af afhandlingen omhandler en metode til at beregne taleforståe-lighed vha. en simpel algoritme og uden brug af testpersoner.
Afhandlingen består af en introduktion og en samling af artikler. Introduktion beskri-ver de problemer, som en hørehæmmet person oplever i vanskelige lydmiljøer og giver engenerel introduktion til høretab og hørerapparater. Derefter bliver brugen af forskelligebinære masker beskrevet og metoder til at beregne og bruge dem bliver gennemgået. Ensammenligning med det klassiske Wiener-filter er også udført. Til sidst i introduktionener forskellen mellem taleforståelighed og lydkvalitet beskrevet og forskellige metoder tilat måle taleforståelighed er gennemgået.
Samlingen af artikler udgør hovedparten af denne afhandling. De første tre artikler(A-C) måler forståeligheden af tale i støj, når den ideelle binære mask og den nye binæremaske bruges til at separere talen fra støjen. Resultaterne viser, at de binære masker erbrugbare for både normalt hørende og hørehæmmede personer, og det er derfor relevantat forsøge at beregne dem under mere realistiske situationer (artikel D) og rette fejl i debinære masker (artikel E). Den sidste artikel beskriver en simpel måde til at beregne denopnåede taleforståelighed, når de binære masker bruges til at separere tale fra støj.
iii

iv

List of Papers
The main body of this thesis consists of the following papers:
[A] D. Wang, U. Kjems, M. S. Pedersen, J. B. Boldt, and T. Lunner, "Speech Intelligibilityin Background Noise with Ideal Binary Time-Frequency Masking", in Journal of theAcoustical Society of America, vol. 125, no. 4, pp. 2336–2347, 2009.
[B] D. Wang, U. Kjems, M. S. Pedersen, J. B. Boldt, and T. Lunner, "Speech Perception ofNoise with Binary Gains", in Journal of the Acoustical Society of America, vol. 124, no.4, pp. 2303–2307, 2008.
[C] U. Kjems, J. B. Boldt, M. S. Pedersen, T. Lunner, D. Wang, "Role of Mask Patternin Intelligibility of Ideal Binary-Masked Noisy Speech", in Journal of the AcousticalSociety of America, vol. 126, no. 3, pp. 1415–1426, 2009.
[D] J. B. Boldt, U. Kjems, M. S. Pedersen, T. Lunner, D. Wang, "Estimation of the IdealBinary Mask using Directional Systems", in Proceedings of the 11th International Work-shop on Acoustic Echo and Noise Control (IWAENC), 2008.
[E] J. B. Boldt, M. S. Pedersen, U. Kjems, M. G. Christensen, S. H. Jensen, "Error-Correction of Binary Masks using Hidden Markov Models", in Proceedings of the In-ternational Conference on Acoustics, Speech and Signal Processing (ICASSP), 2010, pp.4722–4725.
[F] J. B. Boldt, and D. P. W. Ellis, "A Simple Correlation-based model of Intelligibilityfor Nonlinear Speech Enhancement and Separation", in Proceedings of the EuropeanSignal Processing Conference (EUSIPCO), 2009, pp. 1849–1853.
In addition, the following patent has been filed:
"A Method for Correcting Errors in Binary Masks", J. B. Boldt, M. S. Pedersen, U.Kjems, M. G. Christensen, S. H. Jensen, EP09168699.8, August 2009.
v

vi
Preface
This thesis is written as a partial fulfilment of the requirements for the Ph.D. degree atthe International Doctoral School of Technology and Science at Aalborg University. Thework was carried out during the period from January 2007 to December 2009 underthe Industrial PhD programme, which is approved and supported by the Danish Ministryof Science, Technology, and Innovation. The Industrial PhD Programme is conducted incooperation between a university and a company – in this case the Danish hearing aidcompany, Oticon A/S.
My workplace has mainly been at Oticon’s headquarter in Copenhagen, Denmark, butseveral other institutions were involved during the past three years: Aalborg University,Columbia University, Eriksholm Research Centre, and the Technical University of Den-mark. At all locations, I have been welcomed with openness and sincere interest, andmany people have contributed in various ways to my work, progress, and well-being. Thelist of names would be very long and yet incomplete, but I would like to thank all of you.
In the beginning of the Industrial PhD programme, the travelling between academiaand industry was a challenge, but as time evolved it became a strength in the project. AtAalborg University my supervisors Søren Holdt Jensen and Mads Græsbøll Christensengave me the academic perspective on new ideas and possibilities. At Oticon my super-visors, Michael Syskind Pedersen and Ulrik Kjems provided me with understanding ofapplied science and industrial research. I would like to thank all of my supervisors forcommitment, valuable advices, feedback, and many interesting and fruitful discussions.
Although I intended not to make a list of names, I feel that the following personsdeserve, in particular, to be recognized for their participation in my work, and I wouldlike to express my sincere gratitude for their contributions:
DeLiang Wang from the Department of Computer Science and Engineering and the Cen-ter for Cognitive Science at the Ohio State University. DeLiang Wang visited Oticonduring the first 6 months of my PhD and had the patience and goodwill to sharehis knowledge with a beginner in the area of binary masking, CASA, and sourceseparation.
Dan Ellis from the Laboratory for Recognition and Organization of Speech and Audio(LabROSA) at Columbia University. Dan welcomed me and gave me a valuableexperience during my 6-months visit in his lab. I am grateful for the many hours ofsupervision and discussions with Dan, from which I learned a lot about science andhow to “do science”.
vii
Mads Græsbøll Christensen from the Department of Media Technology, Aalborg Univer-sity. Mads has supported me, challenged me, and given me an insight and under-standing of the academic world. In addition, he has taken good care of me duringmy visits at Aalborg University, and I appreciate our friendship.
I would also like to thank Søren Kamaric Riis at Oticon for giving me the opportunity topursue my interests and making this PhD programme possible.
Last but not least, I would like to thank my family and friends, but most of all, Corneliafor support, patience, and encouragement in the past three years.
Jesper Bünsow Boldt
viii

Contents
Abstract i
Abstract (in Danish) iii
List of Papers v
Preface vii
Introduction 1
1 The Cocktail Party Problem . . . . . . . . . . . . . . . . . . . . . . . . . . 1
2 Hearing Impairment . . . . . . . . . . . . . . . . . . . . . . . . . . . . . . 2
3 Hearing Aids . . . . . . . . . . . . . . . . . . . . . . . . . . . . . . . . . . 4
4 Binary Masking . . . . . . . . . . . . . . . . . . . . . . . . . . . . . . . . . 5
5 Sparsity of Speech . . . . . . . . . . . . . . . . . . . . . . . . . . . . . . . 8
6 Oracle Masks . . . . . . . . . . . . . . . . . . . . . . . . . . . . . . . . . . 9
6.1 The Ideal Binary Mask . . . . . . . . . . . . . . . . . . . . . . . . . 9
6.2 The Target Binary Mask . . . . . . . . . . . . . . . . . . . . . . . . 11
6.3 Estimation of the Binary Mask . . . . . . . . . . . . . . . . . . . . . 14
7 Application of the Binary Mask . . . . . . . . . . . . . . . . . . . . . . . . 15
7.1 The Gammatone Filterbank . . . . . . . . . . . . . . . . . . . . . . 15
7.2 Short-Time Fourier Transform . . . . . . . . . . . . . . . . . . . . . 18
7.3 Temporal and Spectral Resolution . . . . . . . . . . . . . . . . . . . 18
8 Time-Frequency Masking . . . . . . . . . . . . . . . . . . . . . . . . . . . . 19
9 Speech Intelligibility and Quality . . . . . . . . . . . . . . . . . . . . . . . 20
9.1 What makes Speech Intelligible? . . . . . . . . . . . . . . . . . . . 23
9.2 Evaluation of Speech Intelligibility . . . . . . . . . . . . . . . . . . 24
10 Contributions . . . . . . . . . . . . . . . . . . . . . . . . . . . . . . . . . . 26
11 Conclusion . . . . . . . . . . . . . . . . . . . . . . . . . . . . . . . . . . . 27
References . . . . . . . . . . . . . . . . . . . . . . . . . . . . . . . . . . . . . . . 35
ix

Paper A: Speech Intelligibility in Background Noise with Ideal Binary Time-FrequencyMasking 37
Paper B: Speech Perception of Noise with Binary Gains 51
Paper C: Role of Mask Pattern in Intelligibility of Ideal Binary-masked NoisySpeech 59
Paper D: Estimation of the Ideal Binary Mask using Directional Systems 73
Paper E: Error-Correction of Binary Masks using Hidden Markov Models 81
Paper F: A Simple Correlation-based Model of Intelligibility for Nonlinear SpeechEnhancement and Separation 87
x
Introduction
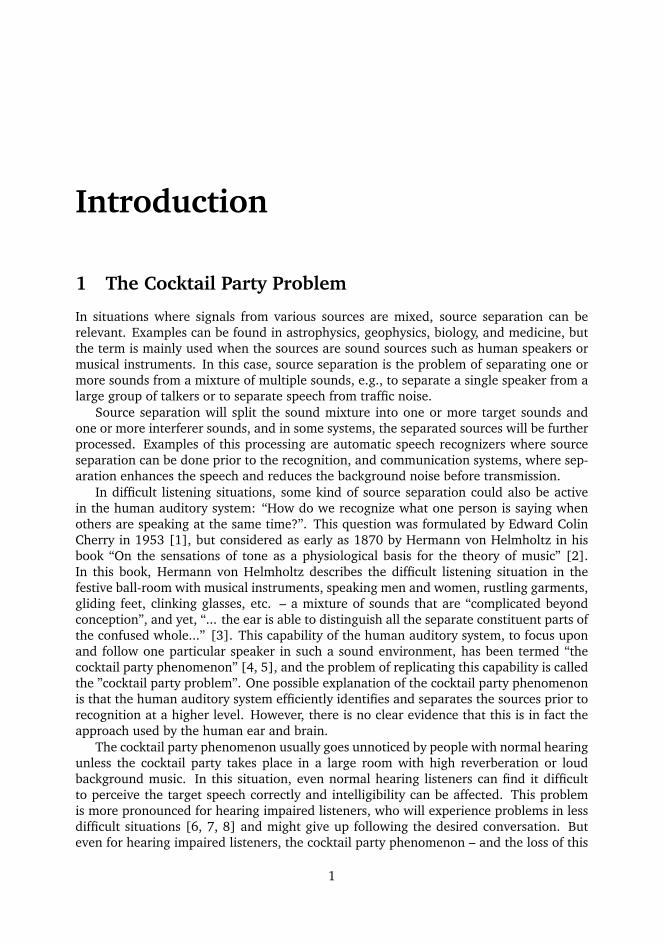
1 The Cocktail Party Problem
In situations where signals from various sources are mixed, source separation can berelevant. Examples can be found in astrophysics, geophysics, biology, and medicine, butthe term is mainly used when the sources are sound sources such as human speakers ormusical instruments. In this case, source separation is the problem of separating one ormore sounds from a mixture of multiple sounds, e.g., to separate a single speaker from alarge group of talkers or to separate speech from traffic noise.
Source separation will split the sound mixture into one or more target sounds andone or more interferer sounds, and in some systems, the separated sources will be furtherprocessed. Examples of this processing are automatic speech recognizers where sourceseparation can be done prior to the recognition, and communication systems, where sep-aration enhances the speech and reduces the background noise before transmission.
In difficult listening situations, some kind of source separation could also be activein the human auditory system: “How do we recognize what one person is saying whenothers are speaking at the same time?”. This question was formulated by Edward ColinCherry in 1953 [1], but considered as early as 1870 by Hermann von Helmholtz in hisbook “On the sensations of tone as a physiological basis for the theory of music” [2].In this book, Hermann von Helmholtz describes the difficult listening situation in thefestive ball-room with musical instruments, speaking men and women, rustling garments,gliding feet, clinking glasses, etc. – a mixture of sounds that are “complicated beyondconception”, and yet, “... the ear is able to distinguish all the separate constituent parts ofthe confused whole...” [3]. This capability of the human auditory system, to focus uponand follow one particular speaker in such a sound environment, has been termed “thecocktail party phenomenon” [4, 5], and the problem of replicating this capability is calledthe ”cocktail party problem”. One possible explanation of the cocktail party phenomenonis that the human auditory system efficiently identifies and separates the sources prior torecognition at a higher level. However, there is no clear evidence that this is in fact theapproach used by the human ear and brain.
The cocktail party phenomenon usually goes unnoticed by people with normal hearingunless the cocktail party takes place in a large room with high reverberation or loudbackground music. In this situation, even normal hearing listeners can find it difficultto perceive the target speech correctly and intelligibility can be affected. This problemis more pronounced for hearing impaired listeners, who will experience problems in lessdifficult situations [6, 7, 8] and might give up following the desired conversation. Buteven for hearing impaired listeners, the cocktail party phenomenon – and the loss of this
1

2 INTRODUCTION
capability – is usually not noticed, and the hearing impaired listener will often explain theloss of intelligibility as caused by a difficult environment and not by his or her impairedhearing [9].
To enable source separation, the sources in the mixture must be assigned as either tar-get or interferer. This assignment is dependent on the situation and can quickly change,as seen by the following example: When talking to a person at the cocktail party, thespeech from that person is the target sound and everything else is the undesired, inter-fering sound. At some point, a new person enters the conversation and his speech isremoved from the group of interfering sources and becomes a target source. The conver-sation continues with two alternating target sources, but the subject changes into musicpreferences, and a new source – the music – has changed from interferer to target.
For the purpose of the work in this thesis, the assignment of sources is simplified:Target sound is the speech from the speaker having the listener’s attention, and everythingelse – including reverberation – is interferer sound. This definition makes the distinctionbetween source separation, speech enhancement, and noise reduction less clear, but inthis thesis, all three methods are seen as possible solutions to the cocktail party problem:The decreased intelligibility can be compensated either by separating the target speechfrom the interfering sounds, by enhancement of the target speech, or by reducing theinterfering sound.
When source separation, speech enhancement, and noise reduction, are seen as pos-sible solutions to the cocktail party problem, the available methods are numerous anddiverse. They include the classic methods such as Wiener filtering and spectral subtrac-tion [10], as well as more recent methods such as independent component analysis [11]and non-negative matrix factorization [12]. Significant results have been obtained fromapplying these methods, but the cocktail party problem cannot be considered solved, andhearing aid users still have problems understanding speech in noisy conditions [13, 14].
Even though the cocktail party problem is not yet solved, research continues to con-tribute to a better understanding of the problem and of the human auditory system. Abetter understanding of the human auditory system could potentially lead to solutions forthe cocktail party problem, and as pointed out by B. Edwards: “Nowadays the limitingfactor is our basic knowledge pertaining to the functional requirements of what a hearingaid should actually do” [15]. This statement contains a lot of truth, but the limitationswithin a hearing aid must not be disregarded. Low processing delay, low complexity,small size, and high robustness are requirements that limit the available solutions to alarge degree. Furthermore, the more fundamental problem of how to select the targetspeech has to be solved.
This thesis discusses binary masking as a further possible solution to the cocktail partyproblem. To say that binary masking fulfils all the above mentioned requirements of ahearing aid is not reasonable, but the simplicity of the method and the results obtained,make the method interesting in hearing aids as a possible solution to the cocktail partyproblem.
2 Hearing Impairment
Hearing impairment is a broad term referring to different problems related to hearing andhearing loss. The most common hearing loss is the sensorineural hearing loss [16, 17],

2. HEARING IMPAIRMENT 3
Soun
d le
vel
Frequency
Level of discomfort,impaired hearing
Dynamic range,impaired hearing
Dynamic range,normal hearing
Level of discomfort,normal hearing
Hearing threshold,impaired hearing
Hearing threshold,normal hearing
Figure 1: Reduced dynamic range due to sensorineural hearing loss. The hearing thresh-old is elevated more than the level of discomfort [21, 9]. In the hearing aid, the reduceddynamic range is compensated by compressing and amplifying the sound: Sound levelsbelow the hearing threshold must be amplified, whereas sound levels close to the level ofdiscomfort must not be amplified.
which is caused by damage in the cochlear, or by problems in the neural connectionsbetween the cochlear and the auditory nerve. The sensorineural hearing loss is differentfrom, e.g., conductive hearing loss where the transmission of waves in the air to fluidsin the cochlea is degraded, and from central hearing loss caused by problems at a higherlevel of the auditory system.
Sensorineural hearing loss is correlated with age [18], why the name age-related hear-ing loss is often used, but this correlation is not completely understood. Some possibleexplanations include loss of inner and outer hair cells in the cochlea, a loss of auditoryneurons, decreased blood flow in the cochlea, and a stiffening of the basilar membrane[19, 20].
The sensorineural hearing loss is usually characterized by higher hearing thresholdsat higher frequencies (a sloping hearing loss [16]), but the dynamic range, frequencyresolution, and temporal resolutions are also affected [20]:
• The dynamic range is the range between the sound level necessary to detect thesound, the hearing threshold, and the sound level causing discomfort, as seen inFigure 1. The sensorineural hearing loss decreases the dynamic range, because thehearing threshold is elevated more than the threshold of discomfort [9, 21, 20].
• The frequency resolution or frequency selectivity is the ability to distinguish spec-tral components in complex sounds. One reason for the decreased frequency reso-lution is the broadening of the auditory filters, meaning that different locations onthe cochlea become more sensitive to a wider range of frequencies. The broadeningof the auditory filters can make the high frequencies difficult to perceive, becauseof increased masking by low frequencies [20].

4 INTRODUCTION
• The temporal resolution is the ability to detect changes or events as a functionof time. The forward and backward masking are the ability to detect a sound be-fore or after another sound, and this non-simultaneous masking is increased by thesensorineural hearing loss [20, 22].
There are large individual differences in the extent to which persons with a sensorineu-ral hearing loss experience the above mentioned difficulties. Further, the method usedfor measuring, e.g. the non-simultaneous masking, greatly influence the conclusions: Ifnormal hearing listeners and hearing impaired listeners are compared at the same soundlevel, the effects from the sensorineural hearing loss are evident, but if the persons aretested at the same sensation level – the level relative to the hearing threshold – the effectsare less clear [20].
A hearing impaired listener having problems at the cocktail party does not necessarilyexperience problems in noise free or less difficult conditions, because speech is robustand redundant. Robust and redundant means that part of the speech sound can be lostor modified without negative impact on intelligibility [23, 24, 25]. This redundancy ofspeech helps the hearing impaired listener to recognize and understand, even thoughsome details of the sound are lost. When multiple sources are present, the listener hasthe additional task of identifying and separating the target speech. If we assume that bothhigh frequency resolution and high temporal resolution are required to complete this task,a possible explanation to the hearing impaired listener’s difficulties at the cocktail partyis the reduced frequency and temporal resolution.
An evident effect of the sensorineural hearing loss is the reduced capability to usefluctuations in the interferer sound. Normal hearing listeners can make use of fluctuationsin the interfering sound and will obtain a better intelligibility if the sound is modulated [6,8]. This ability – also known as glimpsing speech [26] – is reduced by the sensorineuralhearing loss [6, 8, 17].
3 Hearing Aids
Of the three complications from the sensorineural hearing loss described in the previoussection, the reduced dynamic range is the most straightforward to address in the hearingaid by compression of the sound. The reduced frequency and temporal resolution aresomewhat more difficult to compensate and the compression in the hearing aid doesnot necessarily compensate the reduced frequency and temporal resolution [13]. Thecompression compensates the reduced dynamic range by adjusting the dynamic range ofthe incoming sound to better correspond to the dynamic range of the hearing impairedlistener’s damaged cochlear. The compression is a frequency and level dependent gainmaking weak sounds audible and loud sounds below the level of discomfort [9, 16].Making sounds audible is a necessary step to compensate for the hearing loss, but manyhearing aid users will continue to experience problems with understanding speech innoisy conditions [16, 14].
One further approach towards solving the problem of reduced intelligibility in diffi-cult situations is spatial filtering, where sound arising from certain directions is amplifiedmore than others [27, 28]. The spatial filtering is accomplished using a directional systemoften based on two closely placed microphones in each hearing aid. This makes it pos-sible to amplify sounds coming from particular directions and thus attenuate interfering

4. BINARY MASKING 5
sounds. However, this raises the fundamental question of how to decide which source isthe target and which sources are interferers. A simple solution – which is acceptable inmany situations – is to assume that the target source is located in front of the hearing aiduser, though a number of examples can be found where this assumption is not valid, e.g.,in a car or in a conversation with several people.
The use of directional systems and other signal processing methods are still limitedby the size and placement of the hearing aid, even though the technology in hearingaids has developed fast over the last decade. Complex algorithms take up more of thecapacity of the integrated circuit and use more power. In the future, these limitationswill hopefully be reduced by the development of new technologies in the hearing aid, butuser requirements for the hearing aid such as robustness, reliability, and high performancemust continue to be fulfilled.
Most hearing aids do not block the ear canal completely, but allow direct soundthrough the vent in the hearing aid mould. The result is that the Tympanic membrane inthe ear will receive both direct and amplified sound, and this tightens the requirementfor low delay through the hearing aid. A large time difference between the direct and theamplified sound can result in negative side effects such as echoes. Thus, the objective is tokeep the time delay below the threshold at which degradations of the sound is perceived(∼10 ms [29, 30]). This strongly limits the use of computational expensive algorithmsand non-causal methods (batch processing) that require a large number of future samplesto be available.
4 Binary Masking
This thesis focuses on binary masking as a solution to the cocktail party problem. Inbinary masking, sound sources are assigned as either target or interferer in the time-frequency domain. As already defined, the target source is the source having the hearingaid user’s attention. Everything else is interferer. When different sources are mixed,the identification of parts belonging to the target and parts belonging to the interferercan be difficult. Fortunately, the use of time-frequency representations can make thisassignment easier because the change from time domain to time-frequency domain canhelp identify which parts of the sound that belong to the target and which parts thatbelong the interferer. The time-frequency representation can reveal properties of thesound sources that are not visible in the time domain or frequency domain, as seen inFigure 2.
The word binary emphasizes the assignment of time-frequency regions as belongingto either the target or the interferer source, but it also suggests what to do with thetwo sources when they have been identified. In binary masking the target sound is keptby using the value one in the binary mask, whereas the regions with the interferer areremoved by using the value zero. In Figure 3 and throughout this thesis, the value one isshown with white, whereas the value zero is shown with black in the binary masks.
The word mask is the name for the pattern of values showing which regions in timeand frequency that will be kept or removed. This mask can be seen as a matrix which isplaced on top of the time-frequency representation of the sound mixture; white areas willbe kept and black areas will be removed as seen in Figure 4.

6 INTRODUCTION
0
1
2
3
4
5
6
7
8
9
10
Fre
quency [kH
z]
Frequency Domain
Time [s]
Time−Frequency Domain
0 0.4 0.8 1.2 1.7 2.1 2.5 2.9 3.3 3.7 4.20 dB
9 dB
17 dB
26 dB
35 dB
43 dB
52 dB
60 dB
Time Domain
Figure 2: Speech signal mixed with a sinusoidal signal with alternating frequency.The time-frequency representation of the mixture provides more information about thesinewave than the time domain (top) or the frequency domain (left).
In short, binary masking is a method for applying a binary, frequency-dependent, andtime-varying gain in a number of frequency channels, and the binary mask defines whatto do when. This makes it possible to use the binary mask as an intermediate result, whichcan be used to evaluate and examine the performance of the binary masking algorithm.Binary masking algorithms can be seen as two steps: Estimation of the binary mask andapplication of the binary mask to carry out the source separation. In the estimation ofthe binary mask, the time-frequency regions are assigned to either the target or interferersource using, e.g., information about the spatial location of the sources [31] or speechmodels [32, 33]. In the application of the binary mask, the time-frequency regions as-signed to the target source are kept, whereas the regions assigned to the interferer sourcesare removed or attenuated.
To evaluate the feasibility of an estimated binary mask, it can be compared to anavailable reference mask. This reference mask makes it possible to compare differentestimated binary masks and measure their precision, e.g., by counting the number oferrors in the binary mask compared to the reference mask [34, 35]. Two types of referencemasks – or oracle masks – are described in Section 6, followed by examples of how toestimate the oracle masks and apply them to the sound. But first, an important propertyof speech which is a major motivation for the use of binary masking is discussed in thefollowing section.
4. BINARY MASKING 7
Time [s]
Fre
quency [H
z]
(A) Competing Speech
0 0.5 1 1.5 280
265
560
1032
1787
2992
4920
8000
Time [s]
(B) 2 kHz sine
0 0.5 1 1.5 2−
−
−
−
−
−
−
−
Time [s]
(C) Coughs
0 0.5 1 1.5 2−
−
−
−
−
−
−
−
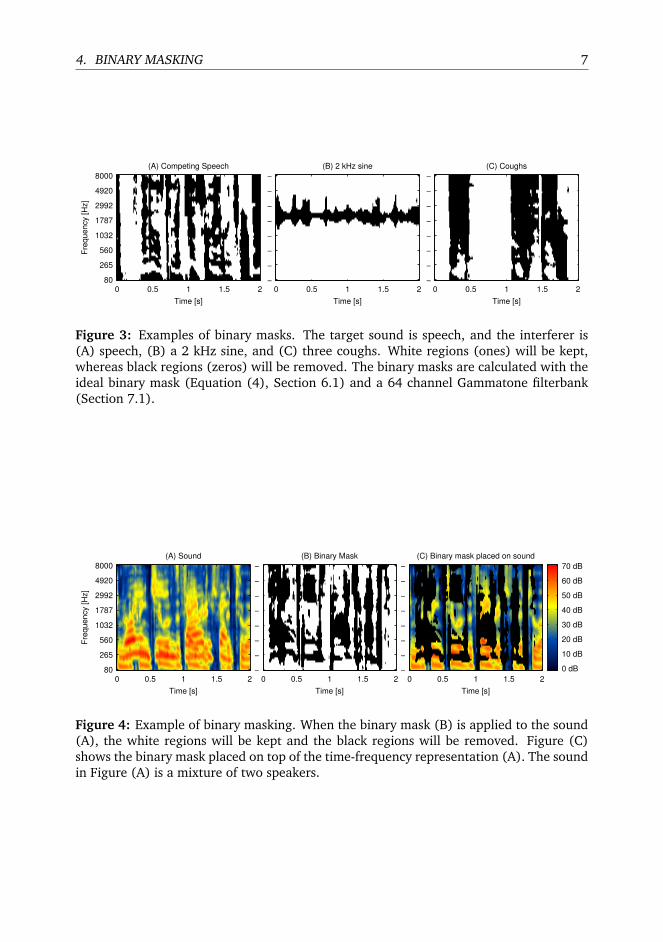
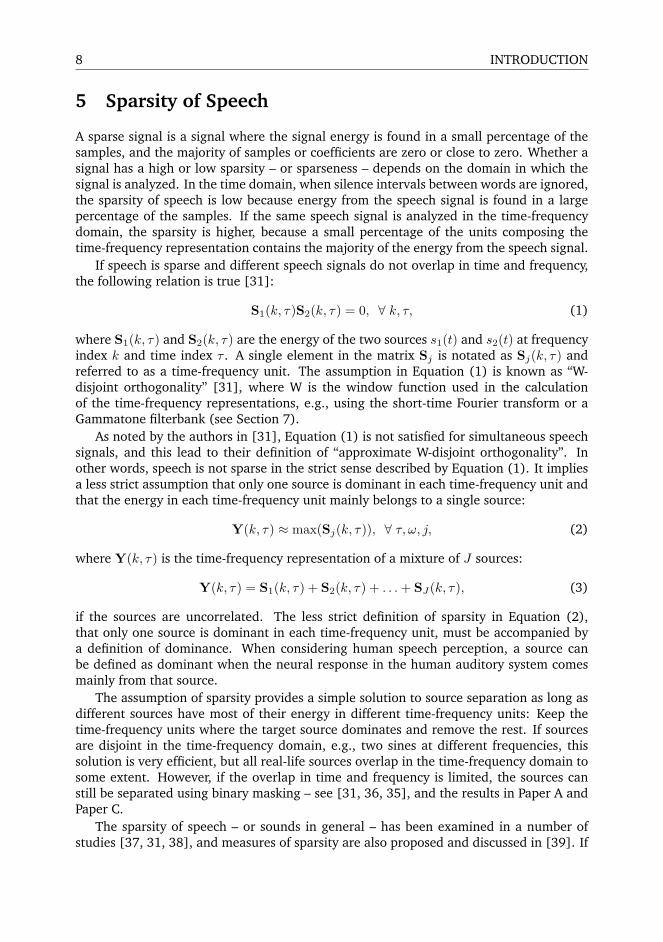
Figure 3: Examples of binary masks. The target sound is speech, and the interferer is(A) speech, (B) a 2 kHz sine, and (C) three coughs. White regions (ones) will be kept,whereas black regions (zeros) will be removed. The binary masks are calculated with theideal binary mask (Equation (4), Section 6.1) and a 64 channel Gammatone filterbank(Section 7.1).
Time [s]
Fre
quency [H
z]
(A) Sound
0 0.5 1 1.5 280
265
560
1032
1787
2992
4920
8000
Time [s]
(B) Binary Mask
0 0.5 1 1.5 2−
−
−
−
−
−
−
−
Time [s]
(C) Binary mask placed on sound
0 0.5 1 1.5 2−
−
−
−
−
−
−
−
0 dB
10 dB
20 dB
30 dB
40 dB
50 dB
60 dB
70 dB
Figure 4: Example of binary masking. When the binary mask (B) is applied to the sound(A), the white regions will be kept and the black regions will be removed. Figure (C)shows the binary mask placed on top of the time-frequency representation (A). The soundin Figure (A) is a mixture of two speakers.
8 INTRODUCTION
5 Sparsity of Speech
A sparse signal is a signal where the signal energy is found in a small percentage of thesamples, and the majority of samples or coefficients are zero or close to zero. Whether asignal has a high or low sparsity – or sparseness – depends on the domain in which thesignal is analyzed. In the time domain, when silence intervals between words are ignored,the sparsity of speech is low because energy from the speech signal is found in a largepercentage of the samples. If the same speech signal is analyzed in the time-frequencydomain, the sparsity is higher, because a small percentage of the units composing thetime-frequency representation contains the majority of the energy from the speech signal.
If speech is sparse and different speech signals do not overlap in time and frequency,the following relation is true [31]:
S1(k, τ)S2(k, τ) = 0, ∀ k, τ, (1)
where S1(k, τ) and S2(k, τ) are the energy of the two sources s1(t) and s2(t) at frequencyindex k and time index τ . A single element in the matrix Sj is notated as Sj(k, τ) andreferred to as a time-frequency unit. The assumption in Equation (1) is known as “W-disjoint orthogonality” [31], where W is the window function used in the calculationof the time-frequency representations, e.g., using the short-time Fourier transform or aGammatone filterbank (see Section 7).
As noted by the authors in [31], Equation (1) is not satisfied for simultaneous speechsignals, and this lead to their definition of “approximate W-disjoint orthogonality”. Inother words, speech is not sparse in the strict sense described by Equation (1). It impliesa less strict assumption that only one source is dominant in each time-frequency unit andthat the energy in each time-frequency unit mainly belongs to a single source:
Y(k, τ) ≈ max(Sj(k, τ)), ∀ τ, ω, j, (2)
where Y(k, τ) is the time-frequency representation of a mixture of J sources:
Y(k, τ) = S1(k, τ) + S2(k, τ) + . . .+ SJ(k, τ), (3)
if the sources are uncorrelated. The less strict definition of sparsity in Equation (2),that only one source is dominant in each time-frequency unit, must be accompanied bya definition of dominance. When considering human speech perception, a source canbe defined as dominant when the neural response in the human auditory system comesmainly from that source.
The assumption of sparsity provides a simple solution to source separation as long asdifferent sources have most of their energy in different time-frequency units: Keep thetime-frequency units where the target source dominates and remove the rest. If sourcesare disjoint in the time-frequency domain, e.g., two sines at different frequencies, thissolution is very efficient, but all real-life sources overlap in the time-frequency domain tosome extent. However, if the overlap in time and frequency is limited, the sources canstill be separated using binary masking – see [31, 36, 35], and the results in Paper A andPaper C.
The sparsity of speech – or sounds in general – has been examined in a number ofstudies [37, 31, 38], and measures of sparsity are also proposed and discussed in [39]. If

6. ORACLE MASKS 9
sparsity correlates with the performance of the separation, a reliable measure of sparsitywould be valuable. However, there is not a general accepted measure of sparsity that hasbeen used to compare different sounds in different studies. One reason is that sparsityis dependent on the used time-frequency representation as indicated by the expression“W-disjointness” [31].
6 Oracle Masks
In this thesis, the term oracle mask is used for binary masks calculated using a prioriknowledge which is not available in most real-life applications. In other words, the oraclemasks are calculated in ideal situations, where all required information is available anddoes not need to be estimated. The term oracle mask is used instead of ideal binary mask,because the latter refers to a particular type of oracle mask described in Section 6.1.
A major objection to the concept of oracle masks is that it is of no use in real-lifeapplications because of the required a priori knowledge. However, the oracle masks es-tablish an upper limit of performance, which makes them useful as references and goalsfor binary masking algorithms developed for real-life applications such as hearing aids.To use a binary mask as reference or as goal for real-life estimation, it must be optimalin some sense or contribute to the solution of the problem at hand. In this thesis, theproblem is the cocktail party problem, and the ideal binary mask and the target binarymask described in the following sections are possible solutions to this problem because oftheir positive impact on intelligibility. The descriptions of the ideal binary mask and thetarget binary mask (Section 6.1 and 6.2) are followed by examples of how to estimatethese oracle masks (Section 6.3).
6.1 The Ideal Binary Mask
The ideal binary mask (IBM) is an oracle mask, because it requires both the target andinterferer to be available as separate sounds. In most real-life situations only the mixtureof the two sounds is available. To calculate the ideal binary mask, the energy of the targetsound is compared to the energy of the interferer sound within each time-frequency unit:
MIBM(k, τ) =
{1, if T(k, τ)
N(k, τ)> LC
0, otherwise, (4)
where T(k, τ) is the energy of the target, N(k, τ) is the energy of the interferer, τ thetime index, and k the frequency index. The local SNR criterion (LC) is the threshold forclassifying the time-frequency unit as dominated by the target or interferer sound and thisthreshold controls the amount of ones in the ideal binary mask (see Figure 5). If the LCvalue in Equation (4) is 0 dB, the ideal binary mask will keep all the time-frequency unitswith a local SNR of more than 0 dB. The local SNR is the SNR within time-frequency units,whereas the global SNR is the overall level difference between two sounds. If sounds fromtwo speakers are mixed at 0 dB global SNR, the local SNR will vary highly from unit tounit because of the sparsity of speech.
Experiments applying the ideal binary mask to noisy speech have documented a sub-stantial improvement in intelligibility. The improvement has been shown for normal hear-

10 INTRODUCTION
Time [s]
Fre
qu
en
cy [H
z]
(A) Target sound, speech
0 0.5 1 1.5 280
265
560
1032
1787
2992
4920
8000
Time [s]
Fre
qu
en
cy [H
z]
(B) Interferer sound, speech
0 0.5 1 1.5 280
265
560
1032
1787
2992
4920
8000
Time [s]
Fre
qu
en
cy [H
z]
(C) Mixture
0 0.5 1 1.5 280
265
560
1032
1787
2992
4920
8000
Time [s]
Fre
quency [H
z]
(C) IBM, LC = −10 dB
0 0.5 1 1.5 280
265
560
1032
1787
2992
4920
8000
Time [s]
Fre
quency [H
z]
(D) IBM, LC = 0 dB
0 0.5 1 1.5 280
265
560
1032
1787
2992
4920
8000
Time [s]
Fre
quency [H
z]
(E) IBM, LC = 10 dB
0 0.5 1 1.5 280
265
560
1032
1787
2992
4920
8000
Time [s]
Fre
quency [H
z]
(F) Separated target
0 0.5 1 1.5 280
265
560
1032
1787
2992
4920
8000
Time [s]
Fre
quency [H
z]
(G) Separated interferer
0 0.5 1 1.5 280
265
560
1032
1787
2992
4920
8000
0 dB
10 dB
20 dB
30 dB
40 dB
50 dB
60 dB
70 dB
Figure 5: Calculation of the ideal binary mask. If the energy of the target sound (A) islarger than the energy of the interferer sound (B), the ideal binary mask (D) will containthe value one (white color) and otherwise the value zero (black color). The number ofones in the ideal binary mask is determined by the LC value as seen in (C–E). By applyingthe binary mask (D) to the mixture (C), the target speech is separated as seen in (F).If the target and interferer are swapped the result (G) is obtained. The time-frequencyrepresentations are calculated using a 64 channel Gammatone filterbank, and the targetand interferer are mixed at 0 dB SNR.

6. ORACLE MASKS 11
ing listeners [36, 35], cochlear implant users [34], and for hearing impaired listeners inPaper A. The experiments were conducted using various conditions and thus show thatthe ideal binary mask is able to improve intelligibility for a range of LC values, interferertypes, and SNRs.
The results obtained with the ideal binary mask under the various conditions werefollowed by experiments with ideal binary masking at low SNRs in Paper B and C. If theSNR and the LC value are decreased simultaneously in Equation (4), the ideal binary maskdoes not change, but the mixture will contain less target sound. Taking this to an extremeand applying the ideal binary mask to speech-shaped noise, creates an intelligible soundas documented in Paper B. This method resembles the method known as vocoding andshows the importance of the temporal speech envelope for intelligibility [40, 41, 42, 43].
6.2 The Target Binary Mask
The results obtained in Paper B – that high intelligibility can be obtained by applyingthe ideal binary mask to speech-shaped noise – lead to the definition of the target binarymask in Paper C. The speech-shaped noise used in Paper B had the same long-term aver-age spectrum as the target speech, but instead of using speech-shaped noise, the targetbinary mask can be calculated by comparing the target speech directly with the long-termaverage spectrum of the target speech:
MTBM(k, τ) =
{1, if T(k, τ)
r(k)> LC
0, otherwise, (5)
where the vector r(k) is the long-term average of the energy in each of the frequencychannels in the target sound T(k, τ). An important difference between the ideal binarymask (4) and the target binary mask (5) is the presence of the interferer N(k, τ). Theideal binary mask requires the interferer to be available and will change depending onthe type of interferer, whereas the target binary mask is calculated from the target soundonly and therefore is independent of the interferer sound. The ideal binary mask andthe target binary mask are compared in Figure 6 using three different types of interferersound.
The dependency on the target sound only, is not unique to the target binary mask. In[44], an oracle mask was generated by comparing the energy in each band with a globalcriterion. This criterion was equal in all frequency bands and adjusted to keep 99% ofthe energy from the target speech. The criterion not being a function of frequency isa major difference between the mask in [44] and the target binary mask. In Equation5, the criterion r(k) is a function of frequency, whereas the criterion used in [44] isindependent of frequency. The oracle mask in [44] was evaluated using hearing impairedlisteners showing a similar impact on intelligibility as the ideal binary mask and targetbinary mask.
In Paper C, the impact on intelligibility by using the target binary mask and the idealbinary mask was measured in different conditions: 4 different noise types, 3 differentSNRs, and 8 different mask densities were evaluated. High intelligibility was found whenthe ideal binary mask and the target binary mask were applied to noisy speech, andalthough intelligibility was reduced as a function of decreasing SNR, high intelligibilitywas still obtained at -60 dB SNR similar to the result in the Paper B. The impact on sound

12 INTRODUCTION
Time [s]
Fre
quency [H
z]
(A) Target speech
0 0.3 0.6 0.9 1.280
265
560
1032
1787
2992
4920
8000
Time [s]
Fre
quency [H
z]
(B) Speech shaped noise (SSN)
0 0.3 0.6 0.9 1.280
265
560
1032
1787
2992
4920
8000
Time [s]
Fre
quency [H
z]
(C) High−frequency noise (HF)
0 0.3 0.6 0.9 1.280
265
560
1032
1787
2992
4920
8000
Time [s]
Fre
quency [H
z]
(D) Low−frequency noise (LF)
0 0.3 0.6 0.9 1.280
265
560
1032
1787
2992
4920
8000
Time [s]
Fre
quency [H
z]
(E) IBM, SSN = TBM
0 0.3 0.6 0.9 1.280
265
560
1032
1787
2992
4920
8000
Time [s]
Fre
quency [H
z]
(F) IBM, HF noise
0 0.3 0.6 0.9 1.280
265
560
1032
1787
2992
4920
8000
Time [s]
Fre
quency [H
z]
(G) IBM, LF noise
0 0.3 0.6 0.9 1.280
265
560
1032
1787
2992
4920
8000
Time [s]
Fre
quency [H
z]
(H) IBM, SSN ((E) on (A+B))
0 0.3 0.6 0.9 1.280
265
560
1032
1787
2992
4920
8000
Time [s]
Fre
quency [H
z]
(I) IBM, HF noise ((F) on (A+C))
0 0.3 0.6 0.9 1.280
265
560
1032
1787
2992
4920
8000
Time [s]
Fre
quency [H
z]
(J) IBM, LF noise ((G) on (A+D))
0 0.3 0.6 0.9 1.280
265
560
1032
1787
2992
4920
8000
Time [s]
Fre
quency [H
z]
(K) TBM, HF noise ((E) on (A+C))
0 0.3 0.6 0.9 1.280
265
560
1032
1787
2992
4920
8000
Time [s]
Fre
quency [H
z]
(L) TBM, LF noise ((E) on A+D))
0 0.3 0.6 0.9 1.280
265
560
1032
1787
2992
4920
8000
0 dB
9 dB
19 dB
28 dB
38 dB
47 dB
57 dB
66 dB
6. ORACLE MASKS 13
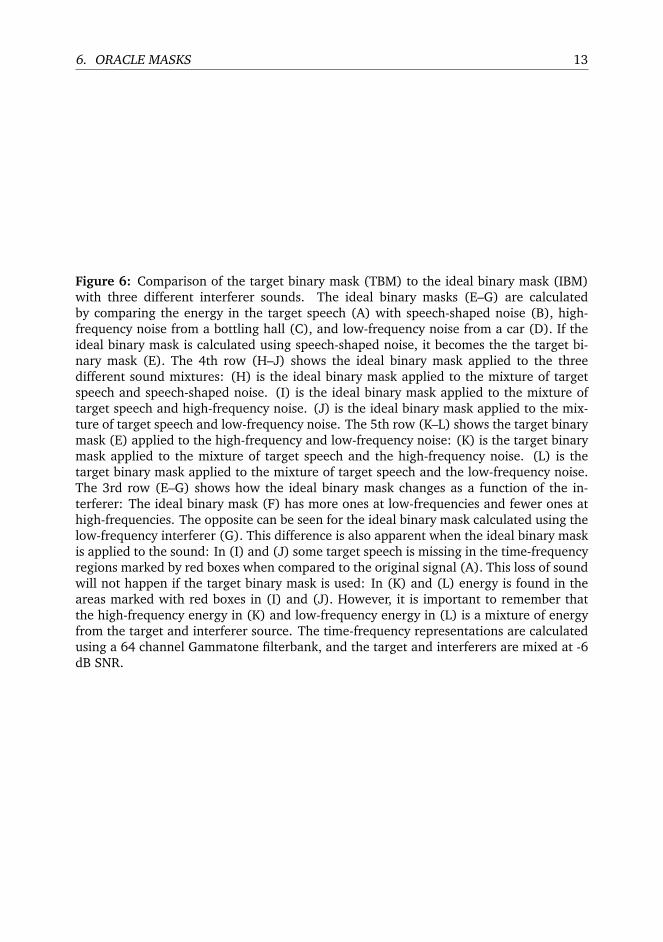
Figure 6: Comparison of the target binary mask (TBM) to the ideal binary mask (IBM)with three different interferer sounds. The ideal binary masks (E–G) are calculatedby comparing the energy in the target speech (A) with speech-shaped noise (B), high-frequency noise from a bottling hall (C), and low-frequency noise from a car (D). If theideal binary mask is calculated using speech-shaped noise, it becomes the the target bi-nary mask (E). The 4th row (H–J) shows the ideal binary mask applied to the threedifferent sound mixtures: (H) is the ideal binary mask applied to the mixture of targetspeech and speech-shaped noise. (I) is the ideal binary mask applied to the mixture oftarget speech and high-frequency noise. (J) is the ideal binary mask applied to the mix-ture of target speech and low-frequency noise. The 5th row (K–L) shows the target binarymask (E) applied to the high-frequency and low-frequency noise: (K) is the target binarymask applied to the mixture of target speech and the high-frequency noise. (L) is thetarget binary mask applied to the mixture of target speech and the low-frequency noise.The 3rd row (E–G) shows how the ideal binary mask changes as a function of the in-terferer: The ideal binary mask (F) has more ones at low-frequencies and fewer ones athigh-frequencies. The opposite can be seen for the ideal binary mask calculated using thelow-frequency interferer (G). This difference is also apparent when the ideal binary maskis applied to the sound: In (I) and (J) some target speech is missing in the time-frequencyregions marked by red boxes when compared to the original signal (A). This loss of soundwill not happen if the target binary mask is used: In (K) and (L) energy is found in theareas marked with red boxes in (I) and (J). However, it is important to remember thatthe high-frequency energy in (K) and low-frequency energy in (L) is a mixture of energyfrom the target and interferer source. The time-frequency representations are calculatedusing a 64 channel Gammatone filterbank, and the target and interferers are mixed at -6dB SNR.
14 INTRODUCTION
quality from the ideal binary mask or the target binary mask was not measured in Paper B,but a decrease in sound quality can be expected because of the coarse, binary processing.However, the quality of the processed sound using either of the masks is highly dependenton the noise type, SNR, and time-frequency resolution.
Defining the target binary mask establishes a new method for obtaining high intelligi-bility, and this new oracle mask can be used as reference and as a goal for binary masking.The target binary mask does not change as a function of the interferer sound which makesit easier to build a model of the binary mask. This property is used in Paper E, where amethod for error correction of an estimated target binary mask is proposed.
6.3 Estimation of the Binary Mask
The results obtained with the ideal binary mask and the target binary mask in the idealsituations make these oracle masks useful goals when trying to solve the cocktail partyproblem. To obtain similar results in real-life applications, robust and precise methodsfor estimating these oracle masks must be found.
In Computational Auditory Scene Analysis (CASA) [45, 46], the binary mask is cal-culated by analyzing the sound mixture using principles from (human) Auditory Sceneanalysis (ASA) [47, 48]. A major motivation for CASA is the remarkable performanceof the human auditory system even in adverse conditions, i.e. the cocktail party phe-nomenon. A listener is able to follow a single speaker in situations with many competingspeakers and interfering sounds, and if this ability could be replicated by an algorithm,this would provide an understanding of how the human auditory system might work andsuggest how source separation algorithms could be designed.
In the process of separating the target from the interferer, CASA algorithms often usethe two stages from ASA: segmentation and grouping. In the first stage, the sound isdecomposed into segments using cues as pitch, onsets, offsets, harmonicity, spatial loca-tion, and temporal continuity [48]. A segment is a sound with some inherent similarity,which probably comes from a single source. In a mixture of three speakers, segmentsare well-defined regions in time and frequency coming from one of the speakers but notassigned to a specific speaker. Assigning a segment to a particular speaker is the purposeof the second stage, where the segments are grouped into streams. A stream is a soundcoming from the same source. In the mixture of three speakers, a large number (> 3) ofsegments can be found but ideally these segments should be grouped into three streams.When the target stream has been identified in time and frequency, it can be separatedusing the binary mask.
The ideal binary mask was formulated as the goal for CASA [49], but it has also beenused as a reference outside the CASA domain [50, 31, 34, 51]. To estimate the oraclemasks either multi-channel or single-channel algorithms can be used, but because of thenovelty of the target binary mask, only methods for estimating the ideal binary mask hasbeen proposed in the literature as described in the following paragraphs.
In multi-channel algorithms, the binary mask can be calculated using time, phase,or level differences from two or more microphone recordings. The microphones are oftenconfigured similarly to what is found in a hearing aid, or as a binaural configuration mod-eling the sound received in the human ears. The first configuration was used in the DUETalgorithm [31], where the amplitude and phase differences between two microphoneswere used to calculate the binary mask. This configuration is also used in the system
7. APPLICATION OF THE BINARY MASK 15
proposed in Paper D, where the LC value in Equation (4) is calculated from the locationof the sources. The binaural configuration was used in [52], where the interaural timedifference (ITD) and interaural intensity difference (IIS) [53] are used to calculate thebinary mask. A comprehensive review of different multi-channel algorithms useful forhearing aid design can be found in [54].
In single-channel algorithms, only a single recording is available, and the binary maskmust be calculated from this recording. To do this, the pitch and the harmonic structurecan be used for voiced speech [55], and onsets and offsets can be used for unvoicedspeech [56]. Outside the CASA domain, the ideal binary mask has been estimated usingdifferent “classic” single-channel speech enhancement algorithms [57]. In this study,several gain functions, noise estimation methods, and a voice activity detector were usedto estimate the expected local SNR and the ideal binary mask.
Recently, a study proposing a single-channel speech enhancement algorithm usingbinary masking has reported a substantial improvement in intelligibility [50]. This pa-per proposes a speaker-dependent algorithm based on a Bayesian classifier that classifieseach time-frequency unit as belonging to either the target or the interferer is proposed.The experiments show a significant increase in intelligibility under three different noiseconditions and two SNR levels.
The above mentioned methods show that is possible to estimate the ideal binary maskwith high precision in certain situations, but also that the binary masks will contain errorsin most real-life situations. This problem has been recognized in several papers, where thecorrelation between errors in the ideal binary mask and intelligibility has been examined[50, 34, 35]. To reduce the number of errors more robust algorithms must be developedor a different approach should be taken as proposed in Paper E. In this paper, errors inthe target binary mask are corrected using a hidden Markov model, and the results showthat it is possible to build a speaker-independent model of the target binary mask and usethis model to reduce the amount of errors.
7 Application of the Binary Mask
To apply the oracle masks – or estimates hereof – to a mixture of sounds, different trans-forms can be used [58, 59]. In the papers constituting this thesis, a Gammatone filterbankis used, why this is described in detail in Section 7.1. Another widely used method forbinary masking is the short-time Fourier transform (see e.g. [60, 61]), which is shortlydescribed in Section 7.2.
7.1 The Gammatone Filterbank
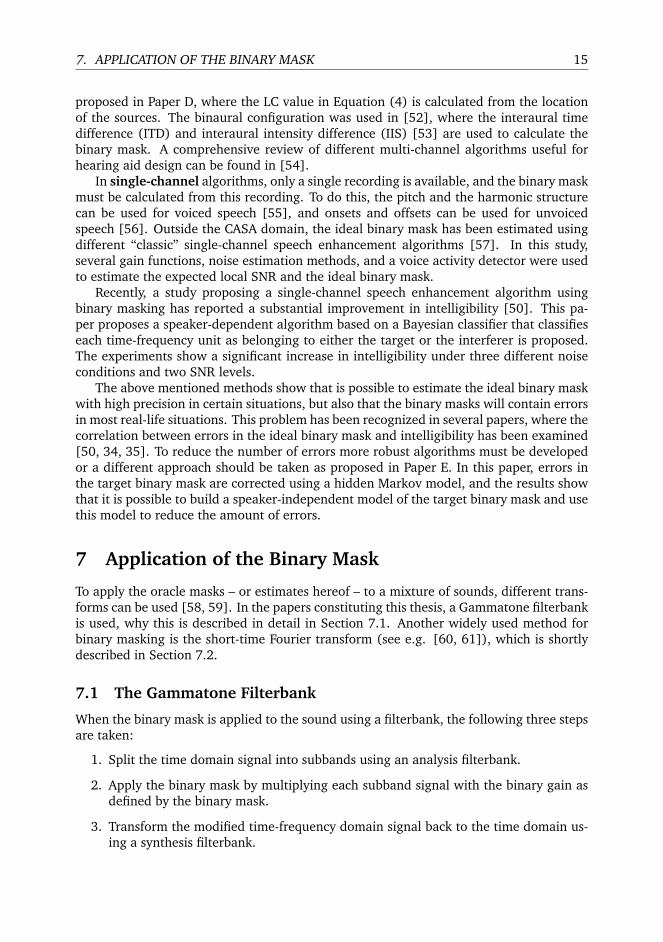
When the binary mask is applied to the sound using a filterbank, the following three stepsare taken:
1. Split the time domain signal into subbands using an analysis filterbank.
2. Apply the binary mask by multiplying each subband signal with the binary gain asdefined by the binary mask.
3. Transform the modified time-frequency domain signal back to the time domain us-ing a synthesis filterbank.
16 INTRODUCTION
The three steps are carried out using the setup shown in Figure 7. In all the papersconstituting this thesis, the Gammatone filterbank is used to mimic the signal processingin the human auditory system. This filterbank is build of Gammatone filters with fre-quency dependent bandwidths and non-linear filter spacing as described in the followingparagraphs and seen in Figure 8.
The Gammatone filters [62, 63] imitates the auditory filter in the human cochlea, andthey are created by multiplying a 4th-order gamma function with a tone (carrier):
g(t) = tn−1 exp(−2πbt) cos(2πfct+ φ), (6)
where n is the order (n = 4), b is the bandwidth of the filter, fc the center-frequency, andφ the phase. The impulse responses from the Gammatone filters in Figure 9 can be seenas the impulse response at different locations on the basilar membrane. The bandwidths bof the Gammatone filters are determined by the equivalent rectangular bandwidth (ERB)[53]:
ERB(fc) = 24.7 · (4.37 · 10−3 · fc + 1) (7)
b = 1.019 · ERB(fc) (8)
where fc is the center-frequency in Hz, and ERB is the bandwidth in Hz. The equivalentrectangular bandwidth in Equation (7) is a measure of the bandwidths of the human au-ditory filters [64, 53]. Two filters have the same ERB, if their peak gain is the same and ifthey retain the same amount of energy from a white noise signal. Equation (8) is a cor-rection to match the bandwidths of the 4th-order Gammatone filter with the bandwidthsof the auditory filters in the human auditory system [62, 65].
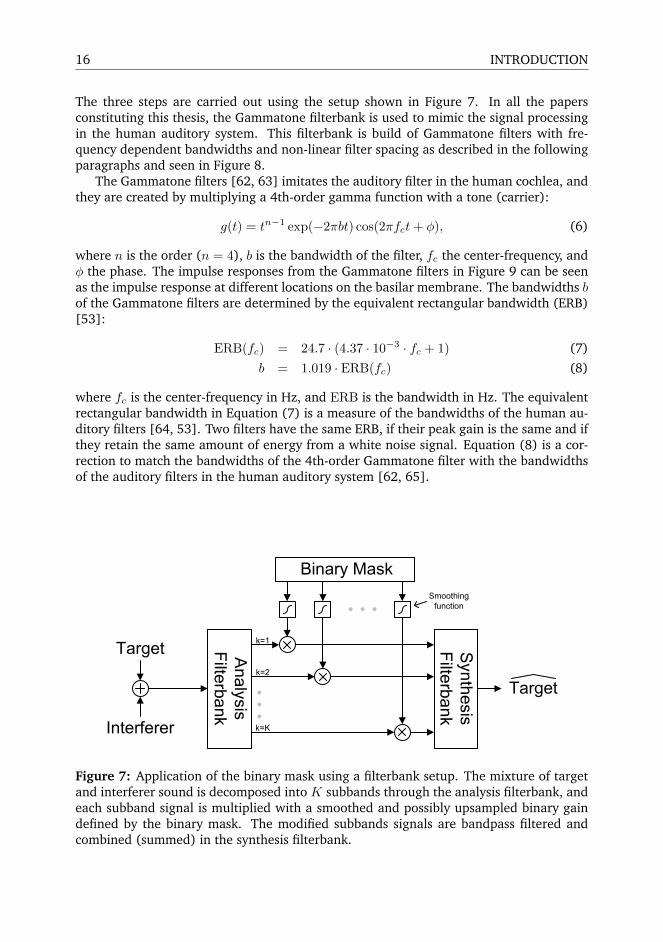
Smoothing function
k=1
k=2
k=K
Figure 7: Application of the binary mask using a filterbank setup. The mixture of targetand interferer sound is decomposed into K subbands through the analysis filterbank, andeach subband signal is multiplied with a smoothed and possibly upsampled binary gaindefined by the binary mask. The modified subbands signals are bandpass filtered andcombined (summed) in the synthesis filterbank.

7. APPLICATION OF THE BINARY MASK 17
The bandwidths of the auditory filters can also be used as a frequency scale [64, 53],where frequency is expressed as the number of auditory filters between 0 Hz and thefrequency f :
ERBn = 21.4 · log10(4.37 · 10−3 · f + 1), (9)
This frequency scale (number of ERBs) can be used to calculate the center-frequenciesof the filters in the Gammatone filterbank, by distributing the filters linearly between thelowest and highest frequency on the ERBn scale.
0 1000 2000 3000 4000 5000 6000 7000 8000 9000 10000−20
−15
−10
−5
0
Magnitude [dB
]
Frequency [Hz]
Figure 8: Frequency response of a 32 channel Gammatone filterbank with center-frequencies equally distributed on the ERBn scale (Equation (9)) between 90 and 9000Hz. The Gammatone filters are normalized to 0 dB peak gain [63]. The impulse responsesof the filters illustrated with red, green, and blue are seen in Figure 9.
0 0.002 0.004 0.006 0.008 0.01 0.012 0.014 0.016 0.018 0.02
10
20
30
fc = 618 Hz, b = 93 Hz
fc = 2279 Hz, b = 276 Hz
fc = 7199 Hz, b = 817 Hz
Time [s]
Fre
quency c
hannel
Figure 9: Impulse responses of 4th-order Gammatone filters with center-frequencies fcand bandwidths b. The filters are normalized to 0 dB peak gain [63], as seen in Figure 8.
0 1000 2000 3000 4000 5000 6000 7000 8000 9000 10000−20
−15
−10
−5
0
Magnitude [dB
]
Frequency [Hz]
Figure 10: Frequency response of a 32 channel short-time Fourier transform. The analysiswindow is a 32 point Hamming window normalized to 0 dB peak gain [63].

18 INTRODUCTION
When the sound has been decomposed into subbands through the analysis filterbank,the binary mask is applied by multiplying each subband signal with the binary gain asshown in Figure 7. Usually, the binary mask is decimated and not calculated on a sample-by-sample basis, although examples of the latter can be found [44]. As an example,the binary masks in Paper E are calculated from time-frequency representations using aframe size of 20 ms with 50% overlap. This decimation makes it necessary to upsamplethe binary mask before multiplying it with the subband signals, unless decimation has alsobeen used in the analysis filterbank. Furthermore, the binary gain should be smoothedto avoid modulation artifacts. The modulation artifacts are wideband artifacts (“clicks”)introduced by abrupt gain changes, see Figure 11. The modulation artifacts are lesspronounced, if the binary gain is low-pass filtered (smoothed) before the multiplicationwith the subband signals and will also be reduced by the bandpass filters in the synthesisfilterbank.
Finally, the synthesis filterbank transforms the modified signal from the time-frequencydomain back to the time domain. The synthesis filterbank is created by time-reversal ofthe Gammatone filters in the analysis filterbank. This method compensates for phaseshifts introduced by the analysis filterbank and reduces the modulation artifacts from thebinary gains.
7.2 Short-Time Fourier Transform
Another useful method for binary masking is the discrete short-time Fourier transform(STFT) [66, 67, 68]. The result of the short-time Fourier transform is frequency channelswith equal bandwidths and linearly spaced center-frequencies in Hz as seen in Figure 10.
When the STFT is used for binary masking, the binary mask can be applied by multi-plying the binary mask with the magnitudes of the STFT. One example of binary maskingusing the STFT is [35], where the Fast Fourier transform (FFT) is applied to 20 ms seg-ments with 50% overlap. The binary mask is multiplied with the FFT magnitudes, and theinverse FFT is applied to the modified magnitudes using the phases from the unmodifiedinput signal. Finally, the resulting short time segments from the inverse FFT are combinedusing the overlap-add-method (OLA).
7.3 Temporal and Spectral Resolution
A main difference between the Gammatone filterbank and the STFT is the spectral resolu-tion. Because the Gammatone filterbank resembles the processing in the human auditorysystem, it is often used for speech processing and perceptual studies. The STFT can alsobe used but has the drawback of requiring more frequency channels to obtain the samespectral resolution at low frequencies than the Gammatone filterbank.
A setup for experiments focusing on intelligibility could use 64 Gammatone filters inthe filterbank equally spaced between 50 Hz and 10 kHz on the ERBn frequency scale.A higher number of frequency channels, larger bandwidth of the filterbank, or narrowerfrequency channels could potentially increase sound quality, but 64 frequency channelsare enough to achieve high intelligibility [69] (see also Paper B and Paper C). In manystudies, the temporal resolution is 20 ms with 50% overlap [35, 36, 70]. The quasi-stationarity of speech makes a time resolution of 20 ms a reasonable choice, and the

8. TIME-FREQUENCY MASKING 19
0
1
Ga
in
A
0
1
Ga
in
C
Time [s]
Fre
quency [kH
z] B
0 0.1 0.3 0.4 0.5
2
4
6
8
10
Time [s]
Fre
quency [kH
z] D
0 0.1 0.3 0.4 0.5
2
4
6
8
10
0 dB10 dB20 dB30 dB40 dB50 dB60 dB70 dB80 dB
Figure 11: Multiplication of a 4 kHz sine and the binary gain with and without smooth-ing. If the gain (A) is multiplied with a 4 kHz tone (B), a broadband artifact will beintroduced where the gain changes from zero to one or vice versa. A listener will perceivethese artifacts as clicks in the sound. If the gain is smoothed by low-pass filtering with a400 tap (20 ms) Hanning window (C), the artifacts are less pronounced (D).
widespread use of 20 ms temporal resolution makes it easier to compare results betweendifferent studies.
8 Time-Frequency Masking
Binary masking can be seen as a subset of a larger category of algorithms which applies afrequency-dependent and time-varying gain to a number of frequency bands, where thegain is not limited to binary values. This type of algorithms can be referred to as time-frequency masking algorithms, or short-time spectral attenuation [71]. When the gainis not limited to binary values, the possibility of attenuation changes the simple, binarydecision into a more complex decision of how much each time-frequency unit should beattenuated. In many speech enhancement and noise reduction algorithms, this decisionis based on the a priori SNR [72, 73, 74], and the classic algorithms like Wiener filtering,spectral subtraction, and maximum likelihood, can be formulated as a function of this apriori SNR [74]. In real-life applications, the a priori SNR must be estimated, but in theideal situation the local SNR can be used instead of the a priori SNR. This leads to thefollowing formulation of the Wiener filter [71]:
MW (k, τ) =T(k, τ)
T(k, τ) +N(k, τ), (10)
where T(k, τ) and N(k, τ) is the energy of the target and interferer sounds, respectively.This formulation can be used to compare the gain from the Wiener filter and the idealbinary mask as seen in Figures 12 and 13.
The ideal binary mask produces a mask with values of zero and one, whereas theWiener filter produces a mask with gain values ranging from zero to one. However, if theoverlap between the target and interferer sound in the time-frequency domain is limited,the difference in the applied gain between the ideal binary mask and the Wiener filteris small as illustrated in Figure 14. If each time-frequency unit contains only target orinterferer energy, the local SNR will be −∞ dB or +∞ dB resulting in a gain of −∞ dB
20 INTRODUCTION
−30 −20 −10 0 10 20 30
0
0.1
0.2
0.3
0.4
0.5
0.6
0.7
0.8
0.9
1
local SNR [dB]
Gain
A
−30 −20 −10 0 10 20 30−60
−50
−40
−30
−20
−10
0
local SNR [dB]
Gain
[d
B]
B
Ideal Binary Mask, LC = 0 dB
Ideal Binary Mask, LC = 12 dB
Wiener filter
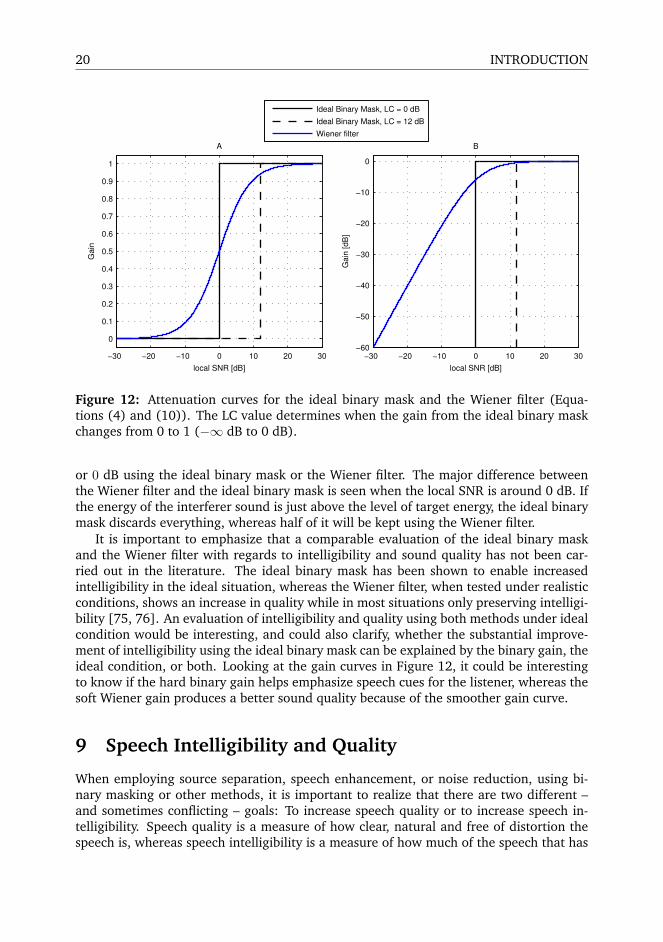
Figure 12: Attenuation curves for the ideal binary mask and the Wiener filter (Equa-tions (4) and (10)). The LC value determines when the gain from the ideal binary maskchanges from 0 to 1 (−∞ dB to 0 dB).
or 0 dB using the ideal binary mask or the Wiener filter. The major difference betweenthe Wiener filter and the ideal binary mask is seen when the local SNR is around 0 dB. Ifthe energy of the interferer sound is just above the level of target energy, the ideal binarymask discards everything, whereas half of it will be kept using the Wiener filter.
It is important to emphasize that a comparable evaluation of the ideal binary maskand the Wiener filter with regards to intelligibility and sound quality has not been car-ried out in the literature. The ideal binary mask has been shown to enable increasedintelligibility in the ideal situation, whereas the Wiener filter, when tested under realisticconditions, shows an increase in quality while in most situations only preserving intelligi-bility [75, 76]. An evaluation of intelligibility and quality using both methods under idealcondition would be interesting, and could also clarify, whether the substantial improve-ment of intelligibility using the ideal binary mask can be explained by the binary gain, theideal condition, or both. Looking at the gain curves in Figure 12, it could be interestingto know if the hard binary gain helps emphasize speech cues for the listener, whereas thesoft Wiener gain produces a better sound quality because of the smoother gain curve.
9 Speech Intelligibility and Quality
When employing source separation, speech enhancement, or noise reduction, using bi-nary masking or other methods, it is important to realize that there are two different –and sometimes conflicting – goals: To increase speech quality or to increase speech in-telligibility. Speech quality is a measure of how clear, natural and free of distortion thespeech is, whereas speech intelligibility is a measure of how much of the speech that has

9. SPEECH INTELLIGIBILITY AND QUALITY 21
Time [s]
Fre
quency [H
z]
(A) Ideal binary mask
0 0.3 0.6 0.9 1.1 1.4 1.7 280
265
560
1032
1787
2992
4920
8000
Time [s]
Fre
quency [H
z]
(B) Wiener filter
0 0.3 0.6 0.9 1.1 1.4 1.7 280
265
560
1032
1787
2992
4920
8000
0.0
0.1
0.2
0.3
0.4
0.5
0.6
0.7
0.8
0.9
1.0
Figure 13: Examples of the ideal binary mask (A) and the Wiener gain (B) calculatedfrom a mixture of male and female speech at 0 dB SNR.
been perceived correctly and recognized. Intelligibility is measured by “recognition” andnot by “how much was understood”, because some listening tests use nonsense wordswhich cannot be understood, but only recognized correctly [77].
The difference between intelligibility and quality can be illustrated with the followingexample: If a recording of a sentence is played to a person and the purpose is to mea-sure intelligibility, the person could be asked to repeat the sentence, or by other meansreproduce the perceived sentence or words. From the listener’s response, intelligibilitycan be measured, e.g., by the percentage of correctly recognized words, or by the levelof noise allowing 50% of the words to be correctly recognized. If, instead, the person isasked his opinion about the quality of the speech without any further instructions, theanswer might easily be “compared to what?” If no reference is established when qualityis being evaluated, answers like “fine” or “bad” are of very little use unless the listenersare highly trained or expert listeners. Quality is a subjective measure depending on theusers’ individual reference and experience, whereas intelligibility is an objective measure,because the result of the intelligibility test is not affected by the listeners’ subjective judge-ments. However, this objectivity does not imply that intelligibility is an absolute measure,because the results are dependent on speech material (stimuli), conditions, training, pos-sibility of repeating the stimuli, etc. If the task is to identify words in noise, the results willalso depend on the used words, compare for example “house”, “bridge”, and “airplane”to “cat”, “hat”, and “bat”. The last three words would be more difficult to distinguishbecause they only differ by the first consonant.
It is important to distinguish between quality and intelligibility to keep a well-definedobjective when developing new speech algorithms. Increasing speech intelligibility doesnot automatically increase speech quality or vice versa [10]. It seems to be a difficult taskto obtain both objectives at the same time, and the reason might be that they conflict, e.g.if intelligibility is increased by enhancement of the speech cues like onsets and offsets,and quality is increased by a more smooth sound.
The ideal binary mask is able to increase intelligibility under several conditions, butaccording to my knowledge a concurrent subjective evaluation of intelligibility and qual-ity using the ideal binary mask has not yet been carried out. If the ideal binary maskis applied to the sound mixture using a small number of frequency channels (e.g. 16frequency channels), the quality will most likely be affected. If the separated speech is

22 INTRODUCTION
| −27 −24 −21 −18 −15 −12 −9 −6 −3 00
10
20
30
40
50
60
70
80(A) Ideal binary mask, interferer = 1 speaker
Pe
rce
nta
ge [%
]
Gain [dB]< −28.5
| −27 −24 −21 −18 −15 −12 −9 −6 −3 00
10
20
30
40
50
60
70
80
Pe
rce
nta
ge [%
]
Gain [dB]
(B) Wiener filter, interferer = 1 speaker
< −28.5
| −27 −24 −21 −18 −15 −12 −9 −6 −3 00
10
20
30
40
50
60
70
80(C) Ideal binary mask, interferer = 2 speakers
Perc
enta
ge [%
]
Gain [dB]< −28.5
| −27 −24 −21 −18 −15 −12 −9 −6 −3 00
10
20
30
40
50
60
70
80
Perc
enta
ge [%
]
Gain [dB]
(D) Wiener filter, interferer = 2 speakers
< −28.5
| −27 −24 −21 −18 −15 −12 −9 −6 −3 00
10
20
30
40
50
60
70
80(E) Ideal binary mask, interferer = 4 speakers
Perc
enta
ge [%
]
Gain [dB]< −28.5
| −27 −24 −21 −18 −15 −12 −9 −6 −3 00
10
20
30
40
50
60
70
80
Perc
enta
ge [%
]
Gain [dB]
(F) Wiener filter, interferer = 4 speakers
< −28.5
Figure 14: Distribution of gain values with the ideal binary mask and the Wiener filter.The gain using the ideal binary mask is either −∞ or 0 dB, whereas the gain using theWiener filter is in the range −∞ to 0 dB. However, the highest percentages of gain val-ues using the Wiener filter are found at 0 dB or below −27 dB. Five minutes of targetsound (male speaker) and interferer sound is used to calculate the local SNR in all time-frequency units. In (A) and (B) the interferer sound is one female speaker. In (C) and(D) the interferer sound is one female and one male speaker. In (E) and (F) the interferersound is two female and two male speakers. All speakers are normalized to the same en-ergy, so the global SNR decreases as more speakers are added to the interferer sound. Tocalculate the local SNR, a 64 channel Gammatone filterbank (80–8000 Hz) is used withcenter-frequencies equally spaced on the ERBn scale. The output from the filterbank isdivided into 20 ms time-segments with 50% overlap.

9. SPEECH INTELLIGIBILITY AND QUALITY 23
compared to the clean target speech, the quality will probably be perceived as lower,whereas, if compared to the original mixture, quality will probably be perceived as beinghigher. Listeners might perceive higher intelligibility as higher quality.
9.1 What makes Speech Intelligible?
Although intelligibility of speech has been a research area for many decades, the questionof “what makes speech intelligible?” has not yet been completely answered. If the ques-tion is broadened to “what makes speech intelligible at the cocktail party” the answeringbecomes even more complex. The purpose of the following section is not to provide acomplete answer, but to identify elements within speech and perception that are fun-damental to intelligibility or which contribute to the intelligibility of speech. Differentanswers to the question “what makes speech intelligible?” can be roughly sorted into thefollowing three groups:
1. Fundamental speech cues are necessary for intelligibility and to distinguish dif-ferent phonemes in the language. If the fundamental speech cues are modified ormissing, the lexical meaning can change and intelligibility will be reduced.
• Formants are resonances in the oral cavity generated by constrictions usingthe tongue and the lips. Different vowels are distinguished mainly by the two,lowest formants found between 300 and 2500 Hz [78, 79].
• Onsets and offsets indicate where words begin and end, and they divide thespeech into smaller units.
• Consonants are discriminated by place, manner, and voicing [79, 80, 81].Because consonants have less energy than vowels, they are less robust in noisyconditions [82].
2. Supplementary speech cues contribute to the correct perception of speech in noisyconditions. These cues are not fundamental to intelligibility because high intelligi-bility can be obtained without these cues being available. However, if the com-plementary speech cues are missing due to noisy conditions, it is more likely thatintelligibility is affected since the listener will find it more difficult to identify andseparate the target speech.
• Pitch determines the gender of the speaker, and can be used to follow a singlespeaker in noisy conditions [83, 84, 85, 86]. However, pitch is not crucial forintelligibility in noise free conditions, as experiments with sine-wave-speech[87, 88, 89], vocoding [42, 41], or binary masking (Paper B) show. In someAsian and African languages, pitch is a fundamental speech cue, because pitchchanges can change the lexical meaning of a word or sentence [79].
• Spatial location is information about the location of the speaker in the envi-ronment, and the binaural cues interaural time difference (ITD), and interaurallevel difference (ILD), are useful to segregate target from interferer [53, 90, 4].
• Harmonicity can be in simultaneous grouping across frequencies to decidewhether a sound segment belongs to the same speaker [55]. If the harmonicstructure at low frequencies is different from the harmonic structure at highfrequencies, the two sound segments do not originate from the same speaker.
24 INTRODUCTION
3. High level processes can be used to further process the perceived speech in the hu-man auditory system and increase intelligibility. Whereas the previous two groupsof contributing factors are characteristics of the perceived sound, the high levelprocesses are located somewhere in the human auditory system.
• Redundancy and phonetic restoration of speech is important for intelligibilityin noisy conditions. If some parts of the speech is inaudible because of noise,the remaining parts can be used to perceive what was being said (see e.g.[23, 25, 91, 24]). The recognition of a word is not dependent on one, uniquerealization of the word – many sounds or acoustic patterns can lead to the sameperception. It has been shown that a few unobstructed glimpses in time andfrequency of the target speech can be enough to achieve a high intelligibility[26], and that the size and amount of these glimpses have a high correlationwith intelligibility [92].
• Context helps to determine the correct words, if the speech was not perceivedcorrectly. Context works on many levels by limiting the number of possiblewords that can be chosen to substitute the wrongly perceived word. Knowl-edge about, e.g., the spoken language, the speaker, and the subject of theconversation reduces the context entropy [77].
• Auditory-visual integration is the use of visual information to help recognizethe speech correctly [93, 8]. The visual impact on speech perception is strong,and conflicting auditory and visual cues has been shown to create a differentperception – the McGurk effect [94]. For hearing impaired listeners, auditory-visual integration in terms of lip-reading can be a fundamental speech cue.
• Continuity and illusion of continuity is the auditory equivalent of the Gestaltprinciple of closure [47]. If a sound is masked by a louder sound, we expectthe masked sound to continue “behind” the louder sound [24], e.g., if a toneis masked by a noise burst. This illusion or principle helps to restore missingspeech sound that was masked by the interferer.
9.2 Evaluation of Speech Intelligibility
Having defined speech intelligibility and considered the elements contributing to it, it isof interest to consider how intelligibility can be evaluated and measured. Basically, thiscan be done in two ways; either by subjective evaluation using human listeners or byobjective evaluation by means of an algorithm. The advantage of using listeners is thereliability of the result, but it comes at the price of a more demanding process. On theother hand, the objective evaluations are quicker to carry out, but less reliable.
Objective Evaluation of Speech Intelligibility
Objective evaluations are based on models of the human perception and calibrated usingresults from listening tests, but since the understanding of the human auditory system isnot yet complete, these models are also incomplete and to some extent unreliable. Thisis not to say that objective evaluations should be avoided – they can be of great help inthe development of new algorithms and point out problems or wrong directions in thisprocess – but it is important to interpret the results correctly and know the limitations

9. SPEECH INTELLIGIBILITY AND QUALITY 25
of the model. Some objective evaluations are based on simplified models and calibratedusing a limited amount of data, e.g., the nSec measure in Paper F or the HIT-FA [50]. Withthese types of simple, objective evaluations it is very important to consider and discussthe result and the possible generalization of the method, although this type of criticismmust be applied to all objective evaluations.
A well-known objective measure of intelligibility is the Articulation Index (AI) [95]which is based on calculation of the SNR in a number of independent frequency bands.The AI has been further developed into the speech intelligibility index (SII) [96], thespeech transmission index (STI) [97], and a number of variants of these methods [98,99]. These objective measures have a reliable performance in additive noise, but precisionis reduced when non-linear processing like binary masking is used [100, 101]. Recently,an objective measure based on cross-correlation between the pre-processed test signal andthe reference signal [100] showed a fine concordance with the results from the listeningtest in paper C. The pre-processing was implemented using the auditory model from[102]. A similar, but simpler approach, is used in the nSec measure described in Paper E.
The above mentioned objective evaluations are used to measure the performance ofa particular algorithm or concept, but may also serve a different purpose: to provideinsight into and understanding of what makes speech intelligible. If the models of speechperception correlate well with results obtained in subjective listening test, these modelscan be used as explanations of how speech intelligibility is obtained [84, 92].
Subjective Evaluation of Speech Intelligibility
A subjective evaluation is more demanding than an objective evaluation, because of theuse of human listeners. Subjective evaluations are carried out by playing a stimuli to thelistener and measure intelligibility from his response. The stimuli can be various sets ofspeech material (corpus) from short nonsense words to long sentences. In the subjectivelistening tests in the Papers A–C, the Dantale II corpus was used [103]. This corpusconsists of syntactically fixed but semantically unpredictable sentences. This means thateach sentence in the Dantale II corpus has the same structure with name, verb, numeral,adjective, and object, e.g., “Anders receives six fine cars” or “Linda owns ten old jackets”.It is not possible to guess any particular word from the preceding or following words.
An important consideration when creating and using a corpus for subjective listeningtests is the context entropy [77]. High context entropy means that listeners have a smallprobability of being able to predict a word from previous or following words in a sen-tence, and high context entropy is preferable since it is not the listeners’ ability to predictwhich is to be measured in a subjective listening test. To maximize the context entropy,nonsense words or syllables can be used. In the Dantale II corpus, context entropy ismaximized by carefully selecting 10 different words in each category (name, verb, etc.).The limited number of words in each place in the sentence makes the Dantale II corpus aclosed set, and even though the number of different sentences is large, over time listenerswill learn the different words occurring in the sentences as well as the structure of thesentences. Thus some training effect exists when using the Dantale II corpus, and thistraining effect must be taken into consideration when planning the listening test, e.g., byallowing the test person to listen to a number of test sequences before the measurementof intelligibility is initialized.

26 INTRODUCTION
−10 −5 0 5 100
25
50
75
100
SNR [dB]
Perc
enta
ge c
orr
ect [%
]
SRT
Figure 15: The speech reception threshold (SRT) shown on the psychometric function.The speech reception threshold is the SNR at which 50% of the stimuli (e.g. words) arecorrectly recognized. Please note, that higher SRT is lower performance [17].
To measure intelligibility, the number of correctly identified words can be counted,or an adaptive test can be used, in which the condition, e.g., the SNR, changes as afunction of the response from the subject. In Paper B and Paper C, the number of correctlyrecognized words in each Dantale II sentence was used to measure the intelligibility. InPaper A and Paper C, the speech reception threshold (SRT) was used. The SRT is ameasure of the required SNR allowing 50% correct recognition. The SRT is a point ona psychometric curve showing intelligibility as a function of SNR (see Figure 15). If theslope of the psychometric curve is a necessary parameter, at least two points on the curvemust be measured as done in Paper C, where the 20% and 80% correct recognition wereused to establish the psychometric curve.
10 Contributions
The papers that form the main body of this thesis fall into two groups. The first groupcomprising papers A–C is based on subjective listening tests, and contributes to the knowl-edge and understanding of speech intelligibility and how this can be improved usingbinary masks. In the second group of papers (D and E) the knowledge obtained in pa-pers A–C is used in real-life applications for estimation and error-correction of the oraclemasks. In Paper F, a method for objective evaluation of intelligibility is proposed basedon the results obtained with the oracle masks.
Paper A: In this paper, the intelligibility of ideal binary masked noisy speech is evaluatedusing hearing impaired and normal hearing listeners. The results confirm previousresults [36] and further show that hearing impaired listeners also achieve a largeincrease in intelligibility from the ideal binary mask. The increase in intelligibilityfor the hearing impaired listeners is higher than for normal hearing listeners in thetwo noise conditions tested, and this results in a similar performance of the twogroups when the ideal binary mask is used on noisy speech.

11. CONCLUSION 27
Paper B: Based on the finding that applying the ideal binary mask to pure noise willgenerate highly intelligible speech, this paper investigates how large a number ofchannels is required using normal hearing listeners. When the ideal binary maskis applied to speech-shaped noise, the noise is modulated with a very coarse en-velope from the target speech. This method generates a new type of artificial, butintelligible, speech with highly reduced temporal and spectral information similarto vocoding and sine-wave-speech [40, 41, 42, 43, 87].
Paper C: In this paper, the method from paper B is formalized by the definition of the tar-get binary mask (Equation (5)). The impact on speech intelligibility from the idealbinary mask and target binary mask is examined and shows high intelligibility for arange of mask densities, different noise types, and SNR levels. These results makethe method from paper B even more interesting by showing that high intelligibilitycan be obtained by modulating different noise types with either the target binarymask or the ideal binary mask.
Paper D: The substantial increase in intelligibility obtained by using the ideal binarymask makes it interesting to try to estimate the ideal binary mask in real-life ap-plications. This paper introduces a simple method for estimating the ideal binarymask using a directional system with two microphones in a configuration similar towhat is found in a hearing aid. The results show that the ideal binary mask can beestimated with high precision in the evaluated conditions, measured by the numberof correct time-frequency units.
Paper E: Realizing that most real-life estimates of the ideal binary mask or the targetbinary mask will contain errors, a method for correcting these errors is proposedand evaluated. The focus in this paper is error-correction of the target binary maskusing hidden Markov models, and it is shown how a model of the target binarymask can be build and used to reduce errors in the target binary mask.
Paper F: This paper introduces a simple method for objective evaluation of speech in-telligibility and a model of how intelligibility is obtained. The method is based onthe results in Paper C showing that intelligible speech can be created by modulatingnoise sounds with the target binary mask or the ideal binary mask. This knowledgeis used in the intelligibility model which is based upon the correlation in time andfrequency between the target and the processed speech.
11 Conclusion
The diversity of the contributions in this thesis allows only for a very general overallconclusion, but the obtained results attempt to narrow the gap between binary maskingunder ideal conditions and binary masking under more realistic conditions. The resultsobtained under ideal conditions show that high intelligibility can be obtained with binarymasking in a variety of mixtures of speech and interferers for both normal hearing lis-teners and hearing impaired listeners. The results under more realistic conditions showthat it is indeed possible to obtain reasonable estimates of the ideal binary mask and thetarget binary mask under more realistic conditions.

28 INTRODUCTION
In the first group of papers (A–C), it was confirmed that binary masking could beuseful for the hearing impaired, and the requirements for obtaining high intelligibilityhave been relaxed: High intelligibility using binary masking does not require a largenumber of frequency channels, target sound does not need to be present in the mixture,and prior knowledge of the interferer sound is not required. These relaxed requirementsfor high intelligibility using binary masking have increased the potential for the use ofbinary masking in hearing aids or other devices where intelligibility is a major concern.
On the opposite side of the gap, the papers in the second group (D–E) have focusedon how to obtain the ideal and target binary mask in more realistic conditions and withlimited resources. It was shown that the ideal binary mask can be estimated with highprecision using a directional system with low complexity, and that a speaker-independentmodel of the target binary mask can be build and used to correct errors.
Although the gap between results under ideal conditions and more realistic conditionshas been narrowed, it has not been closed. Hearing aids with true user benefits obtainedthrough binary masking remain to be seen. To get to that point, more knowledge aboutthe impact on intelligibility and quality from binary masking must be obtained – in par-ticular for hearing impaired listeners. Binary masking can negatively influence soundquality, but it is not evident from existing studies how hearing impaired listeners willperceive and judge the sound quality. It is also important to deepen the understanding ofhow intelligibility is affected by the binary mask. As shown, the ideal binary mask and thetarget binary mask are able to increase intelligibility by a large amount, but situations canbe found, where the method could fail, e.g., when more difficult recognition tasks such asconsonant identification are considered. To enable the use of binary masking in hearingaids, algorithms must meet the fundamental requirements of low delay, low complexity,and high robustness. This is not easy to achieve, but if the human auditory system wereunderstood to a larger extent, it might be possible to generalize and simplify the usedmethods into efficient algorithms.

REFERENCES 29
References
[1] E. C. Cherry, “Some experiments on the recognition of speech, with one and twoears,” Journal of the Acoustical Society of America, vol. 25, no. 5, pp. 975–979,1953.
[2] H. von Helmholtz, Tonempfindungen, als physiologische grundlage für die theorie dermusik, 3rd ed. Braunschweig: Verlag von Friedrich Vieweg u. Sohn, 1870.
[3] ——, On the sensations of tone, 2nd ed. New York, NY: Dover Publications Inc.,1954.
[4] A. W. Bronkhorst, “The cocktail party phenomenon: A review of research onspeech intelligibility in multiple-talker conditions,” Acta Acustica united with Acus-tica, vol. 86, no. 1, pp. 117–128, 2000.
[5] S. Haykin and Z. Chen, “The cocktail party problem,” Neural Computation, vol. 17,pp. 1875–1902, 2005.
[6] J. M. Festen and R. Plomp, “Effects of fluctuating noise and interfering speech onthe speech-reception threshold for impaired and normal hearing,” Journal of theAcoustical Society of America, vol. 88, no. 4, pp. 1725–1736, 1990.
[7] R. W. Peters, B. C. J. Moore, and T. Baer, “Speech reception thresholds in noisewith and without spectral and temporal dips for hearing-impaired and normallyhearing people,” Journal of the Acoustical Society of America, vol. 103, no. 1, pp.577–587, January 1998.
[8] J. G. W. Bernstein and K. W. Grant, “Auditory and auditory-visual intelligibility ofspeech in fluctuating maskers for normal-hearing and hearing-impaired listeners,”Journal of the Acoustical Society of America, vol. 125, no. 5, pp. 3358–3372, 2009.
[9] H. Dillon, Hearing aids, 1st ed. Boomertang Press/Thieme, 2001.
[10] P. C. Loizou, Speech enhancement: theory and practice, 1st ed. CRC Press, 2007.
[11] A. Hyvärinen, J. Karhunen, and E. Oja, Independent component analysis. Wiley,2001.
[12] M. N. Schmidt, “Single-channel source separation using non-negative matrix fac-torization,” Ph.D. dissertation, Technical University of Denmark, 2008.
[13] B. Edwards, “Beyond amplification: Signal processing techniques for improvingspeech intelligibility in noise with hearing aids,” Seminars In Hearing, vol. 21,no. 2, pp. 137–156, 2000.
[14] S. Kochin, “MarkeTrak VII: Customer satisfaction with hearing instruments in thedigital age,” The Hearing Journal, vol. 58, no. 9, pp. 30–43, 2005.
[15] B. Edwards, “Hearing aids and hearing impairment,” in Speech Processing in theAuditory System, S. Greenberg, W. Ainsworth, A. N. Popper, and R. R. Fay, Eds.New York, NY: Springer, 2004, pp. 339–421.

30 INTRODUCTION
[16] A. Schaub, Digital hearing aids, 1st ed. New York, NY: Thieme, 2008.
[17] B. C. J. Moore, “Speech processing for the hearing-impaired: successes, failures,and implications for speech mechanisms,” Speech Communication, vol. 41, no. 1,pp. 81–91, 2003.
[18] D. W. Robinson and G. J. Sutton, “Age effect in hearing - a comparative analysisof published threshold data,” International Journal of Audiology, vol. 18, no. 4, pp.320–334, 1979.
[19] R. R. Gacek and H. F. Schuknecht, “Pathology of presbycusis,” International Journalof Audiology, vol. 8, no. 2-3, pp. 199–209, 1969.
[20] B. C. J. Moore, Cochlear hearing loss, 2nd ed. Wiley, 2007.
[21] I. Shapiro, “Evaluation of Relationship Between Hearing Threshold and LoudnessDiscomfort Level in Sensorineural Hearing Loss,” Journal of Speech and HearingDisorders, vol. 44, pp. 31–36, 1979.
[22] E. Zwicker and K. Schorn, “Temporal resolution in hard-of-hearing patients,” Inter-national Journal on Audiology, vol. 21, no. 6, pp. 474–492, 1982.
[23] G. A. Miller and J. C. R. Licklider, “The intelligibility of interrupted speech,” TheJournal of the Acoustical Society of America, vol. 22, no. 2, pp. 167–173, 1950.
[24] R. M. Warren, “Perceptual restoration of missing speech sounds.” Science, vol. 167,no. 3917, pp. 392–393, 1970.
[25] P. Howard-Jones and S. Rosen, “Uncomodulated glimpsing in ’checkerboard’noise,” Journal of the Acoustical Society of America, vol. 93, no. 5, pp. 2915–2922,1993.
[26] M. Cooke, “Glimpsing speech,” Journal of Phonetics, vol. 31, no. 3-4, pp. 579–584,2003.
[27] H. Levitt, “Noise reduction in hearing aids: A review,” Journal of RehabilitationResearch and Development, vol. 38, no. 1, pp. 111–121, 2001.
[28] J. M. Kates and M. R. Weiss, “A comparison of hearing-aid array-processing tech-niques,” Journal of the Acoustical Society of America, vol. 99, no. 5, pp. 3138–3148,1996.
[29] J. Agnew and J. M. Thornton, “Just noticeable and objectionable group delays indigital hearing aids,” Journal of the American Academy of Audiology, vol. 11, no. 6,pp. 330–336, 2000.
[30] H. Dillon, G. Keidser, A. O’Brien, and H. Silberstein, “Sound quality comparisonsof advanced hearing aids,” Hearing Journal, vol. 56, no. 4, pp. 1–6, 2003.
[31] O. Yilmaz and S. Rickard, “Blind separation of speech mixtures via time-frequencymasking,” IEEE Transactions on Signal Processing, vol. 52, no. 7, pp. 1830–1847,2004.

REFERENCES 31
[32] Y. Shao and D. Wang, “Sequential organization of speech in computational audi-tory scene analysis,” Speech Communication, vol. 51, no. 8, pp. 657–667, 2009.
[33] G. Hu and D. Wang, “A tandem algorithm for pitch estimation and voiced speechsegregation,” IEEE Transactions on Audio, Speech, and Language Processing, vol. 18,no. 8, pp. 2067–2079, 2010.
[34] Y. Hu and P. C. Loizou, “A new sound coding strategy for suppressing noise incochlear implants,” Journal of the Acoustical Society of America, vol. 124, no. 1, pp.498–509, 2008.
[35] N. Li and P. C. Loizou, “Factors influencing intelligibility of ideal binary-maskedspeech: Implications for noise reduction,” Journal of the Acoustical Society of Amer-ica, vol. 123, no. 3, pp. 1673–1682, 2008.
[36] D. S. Brungart, P. S. Chang, B. D. Simpson, and D. Wang, “Isolating the energeticcomponent of speech-on-speech masking with ideal time-frequency segregation,”Journal of the Acoustical Society of America, vol. 120, no. 6, pp. 4007–4018, 2006.
[37] J. J. Burred and T. Sikora, “On the use of auditory representations for sparsity-based sound source separation,” 2005 5th International Conference on InformationCommunications and Signal Processing, pp. 1466–1470, 2005.
[38] S. T. Roweis, “Factorial models and refiltering for speech separation and denois-ing,” in Proceedings of Eurospeech, September 2003, pp. 1009–1012.
[39] N. Hurley and S. Rickard, “Comparing measures of sparsity,” IEEE Transactions onInformation Theory, vol. 55, no. 10, pp. 4723–4741, 2009.
[40] H. Dudley, “Remaking speech,” Journal of the Acoustical Society of America, vol. 11,no. 2, pp. 169–177, 1939.
[41] R. V. Shannon, F.-G. Zeng, V. Kamath, J. Wygonski, and M. Ekelid, “Speech recog-nition with primarily temporal cues,” Science, vol. 270, no. 5234, pp. 303–304,1995.
[42] M. F. Dorman, P. C. Loizou, and D. Rainey, “Speech intelligibility as a function ofthe number of channels of stimulation for signal processors using sine-wave andnoise-band outputs,” Journal of the Acoustical Society of America, vol. 102, no. 4,pp. 2403–2411, 1997.
[43] P. C. Loizou, M. Dorman, and Z. Tu, “On the number of channels needed to un-derstand speech,” Journal of the Acoustical Society of America, vol. 106, no. 4, pp.2097–2103, 1999.
[44] M. Anzalone, L. Calandruccio, K. Doherty, and L. Carney, “Determination of thepotential benefit of time-frequency gain manipulation,” Ear and Hearing, vol. 27,no. 5, pp. 480–492, 2006.
[45] G. J. Brown and M. P. Cooke, “Computational auditory scene analysis,” ComputerSpeech and Language, vol. 8, pp. 297–336, 1994.

32 INTRODUCTION
[46] D. Wang and G. J. Brown, Eds., Computational auditory scene analysis. Hoboken,New Jersey: Wiley & IEEE Press, 2006.
[47] A. S. Bregman, Auditory scene analysis, 2nd ed. MIT Press, 1990.
[48] M. Cooke and D. Ellis, “The auditory organization of speech and other sources inlisteners and computational models,” Speech Communication, vol. 35, no. 3-4, pp.141–177, 2001.
[49] D. Wang, “On ideal binary mask as the computational goal of auditory scene anal-ysis,” in Speech Separation by Humans and Machines, P. Divenyi, Ed. Kluwer Aca-demic, 2005, pp. 181–197.
[50] G. Kim, Y. Lu, Y. Hu, and P. C. Loizou, “An algorithm that improves speech intel-ligibility in noise for normal-hearing listeners,” Journal of the Acoustical Society ofAmerica, vol. 126, no. 3, pp. 1486–1494, 2009.
[51] M. Cooke, P. Green, L. Josifovski, and A. Vizinho, “Robust automatic speech recog-nition with missing and unreliable acoustic data,” Speech Comm., vol. 34, no. 3,pp. 267–285, 2001.
[52] N. Roman, D. Wang, and G. J. Brown, “Speech segregation based on sound localiza-tion,” Journal of the Acoustical Society of America, vol. 114, no. 4, pp. 2236–2252,2003.
[53] B. C. J. Moore, An introduction to the psychology of hearing, 5th ed. AcademicPress, 2004.
[54] D. Wang, “Time-frequency masking for speech separation and its potential for hear-ing aid design,” Trends in Amplification, vol. 12, no. 4, pp. 332–353, 2008.
[55] G. Hu and D. Wang, “Monaural speech segregation based on pitch tracking andamplitude modulation,” IEEE Transactions on Neural Networks, vol. 15, no. 5, pp.1135–1150, 2004.
[56] ——, “Segregation of unvoiced speech from nonspeech interference,” Journal ofthe Acoustical Society of America, vol. 124, no. 2, pp. 1306–1319, 2008.
[57] Y. Hu and P. Loizou, “Techniques for estimating the ideal binary mask,” in Pro-ceedings of the 11th International Workshop on Acoustic Echo, and Noise Control,2008.
[58] Q. Li, “An auditory-based transform for audio signal processing,” in Proceedings ofIEEE Workshop on Applications of Signal Processing to Audio and Acoustics, 2009.
[59] M. K. I. Molla, K. Hirose, and N. Minematsu, “Separation of mixed audio signalsby source localization and binary masking with hilbert spectrum,” in IndependentComponent Analysis and Blind Signal Separation. Springer, 2006, vol. 3889, pp.641–648.
[60] S. Araki, H. Sawada, R. Mukai, and S. Makino, “Underdetermined blind sparsesource separation for arbitrarily arranged multiple sensors,” Signal Processing,vol. 87, no. 8, pp. 1833–1847, 2007.

REFERENCES 33
[61] N. Li and P. C. Loizou, “Factors influencing glimpsing of speech in noise,” Journalof the Acoustical Society of America, vol. 122, no. 2, pp. 1165–1172, 2007.
[62] J. Holdsworth, R. D. Patterson, I. Nimmo-Smith, and P. Rice, “SVOS final report,annex C: Implementing a GammaTone filterbank,” Rep. 2341, MRC Applied Psy-chology Unit., 1988.
[63] M. Slaney, “An efficient implementation of the Patterson-Holdsworth auditory filterbank,” Apple Computer, Perception Group – Advanced Technology Group, Tech.Rep. 35, 1993.
[64] B. R. Glasberg and B. C. J. Moore, “Derivation of auditory filter shapes fromnotched-noise data,” Hearing Research, vol. 47, no. 1-2, pp. 103–138, 1990.
[65] V. Hohmann, “Frequency analysis and synthesis using a Gammatone filterbank,”Acta Acustica united with Acustica, vol. 88, no. 3, pp. 433–442, 2002.
[66] T. F. Quatieri, Speech signal processing. Prentice Hall, 2002.
[67] J. B. Allen and L. R. Rabiner, “A unified approach to short-time fourier analysis andsynthesis,” Proceedings of the IEEE, vol. 65, no. 11, pp. 1558–1564, 1977.
[68] R. Crochiere, “A weighted overlap-add method of short-time Fourier analy-sis/synthesis,” IEEE Transactions on Acoustics, Speech, and Signal Processing,vol. 28, no. 1, pp. 99–102, 1980.
[69] N. Li and P. C. Loizou, “Effect of spectral resolution on the intelligibility of idealbinary masked speech,” Journal of the Acoustical Society of America, vol. 123, no. 4,pp. EL59–EL64, 2008.
[70] D. L. Wang and G. J. Brown, “Separation of speech from interfering sounds basedon oscillatory correlation,” IEEE Transactions on Neural Networks, vol. 10, no. 3,pp. 684–697, 1999.
[71] P. J. Wolfe and S. J. Godsill, “Efficient alternatives to the Ephraim and Malah sup-pression rule for audio signal enhancement,” EURASIP Journal on Applied SignalProcessing, vol. 2003, no. 10, pp. 1043–1051, 2003.
[72] P. C. Loizou, “Speech processing in vocoder-centric cochlear implants,” in Cochlearand Brainstem Implants, A. R. Møller, Ed. Basel, Switzerland: Advances in Oto-Rhino-Laryngology, Karger, 2006, vol. 64, pp. 109–143.
[73] R. C. Hendriks, “Advances in DFT-based single-microphone speech enhancement,”Ph.D. dissertation, Delft University of Technology, 2008.
[74] P. Scalart and J. V. Filho, “Speech enhancement based on a priori signal to noiseestimation,” in Proceedings of IEEE International Conference on Acoustics, Speechand Signal Processing, vol. 2. IEEE, 1996, pp. 629–632.
[75] Y. Hu and P. C. Loizou, “A comparative intelligibility study of single-microphonenoise reduction algorithms,” Journal of the Acoustical Society of America, vol. 122,no. 3, pp. 1777–1786, 2007.

34 INTRODUCTION
[76] Y. Hu and P. Loizou, “Subjective comparison and evaluation of speech enhance-ment algorithms,” Speech Communication, vol. 49, no. 7-8, pp. 588–601, 2007.
[77] J. B. Allen, “How do humans process and recognize speech?” IEEE Transactions onSpeech and Audio Processing, vol. 2, no. 4, pp. 567–577, 1994.
[78] J. R. Deller Jr., J. H. L. Hansen, and J. G. Proakis, Discrete-time processing of speechsignals, 1st ed. Wiley-Interscience, 2000.
[79] X. Huang, A. Acero, and H.-W. Hon, Spoken language processing, 1st ed. PrenticeHall, 2001.
[80] C. Christiansen, “Speech intelligibility prediction of linearly and nonlinearly pro-cessed speech in noise,” Master’s thesis, Technical University of Denmark, 2008.
[81] G. A. Miller and P. E. Nicely, “An analysis of perceptual confusions among someenglish consonants,” Journal of the Acoustical Society of America, vol. 27, no. 2, pp.338–352, 1955.
[82] P. Assmann and Q. Summerfield, “The perception of speech under adverse con-ditions,” in Speech Processing in the Human Auditory System, S. Greenberg,W. Ainsworth, A. N. Popper, and R. R. Fay, Eds. New York, NY: Springer-Verlag,2004, pp. 231–308.
[83] C. J. Darwin, D. S. Brungart, B. D. Simpson, and B. D. Simpson, “Effects of fun-damental frequency and vocal-tract length changes on attention to one of twosimultaneous talkers,” Journal of the Acoustical Society of America, vol. 114, no. 5,pp. 2913–2922, 2003.
[84] S. Srinivasan and D. Wang, “A model for multitalker speech perception,” Journalof the Acoustical Society of America, vol. 124, no. 5, pp. 3213–3224, 2008.
[85] D. S. Brungart, “Informational and energetic masking effects in the perception oftwo simultaneous talkers,” Journal of the Acoustical Society of America, vol. 109,no. 3, pp. 1101–1109, 2001.
[86] D. S. Brungart, B. D. Simpson, M. A. Ericson, and K. R. Scott, “Informational andenergetic masking effects in the perception of multiple simultaneous talkers,” Jour-nal of the Acoustical Society of America, vol. 110, no. 5, pp. 2527–2538, 2001.
[87] R. E. Remez, P. E. Rubin, D. B. Pisoni, and T. D. Carrell, “Speech perception withouttraditional speech cues,” Science, vol. 212, no. 4497, pp. 947–950, 1981.
[88] J. Barker, “The relationship between auditory organisation and speech perception:Studies with spectrally reduced speech,” Ph.D. dissertation, University of Sheffield,1998.
[89] J. Barker and M. Cooke, “Is the sine-wave speech cocktail party worth attending?”Speech Communication, vol. 27, no. 3-4, pp. 159–74, 1999.
[90] A. W. Bronkhorst and R. Plomp, “The effect of head-induced interaural time andlevel differences on speech intelligibility in noise,” Journal of the Acoustical Societyof America, vol. 83, no. 4, pp. 1508–1516, 1988.

REFERENCES 35
[91] M. Kashino, “Phonemic restoration: The brain creates missing speech sounds,”Acoustical Science and Technology, vol. 27, no. 6, pp. 318–321, 2006.
[92] M. Cooke, “A glimpsing model of speech perception in noise,” Journal of the Acous-tical Society of America, vol. 119, no. 3, pp. 1562–1573, 2006.
[93] K. W. Grant, J. B. Tufts, and S. Greenberg, “Integration efficiency for speech percep-tion within and across sensory modalities by normal-hearing and hearing-impairedindividuals,” Journal of the Acoustical Society of America, vol. 121, no. 2, pp. 1164–1176, 2007.
[94] H. McGurk and J. MacDonald, “Hearing lips and seeing voices,” Nature, vol. 264,no. 5588, pp. 746–748, 1976.
[95] N. R. French and J. C. Steinberg, “Factors governing the intelligibility of speechsounds,” Journal of the Acoustical Society of America, vol. 19, no. 1, pp. 90–119,1947.
[96] ANSI S3.5-1997, “American national standard: Methods for the calculation of thespeech intelligibility index,” 1997.
[97] H. J. M. Steeneken and T. Houtgast, “A physical method for measuring speech-transmission quality,” Journal of the Acoustical Society of America, vol. 67, no. 1,pp. 318–326, 1980.
[98] J. M. Kates and K. H. Arehart, “Coherence and the speech intelligibility index,”Journal of the Acoustical Society of America, vol. 117, no. 4, pp. 2224–2237, 2005.
[99] R. L. Goldsworthy and J. E. Greenberg, “Analysis of speech-based speech trans-mission index methods with implications for nonlinear operations,” Journal of theAcoustical Society of America, vol. 116, no. 6, pp. 3679–3689, 2004.
[100] C. Christiansen, M. S. Pedersen, and T. Dau, “Prediction of speech intelligibilitybased on an auditory preprocessing model,” Speech Communication, vol. 52, no.7-8, pp. 678–692, 2010.
[101] C. H. Taal, R. C. Hendriks, R. Heusdens, J. Jensen, and U. Kjems, “An evaluationof objective quality measures for speech intelligibility prediction,” in Proceedings ofInterspeech, 2009, pp. 1947–1950.
[102] T. Dau, B. Kollmeier, and A. Kohlrausch, “Modeling auditory processing of ampli-tude modulation. I. Modulation detection and masking with narrowband carriers,”Journal of the Acoustical Society of America, vol. 102, no. 5, pp. 2892–2905, 1997.
[103] K. Wagener, J. L. Josvassen, and R. Ardenkjaer, “Design, optimization and evalua-tion of a danish sentence test in noise.” International Journal of Audiology, vol. 42,no. 1, pp. 10–17, 2003.

36 INTRODUCTION

Paper A
Speech Intelligibility in Background Noise with
Ideal Binary Time-Frequency Masking
DeLiang Wang, Ulrik Kjems, Michael S. Pedersen,Jesper B. Boldt, and Thomas Lunner
Journal of the Acoustical Society of AmericaVol. 125, no. 4, pp. 2336–2347, April 2009.

c©2009 Acoustical Society of America
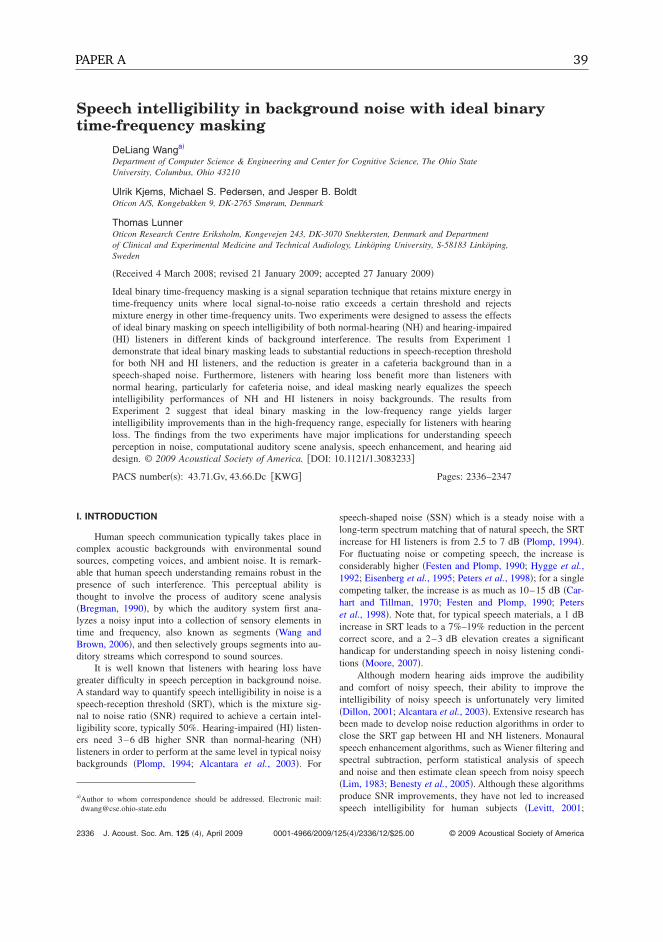
Speech intelligibility in background noise with ideal binarytime-frequency masking
DeLiang Wanga�
Department of Computer Science & Engineering and Center for Cognitive Science, The Ohio StateUniversity, Columbus, Ohio 43210
Ulrik Kjems, Michael S. Pedersen, and Jesper B. BoldtOticon A/S, Kongebakken 9, DK-2765 Smørum, Denmark
Thomas LunnerOticon Research Centre Eriksholm, Kongevejen 243, DK-3070 Snekkersten, Denmark and Departmentof Clinical and Experimental Medicine and Technical Audiology, Linköping University, S-58183 Linköping,Sweden
�Received 4 March 2008; revised 21 January 2009; accepted 27 January 2009�
Ideal binary time-frequency masking is a signal separation technique that retains mixture energy intime-frequency units where local signal-to-noise ratio exceeds a certain threshold and rejectsmixture energy in other time-frequency units. Two experiments were designed to assess the effectsof ideal binary masking on speech intelligibility of both normal-hearing �NH� and hearing-impaired�HI� listeners in different kinds of background interference. The results from Experiment 1demonstrate that ideal binary masking leads to substantial reductions in speech-reception thresholdfor both NH and HI listeners, and the reduction is greater in a cafeteria background than in aspeech-shaped noise. Furthermore, listeners with hearing loss benefit more than listeners withnormal hearing, particularly for cafeteria noise, and ideal masking nearly equalizes the speechintelligibility performances of NH and HI listeners in noisy backgrounds. The results fromExperiment 2 suggest that ideal binary masking in the low-frequency range yields largerintelligibility improvements than in the high-frequency range, especially for listeners with hearingloss. The findings from the two experiments have major implications for understanding speechperception in noise, computational auditory scene analysis, speech enhancement, and hearing aiddesign. © 2009 Acoustical Society of America. �DOI: 10.1121/1.3083233�
PACS number�s�: 43.71.Gv, 43.66.Dc �KWG� Pages: 2336–2347
I. INTRODUCTION
Human speech communication typically takes place incomplex acoustic backgrounds with environmental soundsources, competing voices, and ambient noise. It is remark-able that human speech understanding remains robust in thepresence of such interference. This perceptual ability isthought to involve the process of auditory scene analysis�Bregman, 1990�, by which the auditory system first ana-lyzes a noisy input into a collection of sensory elements intime and frequency, also known as segments �Wang andBrown, 2006�, and then selectively groups segments into au-ditory streams which correspond to sound sources.
It is well known that listeners with hearing loss havegreater difficulty in speech perception in background noise.A standard way to quantify speech intelligibility in noise is aspeech-reception threshold �SRT�, which is the mixture sig-nal to noise ratio �SNR� required to achieve a certain intel-ligibility score, typically 50%. Hearing-impaired �HI� listen-ers need 3–6 dB higher SNR than normal-hearing �NH�listeners in order to perform at the same level in typical noisybackgrounds �Plomp, 1994; Alcantara et al., 2003�. For
speech-shaped noise �SSN� which is a steady noise with along-term spectrum matching that of natural speech, the SRTincrease for HI listeners is from 2.5 to 7 dB �Plomp, 1994�.For fluctuating noise or competing speech, the increase isconsiderably higher �Festen and Plomp, 1990; Hygge et al.,1992; Eisenberg et al., 1995; Peters et al., 1998�; for a singlecompeting talker, the increase is as much as 10–15 dB �Car-hart and Tillman, 1970; Festen and Plomp, 1990; Peterset al., 1998�. Note that, for typical speech materials, a 1 dBincrease in SRT leads to a 7%–19% reduction in the percentcorrect score, and a 2–3 dB elevation creates a significanthandicap for understanding speech in noisy listening condi-tions �Moore, 2007�.
Although modern hearing aids improve the audibilityand comfort of noisy speech, their ability to improve theintelligibility of noisy speech is unfortunately very limited�Dillon, 2001; Alcantara et al., 2003�. Extensive research hasbeen made to develop noise reduction algorithms in order toclose the SRT gap between HI and NH listeners. Monauralspeech enhancement algorithms, such as Wiener filtering andspectral subtraction, perform statistical analysis of speechand noise and then estimate clean speech from noisy speech�Lim, 1983; Benesty et al., 2005�. Although these algorithmsproduce SNR improvements, they have not led to increasedspeech intelligibility for human subjects �Levitt, 2001;
a�Author to whom correspondence should be addressed. Electronic mail:[email protected]
2336 J. Acoust. Soc. Am. 125 �4�, April 2009 © 2009 Acoustical Society of America0001-4966/2009/125�4�/2336/12/$25.00
PAPER A 39

Moore, 2003b; Edwards, 2004�. Attempts have also beenmade to directly enhance speech cues, especially formantswhich are spectral peaks of speech �Bunnell, 1990; Simpsonet al., 1990�. This processing results in clearer formant struc-ture; however, listening tests with both NH and HI listenersshow little improvement in speech intelligibility �Baer et al.,1993; Alcantara et al., 1994; Dillon, 2001�. Unlike monauralspeech enhancement, beamforming �spatial filtering� with amicrophone array has been demonstrated to achieve signifi-cant speech intelligibility improvements, particularly withlarge arrays �Kates and Weiss, 1996; Levitt, 2001; Schum,2003�. On the other hand, practical considerations of hearingaid design often limit the size of an array to two micro-phones, and the effectiveness of beamforming degrades inthe presence of room reverberation �Greenberg and Zurek,1992; Levitt, 2001; Ricketts and Hornsby, 2003�. Addition-ally, to benefit from spatial filtering target speech and inter-fering sounds must originate from different directions.
Recent research in computational auditory scene analy-sis �CASA� has led to the notion of an ideal binary time-frequency mask as a performance upper bound to measurehow well CASA algorithms perform �Wang and Brown,2006�. With a two-dimensional time-frequency �T-F� repre-sentation or decomposition of the mixture of target and in-terference, where elements in the representation are calledT-F units, an ideal binary mask �IBM� is defined as a binarymatrix within which 1 denotes that the target energy in thecorresponding T-F unit exceeds the interference energy by apredefined threshold and 0 denotes otherwise. The thresholdis called the local SNR criterion �LC�, measured in decibels.More specifically, IBM is defined as
IBM�t, f� = �1 if s�t, f� − n�t, f� � LC
0 otherwise,�
where s�t , f� denotes the target energy within the unit of timet and frequency f and n�t , f� the noise energy in the T-F unit,with both s�t , f� and n�t , f� measured in decibels. The maskis considered ideal because its construction requires access tothe target and masker signals prior to mixing, and undercertain conditions the IBM with LC=0 dB has the optimalSNR gain among all the binary masks �Wang, 2005; Li andWang, 2009�. As a separation technique, applying the IBMwith LC=0 dB to the mixture input retains the T-F regionsof the mixture where target energy is stronger than interfer-ence energy while removing the T-F regions where targetenergy is weaker than interference energy.
Varying LC results in different IBMs. Recently, Brun-gart et al. �2006� tested the effects of IBM with different LCvalues on speech mixtures with one target utterance and 1–3competing utterances of the same talker, where the soundlevels of all the utterances are set to be equal. Their experi-mental results show that, when 0 dB�LC�−12 dB, IBMproduces nearly perfect intelligibility scores, which are dra-matically higher than in a control condition where speechmixtures are presented to listeners without processing. Theysuggest that the choice of LC=−6 dB, which lies near thecenter of the performance plateau, may be better than thecommonly used 0 dB LC for intelligibility improvement.Furthermore, they attribute the intelligibility improvement to
the removal of informational masking which occurs whenthe listener is unable to successfully extract or segregateacoustically detectable target information from the mixture.Anzalone et al. �2006� investigated the intelligibility im-provements of a related version of IBM, defined by a com-parison between target energy and a threshold rather than acomparison between target energy and interference energy.Using mixtures of speech and SSN, they found that IBMleads to substantial SRT reductions: more than 7 dB for NHlisteners and more than 9 dB for HI listeners. In additionthey reported that, while NH listeners benefit from idealmasking in both the low-frequency �LF� and high-frequency�HF� ranges, HI listeners benefit from ideal masking only atLFs �up to 1.5 kHz�. Li and Loizou �2007� used the IBM togenerate “glimpses,” or T-F regions with stronger target en-ergy, to study several factors that influence glimpsing ofspeech mixed with babble noise. Their results show that it isimportant to generate glimpses in the LF to mid-frequencyrange �up to 3 kHz� that includes the first and the secondformant of speech, but not necessary to glimpse a wholeutterance; high intelligibility is achieved when the listenercan obtain glimpses in a majority of time frames. More re-cently, Li and Loizou �2008b� extended the findings of Brun-gart et al. �2006� to different types of background interfer-ence, including speech babble and modulated SSN.Moreover, they evaluated the impact of deviations from theIBM on intelligibility performance and found that there is agradual drop as the amount of mask errors increases. A sub-sequent study by Li and Loizou �2008a� shows that NH lis-teners obtain significant intelligibility improvements fromIBM processing with as few as 12 frequency channels, andIBM processing in the LF to mid-frequency range that in-cludes the first and the second formant appears sufficient.
In this paper, we evaluate the effects of IBM processingon speech intelligibility with two kinds of background noise:SSN and cafeteria noise, using both NH and HI listeners.While SSN is commonly used in the literature, the cafeterianoise we use contains a conversation between two speakersin a cafeteria background and it resembles the kind of noisetypically encountered in everyday life. Our study adopts thestandard IBM definition with a comparison between targetand interference and measures speech intelligibility by SRTat the 50% level. As suggested by the findings of Brungart etal. �2006�, we set LC to −6 dB in IBM construction. In-trigued by the observation of Anzalone et al. �2006� that HIlisteners derive little benefit from IBM in the HF range, weconduct an experiment to test whether ideal masking in theHF range is indeed not important for HI subjects. UnlikeAnzalone et al. �2006� who applied a constant gain to com-pensate for the hearing loss of their HI subjects, we applygain prescriptions to fit individual HI listeners.
In what follows, Sec. II details IBM processing. SectionIII describes an experiment that tests the effects of idealmasking on mixtures of speech with SSN or cafeteria noise.Section IV describes an experiment that compares the effectsof ideal masking in LF, HF, and all-frequency �AF� ranges.Further discussion is given in Sec. V. Finally, Sec. VI con-cludes the paper.
J. Acoust. Soc. Am., Vol. 125, No. 4, April 2009 Wang et al.: Speech intelligibility with ideal binary masking 2337
40

II. IDEAL BINARY MASKING
The concept of IBM in CASA is directly motivated bythe auditory masking phenomenon which, roughly speaking,refers to the perceptual effect that a louder sound renders aweaker sound inaudible within a critical band �Moore,2003a�. So keeping noise in T-F units with stronger targetenergy as done in the standard IBM definition with 0 dB LCshould not reduce speech intelligibility, and this is indeedwhat was found by Drullman �1995�. On the other hand,IBM processing removes all the T-F units with stronger in-terference energy as the target energy in these units is as-sumed to be masked by the interference. Removing thesemasker-dominated units also serves to remove informationalmasking, which is a dominant factor for reduced speech in-telligibility in speech and other modulated maskers �Brun-gart, 2001�. Hence IBM processing, as a form of ideal time-frequency segregation, is expected to yield larger speechintelligibility improvement in a modulated noise conditionthan in a steady noise condition �Brungart et al., 2006�.
Like earlier studies �Brungart et al., 2006; Anzalone etal., 2006�, we use a gammatone filterbank to process a stimu-lus and then time windowing to produce a cochleagramwhich is a two-dimensional T-F presentation �Wang andBrown, 2006�. Specifically, we use a 64-channel filterbankthat is equally spaced on the equivalent rectangular band-width �ERB� rate scale with center frequencies distributedfrom 2 to 33 ERBs �corresponding to 55–7743 Hz�. Thebandwidth of each filter is 1 ERB. We note that this filter-bank is similar to the one used in Anzalone et al. �2006�whereas Brungart et al. �2006� used a 128-channel filterbankcovering the frequency range of 80–5000 Hz. The responseof each filter is divided into 20 ms frames with a frame shiftof 10 ms, hence generating a two-dimensional matrix of T-Funits. The cochleagram of a stimulus is simply the two-dimensional graph of response energy within all the T-Funits. For a given mixture of target signal and backgroundnoise, the IBM is calculated by comparing whether the localSNR within a T-F unit is greater than LC. As mentioned inSec. I, we fix LC=−6 dB in this study as suggested by Brun-gart et al. �2006�. Such a choice of negative LC retains cer-tain T-F units where the target energy is weaker but notmuch weaker than the interference energy, in accordancewith Drullman’s observation that weaker speech energy be-low the noise level still makes some contribution to speechintelligibility �Drullman, 1995�. Indeed, a pilot test with0 dB LC indicates that SRT improvements are not as high asthose produced with LC=−6 dB. More generally, in order toproduce large auditory masking, the masker needs to bestronger than the masked signal �Moore, 2003a�.
Given an IBM, the waveform output of IBM can beresynthesized from the mixture input by weighting the mix-ture cochleagram by the IBM and correcting phase shiftsintroduced during gammatone filtering �see Wang andBrown, 2006�. Such an output can then be played to a lis-tener as a stimulus in our experiments. Figure 1 illustratesIBM for a mixture of a speech utterance and a cafeteria back-ground. The SNR of the mixture is 0 dB. Figure 1�a� showsthe cochleagram of the target speech, Fig. 1�b� that of the
background noise, and Fig. 1�c� that of the mixture. Figure1�d� displays the IBM with LC=−6 dB, and Fig. 1�e� thecochleagram of the resynthesized result of ideal maskingwith the IBM in Fig. 1�d�. The ideally masked mixture inFig. 1�d� is clearly more similar to the target speech shown inFig. 1�a� than the original mixture shown in Fig. 1�c� is. As acomparison, Fig. 1�f� shows the IBM with LC=0 dB, andFig. 1�g� the cochleagram of the corresponding ideal mask-ing output. With the increased LC, the IBM has fewer 1’sand retains less mixture energy.
III. EXPERIMENT 1: EFFECTS OF IDEAL BINARYMASKING ON SPEECH-RECEPTION THRESHOLD
This experiment was designed to quantify the SRT ef-fects of IBM for both NH and HI listeners. Sentences fromthe Dantale II corpus �Wagener et al., 2003� were used astarget speech, and tests were conducted with two differentbackgrounds: SSN and cafeteria noise.
A. Methods
1. Stimuli
The Dantale II corpus �Wagener et al., 2003� comprisessentences recorded by a female Danish speaker. Each sen-tence has five words with a fixed grammar �name, verb, nu-meral, adjective, and object�, for example, “Linda boughtthree lovely presents” �English translation�. Each word in asentence is randomly chosen from ten equally meaningfulwords. As a result, recognizing a subset of words in a sen-tence does not help with the recognition of the remainingwords. There are a total of 15 test lists, and each list has tensentences with no repeating word. There are a few secondsof silence between sentences within each list to allow a lis-tener time to report what has been heard. Similar to theSwedish sentence test �Hagerman, 1982�, the closed set cor-pus was designed for repeated use, and training effects areminimal after familiarization with a few lists �Wagener et al.,2003�. We use the speech-shaped noise included with theDantale II corpus, which is produced by superimposing thespeech material in the corpus. The cafeteria noise employedis a recorded conversation in Danish between a male andfemale speaker that took place in a cafeteria background�Vestergaard, 1998�. To emphasize temporal modulation ef-fects, the long-term spectrum of this noise was shaped tomatch that of the Dantale II speech material �Johannesson,2006�. Target speech and background noises are all digitizedat 20 kHz sampling frequency.
A speech utterance and a background noise are first pro-cessed separately by a 64-channel gammatone filterbank �seeSec. II�, which produces a flat frequency response within thefrequency range of the filterbank. Filter responses are thenwindowed into 20 ms rectangular frames with a 50% overlapbetween consecutive frames, resulting in a two-dimensionalcochleagram. This 100 Hz frame rate is frequently used inspeech processing �Rabiner and Juang, 1993�. For a givenmixture of a Dantale II list and a background noise, the mix-ture SNR is calculated during the intervals that containspeech energy. To account for the forward masking of thecontinuously present noise that occurs between two consecu-
2338 J. Acoust. Soc. Am., Vol. 125, No. 4, April 2009 Wang et al.: Speech intelligibility with ideal binary masking
PAPER A 41
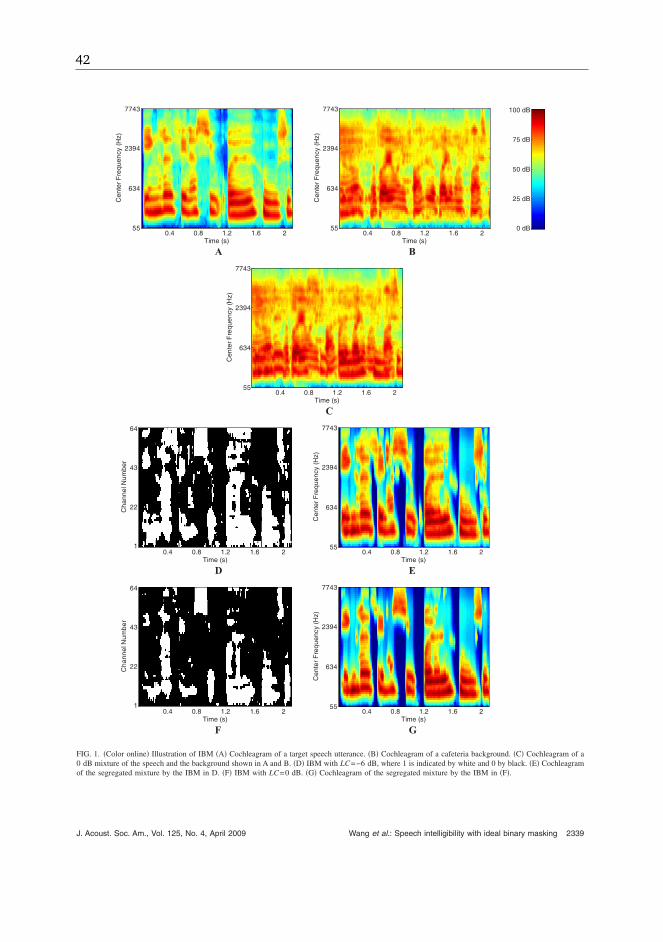
Time (s)
Cen
terF
requ
ency
(Hz)
0.4 0.8 1.2 1.6 2
7743
2394
634
55
Time (s)
Cen
terF
requ
ency
(Hz)
0.4 0.8 1.2 1.6 2
7743
2394
634
55
100 dB
75 dB
50 dB
25 dB
0 dB
A B
Time (s)
Cen
terF
requ
ency
(Hz)
0.4 0.8 1.2 1.6 2
7743
2394
634
55
C
Time (s)
Cha
nnel
Num
ber
0.4 0.8 1.2 1.6 2
64
43
22
1
Time (s)
Cen
terF
requ
ency
(Hz)
0.4 0.8 1.2 1.6 2
7743
2394
634
55
D E
Time (s)
Cha
nnel
Num
ber
0.4 0.8 1.2 1.6 2
64
43
22
1
Time (s)
Cen
terF
requ
ency
(Hz)
0.4 0.8 1.2 1.6 2
7743
2394
634
55
F G
FIG. 1. �Color online� Illustration of IBM �A� Cochleagram of a target speech utterance. �B� Cochleagram of a cafeteria background. �C� Cochleagram of a0 dB mixture of the speech and the background shown in A and B. �D� IBM with LC=−6 dB, where 1 is indicated by white and 0 by black. �E� Cochleagramof the segregated mixture by the IBM in D. �F� IBM with LC=0 dB. �G� Cochleagram of the segregated mixture by the IBM in �F�.
J. Acoust. Soc. Am., Vol. 125, No. 4, April 2009 Wang et al.: Speech intelligibility with ideal binary masking 2339
42

tive sentences �Moore, 2003a�, a period of 100 ms is addedbefore the onset of a sentence for mixture SNR calculation.For a mixture input with a specified SNR, IBM is con-structed from the cochleagrams of the target speech and thebackground noise with LC fixed at −6 dB. The IBM is thenused to resynthesize a waveform stimulus from the mixturecochleagram. Note that, as a result, the masker signals inbetween sentences are removed by IBM processing becauseduring such intervals there is only masker energy.
As control conditions, mixtures of speech and back-ground noise were also presented to listeners without segre-gation. To incorporate filtering effects and any distortionsthat might be introduced during cochleagram analysis andsynthesis, a mixture in an unsegregated condition is pro-cessed through an all-1 binary mask or the IBM with the LCof negative infinity, therefore including all the T-F units inthe resynthesis.
2. Listeners
A total of 12 NH listeners and a total of 12 listeners withsensorineural hearing loss participated in this experiment. Allsubjects were native Danish speakers. The NH listeners hadhearing thresholds at or below 20 dB HL from125 Hz to 8 kHz, and their ages ranged from 26 to 51 withthe average age of 37. The NH listeners had little prior ex-perience with auditory experiments, and were not informedof the purpose or design of the experiment.
The 12 HI listeners had a symmetric, mild-to-moderate,sloping hearing loss. The audiograms of these listeners areshown in Fig. 2. They had an age range from 33 to 80 withthe average age of 67. All the HI listeners were experiencedhearing aid wearers. The tests were performed with theirhearing aids taken off, and compensation was applied to eachHI subject individually. Specifically, a gain prescription wascomputed from an individual’s audiogram using the NAL-RPprocedure �Dillon, 2001�, and then used to produce amplifi-cation with appropriate frequency-dependent shaping. Thehearing losses in the left ear and the right ear were compen-
sated for separately. The subjects had participated in DantaleII listening tasks before, but were not told of the purpose anddesign of this experiment.
3. Procedure
There are a total of four test conditions in this experi-ment: two ideal masking conditions with SSN and cafeterianoise and two control conditions with unsegregated mix-tures. Three Dantale II lists with a total of 30 sentences wererandomly selected from the corpus for each test condition.Subjects were instructed to repeat as many words as theycould after listening to each stimulus that corresponded toone sentence, and they were not given any feedback as towhether their responses were correct or not. To familiarizethem with the test procedure, subjects were given a trainingsession at the beginning of the experiment by listening to andreporting on three lists of clean sentences. The order of thefour conditions was randomized but balanced among the lis-teners �Beck and Zacharov, 2006�. A subject test with thefour conditions and a training session together took less than1 h, and a short break was given roughly halfway throughthe test.
The Dantale II test employs an adaptive procedure inorder to find the 50% SRT. The procedure is to present testsentences at SNR that is continuously adapted according tothe number of correctly reported words in the previous sen-tence �Hansen and Ludvigsen, 2001�. In a test condition with30 sentences, the first 10 sentences are used to reach a steady50% SRT level and the final SRT is determined by averagingthe SNR levels for the last 20 sentences.
Speech and noise were both set to the same initial soundpressure level �SPL� for NH listeners. For HI listeners, theinitial SPL of speech was set to 5 dB higher than the noiseSPL in Experiment 1, and to the same SPL of noise in Ex-periment 2. In unsegregated conditions, the noise level wasfixed while the speech level was adjusted during the adaptiveprocedure. In ideal masking conditions, as input SNR dropsIBM becomes sparser with fewer 1’s. To ensure that ideallymasked stimuli remain audible at very low SNRs, the speech
125 250 500 1000 2000 4000 8000
0
10
20
30
40
50
60
70
80
90
100
Left ear
Frequency (Hz)
Hea
ring
leve
l(dB
)
125 250 500 1000 2000 4000 8000
0
10
20
30
40
50
60
70
80
90
100
Right ear
Frequency (Hz)
Hea
ring
leve
l(dB
)
FIG. 2. Audiograms of the 13 HI listeners who participated in the experiments. The dashed line indicates the subject who only participated in Experiment 1,and the dotted line the subject who only participated in Experiment 2.
2340 J. Acoust. Soc. Am., Vol. 125, No. 4, April 2009 Wang et al.: Speech intelligibility with ideal binary masking
PAPER A 43

level was fixed while the noise level was adjusted in all IBMconditions. As a result, with fewer retained T-F units theirsound levels became higher even though the levels of thespeech signals within these units were unchanged, and theloudness of a processed mixture was thus kept within a smallrange. This way of adjusting input SNR ensured that thestimuli in all four conditions were comfortably audible.
During a test, a subject was seated in a sound attenuatingbooth. Test stimuli were generated using the built-in soundcard �SoundMAX� in a control computer �IBM ThinkCenterS50� and then presented diotically to a listener through head-phones �Sennheiser HD 280 Pro�. For HI listeners, an exter-nal amplifier �Behring Powerplay HA4000� was used to in-crease the sound level so that the stimuli within the test rangewere all audible and yet not uncomfortably loud. The ampli-fication level was adjusted once for each HI listener beforethe test began.
4. Statistical analysis and power
During the planning phase of the study, the experimentwas statistically powered to detect a within-subject between-condition difference of 1.0 dB on mean scores across condi-tions on the Dantale II test described subsequently for p�0.05 at 80% power. This required at least ten completedata sets per condition. Analysis of variance �ANOVA� wasperformed on all of the data from NH and HI subjects, withwithin-subject factors of type of processing �IBM or unseg-regated� and of type of noise �SSN or cafeteria noise�, and abetween-subject factor of subject type �NH and HI�. Post hoctests were the Bonferroni test and/or the Fisher least-significant-difference �LSD� test, applied where appropriate.The Bonferroni test was used as the most conservative test toindicate differences between means, while the Fisher LSDtest was used as the most conservative test for a null result.All statistics were performed using STATISTICA version 7�StatSoft, 2007�.
B. Results and discussion
Figure 3 shows the SRT results of all four test condi-
tions: SSN, CAFE, SSN-IBM, and CAFE-IBM, for both NHand HI listeners. For NH listeners, the mean SRT for unseg-regated mixtures with SSN �SSN� is −8.15 dB, for unsegre-gated mixtures with cafeteria noise �CAFE� is −10.25 dB,for ideal masking with SSN �SSN-IBM� is −15.56 dB, andfor ideal masking with cafeteria noise �CAFE-IBM� is−20.70 dB. The ANOVA for NH subjects showed that themain effects of processing type and noise type were signifi-cant �F�1,11�=606.1, p�0.001, and F�1,11�=78.1, p�0.001, respectively�, and there was also a significant inter-action between processing type and noise type �F�1,11�=32.3, p�0.001�. The Bonferroni post hoc tests indicatedthat all means were significantly different �p�0.005� fromone another. The results show that ideal masking leads tolower �better� SRT compared to unsegregated mixtures re-gardless of background noise, that the cafeteria backgroundyields a lower SRT than the SSN, and that ideal masking hasa greater effect on the cafeteria background. The SRT for theunsegregated SSN condition is comparable to the referencelevel of −8.43 dB for the Dantale II task �Wagener et al.,2003�. The lower SRT for the cafeteria background is con-sistent with previous studies showing that NH listeners ex-hibit higher intelligibility in fluctuating backgrounds �Festenand Plomp, 1990; Peters et al., 1998�.
For the SSN background, IBM produces an average SRTimprovement of 7.4 dB. This level of improvement is con-sistent with what was found by Anzalone et al. �2006� usingthe HINT test �Nilsson et al., 1994�, but higher than the 5 dBimprovement reported by Brungart et al. �2006� using theCRM task �Bolia et al., 2000�. The main difference betweenour experiment and Brungart et al. �2006� lies in different LCvalues: their test uses 0 dB LC whereas LC is set to −6 dB inour study. As reported in Brungart et al. �2006� the choice ofLC=−6 dB seems better than LC=0 dB in terms of speechintelligibility �see also Sec. II�.
For the cafeteria background, ideal masking lowers SRTby 10.5 dB on average, which represents a larger gain thanfor the SSN background. Unlike SSN, the cafeteria back-ground contains significant spectral and temporal modula-tions which contribute to better intelligibility in the unsegre-gated condition. We stress that the larger SRT improvementfor this background is achieved on top of the better perfor-mance of listening to unsegregated mixtures.
For HI listeners, the mean SRTs are −5.61, −3.80,−14.79, and −19.44 dB for the SSN, CAFE, SSN-IBM, andSSN-CAFE conditions, respectively. The ANOVA whereboth NH and HI subjects were included showed that themain effects of subject type, processing type, and noise typewere significant �F�1,22�=17.2, p�0.001; F�1,22�=1959.0, p�0.001; and F�1,22�=100.6, p�0.001, respec-tively�, and there were also significant interaction effectsbetween-subject type and processing type, subject type andnoise type, and processing type and noise type �F�1,22�=49.9, p�0.001; F�1,22�=19.2, p�0.001; and F�1,22�=163.9, p�0.001 respectively�, as well as a three-way inter-action between subject type, processing type, and noise type�F�1,11�=19.7, p�0.001�. The Bonferroni as well as theFisher LSD post hoc tests on the three-way interaction indi-cated that all means were significantly different �p�0.006�
NHHI
SSN CAFE SSN-IBM CAFE-IBM-24
-22
-20
-18
-16
-14
-12
-10
-8
-6
-4
-2
0
2
4
DantaleIISRT(dB)
FIG. 3. SRTs for different conditions of Experiment 1 for NH and HI lis-teners. A more negative SRT corresponds to better performance. Error barsindicate 95% confidence intervals of the means.
J. Acoust. Soc. Am., Vol. 125, No. 4, April 2009 Wang et al.: Speech intelligibility with ideal binary masking 2341
44

except for the SSN-IBM and CAFE-IBM conditions wherethe differences between NH and HI listeners were insignifi-cant �p�0.05�. The post hoc results show that ideal maskingproduces lower SRT compared to unsegregated mixtures re-gardless of noise type, and has a greater effect for the caf-eteria background. No difference, however, was revealed be-tween the NH subjects and the HI subjects in the two IBMconditions by either the more conservative Bonferroni test orthe less conservative Fisher LSD test. The elevated levels ofSRT in the two unsegregated conditions show that HI listen-ers perform worse in speech recognition in noisy environ-ments, and the levels of SRT increment, 2.5 dB for the SSNcondition and 6.5 dB for the CAFE condition, are broadlycompatible with previous findings of HI listeners’ increaseddifficulty in speech understanding in noise �see Sec. I�. IBMlowers SRT substantially. The SRT gain resulting from idealmasking is 9.2 dB for the SSN background, and this level ofimprovement is compatible with that reported in Anzalone etal. �2006�. For the cafeteria background, ideal masking pro-duces a very large SRT improvement of 15.6 dB.
By comparing NH and HI results in Fig. 3, it is clear thatHI listeners benefit from ideal masking even more than NHlisteners, particularly for the cafeteria background. The re-sults suggest that, after IBM processing, the intelligibilityperformance is comparable for HI and NH listeners in bothSSN and cafeteria backgrounds. It is remarkable that thespeech intelligibility of HI listeners becomes statistically in-distinguishable from that of NH listeners after ideal masking.
IV. EXPERIMENT 2: EFFECTS OF BAND-LIMITEDIDEAL BINARY MASKING ON SPEECH-RECEPTIONTHRESHOLD
The results of Experiment 1 show large SRT improve-ments resulting from IBM processing. As mentioned in Sec.I, a main finding reported by Anzalone et al. �2006� is that,while NH listeners benefit from IBM in both the LF and HFranges, HI listeners benefit from ideal masking only in theLF range. This finding is significant because it suggests that,to alleviate the hearing loss of HI listeners, one need notworry about performing T-F masking in the HF range;speech segregation at HFs tends to be more difficult than atLFs �Wang and Brown, 2006�. Although their interpretationbased on the upward spread of masking is reasonable, thefact that they apply constant amplification with no spectralshaping to compensate for the sloping hearing loss of theirsubjects may suggest a simpler interpretation: the lack of theIBM benefit in the HF range may be partially accounted forby the potentially less compensated hearing loss at HFs. Ex-periment 2 was primarily designed to assess the importanceof IBM processing at HFs for HI listeners as compared toNH listeners. In this experiment, we compensated for thehearing loss of individual listeners based on their audio-grams. We compare the intelligibility performance in threesetups: IBM in the LF range only, ideal masking in the HFrange only, and ideal masking in the AF range. Both SSNand cafeteria backgrounds are used. Consequently, there area total of six test conditions in this experiment.
A. Methods
1. Stimuli
As in Experiment 1, Dantale II sentences were used astarget speech, and SSN and cafeteria noise were used as twodifferent backgrounds. The IBM processing in the AF condi-tion was the same as in Experiment 1. For the LF condition,the same IBM processing as in Experiment 1 was used in thelower 32 frequency channels while an all-1 mask was ap-plied to the higher 32 frequency channels. This way of pro-cessing produces no segregation in the HF range. In the HFcondition, the reverse was done: IBM was applied to thehigher 32 channels while an all-1 mask was applied to thelower 32 channels �hence no segregation in the LF range�.This equal division of the 64-channel gammatone filterbankyields a frequency separation boundary approximately at1.35 kHz. Note that this boundary separating LF and HFranges is a little lower than the 1.5 kHz boundary used inAnzalone et al. �2006�. Our choice was partly motivated bythe consideration that both the speech material and the SSNin the Dantale II corpus have energy distribution heavilytilted toward LFs so that IBM processing below 1 kHz likelyremoves significantly more noise than IBM processing above1 kHz. The long-term spectrum of the SSN �Wagener et al.,2003� is shown in Fig. 4, along with the long-term spectrumof the cafeteria noise. With the 1.5 kHz boundary, the NHresults from Anzalone et al. �2006� show that the SRT intheir LF condition is a little lower than the SRT in their HFcondition.
2. Listeners
12 NH listeners and 12 HI listeners participated in thisexperiment. The pool of NH listeners was the same as thatparticipated in Experiment 1 except for one. This substitutionlowered the average age from 37 to 36 without altering theage range. The pool of HI listeners also remained the same asin Experiment 1 except for one. This substitution �see Fig.
102
103
104
30
40
50
60
70
80
Frequency - Hz
One
third
octa
veR
MS
leve
l(dB
) Café NoiseSSN
FIG. 4. Long-term spectrum of the SSN in Dantale II �redrawn from Wage-ner et al., 2003�. The spectrum is expressed as root mean square levels inone-third octave bands. Also shown is the long-term spectrum of the cafete-ria noise.
2342 J. Acoust. Soc. Am., Vol. 125, No. 4, April 2009 Wang et al.: Speech intelligibility with ideal binary masking
PAPER A 45

2�, plus a listener whose birthday occurred between the twoexperiments, changed the average age from 67 to 66 withoutchanging the age range. Again, subjects were naïve to thepurpose and design of the experiment. NH listeners werefamiliar with the Dantale II sentences by virtue of participat-ing in Experiment 1, and as noted in Sec. III A 2, HI listenershad experience listening to Dantale II sentences prior to Ex-periment 1. Due to the limited number of test lists �15� avail-able in the Dantale II corpus, the same lists used in Experi-ment 1 were also employed in Experiment 2. It is worthmentioning that the corpus was designed for repeated usage�Wagener et al., 2003; see also Sec. III A 1�.
3. Procedure and statistical analysis
The procedure of this experiment is the same as in Ex-periment 1 except for the following. To vary the input SNR,the noise level was adjusted while the speech level was fixedas in the ideal masking conditions of Experiment 1. In the LFand HF conditions, there is no segregation in half of thefrequency channels. As the input SNR decreases in the nega-tive range, the sound level of a stimulus in these conditionsis dominated by the background noise in the unsegregatedfrequency range and hence becomes increasingly louder. Toensure that LF and HF stimuli are not too loud for NH lis-teners who have very low SRTs, the speech level was fixed ata lower volume than in Experiment 1. Despite this change ofsound level, all test stimuli were still comfortably audible forNH listeners. Note that this change did not impact HI listen-ers as the amount of amplification was individually set forthem. ANOVA was performed similarly on all the data fromNH and HI subjects as in Experiment 1, with within-subjectfactors of type of processing �LF, HF, or AF� and of type ofnoise �SSN or CAFE�, and a between-subject factor of sub-ject type �NH or HI�.
B. Results and discussion
Figure 5 shows the SRT results of all six test conditionsin Experiment 2: SSN-LF, SSN-HF, SSN-AF, CAFE-LF,CAFE-HF, and CAFE-AF, for both NH and HI listeners. TheANOVA for NH subjects showed that the main effects of
processing type and noise type were significant �F�2,22�=255.5, p�0.001, and F�1,11�=231.2, p�0.001, respec-tively�, and there was also a significant interaction betweenprocessing type and noise type �F�2,22�=4.4, p�0.05�. TheBonferroni tests indicated that all NH means were signifi-cantly different �p�0.006� from one another, except be-tween the SSN-AF and the CAFE-HF condition. For theSSN background, the mean SRT is −15.66 dB in the LF con-dition, −12.65 dB in the HF condition, and −17.10 dB in theAF condition. The results show that NH listeners performbetter when IBM processing is applied in the LF range thanin the HF range, and the difference in SRT is approximately3 dB. This SRT difference is larger than the SRT differenceof slightly more than 1 dB reported by Anzalone et al.�2006�, despite the fact that the boundary separating LFs andHFs is 1.35 kHz in our processing and 1.5 kHz in their pro-cessing. Even with the lower frequency boundary we findthat, with the same input SNR, the HF condition leaves morenoise than the LF condition since the noise energy is distrib-uted mostly in the LF range �see Fig. 4�. The discrepancy islikely due to different ways of IBM processing used in thetwo studies. The AF condition yields the lowest SRT, whichis about 1.6 dB lower than in the LF condition.
For the cafeteria background, the mean SRT is−20.37 dB in the LF condition, −17.88 dB in the HF condi-tion, and −23.24 dB in the AF condition. Clearly NH sub-jects perform better in this background than in SSN, consis-tent with the results of Experiment 1. Again, NH listenersbenefit more from IBM processing at LFs than at HFs andthe relative benefit is 2.5 dB. The AF condition also gives thelowest SRT, which is about 2.9 dB lower than in the LFcondition. That NH subjects performed better in the AF con-dition than in the LF condition for both the SSN and cafete-ria backgrounds suggest that they do benefit from IBM in theHF range, even though the benefit is not as high as from theLF range.
The ANOVA where both HI and NH subjects were in-cluded showed that the main effects of subject type, process-ing type, and noise type were significant �F�1,22�=19.1, p�0.001; F�2,44�=255.4, p�0.001; and F�1,22�=317.2, p�0.001, respectively�, and there were also significant inter-action effects between subject type and processing type, sub-ject type and noise type, and processing type and noise type�F�2,44�=31.2, p�0.001; F�1,22�=18.3, p�0.001; andF�2,44�=14.2, p�0.001, respectively�, as well as a three-way interaction between subject type, processing type, andnoise type �F�2,44�=5.4, p�0.01�. Table I shows the FisherLSD post hoc tests. As seen in the table, all conditions weresignificantly different �p�0.05� from one another within theNH subjects �conditions �1�–�6� contrasted against eachother� and within the HI subjects �conditions �7�–�12� con-trasted against each other�. However, the differences betweenNH and HI were insignificant for the conditions of SSN-LFand SSN-AF.
For HI listeners, the mean SRTs for the SSN backgroundare −14.85, −8.49, and −15.96 dB for the LF, HF, and AFconditions, respectively. The SRT advantage of the LF con-dition over the HF condition is 6.4 dB, whereas the advan-tage of the AF condition over the LF condition is only
NHHI
SSN-LF SSN-HF SSN-AF CAFE-LF CAFE-HF CAFE-AF-26
-24
-22
-20
-18
-16
-14
-12
-10
-8
-6
-4
-2
0
2
4
DantaleIISRT(dB)
FIG. 5. SRTs for different conditions of Experiment 2 for NH and HI lis-teners. Error bars indicate 95% confidence intervals of the means.
J. Acoust. Soc. Am., Vol. 125, No. 4, April 2009 Wang et al.: Speech intelligibility with ideal binary masking 2343
46
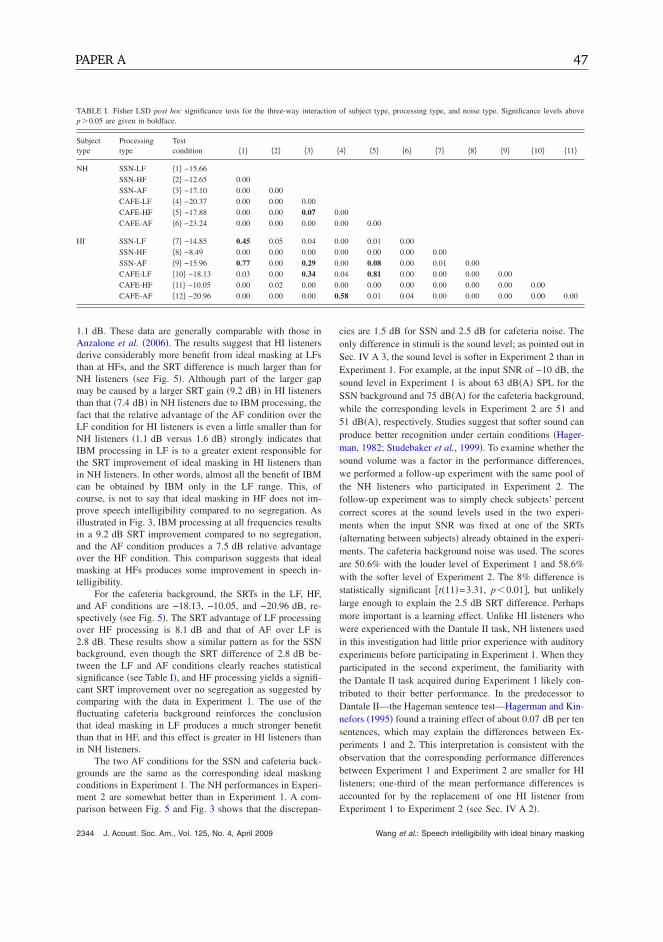
1.1 dB. These data are generally comparable with those inAnzalone et al. �2006�. The results suggest that HI listenersderive considerably more benefit from ideal masking at LFsthan at HFs, and the SRT difference is much larger than forNH listeners �see Fig. 5�. Although part of the larger gapmay be caused by a larger SRT gain �9.2 dB� in HI listenersthan that �7.4 dB� in NH listeners due to IBM processing, thefact that the relative advantage of the AF condition over theLF condition for HI listeners is even a little smaller than forNH listeners �1.1 dB versus 1.6 dB� strongly indicates thatIBM processing in LF is to a greater extent responsible forthe SRT improvement of ideal masking in HI listeners thanin NH listeners. In other words, almost all the benefit of IBMcan be obtained by IBM only in the LF range. This, ofcourse, is not to say that ideal masking in HF does not im-prove speech intelligibility compared to no segregation. Asillustrated in Fig. 3, IBM processing at all frequencies resultsin a 9.2 dB SRT improvement compared to no segregation,and the AF condition produces a 7.5 dB relative advantageover the HF condition. This comparison suggests that idealmasking at HFs produces some improvement in speech in-telligibility.
For the cafeteria background, the SRTs in the LF, HF,and AF conditions are −18.13, −10.05, and −20.96 dB, re-spectively �see Fig. 5�. The SRT advantage of LF processingover HF processing is 8.1 dB and that of AF over LF is2.8 dB. These results show a similar pattern as for the SSNbackground, even though the SRT difference of 2.8 dB be-tween the LF and AF conditions clearly reaches statisticalsignificance �see Table I�, and HF processing yields a signifi-cant SRT improvement over no segregation as suggested bycomparing with the data in Experiment 1. The use of thefluctuating cafeteria background reinforces the conclusionthat ideal masking in LF produces a much stronger benefitthan that in HF, and this effect is greater in HI listeners thanin NH listeners.
The two AF conditions for the SSN and cafeteria back-grounds are the same as the corresponding ideal maskingconditions in Experiment 1. The NH performances in Experi-ment 2 are somewhat better than in Experiment 1. A com-parison between Fig. 5 and Fig. 3 shows that the discrepan-
cies are 1.5 dB for SSN and 2.5 dB for cafeteria noise. Theonly difference in stimuli is the sound level; as pointed out inSec. IV A 3, the sound level is softer in Experiment 2 than inExperiment 1. For example, at the input SNR of −10 dB, thesound level in Experiment 1 is about 63 dB�A� SPL for theSSN background and 75 dB�A� for the cafeteria background,while the corresponding levels in Experiment 2 are 51 and51 dB�A�, respectively. Studies suggest that softer sound canproduce better recognition under certain conditions �Hager-man, 1982; Studebaker et al., 1999�. To examine whether thesound volume was a factor in the performance differences,we performed a follow-up experiment with the same pool ofthe NH listeners who participated in Experiment 2. Thefollow-up experiment was to simply check subjects’ percentcorrect scores at the sound levels used in the two experi-ments when the input SNR was fixed at one of the SRTs�alternating between subjects� already obtained in the experi-ments. The cafeteria background noise was used. The scoresare 50.6% with the louder level of Experiment 1 and 58.6%with the softer level of Experiment 2. The 8% difference isstatistically significant �t�11�=3.31, p�0.01�, but unlikelylarge enough to explain the 2.5 dB SRT difference. Perhapsmore important is a learning effect. Unlike HI listeners whowere experienced with the Dantale II task, NH listeners usedin this investigation had little prior experience with auditoryexperiments before participating in Experiment 1. When theyparticipated in the second experiment, the familiarity withthe Dantale II task acquired during Experiment 1 likely con-tributed to their better performance. In the predecessor toDantale II—the Hageman sentence test—Hagerman and Kin-nefors �1995� found a training effect of about 0.07 dB per tensentences, which may explain the differences between Ex-periments 1 and 2. This interpretation is consistent with theobservation that the corresponding performance differencesbetween Experiment 1 and Experiment 2 are smaller for HIlisteners; one-third of the mean performance differences isaccounted for by the replacement of one HI listener fromExperiment 1 to Experiment 2 �see Sec. IV A 2�.
TABLE I. Fisher LSD post hoc significance tests for the three-way interaction of subject type, processing type, and noise type. Significance levels abovep�0.05 are given in boldface.
Subjecttype
Processingtype
Testcondition �1� �2� �3� �4� �5� �6� �7� �8� �9� �10� �11�
NH SSN-LF �1� −15.66SSN-HF �2� −12.65 0.00SSN-AF �3� −17.10 0.00 0.00CAFE-LF �4� −20.37 0.00 0.00 0.00CAFE-HF �5� −17.88 0.00 0.00 0.07 0.00CAFE-AF �6� −23.24 0.00 0.00 0.00 0.00 0.00
HI SSN-LF �7� −14.85 0.45 0.05 0.04 0.00 0.01 0.00SSN-HF �8� −8.49 0.00 0.00 0.00 0.00 0.00 0.00 0.00SSN-AF �9� −15.96 0.77 0.00 0.29 0.00 0.08 0.00 0.01 0.00CAFE-LF �10� −18.13 0.03 0.00 0.34 0.04 0.81 0.00 0.00 0.00 0.00CAFE-HF �11� −10.05 0.00 0.02 0.00 0.00 0.00 0.00 0.00 0.00 0.00 0.00CAFE-AF �12� −20.96 0.00 0.00 0.00 0.58 0.01 0.04 0.00 0.00 0.00 0.00 0.00
2344 J. Acoust. Soc. Am., Vol. 125, No. 4, April 2009 Wang et al.: Speech intelligibility with ideal binary masking
PAPER A 47

V. GENERAL DISCUSSION
The robustness of speech recognition in noise by NHlisteners is commonly attributed to the perceptual process ofglimpsing, or “listening in the dips,” which detects and gath-ers T-F regions of a sound mixture where target speech isrelatively stronger compared to interference �Miller andLicklider, 1950; Howard-Jones and Rosen, 1993; Assmannand Summerfield, 2004; Li and Loizou, 2007�. As glimpsinginvolves grouping, this account is closely related to the ASAaccount that applies to both speech and nonspeech signals�Bregman, 1990�. Poorer performance of listeners with hear-ing loss in fluctuating backgrounds is generally explained astheir inability to take advantage of temporal and spectraldips, perhaps caused by reduced frequency selectivity andtemporal resolution �Moore, 2007�. IBM could be under-stood as producing glimpses or performing ASA for the lis-tener. The fact that ideal masking also improves intelligibil-ity of NH listeners suggests that even listeners withouthearing loss can fail to make full use of the speech informa-tion available in a noisy input. The less-than-ideal perfor-mance in noisy environments is probably caused by the fail-ure in detecting a glimpse—a T-F region with relativelystrong target energy—or grouping detected glimpses. Thisfailure becomes more acute with hearing loss. Because idealmasking does an “ideal” job of glimpsing for the auditorysystem, it helps to nearly equalize the performances of HIand NH listeners �see Fig. 3�.
The results of Experiment 1 demonstrate that listenerswith or without hearing loss benefit more from IBM process-ing in the cafeteria background than in the SSN background.The cafeteria background has temporal and spectral modula-tions, and as a result the amount of informational maskingcaused by target-masker similarity is expected to be higherthan that in SSN. Indeed, some listeners voluntarily com-mented after the experiment that the conversation in thebackground distracted their attention, making it harder toconcentrate on target utterances. The larger SRT improve-ment observed for the cafeteria background is thus consistentwith the interpretation that ideal masking removes or largelyattenuates informational masking �Brungart et al., 2006�. In asituation extremely conducive to informational masking,namely, the mixtures of speech utterances of the same talker,Brungart et al. �2006� found that the effect of ideal maskingis tantamount to a 22–25 dB improvement in input SNR.The 10.5 dB SRT improvement obtained through ideal mask-ing in the cafeteria background, although greater than thatobtained in the SSN background, is much smaller than thatobtained in mixtures of same-talker utterances. The improve-ment is also smaller than those obtained in mixtures ofdifferent-talker utterances �Chang, 2004�, although the gap isnot quite as big as in same-talker mixtures. One can thereforeexpect even larger SRT improvements when interference isone or several competing talkers, a kind of background thatproduces very large performance gaps between NH and HIlisteners as reviewed in Sec. I.
The results of Experiment 2 are on the whole consistentwith the related findings of Anzalone et al. �2006� eventhough we used individual gain prescriptions to compensate
for listeners’ hearing loss. The results are also qualitativelyconsistent with the findings of Li and Loizou �2007� illus-trating that glimpses in the LF to mid-frequency range aremore beneficial for speech intelligibility than those in the HFrange. However, a few differences between our results andthe results of Anzalone et al. �2006� are worth noting. First,although considerably smaller than LF processing, there is abenefit from ideal masking in the HF range for HI listeners inour study whereas their study did not show a significant ben-efit. A possible reason is the individual gain prescription em-ployed in our study that makes segregated speech relativelylouder in the HF range than the constant gain applied in theirstudy. Second, we find a relatively greater LF benefit in NHlisteners than in their study. The main reason, we believe, isthat LF processing removes more background noise than HFprocessing for a given input SNR. With negative input SNRs�see Fig. 5�, the residual noise in the HF condition is in theLF range while that in the LF condition is in the HF range,and the background noises used in our experiments haveenergy distributed mostly in the LF range, as shown in Fig.4. This explanation, not considered by Anzalone et al., givesa partial account for the larger LF benefit for listeners withhearing loss. The large SRT gap between LF and HF process-ing for HI listeners �see Fig. 5�, however, cannot be fullyexplained this way as the gap is substantially larger—to theextent that the SRT performance in LF processing is almostthe same as in AF processing. Another likely reason is up-ward spread of masking �Anzalone et al., 2006� which lis-teners with sensorineural hearing loss are especially suscep-tible to �Jerger et al., 1960; Gagne, 1988; Klein et al., 1990�.Upward spread of masking is a more prominent factor in theHF condition because of no segregation in the LF range.Also, with more hearing loss at HFs �see Fig. 2�, HI listenersare less able to utilize audible HF speech information in rec-ognition compared to NH listeners �Dubno et al., 1989;Ching et al., 1998; Hogan and Turner, 1998�. This could alsocontribute to a steeper performance decline of HF processingrelative to AF processing for HI listeners than for NH listen-ers.
Despite different definitions of IBM, the SRT improve-ments observed in our study and in Anzalone et al. �2006�are very close for the SSN background. It is all the moreremarkable considering that their IBM is generated on asample-by-sample basis while ours is generated on a frame-by-frame basis, which has a drastically lower temporal reso-lution, and that, in their experiments, IBM-determined gainstake the values of 1 and 0.2 while the gains take the values of1 and 0 in our experiments. The use of two-valued gains is akey similarity between the studies. The most important dif-ference is, of course, that our definition is based on a com-parison between target and interference energy and theirs isbetween target energy and a fixed threshold. The local SNRbased IBM is arguably easier to estimate computationally, asmany speech segregation algorithms compute binary time-frequency masks by exploring local SNR explicitly or im-plicitly �Divenyi, 2005; Wang and Brown, 2006�. Also, thereis little basis in a noisy signal to identify those T-F regionsof significant target energy where interference is much stron-ger.
J. Acoust. Soc. Am., Vol. 125, No. 4, April 2009 Wang et al.: Speech intelligibility with ideal binary masking 2345
48

The results from our experiments have major implica-tions for CASA and speech enhancement research aiming toimprove speech intelligibility in noisy environments. In ad-dition to affirming the general effectiveness of IBM as acomputational goal, our data provide direct evidence that achoice of LC at −6 dB for IBM construction, first suggestedby Brungart et al. �2006�, is effective for improving humanspeech recognition. A comparison between the data of Brun-gart et al. �2006� and ours for the SSN background indicatesthat the IBM with −6 dB LC yields larger SRT improvementthan commonly used 0 dB LC. Compared to 0 dB LC, thechoice of −6 dB LC retains those T-F units where local SNRfalls between 0 and −6 dB in ideal masking �see Fig. 1�.From the standpoint of SNR, such inclusion will lower theoverall SNR of the segregated signal. In other words, if theobjective is to improve the SNR of the output signal, thechoice of −6 dB LC is a poorer one compared to that of 0 dBLC. This discussion casts further doubt on the suitability oftraditional SNR as a performance metric to evaluate soundseparation systems, and at the same time, could shed light onwhy monaural speech enhancement algorithms often im-prove SNR but not speech intelligibility �see Sec. I�. Anotherstrong implication of our results �see also Anzalone et al.,2006� is that performing speech separation in the LF range isa great deal more important than in the HF range, particu-larly for improving speech intelligibility of HI listeners.
Our results point to a very promising direction for hear-ing aid design to improve speech intelligibility in noise oflisteners with hearing loss, that is, by designing hearing aidsthat function in similar ways to IBM. IBM processing im-proves SRT by a large margin, and HI listeners derive largerbenefit than NH listeners. Equally important, the profile ofimprovement with respect to different kinds of backgroundnoise seems to match that of typical hearing impairment. Weconsider it a highly significant result that ideal masking al-most equalizes the intelligibility performances of HI and NHlisteners �see Fig. 3�. Of course, facing a noisy input IBMcannot be directly constructed and algorithms must be devel-oped to estimate IBM. Encouraging effort has been made inCASA with the explicit goal of IBM estimation �Wang andBrown, 2006�, and in limited conditions high-quality esti-mates are obtainable �see, e.g., Roman et al., 2003�. How-ever, computing binary masks close to the IBM in uncon-strained acoustic environments remains a major challenge.On the other hand, the extent of intelligibility gain for HIlisteners produced by IBM processing much more than fillsthe SRT gap from NH listeners; Experiment 1 shows a gap of2.5 dB for the SSN background and a gap of 6.5 dB for thecafeteria background while the ideal masking improvementsfor HI listeners are 9.2 and 13.8 dB for the two backgrounds,respectively. Hence, perfect IBM estimation is not necessaryto bring the performance of HI listeners to the same level asthat of NH listeners.
VI. CONCLUSION
The present study was designed to evaluate the impactof IBM on speech intelligibility in noisy backgrounds forboth NH and HI listeners. Two experiments were conducted
and the main results are summarized below.
• For NH listeners, IBM processing resulted in 7.4 dB SRTreduction for SSN and 10.5 dB reduction for cafeterianoise.
• For HI listeners, IBM processing resulted in 9.2 dB SRTreduction for SSN and 15.6 dB reduction for cafeterianoise.
• After IBM processing, the intelligibility performances forHI listeners and NH listeners were comparable.
• For NH listeners, IBM processing at LFs produced greaterSRT reduction than at HFs. The differences were 3 dB forSSN and 2.5 dB for cafeteria noise.
• For HI listeners, IBM processing at LFs produced greaterSRT reduction than at HFs. The differences were 5.5 dBfor SSN and almost 8 dB for cafeteria noise.
ACKNOWLEDGMENTS
We thank the Associate Editor Ken Grant, and twoanonymous reviewers for their helpful comments. The workwas conducted while D.W. was a visiting scholar at OticonA/S. The authors are grateful to M. Schlaikjer, L. Bramsløw,and M. Hartvig, for their assistance in the experiments, andY. Li for his assistance in figure preparation. D.W. was sup-ported in part by an AFOSR grant �F49620-04-01-0027� andan NSF grant �IIS-0534707�.
Alcantara, J. I., Dooley, G., Blamey, P., and Seligman, P. �1994�. “Prelimi-nary evaluation of a formant enhancement algorithm on the perception ofspeech in noise for normally hearing listeners,” Audiology 33, 15–27.
Alcantara, J. I., Moore, B. C. J., Kuhnel, V., and Launer, S. �2003�. “Evalu-ation of the noise reduction system in a commercial digital hearing aid,”Int. J. Audiol. 42, 34–42.
Anzalone, M. C., Calandruccio, L., Doherty, K. A., and Carney, L. H.�2006�. “Determination of the potential benefit of time-frequency gainmanipulation,” Ear Hear. 27, 480–492.
Assmann, P., and Summerfield, A. Q. �2004�. “The perception of speechunder adverse conditions,” in Speech Processing in the Auditory System,edited by S. Greenberg, W. A. Ainsworth, A. N. Popper, and R. R. Fay�Springer, New York� pp. 231–308.
Baer, T., Moore, B. C. J., and Gatehouse, S. �1993�. “Spectral contrastenhancement of speech in noise for listeners with sensorineural hearingimpairment: Effects on intelligibility, quality, and response times,” J. Re-habil. Res. Dev. 30, 49–72.
Beck, S., and Zacharov, N. �2006�. Perceptual Audio Evaluation: Theory,Method and Application �Wiley, Chichester, NY�.
Benesty, J., Makino, S., and Chen, J., eds. �2005�. Speech Enhancement�Springer, New York�.
Bolia, R. S., Nelson, W. T., Ericson, M. A., and Simpson, B. D. �2000�. “Aspeech corpus for multitalker communications research,” J. Acoust. Soc.Am. 107, 1065–1066.
Bregman, A. S. �1990�. Auditory Scene Analysis �MIT, Cambridge, MA�.Brungart, D. S. �2001�. “Information and energetic masking effects in the
perception of two simultaneous talkers,” J. Acoust. Soc. Am. 109, 1101–1109.
Brungart, D., Chang, P. S., Simpson, B. D., and Wang, D. L. �2006�. “Iso-lating the energetic component of speech-on-speech masking with idealtime-frequency segregation,” J. Acoust. Soc. Am. 120, 4007–4018.
Bunnell, H. T. �1990�. “On enhancement of spectral contrast in speech forhearing-impaired listeners,” J. Acoust. Soc. Am. 88, 2546–2556.
Carhart, R. C., and Tillman, T. W. �1970�. “Interaction of competing speechsignals with hearing losses,” Arch. Otolaryngol. 91, 273–279.
Chang, P. �2004�. “Exploration of behavioral, physiological, and computa-tional approaches to auditory scene analysis,” M.S. thesis, The Ohio StateUniversity Department of Computer Science and Engineering, Columbus,OH; http://www.cse.ohio-state.edu/pnl/theses.html �Last viewed Septem-ber 2008�.
2346 J. Acoust. Soc. Am., Vol. 125, No. 4, April 2009 Wang et al.: Speech intelligibility with ideal binary masking
PAPER A 49

Ching, T. Y. C., Dillon, H., and Byrne, D. �1998�. “Speech recognition ofhearing-impaired listeners: Predictions from audibility and the limited roleof high-frequency amplification,” J. Acoust. Soc. Am. 103, 1128–1140.
Dillon, H. �2001�. Hearing Aids �Thieme, New York�.Divenyi, P., ed. �2005�. Speech Separation by Humans and Machines �Klu-
wer Academic, Norwell, MA�.Drullman, R. �1995�. “Speech intelligibility in noise: Relative contribution
of speech elements above and below the noise level,” J. Acoust. Soc. Am.98, 1796–1798.
Dubno, J. R., Dirks, D. D., and Ellison, D. E. �1989�. “Stop-consonantrecognition for normal-hearing listeners and listeners with high-frequencyhearing loss. I: The contribution of selected frequency regions,” J. Acoust.Soc. Am. 85, 347–354.
Edwards, B. �2004�. “Hearing aids and hearing impairment,” in Speech Pro-cessing in the Auditory System, edited by S. Greenberg, W. A. Ainsworth,A. N. Popper, and R. R. Fay �Springer, New York�.
Eisenberg, L. S., Dirks, D. D., and Bell, T. S. �1995�. “Speech recognition inamplitude-modulated noise of listeners with normal and listeners with im-paired hearing,” J. Speech Hear. Res. 38, 222–233.
Festen, J. M., and Plomp, R. �1990�. “Effects of fluctuating noise and inter-fering speech on the speech-reception threshold for impaired and normalhearing,” J. Acoust. Soc. Am. 88, 1725–1736.
Gagne, J.-P. �1988�. “Excess masking among listeners with a sensorineuralhearing loss,” J. Acoust. Soc. Am. 83, 2311–2321.
Greenberg, J. E., and Zurek, P. M. �1992�. “Evaluation of an adaptive beam-forming method for hearing aids,” J. Acoust. Soc. Am. 91, 1662–1676.
Hagerman, B. �1982�. “Sentences for testing speech intelligibility in noise,”Scand. Audiol. 11, 79–87.
Hagerman, B., and Kinnefors, C. �1995�. “Efficient adaptive methods formeasurements of speech reception thresholds in quiet and in noise,”Scand. Audiol. 24, 71–77.
Hansen, M., and Ludvigsen, C. �2001�. “Dantale II—Danske Hagermannsætninger �Dantale II—Danish Hagermann sentences�,” Danish SpeechAudiometry Materials �Danske Taleaudiomaterialer�, Værløse, Denmark.
Hogan, C. A., and Turner, C. W. �1998�. “High-frequency audibility: Ben-efits for hearing-impaired listeners,” J. Acoust. Soc. Am. 104, 432–441.
Howard-Jones, P. A., and Rosen, S. �1993�. “Uncomudulated glimpsing in‘checkerboard’ noise,” J. Acoust. Soc. Am. 93, 2915–2922.
Hygge, S., Ronnberg, J., Larsby, B., and Arlinger, S. �1992�. “Normal-hearing and hearing-impaired subjects’ ability to just follow conversationin competing speech, reversed speech, and noise backgrounds,” J. SpeechHear. Res. 35, 208–215.
Jerger, J. F., Tillman, T. W., and Peterson, J. L. �1960�. “Masking by octavebands of noise in normal and impaired ears,” J. Acoust. Soc. Am. 32,385–390.
Johannesson, R. B. �2006�. “Output SNR measurement method,” Report No.052-08-04, Oticon Research Centre Eriksholm, Snekkersten, Denmark.
Kates, J. M., and Weiss, M. R. �1996�. “A comparison of hearing-aid array-processing techniques,” J. Acoust. Soc. Am. 99, 3138–3148.
Klein, A. J., Mills, J. H., and Adkins, W. Y. �1990�. “Upward spread ofmasking, hearing loss, and speech recognition in young and elderly listen-ers,” J. Acoust. Soc. Am. 87, 1266–1271.
Levitt, H. �2001�. “Noise reduction in hearing aids: A review,” J. Rehabil.Res. Dev. 38, 111–121.
Li, N., and Loizou, P. C. �2007�. “Factors influencing glimpsing of speech innoise,” J. Acoust. Soc. Am. 122, 1165–1172.
Li, N., and Loizou, P. C. �2008a�. “Effect of spectral resolution on theintelligibility of ideal binary masked speech,” J. Acoust. Soc. Am. 123,EL59–EL64.
Li, N., and Loizou, P. C. �2008b�. “Factors influencing intelligibility of idealbinary-masked speech: Implications for noise reduction,” J. Acoust. Soc.Am. 123, 1673–1682.
Li, Y., and Wang, D. L. �2009�. “On the optimality of ideal binary time-frequency masks,” Speech Commun. 51, 230–239.
Lim, J., ed. �1983�. Speech Enhancement �Prentice-Hall, Englewood Cliffs,NJ�.
Miller, G. A., and Licklider, J. C. R. �1950�. “The intelligibility of inter-rupted speech,” J. Acoust. Soc. Am. 22, 167–173.
Moore, B. C. J. �2003a�. An Introduction to the Psychology of Hearing, 5thed. �Academic, San Diego, CA�.
Moore, B. C. J. �2003b�. “Speech processing for the hearing-impaired: Suc-cesses, failures, and implications for speech mechanisms,” Speech Com-mun. 41, 81–91.
Moore, B. C. J. �2007�. Cochlear Hearing Loss, 2nd ed. �Wiley, Chichester,UK�.
Nilsson, M., Soli, S., and Sullivan, J. A. �1994�. “Development of the hear-ing in noise test for the measurement of speech reception thresholds inquiet and in noise,” J. Acoust. Soc. Am. 95, 1085–1099.
Peters, R. W., Moore, B. C. J., and Baer, T. �1998�. “Speech receptionthresholds in noise with and without spectral and temporal dips forhearing-impaired and normally hearing people,” J. Acoust. Soc. Am. 103,577–587.
Plomp, R. �1994�. “Noise, amplification, and compression: Considerationsof three main issues in hearing aid design,” Ear Hear. 15, 2–12.
Rabiner, L. R., and Juang, B. H. �1993�. Fundamentals of Speech Recogni-tion �Prentice-Hall, Englewood Cliffs, NJ�.
Ricketts, T., and Hornsby, B. W. �2003�. “Distance and reverberation effectson directional benefit,” Ear Hear. 24, 472–484.
Roman, N., Wang, D. L., and Brown, G. J. �2003�. “Speech segregationbased on sound localization,” J. Acoust. Soc. Am. 114, 2236–2252.
Schum, D. J. �2003�. “Noise-reduction circuitry in hearing aids, II: Goalsand current strategies,” Hear. J. 56, 32–41.
Simpson, A. M., Moore, B. C. J., and Glasberg, B. R. �1990�. “Spectralenhancement to improve the intelligibility of speech in noise for hearing-impaired listeners,” Acta Oto-Laryngol. 469, 101–107.
StatSoft, Inc. �2007�. STATISTICA �data analysis software system�, version 7,http://www.statsoft.com �Last viewed February 2008�.
Studebaker, G. A., Sherbecoe, R. L., McDaniel, D. M., and Gwaltney, C. A.�1999�. “Monosyllabic word recognition at higher-than-normal speech andnoise levels,” J. Acoust. Soc. Am. 105, 2431–2444.
Vestergaard, M. �1998�. “The Eriksholm CD 01: Speech signals in variousacoustical environments,” Report No. 050-08-01, Oticon Research CentreEriksholm, Snekkersten, Denmark.
Wagener, K., Josvassen, J. L., and Ardenkjær, R. �2003�. “Design, optimi-zation and evaluation of a Danish sentence test in noise,” Int. J. Audiol.42, 10–17.
Wang, D. L. �2005�. “On ideal binary mask as the computational goal ofauditory scene analysis,” in Speech Separation by Humans and Machines,edited by P. Divenyi �Kluwer Academic, Norwell, MA�, pp. 181–197.
Wang, D. L., and Brown, G. J., eds. �2006�. Computational Auditory SceneAnalysis: Principles, Algorithms, and Applications �Wiley, Hoboken, NJ/IEEE, New York�.
J. Acoust. Soc. Am., Vol. 125, No. 4, April 2009 Wang et al.: Speech intelligibility with ideal binary masking 2347
50
Paper B
Speech Perception of Noise with Binary Gains
DeLiang Wang, Ulrik Kjems, Michael S. Pedersen,Jesper B. Boldt, and Thomas Lunner
Journal of the Acoustical Society of AmericaVol. 124, no. 4, pp. 2303–2307, October 2008.
c©2008 Acoustical Society of America

Speech perception of noise with binary gainsDeLiang Wanga�
Department of Computer Science & Engineering, and Center for Cognitive Science,The Ohio State University, Columbus, Ohio 43210
Ulrik Kjems, Michael S. Pedersen, and Jesper B. BoldtOticon A/S, Kongebakken 9, DK-2765 Smørum, Denmark
Thomas LunnerOticon Research Centre Eriksholm, Kongevejen 243, DK-3070 Snekkersten, Denmarkand Department of Clinical and Experimental Medicine, and Technical Audiology, Linköping University,S-58183 Linköping, Sweden
�Received 9 December 2007; revised 7 July 2008; accepted 8 July 2008�
For a given mixture of speech and noise, an ideal binary time-frequency mask is constructed bycomparing speech energy and noise energy within local time-frequency units. It is observed thatlisteners achieve nearly perfect speech recognition from gated noise with binary gains prescribed bythe ideal binary mask. Only 16 filter channels and a frame rate of 100 Hz are sufficient for highintelligibility. The results show that, despite a dramatic reduction of speech information, a pattern ofbinary gains provides an adequate basis for speech perception.© 2008 Acoustical Society of America. �DOI: 10.1121/1.2967865�
PACS number�s�: 43.71.Gv, 43.66.Dc �KWG� Pages: 2303–2307
I. INTRODUCTION
Human speech recognition shows remarkable robustnessin a variety of listening conditions, including competing talk-ers, environmental sounds, and background noise. Under-standing how speech is recognized under these conditions isimportant not only for auditory perception but also for auto-matic speech recognition, where robustness to acoustic inter-ference remains elusive �Lippmann, 1997; Allen, 2005�. Re-lated research in computational auditory scene analysis�CASA� and blind source separation makes use of a binarytime–frequency �T–F� masking technique �Roman et al.,2003; Hu and Wang, 2004; Yilmaz and Rickard, 2004�.Time–frequency masking operates on a T–F representationor decomposition of the input into a two-dimensional matrixof T–F units. Such a representation can be readily generatedby passing the input signal through a filterbank and then timewindowing the response of each filter. Then binary maskingas a means of separation amounts to identifying a binarymask where 1 indicates that the acoustic energy in the cor-responding T–F unit is retained and 0 indicates that the en-ergy is removed. In other words, binary masking applies apattern of binary gains to the mixture signal. It should benoted that the term “masking” here means weighting themixture, which is different from the same term used in psy-choacoustics where it means blocking the target sound byacoustic interference.
Among T–F masks, the so-called ideal binary mask�IBM� has been suggested to be a goal of CASA �Wang,2005�. The IBM is a matrix where 1 indicates that the signal-to-noise ratio �SNR� within the corresponding T–F unit ex-
ceeds a threshold LC �local SNR criterion� and 0 otherwise.The mask is “ideal” because its construction requires thatspeech and noise be available before they are mixed, and themask possesses certain optimality in terms of overall SNRgain when LC is set to 0 dB �Li and Wang, 2008�.
Recent studies in speech perception show that applyingIBM to noisy speech leads to large speech intelligibility im-provements �Brungart et al., 2006; Anzalone et al., 2006; Liand Loizou, 2008�. In particular, Brungart et al. �2006� andLi and Loizou �2008� have shown that, with fixed levels ofinput SNR �between −10 and 0 dB�, a range of LC valuesproduces nearly 100% correct scores. The large intelligibilitygain has been attributed to ideal segregation �or detection�that directs the listener’s attention to the T–F regions ofnoisy speech where the target speech is relatively strong.This explanation emphasizes the importance of the target sig-nal contained in the T–F units labeled 1 for intelligibility.How important is the binary pattern of an ideal mask itself?This investigation was designed to isolate the intelligibilitycontribution of an IBM by removing the target speech signalfrom all T–F units.
Specifically, with linear filters, including gammatone fil-ters �Patterson et al., 1988; Wang and Brown, 2006�, increas-ing or decreasing the SNR of a mixture while changing LCby the same amount does not alter the IBM. On the otherhand, although co-reducing input SNR and LC does notchange the IBM, the masked mixture becomes progressivelynoisier or contains less target signal. Taking this manipula-tion to the limit, i.e., setting both mixture SNR and LC to −�dB, leads to an output that contains only noise with no targetspeech at all. This particular output corresponds to turning onor off the filtered noise according to a pattern prescribed bythe IBM. Our study evaluates speech intelligibility of noisegated by the IBM obtained in this way.
a�Author to whom correspondence should be addressed. Electronic mail:[email protected]
J. Acoust. Soc. Am. 124 �4�, October 2008 © 2008 Acoustical Society of America 23030001-4966/2008/124�4�/2303/5/$23.00
PAPER B 53
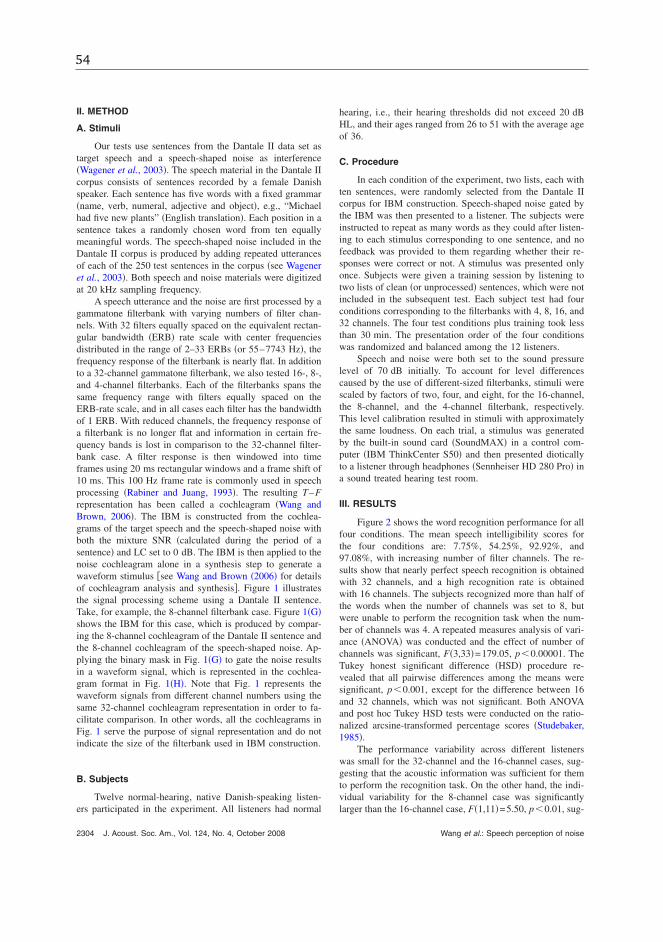
II. METHOD
A. Stimuli
Our tests use sentences from the Dantale II data set astarget speech and a speech-shaped noise as interference�Wagener et al., 2003�. The speech material in the Dantale IIcorpus consists of sentences recorded by a female Danishspeaker. Each sentence has five words with a fixed grammar�name, verb, numeral, adjective and object�, e.g., “Michaelhad five new plants” �English translation�. Each position in asentence takes a randomly chosen word from ten equallymeaningful words. The speech-shaped noise included in theDantale II corpus is produced by adding repeated utterancesof each of the 250 test sentences in the corpus �see Wageneret al., 2003�. Both speech and noise materials were digitizedat 20 kHz sampling frequency.
A speech utterance and the noise are first processed by agammatone filterbank with varying numbers of filter chan-nels. With 32 filters equally spaced on the equivalent rectan-gular bandwidth �ERB� rate scale with center frequenciesdistributed in the range of 2–33 ERBs �or 55–7743 Hz�, thefrequency response of the filterbank is nearly flat. In additionto a 32-channel gammatone filterbank, we also tested 16-, 8-,and 4-channel filterbanks. Each of the filterbanks spans thesame frequency range with filters equally spaced on theERB-rate scale, and in all cases each filter has the bandwidthof 1 ERB. With reduced channels, the frequency response ofa filterbank is no longer flat and information in certain fre-quency bands is lost in comparison to the 32-channel filter-bank case. A filter response is then windowed into timeframes using 20 ms rectangular windows and a frame shift of10 ms. This 100 Hz frame rate is commonly used in speechprocessing �Rabiner and Juang, 1993�. The resulting T–Frepresentation has been called a cochleagram �Wang andBrown, 2006�. The IBM is constructed from the cochlea-grams of the target speech and the speech-shaped noise withboth the mixture SNR �calculated during the period of asentence� and LC set to 0 dB. The IBM is then applied to thenoise cochleagram alone in a synthesis step to generate awaveform stimulus �see Wang and Brown �2006� for detailsof cochleagram analysis and synthesis�. Figure 1 illustratesthe signal processing scheme using a Dantale II sentence.Take, for example, the 8-channel filterbank case. Figure 1�G�shows the IBM for this case, which is produced by compar-ing the 8-channel cochleagram of the Dantale II sentence andthe 8-channel cochleagram of the speech-shaped noise. Ap-plying the binary mask in Fig. 1�G� to gate the noise resultsin a waveform signal, which is represented in the cochlea-gram format in Fig. 1�H�. Note that Fig. 1 represents thewaveform signals from different channel numbers using thesame 32-channel cochleagram representation in order to fa-cilitate comparison. In other words, all the cochleagrams inFig. 1 serve the purpose of signal representation and do notindicate the size of the filterbank used in IBM construction.
B. Subjects
Twelve normal-hearing, native Danish-speaking listen-ers participated in the experiment. All listeners had normal
hearing, i.e., their hearing thresholds did not exceed 20 dBHL, and their ages ranged from 26 to 51 with the average ageof 36.
C. Procedure
In each condition of the experiment, two lists, each withten sentences, were randomly selected from the Dantale IIcorpus for IBM construction. Speech-shaped noise gated bythe IBM was then presented to a listener. The subjects wereinstructed to repeat as many words as they could after listen-ing to each stimulus corresponding to one sentence, and nofeedback was provided to them regarding whether their re-sponses were correct or not. A stimulus was presented onlyonce. Subjects were given a training session by listening totwo lists of clean �or unprocessed� sentences, which were notincluded in the subsequent test. Each subject test had fourconditions corresponding to the filterbanks with 4, 8, 16, and32 channels. The four test conditions plus training took lessthan 30 min. The presentation order of the four conditionswas randomized and balanced among the 12 listeners.
Speech and noise were both set to the sound pressurelevel of 70 dB initially. To account for level differencescaused by the use of different-sized filterbanks, stimuli werescaled by factors of two, four, and eight, for the 16-channel,the 8-channel, and the 4-channel filterbank, respectively.This level calibration resulted in stimuli with approximatelythe same loudness. On each trial, a stimulus was generatedby the built-in sound card �SoundMAX� in a control com-puter �IBM ThinkCenter S50� and then presented dioticallyto a listener through headphones �Sennheiser HD 280 Pro� ina sound treated hearing test room.
III. RESULTS
Figure 2 shows the word recognition performance for allfour conditions. The mean speech intelligibility scores forthe four conditions are: 7.75%, 54.25%, 92.92%, and97.08%, with increasing number of filter channels. The re-sults show that nearly perfect speech recognition is obtainedwith 32 channels, and a high recognition rate is obtainedwith 16 channels. The subjects recognized more than half ofthe words when the number of channels was set to 8, butwere unable to perform the recognition task when the num-ber of channels was 4. A repeated measures analysis of vari-ance �ANOVA� was conducted and the effect of number ofchannels was significant, F�3,33�=179.05, p�0.00001. TheTukey honest significant difference �HSD� procedure re-vealed that all pairwise differences among the means weresignificant, p�0.001, except for the difference between 16and 32 channels, which was not significant. Both ANOVAand post hoc Tukey HSD tests were conducted on the ratio-nalized arcsine-transformed percentage scores �Studebaker,1985�.
The performance variability across different listenerswas small for the 32-channel and the 16-channel cases, sug-gesting that the acoustic information was sufficient for themto perform the recognition task. On the other hand, the indi-vidual variability for the 8-channel case was significantlylarger than the 16-channel case, F�1,11�=5.50, p�0.01, sug-
2304 J. Acoust. Soc. Am., Vol. 124, No. 4, October 2008 Wang et al.: Speech perception of noise
54

FIG. 1. �Color online� Illustration of gated noise by binary gains. �A� 32-channel cochleagram of a Dantale II sentence. �B� 32-channel cochleagram ofspeech-shaped noise. �C� IBM with 32 channels, where 1 is indicated by white and 0 by black. �D� 32-channel cochleagram of gated noise by the IBM in �C�.�E� IBM with 16 channels. �F� 32-channel cochleagram of gated noise by the IBM in �E�. �G� IBM with 8 channels. �H� 32-channel cochleagram of gatednoise by the IBM in �G�. �I� IBM with 4 channels. �J� 32-channel cochleagram of gated noise by the IBM in �I�.
J. Acoust. Soc. Am., Vol. 124, No. 4, October 2008 Wang et al.: Speech perception of noise 2305
PAPER B 55

gesting that factors such as the ability and tendency to guess,concentration, and prior experience with corrupted speech,come into play.
The results in Fig. 2 clearly demonstrate that very highrecognition can be obtained by turning on and off 16 bandsof noise at a rate of 100 Hz following a specific pattern. Thespeech signal plays the sole role of determining the IBM.Such a stimulus contains little speech-specific information.The spectral shape of speech is drastically reduced to a bi-nary variation, and so is the temporal envelope. The har-monic structure of voiced speech is absent, and the temporalfine structure �the carrier signal underlying the temporal en-velope� of the stimulus reflects that of noise, not speech.Despite this dramatic reduction of speech information, listen-ers are capable of speech perception.
So what cues enable listeners to perceive speech fromIBM-gated noise? The binary pattern encodes a general out-line of spectrotemporal energy variations of speech relativeto noise. Binary-gated noise crudely reflects the formantstructure of speech; as shown in Fig. 1, IBM-gated noiseappears to “carve out” regions of noise energy that roughlymatch the spectrotemporal peaks of speech. Our results indi-cate that such a pattern of energy variations is sufficient forrecognition purposes.
IV. DISCUSSION AND CONCLUSION
Our study bears resemblance to the well-known study byShannon et al. �1995� demonstrating that only a few bands ofnoise modulated by the corresponding speech envelopes suf-fice for speech intelligibility �for a much earlier study usingmore bands see Dudley �1939��. There are, however, severaldifferences between our binary-gated noise and the vocodednoise of Shannon et al. Perhaps the most important and ob-vious difference is that, within a frequency channel, noisemodulation uses a binary envelope in our study and a fullenvelope in vocoded noise. Second, the IBM is derived by acomparison between target speech and speech-shaped noise,while temporal envelopes in vocoded noise are obtainedfrom target speech alone. We note that many speech separa-
tion algorithms compute a binary mask by implicitly or ex-plicitly exploiting local SNR �Divenyi, 2005; Wang andBrown, 2006�, making the ideal mask amenable to computa-tional estimation. Third, the bandwidths of noise bands inShannon et al. change as the number of the bands varies inorder to cover the entire frequency range of interest; in IBM-gated noise, the bandwidth of each frequency channel isfixed to 1 ERB regardless of the number of filtbank channels.It is also worth mentioning that recognizing vocoded noisetakes hours of training, while no training on binary-gatednoise was given in our experiment.
Like vocoded noise, the type of noise used in binarygating likely has an effect on speech intelligibility. Thespeech-shaped noise used in this study is a steady noise witha long-term spectrum matching that of the utterances in theDantale II corpus, and may be particularly effective for IBMgating, although our informal listening indicates that othertypes of steady noise, such as pink noise, can also produceintelligible speech. Our experiment was conducted usingDanish utterances. Byrne et al. �1994� reported that the long-term average speech spectra of a group of languages, includ-ing Danish and English, are quite similar, suggesting that,though there are likely some language effects, the main ob-servations of our experiment may hold for English and otherlanguages. Also, the IBM used in this study is constructedwhen input SNR and LC are set to be equal �−� dB�. Fixingone of them while varying the other produces differentIBMs. For example, when input SNR is set to 0 dB, increas-ing LC results in ideal masks with fewer and fewer 1’s,whereas decreasing LC leads to more and more 1’s. Is equat-ing input SNR and LC most effective for intelligibility ofIBM-gated noise? Further investigation is required to addressthe issues regarding noise type, language, and input SNR andLC levels.
That a pattern of binary gains is apparently sufficient forhuman speech recognition, like previous work on vocodednoise, raises intriguing questions on the nature of humanspeech recognition. What speech information is truly indis-pensable for intelligibility? Could the IBM itself be what isbeing recognized? Almost perfect speech recognition fromsuch drastically reduced speech information has broad impli-cations for CASA, automatic speech recognition, hearingprosthesis, and coding and compression in speech communi-cation.
ACKNOWLEDGMENTS
The authors thank Associate Editor Ken Grant, and twoanonymous reviewers for their constructive criticisms andsuggestions. The work was performed while D.L.W. was avisiting scholar at Oticon A/S. The authors thank M.Schlaikjer, L. Bramsløw, and M. Hartvig for their assistancein the experiments, and Y. Li for his assistance in figurepreparation. D.L.W. was supported in part by AFOSR GrantNo. F49620-04-01-0027 and NSF Grant No. IIS-0534707.
Allen, J. B. �2005�. Articulation and Intelligibility �Morgan & Claypool, SanRafael, CA�.
Anzalone, M. C., Calandruccio, L., Doherty, K. A., and Carney, L. H.�2006�. “Determination of the potential benefit of time-frequency gain
Number of channels4 8 16 32
0
10
20
30
40
50
60
70
80
90
100
Percentcorrect
FIG. 2. Word intelligibility scores for 12 normal-hearing listeners with re-spect to different filterbank sizes. Dots denote the mean scores and verticalbars indicate 95% confidence intervals.
2306 J. Acoust. Soc. Am., Vol. 124, No. 4, October 2008 Wang et al.: Speech perception of noise
56

manipulation,” Ear Hear. 27, 480–492.Brungart, D., Chang, P. S., Simpson, B. D., and Wang, D. L. �2006�. “Iso-
lating the energetic component of speech-on-speech masking with idealtime-frequency segregation,” J. Acoust. Soc. Am. 120, 4007–4018.
Byrne, D., Dillion, H., Tran, K., Arlinger, S., Wilbraham, K., Cox, R.,Hagerman, B., Hetu, R., Kei, J., Lui, C., Kiessling, J., Kotby, M. N.,Nasser, N. H. A., El Kholy, W. A. H., Nakanishi, Y., Oyer, H., Powell, R.,Stephens, D., Meredith, R., Sirimanna, T., Tavartkiladze, G., Frolenkov,G. I., Westerman, S., and Ludvigsen, C. �1994�. “An international com-parison of long-term average speech spectra,” J. Acoust. Soc. Am. 96,2108–2120.
Divenyi, P., ed. �2005�. Speech Separation by Humans and Machines �Klu-wer Academic, Norwell, MA�.
Dudley, H. �1939�. “Remaking speech,” J. Acoust. Soc. Am. 11, 169–177.Hu, G., and Wang, D. L. �2004�. “Monaural speech segregation based on
pitch tracking and amplitude modulation,” IEEE Trans. Neural Netw. 15,1135–1150.
Li, N., and Loizou, P. C. �2008�. “Factors influencing intelligibility of idealbinary-masked speech: Implications for noise reduction,” J. Acoust. Soc.Am. 123, 1673–1682.
Li, Y., and Wang, D. L. �2008�. “On the optimality of ideal binary time-frequency masks,” in Proceedings of IEEE ICASSP, pp. 3501–3504.
Lippmann, R. P. �1997�. “Speech recognition by machines and humans,”
Speech Commun. 22, 1–16.Patterson, R. D., Holdsworth, J., Nimmo-Smith, I., and Rice, P. �1988�.
“SVOS final report, part B: Implementing a gammatone filterbank,” Rep.No. 2341, MRC Applied Psychology Unit.
Rabiner, L. R., and Juang, B. H. �1993�. Fundamentals of Speech Recogni-tion �Prentice-Hall, Englewood Cliffs, NJ�.
Roman, N., Wang, D. L., and Brown, G. J. �2003�. “Speech segregationbased on sound localization,” J. Acoust. Soc. Am. 114, 2236–2252.
Shannon, R. V., Zeng, F. G., Kamath, V., Wygonski, J., and Ekelid, M.�1995�. “Speech recognition with primarily temporal cues,” Science 270,303–304.
Studebaker, G. A. �1985�. “A ‘rationalized’ arcsine transform,” J. SpeechHear. Res. 28, 455–462.
Wagener, K., Josvassen, J. L., and Ardenkjær, R. �2003�. “Design, optimi-zation and evaluation of a Danish sentence test in noise,” Int. J. Audiol.42, 10–17.
Wang, D. L. �2005�. “On ideal binary mask as the computational goal ofauditory scene analysis,” in Speech Separation by Humans and Machines,edited by P. Divenyi �Kluwer Academic, Norwell, MA�, pp. 181–197.
Wang, D. L., and Brown, G. J., eds. �2006�. Computational Auditory SceneAnalysis: Principles, Algorithms, and Applications �Wiley, Hoboken, NJ�.
Yilmaz, O., and Rickard, S. �2004�. “Blind separation of speech mixtures viatime-frequency masking,” IEEE Trans. Signal Process. 52, 1830–1847.
J. Acoust. Soc. Am., Vol. 124, No. 4, October 2008 Wang et al.: Speech perception of noise 2307
PAPER B 57

58

Paper C
Role of Mask Pattern in Intelligibility of Ideal
Binary-masked Noisy Speech
Ulrik Kjems, Jesper B. Boldt, Michael S. Pedersen,Thomas Lunner, and DeLiang Wang
Journal of the Acoustical Society of AmericaVol. 126, no. 3, pp. 1415–1426, September 2009.

c©2009 Acoustical Society of America

Role of mask pattern in intelligibility of ideal binary-maskednoisy speech
Ulrik Kjems,a� Jesper B. Boldt, and Michael S. PedersenOticon A/S, Kongebakken 9, DK-2765 Smørum, Denmark
Thomas LunnerOticon Research Centre Eriksholm, Kongevejen 243, DK-3070 Snekkersten, Denmark and Departmentof Clinical and Experimental Medicine, and Technical Audiology, Linköping University,S-58183 Linköping, Sweden
DeLiang WangDepartment of Computer Science and Engineering and Center for Cognitive Science,The Ohio State University, Columbus, Ohio 43210
�Received 11 September 2008; revised 9 May 2009; accepted 22 June 2009�
Intelligibility of ideal binary masked noisy speech was measured on a group of normal hearingindividuals across mixture signal to noise ratio �SNR� levels, masker types, and local criteria forforming the binary mask. The binary mask is computed from time-frequency decompositions oftarget and masker signals using two different schemes: an ideal binary mask computed bythresholding the local SNR within time-frequency units and a target binary mask computed bycomparing the local target energy against the long-term average speech spectrum. By depictingintelligibility scores as a function of the difference between mixture SNR and local SNR threshold,alignment of the performance curves is obtained for a large range of mixture SNR levels. Largeintelligibility benefits are obtained for both sparse and dense binary masks. When an ideal mask isdense with many ones, the effect of changing mixture SNR level while fixing the mask is significant,whereas for more sparse masks the effect is small or insignificant.© 2009 Acoustical Society of America. �DOI: 10.1121/1.3179673�
PACS number�s�: 43.71.An, 43.71.Gv, 43.66.Ba, 43.66.Dc �MSS� Pages: 1415–1426
I. INTRODUCTION
The human ability to understand speech in a variety ofadverse conditions is remarkable, and the underlying pro-cesses are not well understood. According to Bregman’s au-ditory scene analysis account, the auditory system processesthe acoustic input in two stages: an analysis and segmenta-tion stage where the sound is decomposed into distinct time-frequency �T-F� segments followed by a grouping stage�Bregman, 1990; Wang and Brown, 2006�. The groupingstage is divided into primitive grouping and schema drivengrouping that represent bottom-up and top-down processes,respectively. Hence, in order to recognize speech in back-ground noise, the auditory system would employ a combina-tion of bottom-up processing of available cues, and top-downapplication of schemas, which represent learned patterns.
In this paper these processes are studied using the tech-nique of ideal T-F segregation �ITFS�, which was proposedby Brungart et al. �2006� to induce idealized grouping whenlistening to a mixture of target speech and noise. ITFS isbased on the use of ideal binary mask �IBM�, which wasoriginally proposed as a benchmark for measuring the segre-gation performance of computational auditory scene analysissystems �Wang, 2005�. The ITFS technique applies an IBMto the mixture, and several recent studies have utilized the
technique for revealing important factors for speech intelli-gibility in noise �Brungart et al., 2006; Anzalone et al., 2006;Li and Loizou, 2008; Wang et al., 2009�.
A binary mask is defined in the T-F domain as a matrixof binary numbers. We refer to the basic elements of the T-Frepresentation of a signal as T-F units. A frequency decom-position similar to the human ear can be achieved using abank of gammatone filters �Patterson et al., 1988�, and signalenergies are computed in time frames �Wang and Brown,2006�. The IBM is defined by comparing the signal-to-noiseratio within each T-F unit against a local criterion �LC� orthreshold measured in units of decibels. Only the T-F unitswith local signal to noise ratio �SNR� exceeding LC are as-signed 1 in the binary mask. Let T�t , f� and M�t , f� denotetarget and masker signal power measured in decibels, at timet and frequency f , respectively, the IBM is defined as
IBM�t, f� = �1 if T�t, f� − M�t, f� � LC,
0 otherwise.� �1�
An IBM segregated signal can be synthesized from themixture by deriving a gain from the binary mask, and apply-ing it to the mixture before recombination in a synthesis filterbank. However, not all studies follow the same procedure—sometimes the short-time Fourier transform is used �for in-stance Li and Loizou, 2008� which typically yields lowerfrequency resolution at low frequencies, but much higherresolution at high frequencies.
In Brungart et al., 2006, the IBM was used as a means toretain the effect of energetic masking, thereby separating the
a�Author to whom correspondence should be addressed. Electronic mail:[email protected]
J. Acoust. Soc. Am. 126 �3�, September 2009 © 2009 Acoustical Society of America 14150001-4966/2009/126�3�/1415/12/$25.00
PAPER C 61

energetic masking and informational masking effects. Theyargued that since the IBM removes those T-F units domi-nated by the masker, ITFS can be said to retain the effect ofenergetic masking, while removing informational maskingcaused by the excluded units with relatively significantmasker energy. Informational masking refers to the inabilityto correctly segregate audible target information from themixture. Their study showed a plateau of nearly perfect in-telligibility of ITFS processed mixtures when varying thevalue of LC from −12 to 0 dB. Meanwhile, the IBM with0 dB LC is considered to be the theoretically optimal maskout of all possible binary masks in terms of SNR gain �Liand Wang, 2009�. Brungart et al. �2006� noted that loweringthe mixture SNR by 1 dB while fixing LC causes the exactsame T-F units to be left out as increasing the LC by 1 dBwhile fixing the mixture SNR; in other words, the IBM re-mains the same in these two scenarios. They demonstratedremarkably similar performance curves by altering the testconditions in the two ways described, which they interpret asrough equivalence in the effect of energetic masking.
Anzalone et al. �2006� showed large intelligibility ben-efits of IBM segregation and reported positive results onhearing impaired subjects, although their IBM definition isdifferent from the previously outlined ITFS procedure. Theycomputed the IBM by comparing the target signal to a fixedthreshold adjusted to retain a certain percentage of the totaltarget energy. Furthermore they attenuated the T-F units des-ignated as non-target by 14 dB, in contrast to the total elimi-nation described above. Their results showed more than 7 dBimprovement in speech reception threshold �SRT� for normalhearing and more than 9 dB improvement for hearing im-paired subjects.
In a study comparing impaired and normal-hearing sub-jects, Wang et al. �2009� demonstrated large improvementsin SRT for both normal-hearing and hearing impaired groupsdue to ITFS processing of speech mixtures. Their study ofthe normal-hearing group shows an 11 dB improvement inSRT with a cafeteria noise masker containing conversationalspeech and an improvement of 7 dB for speech-shaped noise�SSN�. For the hearing impaired group, the SRT improve-ment was 16 dB in cafeteria noise and 9 dB in SSN. As asurprising result, the SRTs obtained from the normal-hearingand hearing impaired groups on the ITFS processed mixtureswere comparable.
Li and Loizou �2008� used short time Fourier transformsto apply ideal binary masking to mixtures with a two-talkermasker, as well as modulated and unmodulated SSNmaskers. They found large intelligibility benefits similar toBrungart et al. �2006� when varying the LC parameter, al-though they reported wider plateaus of LC values with al-most perfect intelligibility �−20 to +5 dB compared to−12 to 0 dB in Brungart et al., 2006�, which they attributedto differences in speech material and filterbank setup. Theyfurther suggested that it may be the pattern of the binarymask itself that matters for intelligibility, rather than the localSNR of each T-F unit.
Wang et al. �2008� demonstrated that applying a binarypattern of gains obtained from an IBM with a SSN masker tothe masker signal alone produces high intelligibility scores, a
type of process related to noise vocoding �Dudley, 1939;Shannon et al., 1995�. Using different numbers of filterbankbands, they showed that intelligibility is lost when the num-ber of channels is 8 or smaller, a result which differs fromthat reported by Shannon et al. �1995� who used continuous,rather than binary, values for envelope manipulation. There,high intelligibility was reported using noise vocoded in justfour channels.
A. Motivation
The large benefits in intelligibility outlined previouslycould make the IBM a candidate for applications such ashearing aids, provided that the IBM can be approximatedsufficiently well. In this paper we will not consider how suchestimation might be done. However, to devise such applica-tions it is important to understand the mechanisms by whichthe IBM enhances intelligibility. In the above described lit-erature, much attention has been given to explaining intelli-gibility of IBM segregated mixtures by considering audibil-ity of the target signal. By focusing on absolute regions ofLC �Brungart et al., 2006�, emphasis is put on the interpre-tation that the IBM reduces informational masking by direct-ing listeners’ attention to the T-F units containing target in-formation �Li and Loizou, 2008�. This view is basicallyrelated to models of intelligibility based on target audibilityin additive noise, such as the speech intelligibility index�ANSI, 1997�, where intelligibility is described as a functionof the proportion of target signal that is audible in differentfrequency bands. Cooke �2006� and Srinivasan and Wang�2008� proposed related computational models that operateon mixture input directly and produce recognition resultsfrom automatic speech recognition that are compatible withhuman intelligibility performance.
However, some of the previous published results seeminconsistent with this view. In particular, the observation ofWang et al. �2008� that IBM-processed noise is intelligiblesuggests that the resulting temporal envelope of the pro-cessed mixture is important. The speech transmission index�Houtgast and Steeneken, 1971� considers how distortions tothe envelope affect speech intelligibility. Recent extensionshave been made to improve the model predictions of nonlin-early processed speech �Goldsworthy and Greenberg, 2004�.While the speech intelligibility index model cannot explainthe noise gating results of Wang et al. �2008�, a model basedon speech transmission index described by Goldsworthy andGreenberg �2004� may perform better. This means that thetarget modulation carried by the IBM may play a key role inintelligibility of processed mixtures.
Based on the observation that the IBM is insensitive tothe covariation of LC and mixture SNR, we propose to focuson the difference between the LC and the mixture SNR levelswhen comparing performance across mixture SNR levels.We therefore introduce a relative criterion �RC�, defined asRC=LC−SNR in units of decibels.
By focusing on RC and varying the mixture SNR, it ispossible to vary the effects of the target component of theIBM processed mixture relative to that of the masker. Forexample, by taking the mixture SNR to a large negative
1416 J. Acoust. Soc. Am., Vol. 126, No. 3, September 2009 Kjems et al.: Pattern role in ideally segregated speech
62
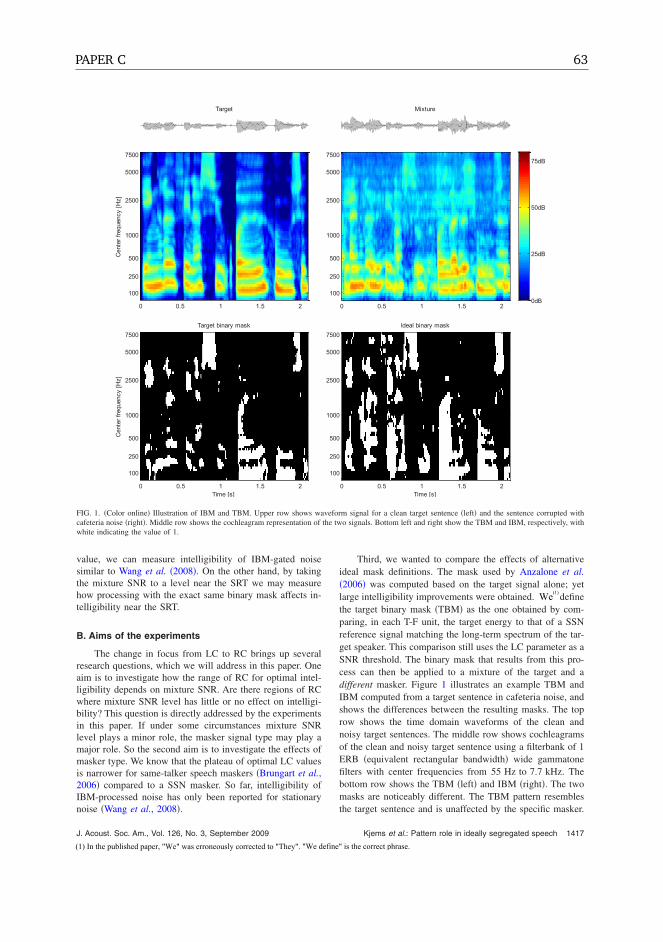
value, we can measure intelligibility of IBM-gated noisesimilar to Wang et al. �2008�. On the other hand, by takingthe mixture SNR to a level near the SRT we may measurehow processing with the exact same binary mask affects in-telligibility near the SRT.
B. Aims of the experiments
The change in focus from LC to RC brings up severalresearch questions, which we will address in this paper. Oneaim is to investigate how the range of RC for optimal intel-ligibility depends on mixture SNR. Are there regions of RCwhere mixture SNR level has little or no effect on intelligi-bility? This question is directly addressed by the experimentsin this paper. If under some circumstances mixture SNRlevel plays a minor role, the masker signal type may play amajor role. So the second aim is to investigate the effects ofmasker type. We know that the plateau of optimal LC valuesis narrower for same-talker speech maskers �Brungart et al.,2006� compared to a SSN masker. So far, intelligibility ofIBM-processed noise has only been reported for stationarynoise �Wang et al., 2008�.
Third, we wanted to compare the effects of alternativeideal mask definitions. The mask used by Anzalone et al.�2006� was computed based on the target signal alone; yetlarge intelligibility improvements were obtained. They definethe target binary mask �TBM� as the one obtained by com-paring, in each T-F unit, the target energy to that of a SSNreference signal matching the long-term spectrum of the tar-get speaker. This comparison still uses the LC parameter as aSNR threshold. The binary mask that results from this pro-cess can then be applied to a mixture of the target and adifferent masker. Figure 1 illustrates an example TBM andIBM computed from a target sentence in cafeteria noise, andshows the differences between the resulting masks. The toprow shows the time domain waveforms of the clean andnoisy target sentences. The middle row shows cochleagramsof the clean and noisy target sentence using a filterbank of 1ERB �equivalent rectangular bandwidth� wide gammatonefilters with center frequencies from 55 Hz to 7.7 kHz. Thebottom row shows the TBM �left� and IBM �right�. The twomasks are noticeably different. The TBM pattern resemblesthe target sentence and is unaffected by the specific masker.
Centerfrequency[Hz]
0 0.5 1 1.5 2
100
250
500
1000
2500
5000
7500
Target Mixture
Time [s]
Centerfrequency[Hz]
Target binary mask
0 0.5 1 1.5 2
100
250
500
1000
2500
5000
7500
Time [s]
Ideal binary mask
0 0.5 1 1.5 2
100
250
500
1000
2500
5000
7500
0 0.5 1 1.5 2
100
250
500
1000
2500
5000
7500
0dB
25dB
50dB
75dB
FIG. 1. �Color online� Illustration of IBM and TBM. Upper row shows waveform signal for a clean target sentence �left� and the sentence corrupted withcafeteria noise �right�. Middle row shows the cochleagram representation of the two signals. Bottom left and right show the TBM and IBM, respectively, withwhite indicating the value of 1.
J. Acoust. Soc. Am., Vol. 126, No. 3, September 2009 Kjems et al.: Pattern role in ideally segregated speech 1417
We(1)
(1) In the published paper, "We" was erroneously corrected to "They". "We define" is the correct formulation."We define" is the correct phrase.
PAPER C 63

On the other hand, the IBM pattern depends on the maskersignal as well.
The TBM has several useful properties. The mask is, bythis definition, identical to the IBM when SSN is the masker,so the TBM can be used as a measure of how general theIBM generated with the SSN masker is. Furthermore, relat-ing to schema-based auditory scene analysis, the TBM couldbe interpreted as a simplified template of a learned pattern,indicating where in time and frequency to expect target en-ergy. We therefore expect that the TBM leads to comparablebenefits in intelligibility compared to the IBM. In somespeech enhancement applications, it may be easier to esti-mate a TBM rather than an IBM, and it is therefore useful toknow the extent to which the TBM results in intelligibilityimprovements.
The remainder of this paper is organized as follows. Alistening experiment is described in Sec. II, and the resultsare reported and discussed in Sec. III. Section IV concludesthe paper.
II. EXPERIMENTAL SETUP
A listening experiment was conducted to measurespeech intelligibility of ITFS processed mixtures. The aimwas to measure the influence of mixture SNR level, RCvalue, masker type, and to compare mask constructionschemes: IBM and TBM.
A. Stimuli
The target phrases were from the Dantale II corpus�Wagener et al., 2003� which is the Danish version of theSwedish Hagerman sentence �Hagerman, 1982� test and theGerman Oldenburg sentence test �Kollmeier and Wes-selkamp, 1997�. The corpus consists of 150 sentences de-signed to have low redundancy. The phrases were all spokenby the same female Danish speaker. The sentences were fivewords long following the same grammatical structure: name-verb-numeral-adjective-noun. An English translated exampleis “Michael had five new plants.” Each word was randomlyselected out of ten possibilities in each position of a sen-tence, taking coarticulation into account �Wagener et al.,2003�. Since long-term spectral characteristics are quite simi-lar among different languages �Byrne et al., 1994�, the mainobservations of the present experiment could hold for Eng-lish and other languages, though there are likely some lan-guage effects.
The target sentences were presented in nine second in-tervals, allowing the subjects time to repeat the words theyrecognize as well as guess. An operator recorded the numberof correctly recognized words for each sentence.
Four masker signals were used: SSN, cafeteria noise, carinterior noise, and noise from a bottling hall. We use the SSNincluded with the Dantale II corpus, which is produced bysuperimposing the speech material in the corpus. The cafete-ria masker was a recording of an uninterrupted conversationbetween a male and a female Danish speaker in a cafeteriabackground �Vestergaard, 1998�. The signal was equalized tomatch the long-term spectrum of the target sentences. Thiswas done to isolate the effects of masker modulation and
long-term average spectrum. The car interior noise was arecording during highway driving and was chosen to repre-sent a quasi-stationary noise with strong low-frequency con-tent. The fourth noise used was a recording of bottles rattlingon a conveyor belt in a bottling hall �Vestergaard, 1998�, andwas chosen to represent a signal with strong high-frequencycontent. All stimuli were diotically presented through head-phones.
For each masker type, three mixture SNR levels wereselected along with eight values of RC. Given that the IBMand the TBM are identical with the SSN masker, there wereseven combinations of masker type and mask type, as shownin Table I.
Mixture SNR levels were set to match measured 20%and 50% SRTs for each masker type. The third SNR levelwas fixed at −60 dB to create IBM-gated noise similar toWang et al. �2008�.
B. Sessions
The experiment was divided into two sessions. In Ses-sion I, the slope and SRT of each subject’s psychometriccurve of the unprocessed mixtures and each of the fourmaskers were measured using the adaptive Dantale II proce-dure, and the mixture SNR levels for 20% and 80% correctword identification were derived �Brand and Kollmeier,2002; Wagener et al., 2003�. In Session II, intelligibility wasmeasured on a grid of three different mixture SNR levels andeight different RC values �including an “unprocessed” con-dition, see later� for each of the seven conditions in Table I.This generated a total of 3 SNR levels, 8 RC values, and 7conditions of Table I, resulting in 3�8�7=168 points,where intelligibility was measured. Each combination wastested on each subject using two sentences. Hence, each sub-ject listened to a total of 2�168=336 sentences, which re-quired reuse of sentences. To prevent memorization, order ofthe sentences was balanced as much as possible within andacross subjects, and appeared random to the subjects.
From Session I measurements, logistic functions
P�SNR� = �1 + exp�4s50�L50 − SNR���−1 �2�
were fitted by means of the maximum likelihood method,assuming a binomial distribution of individual sentencescores �Brand and Kollmeier, 2002� yielding the 50% SRT�L50� and slope �s50� parameters for each subject and eachmasker type. The two initial sentences of each adaptationwere discarded, and to reduce the effects of outliers, the datafrom the three best and three worst performing subjects wereleft out before averaging in order to derive the 20% and 50%SRT values. Pilot experiments revealed an effect of a princi-
TABLE I. Seven combinations of masker type and mask type. Note thatTBM and IBM with SSN masker are identical.
Speechshapednoise
Cafeterianoise
Carinterior
Bottlingnoise
IBM 1 2 3 4TBM 5 6 7
1418 J. Acoust. Soc. Am., Vol. 126, No. 3, September 2009 Kjems et al.: Pattern role in ideally segregated speech
64

pal difference between the continuous masker used in Ses-sion I, and the binary gated masker used with the ITFS sig-nals in Session II. The effect caused a slightly decreasedperformance in the latter case. This effect has previouslybeen described by Wagener �2003, Chap. 5� where a com-parison of continuous versus gated noise indicated a 1.4 dBincrease in SRT �L50� and a decrease in slope �s50� from21% /dB to 18% /dB. Accordingly, we adjusted the mea-sured SRT from Session I by adding 1.4 dB and slope bymultiplying 18 /21, resulting in the values listed in the firsttwo columns of Table II. The third column shows 20% SRTderived from the adjusted parameters. The measured SRTsand slopes for speech-shaped and cafeteria noise all agreewith previous results on the same material �Wagener, 2003;Wang et al., 2009�.
In order to determine the range of RC values to use,offline simulations were carried out to identify the RC valuesthat yielded mask densities of 1.5% and 80% measured aspercent ones in the mask within speech intervals �see Sec.II D for signal processing details�. For each masker typeseven RC values were then identified by equidistant sam-pling �in decibels� between these two points. For the threeTBM conditions, the set of RC values equaled the set forIBM/SSN �condition 1 in Table I� since the binary masks areidentical by definition. An eighth additional unprocessedcondition was added, where the mask was set to 1 in allfrequency bands within the speech intervals, and 0 outsidethese intervals, creating essentially a gated masker.
Speech intervals were derived from the target sentencesalone and were used for all mixture SNR computations byaveraging target and masker energy within speech intervalsonly. A speech interval was defined by low-pass filtering theabsolute target sample values using a first-order IIR low-passfilter with the time constant of 1 ms �for 20 kHz sample ratethe transfer function was H�z�=� / �1− �1−��z−1�, �=0.04877�, thresholding the result at 60 dB below the maxi-mum value, and further designating all non-speech intervalsless than 2 s as speech to include inter-word intervals in allsentences. All detected speech onsets were shifted 100 msbackward to account for forward masking effects �Wanget al., 2009�.
C. Subjects
A total of 15 normal-hearing, native Danish speakingsubjects participated in the experiment. The subjects volun-
teered for the experiment and were not paid for their partici-pation. Their age ranged from 25 to 52 with a mean age of35. The audiograms of all subjects indicated normal hearingwith hearing thresholds below 20 dB HL in the measuredrange of 250 Hz–8 kHz.
D. Signal processing
All target and masker signals were resampled from44.1 to 20 kHz sampling rate. Gain factors for target andmasker were computed in order to achieve a given mixtureSNR and fixed mixture power. This was done by computingthe signal energies of target and masker within the speechintervals previously defined. The target and masker signalswere processed separately by means of a gammatone filter-bank, consisting of 64 channels of 2048-tap FIR filters; eachchannel has the bandwidth of 1 ERB and channel centerfrequencies range from 2 to 33 ERBs �corresponding to55–7743 Hz� linearly distributed on the ERB-rate scale�Patterson et al., 1988; see also Wang and Brown, 2006�. Thefilterbank response was divided into 20 ms frames with10 ms overlap, and the total signal energy was computedwithin each T-F unit.
For IBM processing, a binary mask was formed by com-paring the local SNR within a T-F unit against LC, assigning1 if the local SNR was greater than LC and 0 otherwise. ForTBM processing, the reference masker �i.e. the SSN masker�was processed through the filterbank, with a gain set toachieve a 0 dB mixture SNR. The TBM was formed by com-paring the local SNR within a T-F unit using the referencemasker against the RC threshold, assigning 1 if the localSNR was greater than RC.
The binary mask signal was then upsampled to the full20 kHz sampling rate by means of a sample-hold schemefollowed by low-pass FIR filtering using a 10 ms Hanningfilter. In each band, the target-masker mixture was delayed20 ms in time, accounting for the total delay from the T-Funit energy summation, sample-hold, and low-pass filtering,before the upsampled mask was multiplied with the mixture.Finally, the ITFS processed waveform was synthesized usingtime reversed gammatone filters.
The target and masker stimuli for Session I were pro-cessed through the filterbank analysis and synthesis proce-
TABLE II. SRT at 50% correct L50 and slope s50 parameters of the logistic function, Eq. �2�, estimated fromSession I measurements, using maximum likelihood with correction for gated noise �see text, Sec. II B�. Thenext column shows the derived 20% SRT for average subject performance. The last two columns show theupper and lower RC values for the four masker types. Offline simulations were used to determine the RC valuesfor obtaining IBM sparseness of 1.5% and 80% ones in the mask. The three TBM conditions 5–7 of Table I allused RC values corresponding to IBM/SSN with mixture SNR corresponding to masker type.
Masker type
50% SRT mixtureSNR �L50�
�dB�
Slope at SRT�s50�
�%/dB�
20% SRTmixture SNR
�dB�
RC for 1.5%ones in mask
�dB�
RC for 80%ones in mask
�dB�
Speech shaped noise −7.3 15.1 −9.8 12.7 −30.3Cafeteria −8.8 7.5 −13.8 24.6 −27.4Car interior −20.3 12.7 −23.0 27.5 −25.2Bottling noise −12.2 5.7 −18.4 23.1 −34.9
J. Acoust. Soc. Am., Vol. 126, No. 3, September 2009 Kjems et al.: Pattern role in ideally segregated speech 1419
PAPER C 65

dure �no binary mask was applied�, reducing the signal band-width to 55 Hz–7.74 kHz in order to match processedsignals in Session II.
E. Procedure
1. Session I: SRT and slope measurements
The first session consisted of an adaptive Dantale proce-dure for each of the four masker types. Prior to this thesubjects were given a short training session consisting of 30randomly chosen sentences using speech-shaped and cafete-ria noise maskers. These maskers were chosen to let listenersfamiliarize themselves with the task under stationary andnon-stationary noise conditions.
In the adaptive Dantale procedure, the mixture SNR wasvaried after each sentence according to the number of cor-rectly identified words, and the 20% and 80% SRTs weretracked in an interleaved manner �Brand and Kollmeier,2002�. The 20% and 80% points were chosen since theywere proposed by Brand and Kollmeier �2002� to be optimalfor the simultaneous measurement of the logistic functionparameters L50 and s50 of Eq. �2�. A total of 30 sentenceswere presented for each masker type in the adaptive proce-dure. To account for learning effects, the order of maskertypes was balanced across subjects �Beck and Zacharov,2006�.
2. Session II: ITFS mixtures
In the second session, each subject listened to 336 of-fline computed ITFS sentences. The stimuli alone lasted ap-proximately 51 min so the subjects were allowed two breaksin the middle.
Prior to the main experiment, subjects were exposed to60 sentences of training using all four noise types. First, foreach masker type ten sentences corresponded to the unproc-essed condition with increasingly lower mixture SNRs. Theremaining 20 training sentences corresponded to variousITFS conditions, randomly selected but increasing difficulty.We found from pilot experiments that an extended trainingprocedure was required to reduce learning effects and subjectvariability.
Learning and other temporal effects were accounted forby using a balanced design: for each subject the ordering ofthe seven conditions was changed and for each condition theordering of SNR levels and RC values were balanced asmuch as possible.
Subjects were seated in a sound treated room wheresounds were presented using Sennheiser HD280 Pro head-phones connected to a SoundBlaster SB0300 sound card, us-ing a PC running MATLAB.
3. Level of presentation
All mixtures were normalized to have same broadbandlong-term signal power before ITFS processing, both acrossmixture SNR and across noise types. The SSN condition wasused to calibrate the presentation level to 65 dB�A� soundpressure level, and the volume control settings were thenheld fixed. The calibration was done using a sound levelmeter coupled to an earpiece of the headphones. The result-
ing presentation levels were measured to 62 dB�A� for caf-eteria noise, 60 dB�A� for car interior noise, and 68 dB�A�for bottling hall noise.
III. RESULTS AND DISCUSSION
Figure 2 shows the percentage of correctly identifiedwords as a function of LC for IBM segregated mixtures withthe SSN masker in the three mixture SNR settings, averagedover all subjects. The unprocessed conditions do not corre-spond to a particular LC value, and are inserted as the left-most points of the respective curves �marked as “UN”� andconnected with dotted lines to the curves.
The unprocessed data points resulted in higher perfor-mance than expected; across conditions the average scoresare 25.7% and 59.5% out of 600 answers, which are largerthan the 20% and 50% expected scores. This could be ex-plained by the training that was encountered during Session Iand during the training session introduced between Session Iand Session II, as described in Sec. II E 2.
Each of the three curves shows a plateau or peak of veryhigh intelligibility; for the 50% SRT �SNR of −7.3 dB�, theinterpolated average performance was above 95% in the in-terval −25 dB�LC�−2 dB, a 23 dB wide region. For 20%SRT �SNR of −9.8 dB� the interval was −22 dB�LC�−6 dB and 16 dB wide, while for the −60 dB case the inter-val was −69 dB�LC�−59 dB and 10 dB wide. The resultsfor 20% and 50% SRT have similar profiles as those reportedby Brungart et al. �2006� and Li and Loizou �2008�. In Brun-gart et al., 2006, the range is −12 dB�LC�0 dB using amulti-talker task and similar ITFS processing. The plateausin the present study are wider than those of Brungart et al.�2006�, due to higher scores at lower LC values, while pla-teau upper bounds are similar. Li and Loizou �2008� reportedplateaus from −20 to +5 dB at −5 dB SNR and −20 to 0 dBat −10 dB SNR using a sentence test with a SSN masker anda T-F representation with linear frequency. The observed dif-ferences are probably due to differences in sentence materialand mixture SNR.
-100 -80 -60 -40 -20 00
10
20
30
40
50
60
70
80
90
100
UN
UN
IBM using SSN masker
LC [dB]
%Correct
SNR -7.3dB (50%SRT)SNR -9.8dB (20%SRT)SNR -60dB
FIG. 2. Percentage of correctly identified words for IBM-processed mix-tures with SSN masker as function of LC used for generating the IBM.Three mixture SNR levels are shown. The unprocessed conditions do notcorrespond to a particular LC value, but are inserted to the left of the re-spective curves, marked as “UN” and connected with dotted lines. Chanceperformance level is 10%.
1420 J. Acoust. Soc. Am., Vol. 126, No. 3, September 2009 Kjems et al.: Pattern role in ideally segregated speech
66
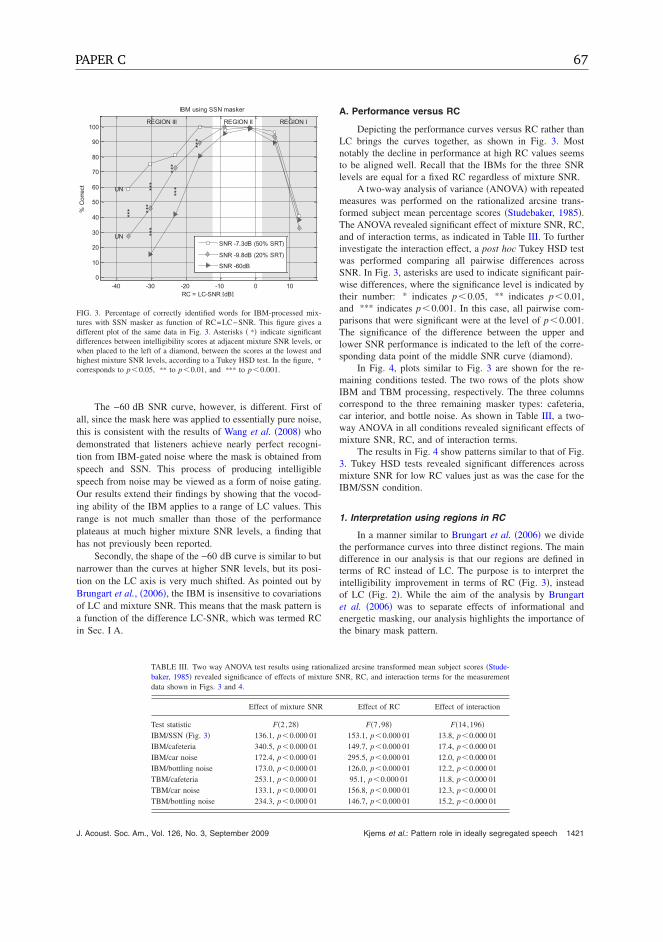
The −60 dB SNR curve, however, is different. First ofall, since the mask here was applied to essentially pure noise,this is consistent with the results of Wang et al. �2008� whodemonstrated that listeners achieve nearly perfect recogni-tion from IBM-gated noise where the mask is obtained fromspeech and SSN. This process of producing intelligiblespeech from noise may be viewed as a form of noise gating.Our results extend their findings by showing that the vocod-ing ability of the IBM applies to a range of LC values. Thisrange is not much smaller than those of the performanceplateaus at much higher mixture SNR levels, a finding thathas not previously been reported.
Secondly, the shape of the −60 dB curve is similar to butnarrower than the curves at higher SNR levels, but its posi-tion on the LC axis is very much shifted. As pointed out byBrungart et al., �2006�, the IBM is insensitive to covariationsof LC and mixture SNR. This means that the mask pattern isa function of the difference LC-SNR, which was termed RCin Sec. I A.
A. Performance versus RC
Depicting the performance curves versus RC rather thanLC brings the curves together, as shown in Fig. 3. Mostnotably the decline in performance at high RC values seemsto be aligned well. Recall that the IBMs for the three SNRlevels are equal for a fixed RC regardless of mixture SNR.
A two-way analysis of variance �ANOVA� with repeatedmeasures was performed on the rationalized arcsine trans-formed subject mean percentage scores �Studebaker, 1985�.The ANOVA revealed significant effect of mixture SNR, RC,and of interaction terms, as indicated in Table III. To furtherinvestigate the interaction effect, a post hoc Tukey HSD testwas performed comparing all pairwise differences acrossSNR. In Fig. 3, asterisks are used to indicate significant pair-wise differences, where the significance level is indicated bytheir number: * indicates p�0.05, ** indicates p�0.01,and *** indicates p�0.001. In this case, all pairwise com-parisons that were significant were at the level of p�0.001.The significance of the difference between the upper andlower SNR performance is indicated to the left of the corre-sponding data point of the middle SNR curve �diamond�.
In Fig. 4, plots similar to Fig. 3 are shown for the re-maining conditions tested. The two rows of the plots showIBM and TBM processing, respectively. The three columnscorrespond to the three remaining masker types: cafeteria,car interior, and bottle noise. As shown in Table III, a two-way ANOVA in all conditions revealed significant effects ofmixture SNR, RC, and of interaction terms.
The results in Fig. 4 show patterns similar to that of Fig.3. Tukey HSD tests revealed significant differences acrossmixture SNR for low RC values just as was the case for theIBM/SSN condition.
1. Interpretation using regions in RC
In a manner similar to Brungart et al. �2006� we dividethe performance curves into three distinct regions. The maindifference in our analysis is that our regions are defined interms of RC instead of LC. The purpose is to interpret theintelligibility improvement in terms of RC �Fig. 3�, insteadof LC �Fig. 2�. While the aim of the analysis by Brungartet al. �2006� was to separate effects of informational andenergetic masking, our analysis highlights the importance ofthe binary mask pattern.
***
***
***
***
***
***
***
UN
UN
IBM using SSN masker
%Correct
RC = LC-SNR [dB]
REGION III REGION II REGION I
-40 -30 -20 -10 0 100
10
20
30
40
50
60
70
80
90
100
SNR -7.3dB (50% SRT)
SNR -9.8dB (20% SRT)
SNR -60dB
FIG. 3. Percentage of correctly identified words for IBM-processed mix-tures with SSN masker as function of RC=LC−SNR. This figure gives adifferent plot of the same data in Fig. 3. Asterisks � *� indicate significantdifferences between intelligibility scores at adjacent mixture SNR levels, orwhen placed to the left of a diamond, between the scores at the lowest andhighest mixture SNR levels, according to a Tukey HSD test. In the figure, *
corresponds to p�0.05, ** to p�0.01, and *** to p�0.001.
TABLE III. Two way ANOVA test results using rationalized arcsine transformed mean subject scores �Stude-baker, 1985� revealed significance of effects of mixture SNR, RC, and interaction terms for the measurementdata shown in Figs. 3 and 4.
Effect of mixture SNR Effect of RC Effect of interaction
Test statistic F�2,28� F�7,98� F�14,196�IBM/SSN �Fig. 3� 136.1, p�0.000 01 153.1, p�0.000 01 13.8, p�0.000 01IBM/cafeteria 340.5, p�0.000 01 149.7, p�0.000 01 17.4, p�0.000 01IBM/car noise 172.4, p�0.000 01 295.5, p�0.000 01 12.0, p�0.000 01IBM/bottling noise 173.0, p�0.000 01 126.0, p�0.000 01 12.2, p�0.000 01TBM/cafeteria 253.1, p�0.000 01 95.1, p�0.000 01 11.8, p�0.000 01TBM/car noise 133.1, p�0.000 01 156.8, p�0.000 01 12.3, p�0.000 01TBM/bottling noise 234.3, p�0.000 01 146.7, p�0.000 01 15.2, p�0.000 01
J. Acoust. Soc. Am., Vol. 126, No. 3, September 2009 Kjems et al.: Pattern role in ideally segregated speech 1421
PAPER C 67

Region I corresponds to large RC values, where intelli-gibility decreases with increasing RC due to increasingsparseness of the ideal mask. In our results from the IBM/SSN condition, performance decreased for RC�−2 dB.
Region II corresponds to an intermediate range of RCvalues, with nearly perfect performance. For the IBM/SSNcondition this occurred as a plateau at RC values between−8.8 and −1.6 dB, where intelligibility was above 95%.
Region III ranges below approximately RC=−10 dB inthe IBM/SSN case. In this region performance decreases asRC decreases and the number of T-F units included in theIBM increases, until the performance of the unprocessedmixture is reached.
A general pattern in our data is that the influence ofmixture SNR on the recognition performance decreases withincreasing RC: In Regions I and II the effect was small orinsignificant, while in Region III there was significant influ-ence.
The fact that the performance in Region I �high RC val-ues� showed only a negligible or small effect of mixture SNRlevel suggests that the target component of the processedmixture plays a relatively small role. Our results seem toindicate that some of the traditional cues for speech percep-tion, such as F0, periodicity, and other temporal fine structurecues, are less important in Region II than in Region III and
of even smaller importance in Region I. Otherwise onewould have expected a difference in performance acrossmixture SNRs. So the application of the IBM seems, on theone hand, to improve the intelligibility relative to the unproc-essed condition and, on the other hand, to reduce or elimi-nate the listener’s ability to make use of speech cues otherthan what is carried in the binary mask. This result is ofparticular interest for the design of hearing aids, since reportssuggest that the ability of hearing impaired subjects to makeuse of temporal fine structure cues is limited compared tonormal listeners �Lorenzi et al. 2006; Hopkins et al. 2008�,making the trade-off more favorable for the hearing im-paired.
In Region III, there was an overall significant effect ofmixture SNR �indicated with asterisks in Figs. 3 and 4�. Wefurther note that across all seven mask scheme/masker con-ditions, the increase in performance at the mixture SNR cor-responding to 20% SRT from Region III to Region II isaccompanied by an increasing vocoding ability at −60 dBmixture SNR.
2. Influence of masker type
The results in Fig. 4 show that the RC values beneficialto intelligibility varied across the seven mask scheme/masker
0
10
20
30
40
50
60
70
80
90
100
UN
UN
***
***
***
***
***
***
***
***
Cafeteria noise
%Correct
SNR -8.8dB 50%SRT
SNR -13.8dB 20%SRT
SNR -60dB
UN
UN
*** **
*
***
***
***
***
**
Car noise
SNR -20.3dB 50%SRT
SNR -23.0dB 20%SRT
SNR -60dB
UN
UN
*** **
*
***
***
***
*
*
Bottle noise
IBMProcessing
SNR -12.2dB 50%SRT
SNR -18.4dB 20%SRT
SNR -60dB
-40 -20 0 200
10
20
30
40
50
60
70
80
90
100
UN
UN
***
***
***
*
***
***
*
***
***
***
***
*%Correct
SNR -8.8dB 50%SRT
SNR -13.8dB 20%SRT
SNR -60dB
-40 -20 0 20
UN
UN
***
***
***
***
***
***
***
**
RC = LC-SNR [dB]
SNR -20.3dB 50%SRT
SNR -23.0dB 20%SRT
SNR -60dB
-40 -20 0 20
UN
UN
***
***
***
***
**
***
***
***
TBMProcessing
SNR -12.2dB 50%SRT
SNR -18.4dB 20%SRT
SNR -60dB
FIG. 4. Percentage of correctly identified words versus RC for IBM-processed mixtures �upper row� and TBM processed mixtures �lower row�. Each columncorresponds to a masker type. The three curves in each plot correspond to the mixture SNR levels �squares: 50% SRT, diamonds: 20% SRT, and triangles:−60 dB mixture SNR�. Asterisks � *� indicate significant difference between adjacent mixture SNR levels, or when placed to the left of a diamond, betweenthe lowest and highest mixture SNR levels � * corresponds to p�0.05, ** to p�0.01, and *** to p�0.001�, according to Tukey HSD tests.
1422 J. Acoust. Soc. Am., Vol. 126, No. 3, September 2009 Kjems et al.: Pattern role in ideally segregated speech
68

conditions. While the plateau became narrower at lower mix-ture SNR levels, its position shifts across the seven condi-tions tested. As already described, mixture SNR, which fac-tors in the definition of RC, is not a good indicator ofintelligibility across masker types. For instance, in the IBM/bottle noise curve at the mixture SNR corresponding to 50%SRT, the performance plateau—the region of RC valueswhere intelligibility is within 95% of the maximum score—ranged from −22 to −3 dB �measured on interpolated meandata�, while in the IBM/car noise curve the correspondingplateau occurs in the RC range of −4 to 19 dB.
Table IV shows the average plateau width for the threemixture SNR levels for each of the seven mask scheme/masker conditions. The IBM/SSN condition produced thebroadest plateau, 23.6 dB on average, and the TBM/cafeteriathe narrowest plateau of 16.9 dB. Comparing mask schemeswithin masker signals, the IBM showed slightly wider aver-age plateaus for all masker types. The table also gives thepeak intelligibility scores of various noise gating curves.
B. Discussion of binary noise gating results
The noise gating performance curves �SNR −60 dB�form a performance lower bound for each masker type: in nocase was the noise gating performance significantly greaterthan that for any other mixture SNR level. The measuredpeak value of the noise gating performance curves variedacross masker type and mask computation scheme as indi-cated in Table IV. The effect of masker type was greater thanthe effect of mask computation scheme �from 85.3% forIBM/cafeteria to 99.3% for IBM/car noise�.
The cafeteria noise was a relatively poor signal for voc-oding, yielding maximum scores of 85% correct using IBMand 88% using TBMs, a result which may be explained bythe sparse energy distribution in retained T-F units: The pres-ence of 1 in the binary mask may coincide with a dip in thenoise signal. In our data, the performance in the TBM/cafeteria condition with the −60 dB SNR was significantlylower at RC=15 dB than those with higher SNR levels. Themodulation dips of the cafeteria masker made the distribu-tion of T-F energy in the processed signal relatively sparse, alikely reason for reduced intelligibility performance.
Figure 5 shows the density of the binary mask measuredas percentage ones in the mask averaged over all speechintervals �see Sec. II B� as function of channel center fre-quency for different masker types. The bold lines correspondto the RC value with the highest noise gating intelligibility�at mixture SNR of −60 dB�. The figure shows that when thetarget and masker signal spectra are matched �speech-shaped
and cafeteria noise� the result is a more uniform mask den-sity compared to when the signals are not matched �bottlenoise and car noise�.
It should be noted that, for stationary maskers, the TBMis similar to the IBM with a LC parameter made frequencydependent in such a way that the resulting distribution ofmask sparseness resembles that of the TBM �i.e. IBM withSSN masker�. Since the TBM in the bottle noise case bringssome intelligibility benefits over the IBM, it is possible thatspeech separation algorithms that estimate the IBM wouldalso benefit from making the LC parameter frequency depen-dent, to ensure that enough ones are present in frequencybands relevant for speech.
C. Results from TBM
In Fig. 6, the results of applying the TBM to mixtures ofthe four masker types are compared. From left to right themixture SNR level corresponds to 50% SRT, 20% SRT, and−60 dB. The curves corresponding to the four differentmaskers appear to align well. This is further reflected inTable V, showing the results from a two-way ANOVA withrepeated measures performed on the rationalized arcsinemean subject scores, for each of the three mixture SNR lev-els. Compared to the previous analysis, the effects are not asstrong; in fact, the noise type influence was not above thestandard 5% significance level for the 20% SRT data and theinteraction term for the 50% SRT data was also not signifi-cant. Tukey HSD tests revealed significance in the pairwisedifferences across masker type only for cafeteria noise in−60 dB SNR against all three other noise types, and only forRC values of −23.1, −15.9, and −8.7 dB as indicated withasterisks in Fig. 6.
D. Performance versus mask density
Given the importance of mask density for resulting in-telligibility, the performance scores versus resulting overallmask density are plotted in Fig. 7. The mask density wasmeasured as resulting percentage of ones in all frequencybands within speech intervals. The unprocessed condition isindicated as having 100% ones in the mask. The IBM resultsare connected with solid lines, and the TBM results are con-nected with dashed lines. Note that a nonlinear abscissa isused to better illustrate the performance differences at lowpercentages.
All curves show maximum performance between 15%and 60% ones in the masks. The curves all show a sharpdecline toward zero at low percentages, a plateau in themiddle which is wider for higher mixture SNRs and agradual drop to the level of unprocessed mixtures, from 40%
TABLE IV. Measured peak intelligibility score �in percentage� for noise gating data �at a mixture SNR of−60 dB� together with average width �in RC� of performance plateau where the interpolated performance waswithin 95% of the peak value, for the four masker types and two mask computation schemes.
Speech shaped noise Cafeteria Car interior Bottling noise
IBM 98.7% 23.6 dB 85.3% 20.7 dB 99.3% 23.0 dB 90.0% 19.0 dBTBM 88.0% 16.9 dB 98.7% 21.5 dB 95.3% 18.4 dB
J. Acoust. Soc. Am., Vol. 126, No. 3, September 2009 Kjems et al.: Pattern role in ideally segregated speech 1423
PAPER C 69

to 100% ones in mask. The TBM and IBM curves are gen-erally similar, with slightly larger scores for the target binarymask except for the cafeteria masker at high percentage ofones. Below 5%–10% ones, the TBM scores were higherthan for the IBM for all masker types. For the exceptionalcase of the cafeteria noise, the IBM strategy based on mix-ture SNR was apparently better than the TBM scheme ac-
cording to the target energy. Overall, it is rather remarkablehow well the TBM and IBM results are aligned, consideringtheir differences with respect to RC in Fig. 4.
IV. CONCLUSION
By measuring intelligibility of ideal binary-maskednoisy speech, we have shown that intelligibility performance
102
103
104
0
20
40
60
80
100
-30dBRC
-23dB
-16dB
-9dB
-2dB+ 6dB+13dB
IBM/SSN and TBM
Maskdensityinpercent
Frequency - Hz10
210
310
40
20
40
60
80
100
-27dBRC
-19dB
-10dB
-1dB
+ 7dB+16dB+25dB
IBM/Cafe
Frequency - Hz
102
103
104
0
20
40
60
80
100
-35dBRC
-25dB
-16dB
-6dB
+ 4dB+13dB+23dB
IBM/Bottle noise
Maskdensityinpercent
Frequency - Hz10
210
310
40
20
40
60
80
100-25dBRC-16dB-8dB
+ 1dB
+10dB
+19dB
+28dB
IBM/Car
Frequency - Hz
FIG. 5. Mask density �in percentage of mask value 1� as function of channel center frequency averaged over entire sentence material. The corresponding RCvalue used for computing the mask is indicated to the right of each curve. The bold line corresponds to the RC value with the highest intelligibility forIBM-gated noise �at mixture SNR of −60 dB�. The mask densities of the TBM masks equals that of the IBM/SSN by definition.
-40 -30 -20 -10 0 100
10
20
30
40
50
60
70
80
90
100
UN
TBM performance for SNR 50%SRT
%Correct
-40 -30 -20 -10 0 10
UN
TBM performance for 20%SRT
RC [dB]-40 -30 -20 -10 0 10
***
***
***
TBM performance for -60dB mixture SNR
SSNCafeCarBottle
FIG. 6. Percentage of correctly identified words versus RC for TBM processed mixtures comparing the effect of noise types. Note that all curves use the samemask for a given RC. The three plots correspond to the three mixture SNR levels. The individual curves correspond to masker types. Asterisks � *� indicatesignificant difference between adjacent noise types � * corresponds to p�0.05, ** to p�0.01, and *** to p�0.001�, according to a Tukey HSD test.
1424 J. Acoust. Soc. Am., Vol. 126, No. 3, September 2009 Kjems et al.: Pattern role in ideally segregated speech
70
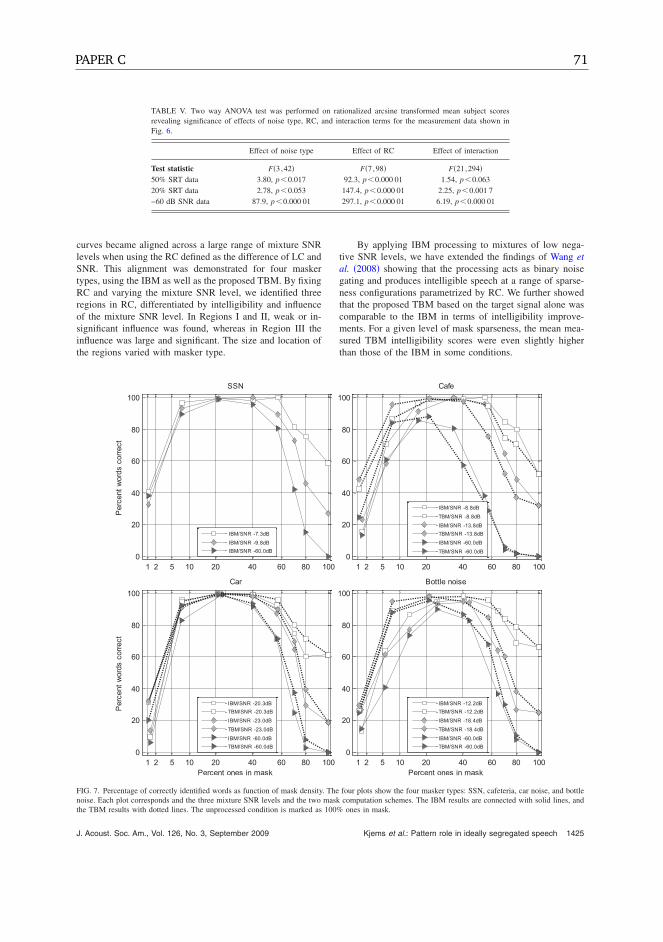
curves became aligned across a large range of mixture SNRlevels when using the RC defined as the difference of LC andSNR. This alignment was demonstrated for four maskertypes, using the IBM as well as the proposed TBM. By fixingRC and varying the mixture SNR level, we identified threeregions in RC, differentiated by intelligibility and influenceof the mixture SNR level. In Regions I and II, weak or in-significant influence was found, whereas in Region III theinfluence was large and significant. The size and location ofthe regions varied with masker type.
By applying IBM processing to mixtures of low nega-tive SNR levels, we have extended the findings of Wang etal. �2008� showing that the processing acts as binary noisegating and produces intelligible speech at a range of sparse-ness configurations parametrized by RC. We further showedthat the proposed TBM based on the target signal alone wascomparable to the IBM in terms of intelligibility improve-ments. For a given level of mask sparseness, the mean mea-sured TBM intelligibility scores were even slightly higherthan those of the IBM in some conditions.
TABLE V. Two way ANOVA test was performed on rationalized arcsine transformed mean subject scoresrevealing significance of effects of noise type, RC, and interaction terms for the measurement data shown inFig. 6.
Effect of noise type Effect of RC Effect of interaction
Test statistic F�3,42� F�7,98� F�21,294�50% SRT data 3.80, p�0.017 92.3, p�0.000 01 1.54, p�0.06320% SRT data 2.78, p�0.053 147.4, p�0.000 01 2.25, p�0.001 7−60 dB SNR data 87.9, p�0.000 01 297.1, p�0.000 01 6.19, p�0.000 01
1 2 5 10 20 40 60 80 1000
20
40
60
80
100SSN
Percentwordscorrect
IBM/SNR -7.3dB
IBM/SNR -9.8dBIBM/SNR -60.0dB
1 2 5 10 20 40 60 80 1000
20
40
60
80
100Cafe
IBM/SNR -8.8dB
TBM/SNR -8.8dB
IBM/SNR -13.8dBTBM/SNR -13.8dB
IBM/SNR -60.0dB
TBM/SNR -60.0dB
1 2 5 10 20 40 60 80 1000
20
40
60
80
100Car
Percent ones in mask
Percentwordscorrect
IBM/SNR -20.3dBTBM/SNR -20.3dB
IBM/SNR -23.0dB
TBM/SNR -23.0dB
IBM/SNR -60.0dBTBM/SNR -60.0dB
1 2 5 10 20 40 60 80 1000
20
40
60
80
100Bottle noise
Percent ones in mask
IBM/SNR -12.2dBTBM/SNR -12.2dB
IBM/SNR -18.4dB
TBM/SNR -18.4dB
IBM/SNR -60.0dBTBM/SNR -60.0dB
FIG. 7. Percentage of correctly identified words as function of mask density. The four plots show the four masker types: SSN, cafeteria, car noise, and bottlenoise. Each plot corresponds and the three mixture SNR levels and the two mask computation schemes. The IBM results are connected with solid lines, andthe TBM results with dotted lines. The unprocessed condition is marked as 100% ones in mask.
J. Acoust. Soc. Am., Vol. 126, No. 3, September 2009 Kjems et al.: Pattern role in ideally segregated speech 1425
PAPER C 71

ACKNOWLEDGMENTS
The authors would like to thank Tayyib Arshad for as-sistance in performing the experiments, volunteering subjectsfor participating, and colleagues for discussions and proof-reading. The research of D.W. was supported in part by anAFOSR grant �FA9550-08-1-0155� and a NSF grant �IIS-0534707�.
ANSI S3.5-1997 �1997�. “American National Standard: Methods for thecalculation of the speech intelligibility index” �American National Stan-dards Institute, New York�.
Anzalone, M. C., Calandruccio, L., Doherty, K. A., and Carney, L. H.�2006�. “Determination of the potential benefit of time-frequency gainmanipulation,” Ear Hear. 27, 480–492.
Beck, S., and Zacharov, N. �2006�. Perceptual Audio Evaluation: Theory,Method and Application �Wiley, Chichester, UK�.
Brand, T., and Kollmeier, B. �2002�. “Efficient adaptive procedures forthreshold and concurrent slope estimates for psychophysics and speechintelligibility tests,” J. Acoust. Soc. Am. 111, 2801–2810.
Bregman, A. S. �1990�. Auditory Scene Analysis �MIT, Cambridge MA�.Brungart, D., Chang, P. S., Simpson, B. D., and Wang, D. L. �2006�. “Iso-
lating the energetic component of speech-on-speech masking with idealtime-frequency segregation,” J. Acoust. Soc. Am. 120, 4007–4018.
Byrne, D., Dillon, H., and Tran, K. �1994�. “An international comparison oflong-term average speech spectra,” J. Acoust. Soc. Am. 96, 2108–2120.
Cooke, M. �2006�. “A glimpsing model of speech perception in noise,” J.Acoust. Soc. Am. 119, 1562–1573.
Dudley, H. �1939�. “Remaking speech,” J. Acoust. Soc. Am. 11, 169–177.Goldsworthy, R. L., and Greenberg, J. E. �2004�. “Analysis of speech-based
speech transmission index methods with implications for nonlinear opera-tions,” J. Acoust. Soc. Am. 116, 3679–3689.
Hagerman, B. �1982�. “Sentences for testing speech intelligibility in noise,”Scand. Audiol. 11, 79–87.
Hopkins, K., Moore, B. C. J., and Stone, M. A. �2008�. “Effects of moderatecochlear hearing loss on the ability to benefit from temporal fine structureinformation in speech,” J. Acoust. Soc. Am. 123, 1140–1153.
Houtgast, T., and Steeneken, H. J. M. �1971�. “Evaluation of speech trans-mission channels by using artificial signals,” Acustica 25, 355–367.
Kollmeier, B., and Wesselkamp, M. �1997�. “Development and evaluation
of a German sentence test for objective and subjective speech intelligibil-ity assessment,” J. Acoust. Soc. Am. 102, 2412–2421.
Li, N., and Loizou, P. C. �2008�. “Factors influencing intelligibility of idealbinary-masked speech: Implications for noise reduction,” J. Acoust. Soc.Am. 123, 1673–1682.
Li, Y., and Wang, D. L. �2009�. “On the optimality of ideal binary time-frequency masks,” Speech Commun. 51, 230–239.
Lorenzi, C., Gilbert, G., Carn, H., Garnier, S., and Moore, B. �2006�.“Speech perception problems of the hearing impaired reflect inability touse temporal fine structure,” Proc. Natl. Acad. Sci. U.S.A. 103, 18866–18869.
Patterson, R. D., Nimmo-Smith, I., Holdsworth, J., and Rice, P. �1988�. “Anefficient auditory filterbank based on the gammatone function,” ReportNo. 2341, MRC Applied Psychology Unit, Cambridge.
Shannon, R. V., Zeng, F.-G., Kamath, V., Wygonski, J., and Ekelid, M.�1995�. “Speech recognition with primarily temporal cues,” Science 270,303–304.
Srinivasan, S., and Wang, D. L. �2008�. “A model for multitalker speechperception,” J. Acoust. Soc. Am. 124, 3213–3224.
Studebaker, G. A. �1985�. “A ‘rationalized’ arcsine transform,” J. SpeechHear. Res. 28, 455–462.
Vestergaard, M. �1998�. “The Eriksholm CD 01: Speech signals in variousacoustical environments,” Report No. 050-08-01, Oticon Research CentreEriksholm, Snekkersten.
Wagener, K. �2003�. “Factors Influencing Sentence Intelligibility in Noise,”Ph.D. thesis, Oldenburg University, Oldenburg, Germany.
Wagener, K., Josvassen, J. L., and Ardenkjær, R. �2003�. “Design, optimi-zation and evaluation of a Danish sentence test in noise,” Int. J. Audiol.42, 10–17.
Wang, D. L. �2005�. “On ideal binary mask as the computational goal ofauditory scene analysis,” in Speech Separation by Humans and Machines,edited by P. Divenyi �Kluwer Academic, Norwell, MA�, pp. 181–197.
Wang, D. L., and Brown, G. J. �2006�. Computational Auditory SceneAnalysis: Principles, Algorithms, and Applications �Wiley, Hoboken NJ�.
Wang, D. L., Kjems, U., Pedersen, M. S., Boldt, J. B., and Lunner, T.�2008�. “Speech perception of noise with binary gains,” J. Acoust. Soc.Am. 124, 2303–2307.
Wang, D. L., Kjems, U., Pedersen, M. S., Boldt, J. B., and Lunner, T.�2009�. “Speech intelligibility in background noise with ideal binary time-frequency masking,” J. Acoust. Soc. Am. 125, 2336–2347.
1426 J. Acoust. Soc. Am., Vol. 126, No. 3, September 2009 Kjems et al.: Pattern role in ideally segregated speech
72

Paper D
Estimation of the Ideal Binary Mask
using Directional Systems
Jesper B. Boldt, Ulrik Kjems, Michael S. Pedersen,Thomas Lunner, and DeLiang Wang
Proceedings of the 11th International Workshop onAcoustic Echo and Noise Control 2008.


ESTIMATION OF THE IDEAL BINARY MASK USING DIRECTIONAL SYSTEMS
Jesper Bunsow Boldt1,2, Ulrik Kjems2, Michael Syskind Pedersen2, Thomas Lunner3, DeLiang Wang4
1Department of Electronic Systems, Aalborg University, DK-9220 Aalborg Øst, Denmark2Oticon A/S, Kongebakken 9, DK-2765 Smørum, Denmark
3Oticon Research Centre Eriksholm, Kongevejen 243, DK-3070 Snekkersten, Denmark4Department of Computer Science and Engineering & Center for Cognitive Science,
The Ohio State University, Columbus, OH 43210-1277, USAemail: {jeb, uk, msp, tlu}@oticon.dk, [email protected]
ABSTRACT
The ideal binary mask is often seen as a goal for time-frequencymasking algorithms trying to increase speech intelligibility, but therequired availability of the unmixed signals makes it difficult to cal-culate the ideal binary mask in any real-life applications. In thispaper we derive the theory and the requirements to enable calcula-tions of the ideal binary mask using a directional system without theavailability of the unmixed signals. The proposed method has a lowcomplexity and is verified using computer simulation in both idealand non-ideal setups showing promising results.
Index Terms— Time-Frequency Masking, Directional systems,Ideal Binary Mask, Speech Intelligibility, Sound separation
1. INTRODUCTION
Time-frequency masking is a widely used technique for speech andsignal processing used in automatic speech recognition [1], com-putational auditory scene analysis [2], noise reduction [3, 4], andsource separation [5, 6, 7, 8]. The technique is based on time-frequency (T-F) representation of signals and makes it possible toutilize the temporal and spectral properties of speech and the as-sumption of sparseness of speech. An important quality of T-Fmasking is the availability of a reference mask, which defines themaximum obtainable speech intelligibility for a given mixture. Thisideal binary mask (IBM) [9] has recently been demonstrated tohave large potential for improving speech intelligibility in difficultlistening conditions [10, 4, 3]. To calculate the IBM, the unmixedsignals must be available, which is a a requirement rarely met inany real-life application. However, the significant increase in speechintelligibility by the IBM makes it a valuable goal for T-F algorithmstrying to increase speech intelligibility. The T-F representation isobtained using e.g. the short-time Fourier transform or a Gamma-tone filterbank [11], and the IBM is calculated by comparing thepower of the target signal to the power of the masker (interfering)signal for each unit in the T-F representations:
IBM(τ, k) =
{1, if
T(τ, k)M(τ, k)
> LC
0, otherwise, (1)
where T(τ, k) is the power of the target signal, M(τ, k) is the powerof the masker signal, LC is a local SNR criterion, τ the time index,and k the frequency index. The LC value is the threshold for classi-fying the T-F unit as target or masker and determines the amount oftarget and masker signal in the processed signal, if the binary mask
is applied to the mixture. In computational auditory scene analysis(CASA), an LC value of 0 dB is commonly used, but recent studieshave shown that a certain range of LC values different from zero pro-vides the same major improvement in speech intelligibility [10, 3].
In this paper we show that it is indeed possible to calculate theIBM without the availability of the unmixed signals. This is madepossible with the proposed method and the required theory and con-straints are derived. The proposed method has a very low complexityand is based on a first-order differential array. To verify the methodand document the theory, computer simulations are performed: First,in the ideal situation where all constraints are met, and subsequentlyin situations where one or more constraints are not met. These simu-lations verify the precision of the method in the ideal situations, andthe robustness of the method in non-ideal situations.
2. IBM ESTIMATION
The proposed method is based on two first-order differential arrays(cardioids) pointing in opposite directions. One target source andone masker source are present and separated in space as shown inFigure 1. We assume that the directional patterns and the azimuthsof the two sources are known. If the spacing between the two micro-phones in the first-order differential array is much smaller than theacoustic wavelength, the output can be approximated by [12]:
CT (f) ≈ G(f) (a0T (f) + a1M(f)) (2)
CM (f) ≈ G(f) (b0T (f) + b1M(f)) , (3)
where f is the frequency, G(f) is a high-pass system, T (f) is thetarget signal, M(f) is the masker signal, and a0, a1, b0, b1 are di-rectional gains for the target and masker signal as shown in Figure1. To obtain the T-F representations of CT (f) and CM (f) the twosignals are further processed as shown in Figure 2: Filtering througha K-point filterbank, squaring the absolute value, low-pass filtering,and downsampling by a factor P . Assuming that T (f) and M(f)are uncorrelated, the four steps result in the two directional powersignals:
DT (τ, k) = |G(k)|2(a20T(τ, k) + a2
1M(τ, k))
(4)
DM (τ, k) = |G(k)|2(b20T(τ, k) + b21M(τ, k)
), (5)
where T(τ, k) and M(τ, k) are the powers of the target and maskersignals, respectively. To estimate the IBM using the two directional
PAPER D 75

0o
30 o
60 o
90o
120o
150
o
18
0o
210 o
240 o
270o
300o
330
o
CT
T
a0
M
a1
0o
30 o
60 o
90o
120o
150
o
18
0o
210 o
240 o
270o
300o
330
o
CM
T
b0
M
b1
Fig. 1. The directional patterns of the two first-order differential ar-
rays. CT points towards the target signal T , and CM points towards
the masker signal M . The directional gains a0, a1, b0, and b1 are
functions of the azimuths of the two sources T and M .
power signals (4, 5), we change (1) to
IBM(τ, k) =
{1, if
DT (τ, k)DM (τ, k)
> LC′
0, otherwise, (6)
where LC′ is the applied local SNR criterion derived in the next
section, and IBM is the estimate of the IBM.
2.1. The relation between LC and LC′
To estimate the IBM with the directional system using (6), the LC′
value must be derived from the LC value used in the definition of theIBM (1). Leaving out the time and frequency indices in the direc-tional signals from (4, 5) we get, using (6):
a20T+ a2
1M
b20T+ b21M> LC
′ ⇔ T
M>
b21LC′ − a21
a20 − b20LC′ . (7)
To allow this rearrangement, we introduce the constraints
a20 − b20LC
′ > 0 and b21LC′ − a2
1 > 0, (8)
which guarantee that T/M > 0 and prevent the target and maskerfrom being interchanged. A prerequisite for estimating the IBM isthat CT captures more target signal than masker signal, and CM
captures more masker signal than target signal. Otherwise, the bi-nary mask will be inverted. Using the definition of the IBM from (1)in combination with (7) we obtain
LC =b21LC′ − a2
1
a20 − b20LC′ ⇔ (9)
LC′ =
a20LC + a2
1
b20LC + b21. (10)
Since we can express LC′ in terms of LC, we can actually estimatethe IBM without having the unmixed sounds available, if the direc-tional gains are known.
2.2. The asymptotes of LC′
If the directional gains are known, the LC′ value can be calculatedfrom the wanted LC value using (10). If the directional gains areunknown, a fixed LC′ must be used in (6), and the LC value will
CT(f)
IBM
2
>
PW(z)
DT(Ù,k)
Hk(z)
CM(f)DM(Ù,k)
M(f)
Acoustic Delays
Cardioids
T(f)
PW(z)Hk(z)2
Fig. 2. Blockdiagram for estimation of the ideal binary mask. The
acoustic delays model the delay from sources to the microphones in
the first-order differential array. Hk(z) is the k’th analysis filter in
the filterbank, W(z) is a low-pass filter, and ↓P is a decimation. The
block labeled > is the implementation of Equation (6).
change depending on the location of the sources (9). Combining thetwo constraints from (8) we get that
a21
b21< LC
′ <a20
b20, (11)
which are the two asymptotes of LC′ as shown in Figure 3. Theasymptotes are determined by the amount of target and masker sig-nal captured by CT compared to CM . If no target signal is found inCM , the high asymptote will be at +∞ dB, and if no masker signalis found in CT , the low asymptote will be at −∞ dB. In the intervalbounded by the two asymptotes we find a region where the relationbetween LC and LC′ becomes approximately linear. In this region,changes of LC′ produce an equal change of LC. However, changesof LC′ near the asymptotes produce very large changes of LC. Werefer to this relation as the sensitivity of the method. If the sensitivityis high, errors on DT , DM , or the directional gains, can have a sig-nificant impact on the LC value. The minimum sensitivity is foundin the approximately linear regions which should be as large as pos-sible. The asymptotes makes the LC′ be defined for all LC values,whereas the opposite is not true. If the LC′ value used in (6) is belowthe low asymptote, the mask becomes an all-one mask. If the LC′ isabove the high asymptote the mask becomes an all-zero mask.
3. SIMULATIONS
To verify that it is possible to estimate the IBM with the proposedmethod, a computer simulation was performed showing the precisionof the estimate. Furthermore, simulations were done in non-idealsituations to illustrate the robustness of the method. The precision
were measured by the number of correct T-F units in the IBM withrespect to the IBM. Two instances of the system shown in Figure 2
were used: The first instance was used to calculate the IBM and wasconfigured as follows: The acoustic delays were calculated from theazimuth of the two sources using a free-field model [13] with no re-verberation. Two microphones were placed with a distance of 1 cmon the line through 0◦ and 180◦, and the distance from the micro-phones to the sources was 1 m. Two cardioid signals were derivedfrom the microphone signals, and each of the cardioid signals wasprocessed by a 128 band Gammatone filterbank [11] with center fre-quencies linearly distributed on the ERB frequency scale from 100Hz to 8000 Hz, each filter having a bandwidth of 1 ERB. The LPfilter W (z) was a 20 ms rectangular window followed by a 100 folddecimation corresponding to a 10 ms shift at the used sampling fre-quency of 20 kHz. The second instance of the system from Figure
76

0
0
10 · log10(a20b20
)
10 · log10(a21b21
)
all−zero mask
all−one mask
LC [dB]
LC
′ [d
B]
Fig. 3. LC′ as a function of LC. The asymptotes are defined by the
directional gains. Using LC′ values outside the region bound by the
two asymptotes produce all-one or all-zero masks.
2 was used to calculate the IBM. This instance was equal to the pre-vious without the cardioids. Instead, the target and masker soundwere recorded separately by a single microphone located betweenthe microphones used in the previous instance.
In the first simulation, the free-field model was used to calculatethe acoustic delays, while the masker source was moved from 180−0◦, and the target source was fixed at 30◦. The two sources weremale and female speech with 0 dB SNR and a duration of 11 seconds.A fixed LC′ value of 0 dB was compared to an adaptive LC′ valuecalculated using (10) and an LC value of 0 dB.
3.1. Simulation 1
The results from the first simulation are shown in Figure 4. Thesolid line is the percentage of correct T-F units using an adaptive LC′
value, and the dashed line is LC′ fixed at 0 dB. In both situations wesee a high percentage of correct T-F units when the masker azimuthis in the range 180◦ − 150◦, and the small number of wrong T-Funits (< 2%) can be explained by the cardioid filters only used to
calculate the IBM.
As the masker source is moved towards the target source, thepercentage of correct T-F units decreases faster for the fixed LC′
than the adaptive LC′. At 90◦ the fixed LC′ has decreased to almost50% whereas the adaptive LC′ remains above 95%. This decrease is
explained by the IBM becoming an all-one mask which in this casehas around 50% correct T-F units. When the masker azimuth is 90◦
an equal amount of masker signal is captured by CT and CM , andthe low asymptote in Figure 3 will be at 0 dB. In this situation the 0dB fixed LC′ value is equal to an LC value of −∞ dB. Moving themasker source further, we see a rapid decrease in correct T-F units forthe adaptive LC′, when the masker source passes the target source at30◦. The decrease from above 90% to below 10% correct T-F unitsis explained by the interchange of target and masker because (11)is not satisfied anymore. If CT captures more masker than target
sound or CM captures more target than masker sound, the IBM isthe inverse of the IBM with a very low number of correct T-F units.
The small decrease in correct T-F units for the adaptive LC′
value between 180◦ to 45◦ can be explained by increased sensi-tivity of the system. As the masker and target get closer, the twoasymptotes from Figure 3 get closer which leads to amplification ofthe errors introduced by the cardioid filters used for calculating the
IBM.
180 150 120 90 60 30 00
10
20
30
40
50
60
70
80
90
100
Pe
rce
nta
ge
co
rrect
TF
un
its
Masker source azimuth [degrees]
LC’ adaptive
LC’ fixed
Fig. 4. The percentage of correct T-F units in the IBM with respect
to the IBM. The target was fixed at 30◦ while the masker was moved
from 180◦ to 0◦. The adaptive LC′ value was calculated from the
directional gains using an LC value of 0 dB, whereas the fixed LC′
was kept at 0 dB.
3.2. Simulation 2
To further examine the precision and robustness of the proposedmethod in a non-ideal setup a second simulation was carried out. Thesetup was identical to simulation 1, except the number of sourcesand the acoustical delays. One target and three masker sources werepresent: A male target speaker at 0◦, a female masker speaker mov-ing from 180◦ to 0◦, a female masker speaker at 135◦, and a malemasker speaker at 180◦. The speakers were located 2 m from themicrophones and the sounds have a duration of 15 seconds. Theacoustical delays were the free-field model from simulation 1 andimpulse responses from a behind-the-ear (BTE) hearing aid shell ona Head and Torso Simulator (HATS) in three different acoustical en-vironments: Anechoic, low reverberation time (RT60=400 ms), andhigh reverberation time (RT60=1000 ms). The reverberation time isdefined as the time before the room impulse response is decreasedby 60 dB.
As in the previous simulation, it is evident from Figure 5 that thepercentage of correct T-F units decreases when the moving maskerpasses 90◦. In Figure 4 the fixed LC drops to 50% whereas in Figure5 the free-field simulation drops to around 72% correct unit. Thisdifference is explained by the two masker sources at 135◦ and 180◦
in simulation 2, which prevent the mask from becoming an all-onemask. Compared to simulation 1, where the all-one mask has 50%correct T-F units, the all-one mask in simulation 2 has 34% correctT-F units. Using impulse responses from a hearing aid on a HATS inan anechoic room, the percentage of correct T-F units between 95◦
and 40◦ is increased compared to the free-field simulation. This in-crease is explained by the cardioids being non-ideal and attenuatingthe moving masker more at these angles. As soon as reverberation
is present, the precision of the IBM decreases. Using impulse re-sponses from the low reverberant room we get around 83% correctunits when the moving masker is located at 180◦. If the wrong T-Funits at this point are divided into wrong ones and wrong zeros withrespect to the IBM we find 14% wrong zeros and 19% wrong ones.
In other words, the IBM will remove 14% of the target signal andwill retain 19% of the masker signals compared to the IBM if appliedto the mixture signal.
4. DISCUSSION
In this paper an important connection between the ideal binary maskand a realizable computation of the binary mask has been estab-
PAPER D 77

180 150 120 90 60 30 00
10
20
30
40
50
60
70
80
90
100
Pe
rce
nta
ge
co
rrect
TF
un
its
Moving masker azimuth [degrees]
Free−field
BTE on HATS, anechoic
BTE on HATS, low reverberation
BTE on HATS, high reverberation
Fig. 5. The percentage of correct T-F units in the IBM with respect
to the IBM. Free-field and impulse responses from a hearing aid shell
(BTE) on a HATS in three different acoustical environments were
used, and four sources were present: Target at 0◦, a moving masker
from 180◦ to 0◦, and two fixed maskers at 135◦ and 180◦. The LC′
value was 0 dB in all simulations.
lished. To calculate the IBM, the target and masker signals mustbe available prior to being mixed. This requirement can be relaxedby using a directional system to estimate the IBM, and from (6),
we see that the IBM can be equal to the IBM if only two sourcesare present, and their directional gains are known. The directionalgains are used to calculate the LC′ value from the LC value and re-quires that the directional patterns of the cardioids and the target andmasker azimuth are known.
From the first simulation, we find that the proposed methodmakes it possible to obtain an estimate of the IBM with a very highprecission. When the two sources are spatially well separated, thesetup with fixed LC′ and adaptive LC′ both provide a high numberof correct T-F units. But as the two sources become closer, the setupwith the adaptive LC′ shows a significant advantage compared to thefixed LC. The simulation illustrates what happens when the maskersource is captured equally by the target and masker cardioid. The bi-nary mask becomes an all-one mask with 50% correct T-F units. Thesame situation occurs when the target source is captured equally bythe two cardioids, and the result is an all-zero mask. The method ofvarying the LC′ value has an advantage over fixating the LC′ value,and the target and masker source can become closer before the esti-mate is degraded significantly.
In the second simulation, we examine the robustness of the pro-posed method, when conditions are changed from the ideal ones.Introducing more sources and impulse responses from a BTE shellon a HATS in an anechoic room does not undermine the method anda significant increase in speech intelligibility can still be expectedfrom the proposed method. However, a significant decrease in thepercentage of correct T-F units is seen when reverberation is intro-duced, which are agreeable with the results reported using the DUETalgorithm in echoic environments [7]. The errors introduced in theestimated binary mask can be divided into two types of errors, andin [3] the wrong ones and wrong zeros are referred to as type I andtype II errors, respectively. In their paper, the impact on speech in-telligibility of the two types of errors are measured showing that typeII errors have a larger impact on speech intelligibility compared totype I errors. This interesting result should be taken into consider-ation when further developing the proposed method, but the resultsfrom [3] can not be used directly to predict speech intelligibility ofthe method proposed in the present paper. One reason is the dif-ference in setup: We use a Gammatone filterbank whereas a linearfilterbank is used in [3]. Another reason is the distribution of errors:
It is expected that type II errors scattered uniformly as in [3] willhave less impact on speech intelligibility compared to e.g. type IIerrors placed at onsets in the target sound.
5. CONCLUSION
In this paper we have proposed a method that makes it possible toestimate the ideal binary mask without having the unmixed signalsavailable. If certain constraints are met, the precision of the esti-mated binary mask is very high, and even if the constraints are notmet the proposed method shows promising results having the lowcomplexity of the method in mind. These results establish an im-portant connection between the ideal binary mask and a realizablesystem for T-F masking, and the precision and robustness of the pro-posed method in non-ideal conditions makes it very promising forfurther research and development.
6. REFERENCES
[1] M. Cooke and D.P.W. Ellis, “The auditory organization ofspeech and other sources in listeners and computational mod-els,” Speech Comm., vol. 35, no. 3, pp. 141–177, 2001.
[2] D. Wang and G. J. Brown, Eds., Computational Auditory Scene
Analysis, Wiley & IEEE Press, Hoboken, New Jersey, 2006.
[3] Ning Li and Philipos C. Loizou, “Factors influencing glimps-ing of speech in noise,” J. Acoust. Soc. Am., vol. 122, no. 2,pp. 1165–1172, 2007.
[4] M. Anzalone, L. Calandruccio, K. Doherty, and L. Carney,“Determination of the potential benefit of time-frequency gainmanipulation,” Ear and Hearing, vol. 27, no. 5, pp. 480–492,2006.
[5] N. Roman, D. Wang, and G. J. Brown, “Speech segregationbased on sound localization,” J. Acoust. Soc. Am., vol. 114, no.4, pp. 2236–2252, 2003.
[6] D. Kolossa and R. Orglmeister, “Nonlinear postprocessing forblind speech separation,” in Proc. ICA 2004, Granada, Spain,September 22-24. 2004, pp. 832–839.
[7] O. Yilmaz and S. Rickard, “Blind separation of speech mix-tures via time-frequency masking,” IEEE Trans. Signal Pro-
cess., vol. 52, no. 7, pp. 1830–1847, 2004.
[8] M. S. Pedersen, D. Wang, J. Larsen, and U. Kjems, “Two-microphone separation of speech mixtures,” IEEE Trans. Neu-
ral Netw., vol. 19, no. 3, pp. 475–492, 2008.
[9] D. Wang, “On ideal binary mask as the computational goalof auditory scene analysis,” in Speech Separation by Humans
and Machines, Pierre Divenyi, Ed., pp. 181–197. Kluwer Aca-demic, 2005.
[10] D. S. Brungart, P. S. Chang, B. D. Simpson, and D. Wang, “Iso-lating the energetic component of speech-on-speech maskingwith ideal time-frequency segregation,” J. Acoust. Soc. Am.,vol. 120, no. 6, pp. 4007–4018, 2006.
[11] R. D. Patterson, J. Holdsworth, I. Nimmo-Smith, and P. Rice,“SVOS final report, part b: Implementing a gammatone filter-bank,” Rep. 2341, MRC Applied Psychology Unit., 1988.
[12] G. W. Elko, “Superdirectional Microphone Arrays,” in Acous-
tic Signal Processing for Telecommunication, Steven L. Gayand Jacob Benesty, Eds., chapter 10, pp. 181–237. KluwerAcademic Publishers, 2000.
[13] J. Blauert, Spatial hearing. The Psychophysics of human sound
localization, MIT Press, Cambridge, USA, 1999.
78

In the following five figures, the results from paper D are elaborated by showing thehit and false alarm rates. The hit rate (1 - type II errors) is the percentage of correct oneswith respect to the IBM. The false alarm rate (type I errors) is the percentage of zerosthat have falsely been estimated as being one.
180 150 120 90 60 30 00
10
20
30
40
50
60
70
80
90
100
Pe
rce
nta
ge
[%
]
Masker source azimuth [degrees]
LC’ adaptive, Total
LC’ adaptive, Hits
LC’ adaptive, False alarm
LC’ fixed, Total
LC’ fixed, Hits
LC’ fixed, False alarm
Figure 1: The results from Figure 4 split into hits and false alarms.
180 150 120 90 60 30 00
10
20
30
40
50
60
70
80
90
100
Pe
rce
nta
ge
[%
]
Moving masker azimuth [degrees]
Free−field, Total
Free−field, Hits
Free−field, False alarm
Figure 2: The Free-field result from Figure 5 split into hits and false alarms.
PAPER D - Additional Figures 79

180 150 120 90 60 30 00
10
20
30
40
50
60
70
80
90
100
Pe
rce
nta
ge
[%
]
Moving masker azimuth [degrees]
BTE on HATS, anechoic, Total
BTE on HATS, anechoic, Hits
BTE on HATS, anechoic, False alarm
Figure 3: The BTE on HATS, anechoic from Figure 5 split into hits and false alarms.
180 150 120 90 60 30 00
10
20
30
40
50
60
70
80
90
100
Pe
rce
nta
ge
[%
]
Moving masker azimuth [degrees]
BTE on HATS, low reverberation, Total
BTE on HATS, low reverberation, Hits
BTE on HATS, low reverberation, False alarm
Figure 4: The BTE on HATS, low reverberation from Figure 5 split into hits and false alarms.
180 150 120 90 60 30 00
10
20
30
40
50
60
70
80
90
100
Pe
rce
nta
ge
[%
]
Moving masker azimuth [degrees]
BTE on HATS, high reverberation, Total
BTE on HATS, high reverberation, Hits
BTE on HATS, high reverberation, False alarm
Figure 5: The BTE on HATS, high reverberation from Figure 5 split into hits and false alarms.
80 PAPER D - Additional Figures

Paper E
Error-Correction of Binary Masks using
Hidden Markov Models
Jesper B. Boldt, Michael S. Pedersen, Ulrik Kjems,Mads G. Christensen, and Søren H. Jensen
Proceedings of the International Conference on Acoustics,Speech and Signal Processing 2010, pp. 4722–4725.

c©2010 IEEE

ERROR-CORRECTION OF BINARY MASKS USING HIDDEN MARKOV MODELS
Jesper Bunsow Boldt1,2, Michael Syskind Pedersen1, Ulrik Kjems1,Mads Græsbøll Christensen2, Søren Holdt Jensen2
1Oticon A/S, Kongebakken 9, DK-2765 Smørum, Denmark2Department of Electronic Systems, Aalborg University, DK-9220 Aalborg Øst, Denmark
{jeb,msp,uk}@oticon.dk,{mgc,shj}@es.aau.dk
ABSTRACT
Binary masking is a simple and efficient method for source separa-tion, and a high increase in intelligibility can be obtained by apply-ing the target binary mask to noisy speech. The target binary maskcan only be calculated under ideal conditions and will contain er-rors when estimated in real-life applications. This paper proposes amethod for correcting these errors. The error-correction is based ona hidden Markov model and uses the Viterbi algorithm to calculatethe most probable error-free target binary mask from a target binarymask containing errors. The results demonstrate that it is possible tocorrect errors in the target binary mask and reduce the noise energy.However, speech energy is also reduced by the error-correction, butthe impact on speech intelligibility and speech quality are not estab-lished or evaluated in the present study.
Index Terms— Binary masking, target binary mask, hiddenMarkov model, speech intelligibility, error-correction.
1. INTRODUCTION
Time-frequency masking has been widely used for source separation[1] and in experiments on intelligibility of noisy speech [2]. Ba-sically, time-frequency masking is a general method of applying atime-varying and frequency-dependent gain to a signal. This gain iscalled the mask, and when the mask only contains the values zeroand one, the method is referred to as binary masking. Using bi-nary masking to separate speech from noise, in e.g. hearing aids andcochlear implants, is interesting because binary masking is a simplemethod and has a substantial impact on intelligibility. In [2, 3] theideal binary mask increased intelligibility for normal hearing listen-ers and in [4] for hearing impaired listeners. The ideal binary maskwas further studied in [5] together with the target binary mask, andwhen used to separate speech from noise both binary masks causeda large increase in intelligibility .
The target binary mask (TBM) is calculated by comparing theenergy of the target speech with the long-term average energy ofspeech from the same speaker. If the energy of the target speechT(k, τ) exceeds this long-term average energy r(k) by a certainamount, the value one will be assigned to the TBM at that partic-ular time τ and frequency k. If not, the value zero is assigned:
TBM(k, τ) =
{1, if
T(k, τ)r(k)
> LC
0, otherwise, (1)
where LC is the local SNR criterion. The LC value controls theamount of ones in the TBM. High intelligibility was obtained in [5]within the range of 20% - 60% ones in the TBM.
>TFRTarget speech
Noise
k τk
k τ
Fig. 1. Setup for estimating the target binary mask. The TFR blockcalculates the time-frequency representation of the mixture of tar-get speech and noise. The time-frequency representation T(k, τ) iscompared to r(k) · LC to get the target binary mask TBM(k, τ).
The positive impact on intelligibility, makes the TBM interest-ing in situations where intelligibility is reduced, e.g., for hearingaid users in difficult listening environments. The classic approachesto this problem have been evaluated in [6]. In this study, differentspeech enhancement algorithms are evaluated on normal hearing lis-teners. However, only a single algorithm in a single noise conditionis able to increase intelligibility significantly.
It is possible to increase intelligibility with the TBM, but themethod has the obvious drawback of requiring the target speech tobe available. In most real-life situations, the target speech is notavailable, and the TBM must be estimated from the available sound.This estimate will contain errors, and the hypothesis of this paper isthat these errors can be corrected. To our knowledge, no methodsfor estimating or correcting errors in the TBM have been proposedin the literature – a major reason for this being the novelty of theTBM. In this study, we focus on the error-correction of the TBM,well aware that the estimation of the TBM is not a trivial problem.
The error-correction employs a model of the error-free TBM.This model is a hidden Markov model (HMM) build from the TBMcalculated using speech from multiple speakers to test the generalityof the model. If the TBM from different speakers do not share somecommon characteristics, it is difficult to build a model of the TBMand use it for error-correction. To make the error-correction indepen-dent of the speaker, the long-term average energy r(k) in Equation(1) will not be adjusted to the individual speaker, but calculated asthe long-term average energy of the speech used in the experiments.
The setup shown in Figure 1 is used to evaluate the proposedmethod. In this setup, the TBM will be error-free, if no noise soundis present and r(k) is known. When noise is added to the targetspeech, two types of errors will be found in the noisy TBM: Falseones, if the noise sound causes the energy in the individual time-frequency units to exceed the threshold r(k) · LC. False zeros, if thespeech and noise cancel each other in certain time-frequency units.At high signal-to-noise ratios (SNR), no errors will be found in the
PAPER E 83

qtqt-1 qt+1
1
2
.
K
.
.
States:
Obser-
vations:
ot-1 ot ot+1
Aqt-1,qt Aqt,qt+1
bqt(k)
Fig. 2. Structure of the hidden Markov model used in this study.At time t, the state qt generates an observation ot and changes statewith probability Aqt,qt+1 . The probability of being in state qt andobserving a one at frequency k is defined by bqt(k) as shown withgray color.
TBM, but as the SNR decreases the amount of errors increases. Themajority of these errors will be false ones, and ultimately, if the SNRis further reduced, the binary mask will become an all-one mask. Inthis situation the error-correction is of no use, even though the totalnumber of errors could be reduced by forcing some time-frequencyto zero in the target binary mask. Error-correction is expected to bepossible when the TBM contains a comparable amount of correctand false ones.
2. BINARY MASK MODEL
The error-correction is based on a hidden Markov model [7] of theTBM. The HMM is a widely used statistical model for pattern recog-nition and speech processing, and it is particularly well suited tomodel time-series with time-varying statistical properties. In theHMM, the hidden layer contains multiple states, which, at each timeincrement, can change and generate an observation. From a se-quence of observations, the most probable sequence of states canbe calculated using the Viterbi algorithm [7].
In the HMM used in this study, the observations are the noisyTBM, the states are the error-free TBM, and the error-correction isthe step of calculating the most probable error-free TBM from thenoisy TBM using the Viterbi algorithm. The observations and statesin the HMM are binary vectors of size K, as seen in Figure 2. Kis the number of frequency channels. Each state in the HMM repre-sents the TBM at a single time τ , and this approach assumes that theTBM can be build from a small number of states. However, when alimited number of states is used to build the TBM errors will be in-troduced, as seen in Figure 3. We refer to the process of building theTBM with a limited number of states as quantization of the TBM.
In the HMM, the probability of changing state is determined bythe state-transition probability matrix A, where the elements ai,j arethe probability of changing from state i to state j [7]. In each statej, the observation probability bj(k) determines the probability of aone at frequency k. If the TBM could be build from N states with-out quantization error, the observation probabilities bj(k) would bebinary and identical to the states. However, when the TBM is buildfrom, e.g. 512 states, quantization error will be introduced becausethe TBM contains more than 512 different states. This means that theobservation probabilities will have values between zero and ones: Ifd binary vectors from the training data are quantized to the same
(A) Target binary mask
Fre
qu
en
cy c
ha
nn
el [k
]
1
8
16
24
32
(B) Quantized target binary mask
80 Hz
419 Hz
1.3 kHz
3.3 kHz
8 kHz
(C) Noisy target binary mask
Time [τ]
Fre
qu
en
cy c
ha
nn
el [k
]
1 60 120 1801
8
16
24
32
(D) Error−corrected target binary mask
Time [τ]
80 Hz
419 Hz
1.3 kHz
3.3 kHz
8 kHz
1 60 120 180
Fig. 3. Error-correction of the noisy target binary mask. (A) is thetarget binary mask from 1.8 s of speech. (B) is (A) quantized using256 states. (C) is the speech from (A) mixed with speech shapednoise at 0 dB SNR. (D) is (C) after error-correction using a 256 statehidden Markov model.
state j, and c out of the d states have a one at frequency k, we findthat bTj (k) = c/d.
The probability of a false one in the TBM generated by the noisesound is given by bN(k). This probability is independent on the statein the HMM but dependent on the type and level of the noise sound.If we assume that the target speech and noise sound are independentand do not overlap in time and frequency, the observation probabilityin state j at frequency k is given by
bj(k) = bTj (k) + bN(k)− bTj (k)bN(k), (2)
where bTj (k) is the probability of a one generated by the target
speech. In the experiments, bN(k) will be estimated from a shortsegment of the noise sound in the beginning of each experiment.
3. TRAINING
To train the HMM and evaluate the error-correction, the EUROMcorpus was used [8]. The training data was generated by calculatingthe TBM from 36 minutes of speech spoken by 4 male and 4 femalespeakers normalized to equal energy. This speech was processedusing a 32 band Gammatone filterbank [9] with centerfrequenciesbetween 80 Hz to 8000 Hz equally spaced on the ERB scale (equiv-alent rectangular bandwidth). To obtain T(k, τ), each subband sig-nal from the Gammatone filterbank was divided into 20 ms frameswith 10 ms overlap, and the energy was calculated from each framein each subband. The long-term average energy r(k) was calculatedas the average of each frequency channel in T(k, τ).
The 36 minutes of speech produced a TBM with 216000columns and 32 rows from which N states were found while min-imizing the quantization error as measured by the total amount offalse ones and false zeros. This quantization was done using theK-mode algorithm which is similar to the well-known K-meansalgorithm but useable for clustering binary data [10]. From thequantized TBM, the state-transition probability matrix Ai,j was cal-culated by counting the number of state changes from state i to statej and divide by the total number of visits in state i. To find bTj (k),the columns in the TBM quantized to the same state were identified,and the probability of a one at each frequency was calculated. To
84

0 1 2 3 4 5 6 7 8 9 100
5
10
15
20
States [log2]
Err
ors
in
th
e e
rro
r−co
rre
cte
d T
BM
[%
]
Total (V)Total (C)Total (Q)
Ones (V)Ones (C)Ones (Q)
Zeros (V)Zeros (C)Zeros (Q)
Fig. 4. Errors in the error-corrected target binary mask as a func-tion of number of states in the hidden Markov model. (V) is error-correction using the Viterbi algorithm, (C) is error-correction using acausal Viterbi algorithm, and (Q) is simple quantization of the noisytarget binary mask. The percentages of errors before error-correctionwere 0.2% false zeros, 15.9% false ones, and 16.1% in total.
find bN(k), the probabilities of a one in each of the frequency chan-nels was obtained from the TBM as described in Section 2 using 5seconds of noise.
4. EVALUATION
To evaluate the proposed method, two simulations were carried out.The first simulation examines the relation between the number ofstates and the performance of the error-correction as measured bythe percentage of errors. The second simulation examines the lossof target energy and the remaining noise energy before and after theerror-correction under different conditions. In both simulations, 10sentences from a male and a female speaker were used. These twospeakers were not part of the training data.
In the first simulation, the sentences were mixed with speechshaped noise at 0 dB SNR using the setup in Figure 1. The HMMwas trained as described in Section 3 with a varying number of statesbetween 1 and 1024. Figure 4 shows the percentage of errors afterthe error-correction. For comparison, the percentage of errors in thequantized noisy TBM and error-correction using a causal Viterbi al-gorithm are also shown.
All percentages are calculated relative to the total number oftime-frequency units in the binary mask. The percentages of er-rors in the TBM before error-correction were 0.2% false zeros and15.9% false ones giving 16.1% in total. As more states are used inthe HMM, the amount of false ones increases, whereas the amountof false zeros decreases, as seen Figure 4. Using a single state in theHMM, this single state will be the all-zero column vector, makingit impossible to have false ones in the error-corrected TBM. Whenthe number of states is between 1 and 32, these states will containfew ones which limits the amount of false ones. Using 1024 states,the percentage of errors is 8.1% - a reduction of 8 percentage pointscompared to the noisy TBM. However, the reduction of false oneshas the drawback of increasing the amount of false zeros relative tothe noisy TBM.
The Viterbi algorithm uses previous, current and future obser-vations from the noisy TBM to calculate the most probable state
0
20
40
60
80Speech shaped noise Bottling hall noise
−10 −5 0 5 10 15
Babble noise
−10 −5 0 5 10 15
0
20
40
60
80Car noise
En
erg
y lo
ss a
nd
en
erg
y r
esid
ue
[%
]
SNR [dB]
P NR
beforeP
NR
afterP
EL
beforeP
EL
after
Fig. 5. The noise residue PNR and the loss of target energy PEL be-fore and after the error-correction. The hidden Markov model usedfor error-correction has 256 states. PNR and PEL is calculated rela-tive to the error-free target binary mask.
sequence. In low-delay applications this dependency on the futureis critical and for comparison a causal Viterbi algorithm was im-plemented. This algorithm finds the most probable sequence basedupon the previous and current observations only, and, as seen in Fig-ure 4, this modification does not significantly reduce performance.
In the second simulation, an HMM with 256 states was trainedas described in Section 3 and used to evaluate the performance be-tween -10 dB and 15 dB SNR. The sentences were mixed with fourdifferent noise types: speech shaped noise, a high-frequency soundfrom a bottling hall, a low-frequency sound from the interior of a car,and babble noise. Performance was measured using the percentageof energy loss and the percentage of noise residue [11]:
PEL =
∑n
e21(n)
∑n
I2(n)(3) PNR =
∑n
e22(n)
∑n
O2(n), (4)
where I(n) is the resynthesized sound using the TBM, O(n) isthe resynthesized output before or after the error-correction, e1(n)is the sound found in I(n) but not in O(n), and e2(n) is the soundfound in O(n) but not in I(n). As seen in Figure 5, a similar per-formance for the different noise types is seen when changing SNR.At low SNR, the percentage of noise energy P before
NR is high forthe noisy TBM before error-correction. As the SNR increases, theamount of false ones in the TBM decreases resulting in a lower per-centage of noise energy. Ultimately, when SNR is further increased,the P before
NR is reduced to 0% because no false ones are found in the
noisy TBM. The noise energy after error-correction P afterNR shows a
reduction at SNRs below 10 dB but a very small increase at SNRsaround 15 dB. This increase shows that error-correction of an error-free TBM can introduce false ones due to the limited number ofstates in the HMM. The percentage of energy loss P before
EL showsthat loss of target energy using the noisy TBM is close to 0%, be-
PAPER E 85

cause very few false zeros are found in the noisy TBM before error-correction. When error-correction is introduced, the loss of targetenergy increases as shown by P after
EL : At low SNRs the loss of tar-get energy is significant, but as the SNR increases this loss is reducedand levels off at around 8%. The lower limit of P after
EL at 8% is ex-plained by the limited number of states in the HMM. If few errors arefound in the TBM, the error-correction will increase both false onesand false zeros. For all four noise types, except the babble noise, thebest performance is found around 0 − 5 dB SNR, when the error-correction reduces the noise energy more than the target energy. Lis-tening to the processed sound before and after error-correction con-firms this finding.
5. DISCUSSION
The results confirm that a model of the TBM can be build and used tocorrect errors in the noisy TBM, but the reduction of false ones hasthe drawback of increasing the amount of false zeros. Even thoughthe relation between errors and intelligibility has been examined in[12], it is difficult to use these results to determine the intelligibilityof the TBM before and after the error-correction. In [12], the errorsare uniformly distributed in time and frequency and the frequencyresolution is different. The authors in [12] find that false ones reduceintelligibility more than false zeros. However, the location of errorsand the noise type must have a significant impact on intelligibility,e.g. if the false zeros are found at onsets in the target speech.
If the relation between errors in the TBM and intelligibilitywas well-established, this would change the training and use of theHMM. If false ones reduce intelligibility more than false zeros, themodel could be modified to allow more false zeros than false ones.Such a weighting would make it possible to adjust the level of losttarget energy and remaining noise energy. Furthermore, the impactfrom errors on intelligibility is probably frequency dependent andthus it might be useful to reduce errors at some frequencies at theprize of more errors at other frequencies.
An interesting question to consider, is if the performance of theerror-correction will continue to improve with an increasing numberof states. Using more states will reduce the errors, but errors will bedifficult to avoid. Errors in the TBM can make a wrong sequence ofstates more probable than the correct sequence. This limitation is adrawback of working in the binary domain, because the amount ofinformation about the target speech and the noise sound is greatlyreduced compared to the time-frequency domain.
Another limitation of the proposed method is the speaker depen-dency of the TBM. The TBM changes with different speakers, sothe model used in the error-correction has to model different speechsounds as well as different speakers. This makes the model moregeneral, but also less precise for the individual speakers. If r(k) wasadjusted to each speaker, the TBM from different speakers wouldprobably be more similar and less complex to model. This couldreduce the number of required states in the hidden Markov modelwithout affecting performance. The Viterbi algorithm has a com-plexity of O(N2T ), where T is the number of observations [13],why decreasing the number of states will make the method moreusable in hearing aids.
More complex models, e.g., factorial HMMs, could also be usedto make the error-correction more efficient. However, the complex-ity of the model should be considered with respect to the complexityof the domain. The binary domain is a simplified domain comparedto the time-frequency domain, and applying a very complex model ina simple domain might not be optimal. Instead, models in the time-frequency domain should be used. This also applies to the present
study, because the large number of states can be a problem in appli-cations like hearing aids even though the complexity of the modelitself is low.
6. CONCLUSION
In this study, a method for error-correction of the TBM has been pre-sented. The method is based on a HMM and trained on the TBM cal-culated under ideal conditions. The results of this study demonstratethat errors can be reduced, although the reduction of false ones hasthe drawback of increasing the amount of false zeros. The possibilityof correcting errors in the TBM makes algorithms for estimating theTBM in real-life applications like hearing aids and cochlear implantsmore interesting and useful. The method used in this study can befurther improved, e.g. using a speaker dependent r(k) or by weight-ing of different frequencies, but the model could also be useful forsimilar problems involving erroneous binary patterns.
7. REFERENCES
[1] D. Wang, “Time-frequency masking for speech separation andits potential for hearing aid design,” Trends in Amplification,vol. 12, no. 4, pp. 332–353, 2008.
[2] D. S. Brungart, P. S. Chang, B. D. Simpson, and D. Wang, “Iso-lating the energetic component of speech-on-speech maskingwith ideal time-frequency segregation,” J. Acoust. Soc. Am.,vol. 120, no. 6, pp. 4007–4018, 2006.
[3] N. Li and P. C. Loizou, “Effect of spectral resolution on theintelligibility of ideal binary masked speech,” J. Acoust. Soc.
Am., vol. 123, no. 4, pp. EL59–EL64, 2008.
[4] Deliang Wang, Ulrik Kjems, Michael S. Pedersen, Jesper B.Boldt, and Thomas Lunner, “Speech intelligibility in back-ground noise with ideal binary time-frequency masking,” J.
Acoust. Soc. Am., vol. 125, no. 4, pp. 2336–2347, 2009.
[5] U. Kjems, J. B. Boldt, M. S. Pedersen, T. Lunner, and D. Wang,“Role of mask pattern in intelligibility of ideal binary-maskednoisy speech,” J. Acoust. Soc. Am., vol. 126, no. 3, pp. 1415–1426, 2009.
[6] P. C. Loizou, Speech Enhancement: Theory and Practice, CRCPress, 1 edition, 2007.
[7] L. R. Rabiner, “A tutorial on hidden markov models and se-lected applications in speech recognition,” Proc. IEEE, vol.77, no. 2, pp. 257–286, 1989.
[8] D. Chan et al., “EUROM - a spoken language resource for theEU,” in Proc. Eurospeech, 1995, vol. 1, pp. 867–870.
[9] R. D. Patterson, J. Holdsworth, I. Nimmo-Smith, and P. Rice,“SVOS final report, part b: Implementing a gammatone filter-bank,” Rep. 2341, MRC Applied Psychology Unit., 1988.
[10] Z. Huang, “Extensions to the k-means algorithm for cluster-ing large data sets with categorical values,” Data Mining and
Knowledge Discovery, vol. 2, no. 3, pp. 283–304, 1998.
[11] G. Hu and D. Wang, “Monaural speech segregation based onpitch tracking and amplitude modulation,” IEEE Trans. Neural
Netw., vol. 15, no. 5, pp. 1135–1150, 2004.
[12] N. Li and P. C. Loizou, “Factors influencing intelligibility ofideal binary-masked speech: Implications for noise reduction,”J. Acoust. Soc. Am., vol. 123, no. 3, pp. 1673–1682, 2008.
[13] X. Huang, A. Acero, and H.-W. Hon, Spoken Language Pro-
cessing, Prentice Hall, 1 edition, 2001.
86
Paper F
A Simple Correlation-based Model of Intelligibility for
Nonlinear Speech Enhancement and Separation
Jesper B. Boldt, Daniel P. W. Ellis
Proceedings of the European Signal Processing Conference 2009,pp. 1849–1853.
c©2009 European Association for Signal Processing

A SIMPLE CORRELATION-BASED MODEL OF INTELLIGIBILITY FORNONLINEAR SPEECH ENHANCEMENT AND SEPARATION
Jesper B. Boldt1, Daniel P. W. Ellis2
1Oticon A/S, Kongebakken 9, DK-2765 Smørum, Denmark2LabROSA, Dept. of Electrical Engineering, Columbia University
New York, NY 10027, [email protected], [email protected]
ABSTRACT
Applying a binary mask to a pure noise signal can result in speechthat is highly intelligible, despite the absence of any of the targetspeech signal. Therefore, to estimate the intelligibility benefit ofhighly nonlinear speech enhancement techniques, we contend thatSNR is not useful; instead we propose a measure based on the simi-larity between the time-varying spectral envelopes of target speechand system output, as measured by correlation. As with previouscorrelation-based intelligibility measures, our system can broadlymatch subjective intelligibility for a range of enhanced signals. Oursystem, however, is notably simpler and we explain the practicalmotivation behind each stage. This measure, freely available as asmall Matlab implementation, can provide a more meaningful eval-uation measure for nonlinear speech enhancement systems, as wellas providing a transparent objective function for the optimization ofsuch systems.
1. INTRODUCTION
Speech enhancement concerns taking a target speech signal that hasbeen corrupted, by the addition of interfering sources and trans-mission through an acoustic channel, and mitigating the impact ofthese corruptions. Enhancement can have two, distinct goals: im-proving quality, which relates to how “clear” or “natural” the en-hanced speech sounds, and improving intelligibility, which focuseson the more practical problem of whether a listener can understandthe message in the original target speech. Although we might expectthat quality and intelligibility are strongly correlated, there are am-ple situations in which speech of relatively low quality can nonethe-less achieve high intelligibility [17, 22], and where improving qual-ity does not necessarily improve intelligibility [10].
In this paper we ignore quality (and related effects such as lis-tener fatigue) and concentrate on intelligibility. We focus specif-ically on time-frequency masking algorithms, which have beenwidely used in automatic speech recognition [6], computationalauditory scene analysis [21], noise reduction [15, 2], and sourceseparation [23, 16]. In this type of algorithm, a time-varying andfrequency-dependent gain is applied across a number of frequencychannels. In some variants, the gains are quantized to zero or one,giving a binary masking algorithm where the pattern of gains is re-ferred to as the binary mask. One type of binary mask – the idealbinary mask (IBM) – has shown to be able to increase speech intel-ligibility significantly [3, 2, 14]. This mask is ‘ideal’ in that it relieson perfect knowledge of both clean target and interference prior tomixing, and is constructed to pass only those time-frequency cellsin which the target energy exceeds the interference. An intrigu-ing property of the IBM is that applying such a mask to a soundconsisting only of noise results in high intelligibility for the speechupon which the mask was based [22, 13], even though the perceived
This work was supported by Oticon A/S, The Danish Agency for Sci-
ence, Technology and Innovation, and by the NSF under grant no. IIS-
0535168. Any opinions, findings and conclusions or recommendations ex-
pressed in this material are those of the authors and do not necessarily reflect
the views of the sponsors.
quality of the reconstructed speech is very poor: depending on theresolution of the time-frequency distribution, it will have no pitch orother fine structure, and fine nuances of energy modulation are lost.Similar characteristics are found to those of noise-excited channel-vocoded speech [17]. An attempt to measure the signal to noise ratio(SNR) in such signals would find no trace of the original target inthe final output, so SNR-based measures will not be a useful basisfor accounting for this intelligibility. What is preserved, however,is the broad envelope in time and frequency. This suggests that anintelligibility estimate could be developed based on the similarity ofthis envelope between target speech and system output.
In this paper, we use correlation as a measure of similaritybetween time-frequency envelopes of target and enhanced speech.Given this basic principle, we make a number of design choices andsystem enhancements with a view to matching the general prop-erties of observed subjective intelligibility of nonlinearly-enhancedsignals. At each stage, we strive for the simplest and most transpar-ent processing that can effectively match the subjective results. Ouroutcome is a simple correlation-based measure that can predict in-telligibility with approximately the same fidelity as more complexmodels based on far more detailed models of auditory processing[4]. We feel this simplicity and transparency is a considerable ad-vantage as a guide for developing enhancement systems.
2. NORMALIZED SUBBAND ENVELOPECORRELATION
To estimate intelligibility, the correlation between the time-frequency representations of the target (reference) and the outputof the time-frequency masking algorithm is calculated:
∑τ
∑k
T(τ,k) ·Y(τ,k), (1)
where τ the time index, k the frequency index, T(τ,k) is the energyenvelope of the target signal, and Y(τ,k) is the energy envelope ofthe output. This correlation will not have an upper bound, and inlow energy regions of T(τ,k) the inclusion of potential unwantedenergy in Y(τ,k) will have a very small impact on the correlation.To improve this behavior, we normalize with the Frobenius normof T(τ,k) and Y(τ,k) and refer to this measure as the normalizedsubband envelope correlation (nSec):
nSec= ∑τ
∑k
T(τ,k) ·Y(τ,k)
||T(τ,k)||||Y(τ,k)|| (2)
The nSec is bounded between zero and one. The lower bound isreached if no energy is found in the same regions of T(τ,k) andY(τ,k). The upper bound is reached if the two signals are identicalor only differ by a scale factor. Geometrically interpreted, nSec isthe angle between T(τ,k) and Y(τ,k) if calculated using a singletime or frequency index.
3. EXPERIMENTAL DATA
To verify that nSec is a useful measure of speech intelligibility, weuse the results from Kjems et al. [13], where speech intelligibility of
PAPER F 89

−30 −20 −10 0 10 20
0
10
20
30
40
50
60
70
80
90
100
RC = LC − SNR [dB]
% C
orr
ect
(A) Bottling hall noise
aom
−12.2 dB SNR
−18.4 dB SNR
−60.0 dB SNR
−12.2 dB SNR, nSec
−18.4 dB SNR, nSec
−60.0 dB SNR, nSec
−30 −20 −10 0 10 20
RC = LC − SNR [dB]
(B) Cafeteria noise
aom
−8.8 dB SNR
−13.8 dB SNR
−60.0 dB SNR
−8.8 dB SNR, nSec
−13.8 dB SNR, nSec
−60.0 dB SNR, nSec
−30 −20 −10 0 10 20
RC = LC − SNR [dB]
(C) Car interior noise
aom
−20.3 dB SNR
−23.0 dB SNR
−60.0 dB SNR
−20.3 dB SNR, nSec
−23.0 dB SNR, nSec
−60.0 dB SNR, nSec
−30 −20 −10 0 10 20
RC = LC − SNR [dB]
(D) Speech shaped noise
aom
−7.3 dB SNR
−9.8 dB SNR
−60.0 dB SNR
−7.3 dB SNR, nSec
−9.8 dB SNR, nSec
−60.0 dB SNR, nSec
Figure 1: Estimated intelligibility by nSec compared to subjective listening tests in four different noise conditions and three SNR levels.nSec is shown with solid lines/filled symbols, and subjective listening tests are shown with dotted lines/hollow symbols. The results areplotted as a function of the RC value which determines the sparseness of the binary mask - higher RC values imply fewer ones in the binarymask. The all-one mask (aom) is the unprocessed condition and does does not correspond to a specific RC value.
IBM-masked noisy speech is measured using normal hearing sub-jects, three SNR levels, four noise types, and different local SNRcriterions (LC). LC is the threshold used to construct the IBM; alarger LC results in an IBM with proportionally fewer nonzero val-ues:
IBM(τ,k) =
{1, if
T(τ,k)N(τ,k)
> LC
0, otherwise, (3)
where N(τ,k) is the energy envelope of the noise signal.
Two of the three SNR levels used in the experiments by Kjemset al. were set to 20% and 50% intelligibility of the speech andnoise mixtures with no binary masking. The third SNR level wasfixed at -60 dB to examine the effect of applying the IBM to purenoise. Four different noise conditions were used: speech shapednoise (SSN), cafeteria noise, car interior noise with mainly low-frequency energy, and noise from a bottling hall with mainly high-frequency energy. The LC values resulted in IBMs consisting ofbetween 1.5% and 80% of nonzero cells, and an all-one mask (aom)was used to measure the intelligibility of the unprocessed mixturewith no binary masking. A 64 channel Gammatone filterbank withcenterfrequencies from 55 Hz to 7742 Hz equally spaced on theERB (equivalent rectangular bandwidth) scale was used, and theoutput was divided into 20 ms frames with 10 ms overlap. Theresults are shown with dotted lines and hollow symbols in Figure 1(and are repeated in subsequent figures). To align the results, theyare plotted as a function of the RC value defined as RC=LC−SNRin units of dB. Using this x-coordinate, the binary masks will beidentical at the same RC value and independent of the SNR levels.
To compare the nSec with the results by Kjems et al., we use10 sentences from their experiment which have been mixed withnoise and processed with the IBM. Silence between the sentencesare removed from the waveforms, and T(τ,k) and Y(τ,k) are cal-culated using a 16 channel Gammatone filterbank with center fre-quencies from 80 Hz to 8000 Hz equally spaced on the ERB scale.The energy from each frequency channel in the filterbank is dividedinto segments of 80 ms with 40 ms overlap. All processing is doneat 20 kHz. The calculated time-frequency representations T(τ,k)and Y(τ,k) are inserted in Equation 2, and the nSec scaled by afactor of 100 is shown with solid lines and filled symbols in Fig-ure 1.
4. MODIFICATIONS TO THE nSec
Looking at Figure 1, it can be seen that even though the nSec isnot aligned with the subjective listening tests, the overall shape andbehavior is encouraging: Increasing SNR gives a better or simi-lar nSec, and a distinct peak in correlation as a function of RCvalue is seen at all curves expect for the -60 dB SNR cafeteria noise(Fig.1.B). If this curve had been continued to higher RC values, itwould have made a peak at some point, because higher RC val-ues makes the binary mask more sparse with fewer ones, and, ul-timately, Y(τ,k) will be zero. At the other extreme, at low RCvalues, the nSec levels off which is most evident from Figure 1.Aand 1.D. The reason is that at some RC value, the time-frequencyunits added to Y(τ,k) by lowering the RC value will not changethe numerator of Equation 2 because no energy is found at thesetime-frequency units in T(τ,k). At the same time, the denominatorwill continue to increase as the RC value decreases, due only to theadded energy in ||Y(τ,k)||; ||T(τ,k)|| is a fixed value independentof SNR and RC value.
Comparing the three SNR levels, it can be seen that the peak ofthe nSec shifts towards lower RC values for higher SNRs – a rea-sonable property, if we recognize that the IBM for a certain targetand noise sound is a function of the RC value only, and that increas-ing SNR level implies that the RC value can be lowered withoutincreasing the number of noise-dominated time-frequency units inthe binary masked mixture. At increasing SNR levels, the RC valueis lowered by increasing the LC value with less than the increase inSNR level.
The nSec for the speech shaped noise (Fig.1.D) with an all-one mask is considerable higher at all three SNR levels comparedto other noise types. The nSec of the -60 dB SNR mixture with anall-one mask is approximately 0.4, despite the fact that practicallyno target sound is found in the mixture. Two random signals willalways give a positive correlation as long as they contain energy insome of the same time-frequency regions, and the speech shapednoise do, since it was made by superimposing 30 sequences of thespeech from the corpus with random silence durations and startingtimes [20]
The last observation we make of the unmodified nSec is thatthe location of the peaks are at higher RC values compared to thesubjective listening tests. This property is caused by the fact that
90

−30 −20 −10 0 10 20
0
10
20
30
40
50
60
70
80
90
100
RC = LC − SNR [dB]
% C
orr
ect
(A) Bottling hall noise
aom
−12.2 dB SNR
−18.4 dB SNR
−60.0 dB SNR
−12.2 dB SNR, nSec+m
−18.4 dB SNR, nSec+m
−60.0 dB SNR, nSec+m
−30 −20 −10 0 10 20
RC = LC − SNR [dB]
(B) Cafeteria noise
aom
−8.8 dB SNR
−13.8 dB SNR
−60.0 dB SNR
−8.8 dB SNR, nSec+m
−13.8 dB SNR, nSec+m
−60.0 dB SNR, nSec+m
−30 −20 −10 0 10 20
RC = LC − SNR [dB]
(C) Car interior noise
aom
−20.3 dB SNR
−23.0 dB SNR
−60.0 dB SNR
−20.3 dB SNR, nSec+m
−23.0 dB SNR, nSec+m
−60.0 dB SNR, nSec+m
−30 −20 −10 0 10 20
RC = LC − SNR [dB]
(D) Speech shaped noise
aom
−7.3 dB SNR
−9.8 dB SNR
−60.0 dB SNR
−7.3 dB SNR, nSec+m
−9.8 dB SNR, nSec+m
−60.0 dB SNR, nSec+m
Figure 2: The modified nSec with frequency normalization, compression, and DC removal compared to the subjective listening tests.
nSec is decreased when Y(τ,k) contains energy in the low energyregions of T(τ,k); to get a high nSec, the binary mask should onlypresent the high energy regions of T(τ,k).
To improve the alignment between the subjective listening testsand the nSec, the following modifications are introduced:
4.1 Frequency Normalization
In speech signals, high frequencies have less energy than low fre-quencies, but this difference does not reflect the frequencies’ im-portance to intelligibility. Using the nSec without any frequencynormalization will make the low frequencies dominate the result.Furthermore, the auditory system can to some degree adapt to thelistening situation and a minor fixed coloration of the speech spec-trum is not expected to affect intelligibility. To compensate forthe difference in energy and any fixed colorations, we normalizethe frequency channels to equal energy. This normalization hasthe drawback that at increasing RC values, when the binary maskbecomes more sparse, some frequency channels will contain fewnon-zero elements, which would become very large because of thenormalization. To avoid these high level time-frequency units, am-plitude compression should follow the normalization (although infrequency channels with no non-zero elements, no normalizationshould be applied).
4.2 Compression
To decrease the relative importance of high level time-frequencyunits mainly produced by the frequency normalization, compressioncan be applied to T(τ,k) and Y(τ,k). Compression will move thepeaks of the nSec curves towards lower RC values, but also reducesthe difference between the three SNR levels. To align the nSecpeaks with the subjective listening tests, T(τ,k) and Y(τ,k) areraised to the power of 0.15.
4.3 DC removal
As previously stated, the nSec will be positive even if two ran-dom signals are used because their energy is always positive. Toreduce this offset in the time-frequency representations, each fre-quency channel should be high-pass filtered. This high-pass filter-ing will push the values down to zero in the case where we haveflat, but nonzero, energy and emphasize changes in energy insteadof absolute levels. The used high-pass filter has a single zero at 1and a single pole at 0.95.
5. RESULT
As seen in Figure 2, the modifications improve the correspondencebetween the subjective listening test and the nSec. The differencesare most pronounced at low and high RC values where the slopeof the modified nSec is too shallow, and in the unprocessed con-dition (aom) the results are too low and too closely placed in thebottling hall and cafeteria noise condition. Ideally, the three SNRlevels should give a intelligibility of 50%, 20% and 0%, but thecompression, which was introduced to shift the peaks of the nSectowards lower RC values, also compresses the results at low RC val-ues, making them more equal. At high RC values the shallow slopeof the modified nSec is also a outcome from using compression.Compression increases the impact of low-amplitude time-frequencyunits and a more sparse mask is needed to reduce the nSec.
To allow some nonlinearity in the relationship between thenSec and speech intelligibility, a logistic function can be applied:
p(c) =1
1+ e(o−c)/s, (4)
where o is the offset, and s is the slope of the logistic function [4].To find the offset and the slope we use the unconstrained nonlin-ear minimization function fminsarch in Matlab to minimize thesquared error between nSec and the results from the subjective lis-tening test using speech shaped noise. The found offset and slope ofo = 0.62 and s = 0.09 are used to transform the nSec results fromFigure 2 into the results seen in Figure 3. The overall performanceis improved: a better correspondence between the subjective listen-ing tests and the nSec is seen, but this is achieved at the expense ofthe match in the situation with no binary masking (aom).
6. DISCUSSION
Our proposed method uses a different approach compared to intel-ligibility measures as AI, SII, and STI [1, 8, 19] by using the corre-lation as the fundamental function for measuring intelligibility. Inthe AI, SII, and STI, the intelligibility is measured as a sum andweighting of SNR in a number of frequency channel. A more simi-lar approach to ours is used in [11] for measuring speech quality andin [4] to measure intelligibility. In both works, the cross-correlationcoefficient is used to measure the similarity between internal repre-sentations of the target and test signal. The internal representationsare the expected patterns of neural activity from the auditory periph-ery calculated using the model by Dau et. al. [7]. In [4] the modu-
PAPER F 91
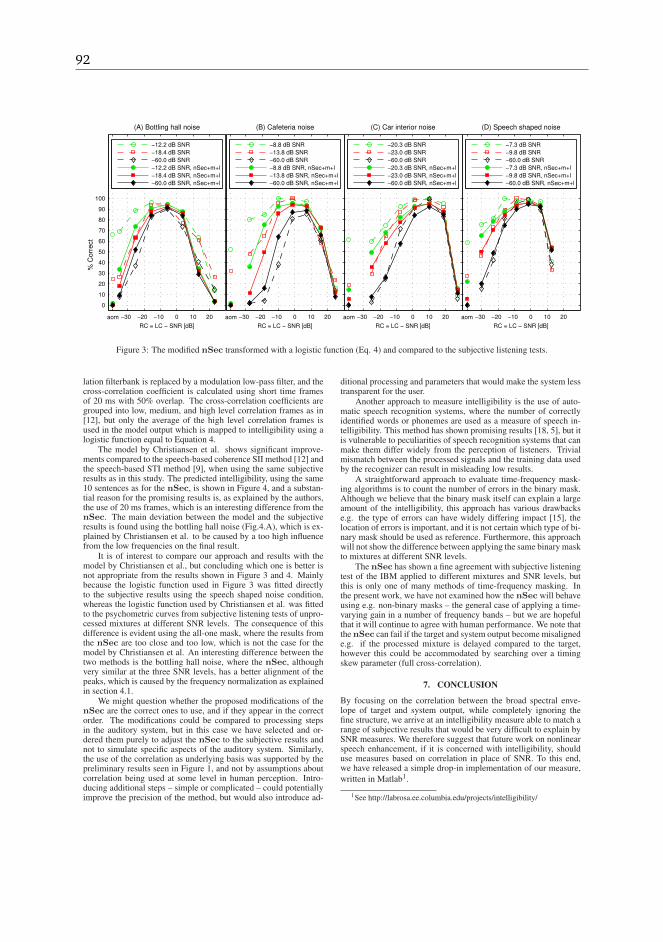
−30 −20 −10 0 10 20
0
10
20
30
40
50
60
70
80
90
100
RC = LC − SNR [dB]
% C
orr
ect
(A) Bottling hall noise
aom
−12.2 dB SNR
−18.4 dB SNR
−60.0 dB SNR
−12.2 dB SNR, nSec+m+l
−18.4 dB SNR, nSec+m+l
−60.0 dB SNR, nSec+m+l
−30 −20 −10 0 10 20
RC = LC − SNR [dB]
(B) Cafeteria noise
aom
−8.8 dB SNR
−13.8 dB SNR
−60.0 dB SNR
−8.8 dB SNR, nSec+m+l
−13.8 dB SNR, nSec+m+l
−60.0 dB SNR, nSec+m+l
−30 −20 −10 0 10 20
RC = LC − SNR [dB]
(C) Car interior noise
aom
−20.3 dB SNR
−23.0 dB SNR
−60.0 dB SNR
−20.3 dB SNR, nSec+m+l
−23.0 dB SNR, nSec+m+l
−60.0 dB SNR, nSec+m+l
−30 −20 −10 0 10 20
RC = LC − SNR [dB]
(D) Speech shaped noise
aom
−7.3 dB SNR
−9.8 dB SNR
−60.0 dB SNR
−7.3 dB SNR, nSec+m+l
−9.8 dB SNR, nSec+m+l
−60.0 dB SNR, nSec+m+l
Figure 3: The modified nSec transformed with a logistic function (Eq. 4) and compared to the subjective listening tests.
lation filterbank is replaced by a modulation low-pass filter, and thecross-correlation coefficient is calculated using short time framesof 20 ms with 50% overlap. The cross-correlation coefficients aregrouped into low, medium, and high level correlation frames as in[12], but only the average of the high level correlation frames isused in the model output which is mapped to intelligibility using alogistic function equal to Equation 4.
The model by Christiansen et al. shows significant improve-ments compared to the speech-based coherence SII method [12] andthe speech-based STI method [9], when using the same subjectiveresults as in this study. The predicted intelligibility, using the same10 sentences as for the nSec, is shown in Figure 4, and a substan-tial reason for the promising results is, as explained by the authors,the use of 20 ms frames, which is an interesting difference from thenSec. The main deviation between the model and the subjectiveresults is found using the bottling hall noise (Fig.4.A), which is ex-plained by Christiansen et al. to be caused by a too high influencefrom the low frequencies on the final result.
It is of interest to compare our approach and results with themodel by Christiansen et al., but concluding which one is better isnot appropriate from the results shown in Figure 3 and 4. Mainlybecause the logistic function used in Figure 3 was fitted directlyto the subjective results using the speech shaped noise condition,whereas the logistic function used by Christiansen et al. was fittedto the psychometric curves from subjective listening tests of unpro-cessed mixtures at different SNR levels. The consequence of thisdifference is evident using the all-one mask, where the results fromthe nSec are too close and too low, which is not the case for themodel by Christiansen et al. An interesting difference between thetwo methods is the bottling hall noise, where the nSec, althoughvery similar at the three SNR levels, has a better alignment of thepeaks, which is caused by the frequency normalization as explainedin section 4.1.
We might question whether the proposed modifications of thenSec are the correct ones to use, and if they appear in the correctorder. The modifications could be compared to processing stepsin the auditory system, but in this case we have selected and or-dered them purely to adjust the nSec to the subjective results andnot to simulate specific aspects of the auditory system. Similarly,the use of the correlation as underlying basis was supported by thepreliminary results seen in Figure 1, and not by assumptions aboutcorrelation being used at some level in human perception. Intro-ducing additional steps – simple or complicated – could potentiallyimprove the precision of the method, but would also introduce ad-
ditional processing and parameters that would make the system lesstransparent for the user.
Another approach to measure intelligibility is the use of auto-matic speech recognition systems, where the number of correctlyidentified words or phonemes are used as a measure of speech in-telligibility. This method has shown promising results [18, 5], but itis vulnerable to peculiarities of speech recognition systems that canmake them differ widely from the perception of listeners. Trivialmismatch between the processed signals and the training data usedby the recognizer can result in misleading low results.
A straightforward approach to evaluate time-frequency mask-ing algorithms is to count the number of errors in the binary mask.Although we believe that the binary mask itself can explain a largeamount of the intelligibility, this approach has various drawbackse.g. the type of errors can have widely differing impact [15], thelocation of errors is important, and it is not certain which type of bi-nary mask should be used as reference. Furthermore, this approachwill not show the difference between applying the same binary maskto mixtures at different SNR levels.
The nSec has shown a fine agreement with subjective listeningtest of the IBM applied to different mixtures and SNR levels, butthis is only one of many methods of time-frequency masking. Inthe present work, we have not examined how the nSec will behaveusing e.g. non-binary masks – the general case of applying a time-varying gain in a number of frequency bands – but we are hopefulthat it will continue to agree with human performance. We note thatthe nSec can fail if the target and system output become misalignede.g. if the processed mixture is delayed compared to the target,however this could be accommodated by searching over a timingskew parameter (full cross-correlation).
7. CONCLUSION
By focusing on the correlation between the broad spectral enve-lope of target and system output, while completely ignoring thefine structure, we arrive at an intelligibility measure able to match arange of subjective results that would be very difficult to explain bySNR measures. We therefore suggest that future work on nonlinearspeech enhancement, if it is concerned with intelligibility, shoulduse measures based on correlation in place of SNR. To this end,we have released a simple drop-in implementation of our measure,
written in Matlab1.
1See http://labrosa.ee.columbia.edu/projects/intelligibility/
92

−30 −20 −10 0 10 20
0
10
20
30
40
50
60
70
80
90
100
RC = LC − SNR [dB]
% C
orr
ect
(A) Bottling hall noise
aom
−12.2 dB SNR
−18.4 dB SNR
−60.0 dB SNR
−12.2 dB SNR − Chr.
−18.4 dB SNR − Chr.
−60.0 dB SNR − Chr.
−30 −20 −10 0 10 20
RC = LC − SNR [dB]
(B) Cafeteria noise
aom
−8.8 dB SNR
−13.8 dB SNR
−60.0 dB SNR
−8.8 dB SNR − Chr.
−13.8 dB SNR − Chr.
−60.0 dB SNR − Chr.
−30 −20 −10 0 10 20
RC = LC − SNR [dB]
(C) Car interior noise
aom
−20.3 dB SNR
−23.0 dB SNR
−60.0 dB SNR
−20.3 dB SNR − Chr.
−23.0 dB SNR − Chr.
−60.0 dB SNR − Chr.
−30 −20 −10 0 10 20
RC = LC − SNR [dB]
(D) Speech shaped noise
aom
−7.3 dB SNR
−9.8 dB SNR
−60.0 dB SNR
−7.3 dB SNR − Chr.
−9.8 dB SNR − Chr.
−60.0 dB SNR − Chr.
Figure 4: The predicted intelligibility using the model by Christiansen et al. [4] compared to the subjective listening test.
Although there are other, existing intelligibility measures thatare able to match subjective data as closely as ours, our measure isconstructed to be as simple as possible, with a consequent benefitsin terms of transparency and diagnosis: when a system performspoorly under this measure, it is relatively easy to look at the pro-cessed envelopes going into the final correlation to see in whichregions they are most different, thereby suggesting where to lookfor improvements. We hope that measures of this kind can help tofocus and promote progress in speech intelligibility enhancementsystems.
REFERENCES
[1] ANSI S3.5-1997. American national standard: Methods forthe calculation of the speech intelligibility index, 1997.
[2] M. Anzalone, L. Calandruccio, K. Doherty, and L. Carney.Determination of the potential benefit of time-frequency gainmanipulation. Ear and Hearing, 27(5):480–492, 2006.
[3] D. S. Brungart, P. S. Chang, B. D. Simpson, and D. Wang.Isolating the energetic component of speech-on-speech mask-ing with ideal time-frequency segregation. 120(6):4007–4018,2006.
[4] C. Christiansen, T. Dau, and M. S. Pedersen. Predictionof speech intelligibility based on an auditory preprocessingmodel. submitted to Speech Communication, —-.
[5] M. Cooke. A glimpsing model of speech perception in noise.119(3):1562–1573, 2006.
[6] M. Cooke, P. Green, L. Josifovski, and A. Vizinho. Robust au-tomatic speech recognition with missing and unreliable acous-tic data. Speech Comm., 34(3):267–285, 2001.
[7] T. Dau, B. Kollmeier, and A. Kohlrausch. Modeling auditoryprocessing of amplitude modulation. I. Modulation detectionand masking with narrowband carriers. 102:2892–2905, 1997.
[8] N. R. French and J. C. Steinberg. Factors governing the intel-ligibility of speech sounds. 19(1):90–119, 1947.
[9] I. Holube and B. Kollmeier. Speech intelligibility predictionin hearing-impaired listeners based on a psychoacousticallymotivated perception model. 100(3):1703–1716, 1996.
[10] Y. Hu and P. C. Loizou. A comparative intelligibility study ofspeech enhancement algorithms. pages IV–561–564, Hawaii,2007.
[11] R. Huber and B. Kollmeier. PEMO-Q - a new method forobjective audio quality assessment using a model of auditoryperception. 14(6):1902–1911, 2006.
[12] J. M. Kates and K. H. Arehart. Coherence and the speechintelligibility index. 117(4 I):2224–2237, 2005.
[13] U. Kjems, J. B. Boldt, M. S. Pedersen, T. Lunner, andD. Wang. Role of mask pattern in intelligibility of idealbinary-masked noisy speech. 126(3):1415–1426, 2009.
[14] N. Li and P. C. Loizou. Effect of spectral resolution on theintelligibility of ideal binary masked speech. 123(4):EL59–EL64, 2008.
[15] N. Li and P. C. Loizou. Factors influencing intelligibility ofideal binary-masked speech: Implications for noise reduction.123(3):1673–1682, 2008.
[16] M. S. Pedersen, D. Wang, J. Larsen, and U. Kjems. Two-microphone separation of speech mixtures. 19(3):475–492,2008.
[17] R. Shannon, F.-G. Zeng, V. Kamath, J. Wygonski, and M. Eke-lid. Speech recognition with primarily temporal cues. Science,270(5234):303–4, 1995.
[18] S. Srinivasan and D. Wang. A model for multitalker speechperception. 124(5):3213–3224, 2008.
[19] H. J. M. Steeneken and T. Houtgast. A physical method formeasuring speech-transmission quality. 67(1):318–326, 1980.
[20] K. Wagener, J. L. Josvassen, and R. Ardenkjaer. Design, op-timization and evaluation of a danish sentence test in noise.International Journal of Audiology, 42(1):10–17, 2003.
[21] D. Wang and G. J. Brown, editors. Computational AuditoryScene Analysis. Wiley & IEEE Press, Hoboken, New Jersey,2006.
[22] D. Wang, U. Kjems, M. S. Pedersen, J. B. Boldt, T. Lunner,and T. Lunner. Speech perception of noise with binary gains.124(4):2303–2307, 2008.
[23] O. Yilmaz and S. Rickard. Blind separation of speech mixturesvia time-frequency masking. 52(7):1830–1847, 2004.
PAPER F 93