Embed Size (px)
Citation preview

Document of
The World Bank
FOR OFFICIAL USE ONLY
A4 v Z9 .C0 -/A.Report No. 7002-IND
STAFF APPRAISAL REPOPT
INDONESIA
FORESTRY INSTITUTIONS AND CONSERVATION PROJECT
February 19, 1988
Country Department VAsia Regional Office
ihis document has a sestrd distibubtio and may be used by redpients only In Ithe performance oftheir official duties. Its contents may not otherwise be disclosed without World Bank authorizaion.
Pub
lic D
iscl
osur
e A
utho
rized
Pub
lic D
iscl
osur
e A
utho
rized
Pub
lic D
iscl
osur
e A
utho
rized
Pub
lic D
iscl
osur
e A
utho
rized
Pub
lic D
iscl
osur
e A
utho
rized
Pub
lic D
iscl
osur
e A
utho
rized
Pub
lic D
iscl
osur
e A
utho
rized
Pub
lic D
iscl
osur
e A
utho
rized
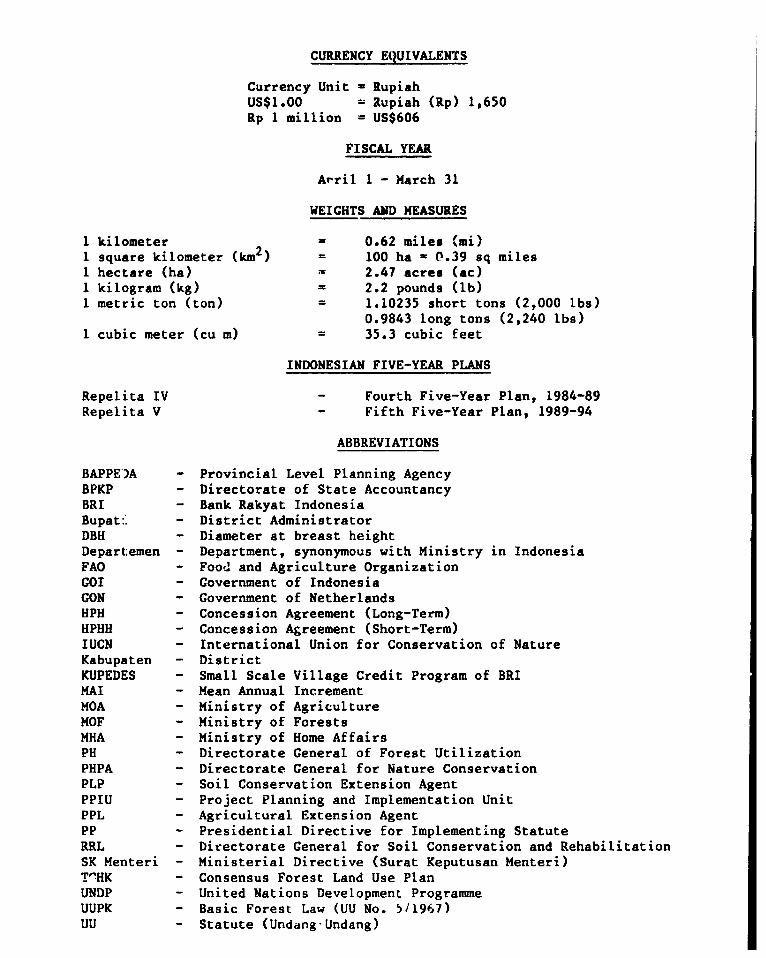
CURRENCY EQUIVALENTS
Currency Unit = RupiahUS$1.00 Rupiah (Rp) 1,650Rp 1 million = US$606
FISCAL YEAR
Arril 1 - March 31
WEIGHTS AND MEASURES
1 kilometer = 0.62 miles (mi)1 square kilometer (km2) 100 ha = 0.39 sq miles1 hectare (ha) 2.47 acres (ac)1 kilogram (kg) = 2.2 pounds (lb)1 metric ton (ton) = 1.10235 short tons (2,000 lbs)
0.9843 long tons (2,240 lbs)1 cubic meter (cu m) 35.3 cubic feet
INDONESIAN FIVE-YEAR PLANS
Repelita IV - Fourth Five-Year Plan, 1984-89Repelita V - Fifth Five-Year Plan, 1989-94
ABBREVIATIONS
BAPPE)A - Provincial Level Planning AgencyBPKP - Directorate of State AccountancyBRI - Bank Rakyat IndonesiaBupat:: - District AdministratorDBH - Diameter at breast heightDepart:emen - Department, synonymous with Ministry in IndonesiaFAO - Food and Agriculture OrganizationGOI - Government of IndonesiaGON - Government of NetherlandsHPH - Concession Agreement (Long-Term)HPHH - Concession Agreement (Short-Term)IUCN - International Union for Conservation of NatureKabupaten - DistrictKUPEDES - Small Scale Village Credit Program of BRIMAI - Mean Annual IncrementMOA - Ministry of AgricultureMOF - Ministry of ForestsMHA - Ministry of Home AffairsPH - Directorate General of Forest UtilizationPHPA - Directorate General for Nature ConservationPLP - Soil Conservation Extension AgentPPIU - Project Planning and Implementation UnitPPL - Agricultural Extension AgentPP - Presidential Directive for Implement-ng StatuteRRL - Directorate General for Soil Conservation and RehabilitationSK Menteri - Ministerial Directive (Surat Keputusan Menteri)T"HK - Consensus Forest Land Use PlanUNDP - United Nations Development ProgrammeUUPK - Basic Forest Law (UU No. 5/1967)UU - Statute (Undang-Undang)
FOR OFFMAL UU ONLY
INDONESIA
FORESTRY INSTITUTIONS AND CONSERVATION PROJECT
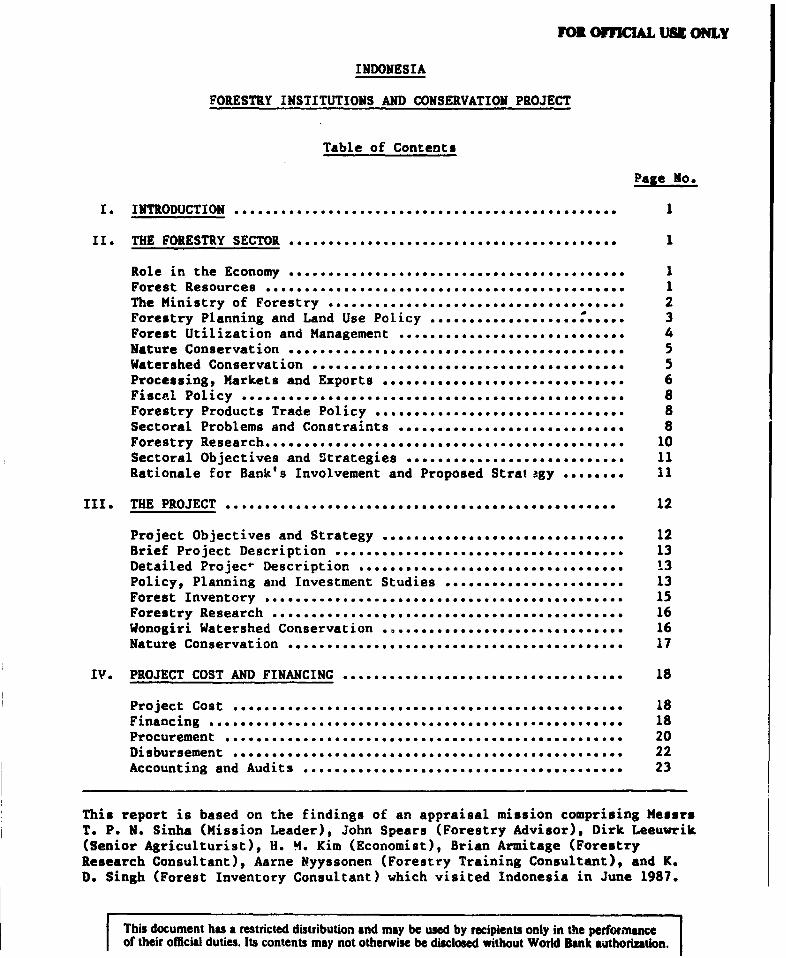
Table of Contents
Page No.
I. INTRODUCTION ..........................se.......*o... 1
II. THE FORESTRY SECTOR ................ 1
Role in the Economy .. I.............. 1Forest Resources . ........... . .. ****.......es 1The Ministry of Forestry . ... .......................... 2Forestry Planning and Land Use Policy ........................ 3Forest Utilization and Management ....... ...................... 4Nature Conservation *.o ............. ... * *.*....... eee.... *o*o** ** 5Watershed Conservation ...... .. .....oo**9.........*...***..**.*.. 5Processing, Markets and Exports ......o. ......................... 6Fiscal Policy ..... 8... ***so ............ 8Forestry Products Trade Policy .. ** ..................... 8Sectoral Problems and Constraints ................ ............. 8Forestry Research ..... ............0..................... ... 10Sectoral Objectives and Strategies ........oo ...................... 11Rationale for Bank's Involvement and Proposed Stralagy ........ 11
III. THE PROJECT . 12
Project Objectives and Strategy ...... ........... 12Brief Project Description .. .... sa........o.....oo........ 13Detailed Projec Description ........ o..*..o..... 13Policy, Planning and Investment Studies .o..... ... . 13Forest Inventory .............. .... 15Forestry Research . 16Wonogiri Watershed Conservation .J.. O..*... .. 0............. 16Nature Conservation ... . . 17
IV. PROJECT COST AND FINANCING . .......... 18
Project Cost .................... se...ea 18Financing e . s....... o9......o ... e.oe.. 18Procurement .. 0...000....0......0. 0..*.O* 20Disbursement o..se.........es............. 22Accounting and Audits .. .. ............................. 23
This report is based on the findings of an appraisal mission comprising MessrsT. P. N. Sinha (Mission Leader), John Spears (Forestry Advisor), Dirk Leeuwrik(Senior Agriculturist), H. M. Kim (Economist), Brian Armitage (ForestryResearch Consultant), Aarne Nyyssonen (Forestry Training Consultant), and K.D. Singh (Forest Inventory Consultant) which visited Indonesia in June 1987.
This document has a restricted distribution and may be used by recipients only in the performanceof their official duties. Its contents may not otherwise be disclosed without World Dank authoriation.
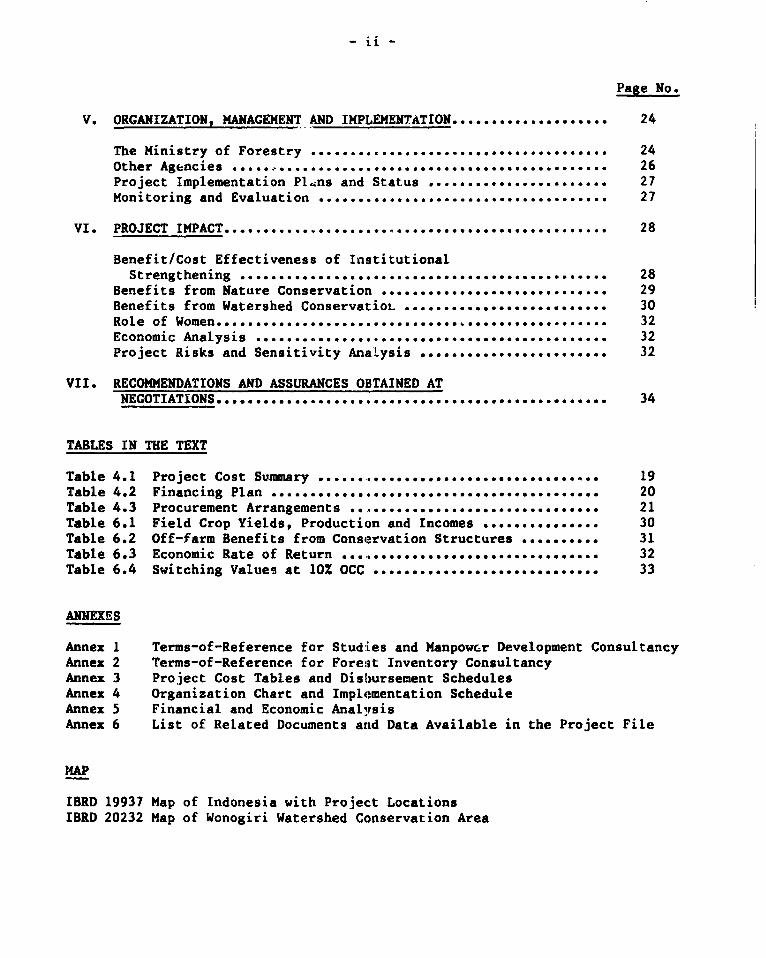
Page No.
V. ORGANIZATION, MANAGEKENT AND IMPLEMENTATION .................... 24
The Ministry of Forestry ............ *.......***************** 24Other Agencies ..... I. ............... ................ 26Project Implementation Plans and Status .... a................. 27Monitoring and Evaluation ........... ....... ...... 27
VI. PROJECT IMPACT .............................. .... 28
Benefit/Cost Effectiveness of InstitutionalStrengthening ........... oe,............. ..................... 28
Benefits from Nature Conservation ......... ***.oo ............. 29Benefits from Watershed Conservatiot ... ...................... 30Role of Women....o..................00...*.*...0....... 32Economic Analysis .... ..... *..**oo******o..o**.o.o ...... 32Project Risks and Sensitivity Analysis ...................... ooo...... 32
VII. RECOMMENDATIONS AND ASSURANCES OBTAINED ATNECOTIATIONS ..o...... o....... o.... ..oeeeo*e*a.e...... ..................... 34
TABLES IN THE TEXT
Table 4.1 Project Cost Suummary *... o..*o*.. .******e.**.*o.o* o.**e* 19Table 4.2 Financing Plan ............. .....ooo.o...o............ 20Table 4.3 Procurement Arrangements o............................ 21Table 6.1 Field Crop Yields, Production and Incomes .......... 4..... 30Table 6.2 Off-farm Benefits from Conservation Structures ... ao....... 31Table 6.3 Economic Rate of Return .. o....oo..o......... ooo........ 32Table 6.4 Switching Values at 10Z OCC ............................. 33
ANNEXES
Annex 1 Terms-of-Reference for Studies and Manpower Development ConsultancyAnnex 2 Terms-of-Reference for Fore:it Inventory ConsultancyAnnex 3 Project Cost Tables and Disbursement SchedulesAnnex 4 Organization Chart and Implementation ScheduleAnnex 5 Financial and Economic AnalysisAnnex 6 List of Related Documents and Data Available in the Project File
MAP
IBRD 19937 Map of Indonesia with Project LocationsIBRD 20232 Map of Wonogiri Watershed Conservation Area

INDONESIA
FORESTRY INSTITUTIONS AND CONSERVATION PROJECT
Loan and Project Sumary
Bortower: Republic of Indonesia
Beneficiaries: The Ministry of Forests and about 50,000 farm families fnCentral Javja.
Loan Amount: US$34 million equivalent.
Temas: Repayable in 20 years, including 5 years of grace, at thestandard variable interest rate.
ProjectDescription: The proposed project would first, strengthen forestry
planning and management by:(a) developing appropriatestrategies for forest management including policies andincentives for sustainable management of natural forest andplantation development where appropriates and for limitingthe more destructive forms of shifting cultivation whileensuring welfare of local people; (b) strengthening forestryresearch through improved planning, management and fundingof adaptive research; (c) strengthening information forsubsectoral planning, through a forest inventory focused onpriority areas for forestry development; (d) improving MOF'smanpower development planning and training capacity; and(e) preparing investment projects consistent withsubsectoral strategy recommendations. Second, it wouldimprove watershed conservation measures in the Upper Solo(Wonogiri) watershed in Central Java, considered to be themost critical watershed in Indonesia because of erosion andhigh population density; this would include rehabilitationof 22,000 ha of terraces and construction of associatedconservation of structures, planting 5,500 ha of communityforests on private lands, establishment of 3,500 ha ofconservation oriented forests on state land, andstrengthening of associated administrative infrastructure inthis watershed. And third, it would strengthen managementof five existing nature conservation areas, including bufferzone development to preclude exploitation by localinhabitants and technical assistance for developing modelsfor nationwide replication to preserve such areas on aviable basis. Economic benefits are expected from: (a)improved forestry management leading to a sustained longer-term production from the forestry sector; (b) improvedinvestment planning leading to more efficient and higherlevels of output and incomes from the sector and better
- ii -
sustenance of the natural environment; and (c) improved soilconservation leading to increased agricultural production,longe; dam life and lower irrigation O&M costs inWonogiri. Watershed conservation activities will have anEPR of about 22%. The main project risks would beimplementation delays due to counterpart budgetconstraints. This risk would be reduced by seeking GOIagreement on detailed counterpart funding. Another riskscould be delays in hiring of consultants and in in'ilementingrecommendations of strategy studies. The risk would bereduced by agreeing with GOI on study TORs at appraisal,hiring consultants for major studies before loaneffectiveness, involving GOI fully in carrying out thestudy, and linking future Bank assistance to satisfactoryimplementation of study recommendations.
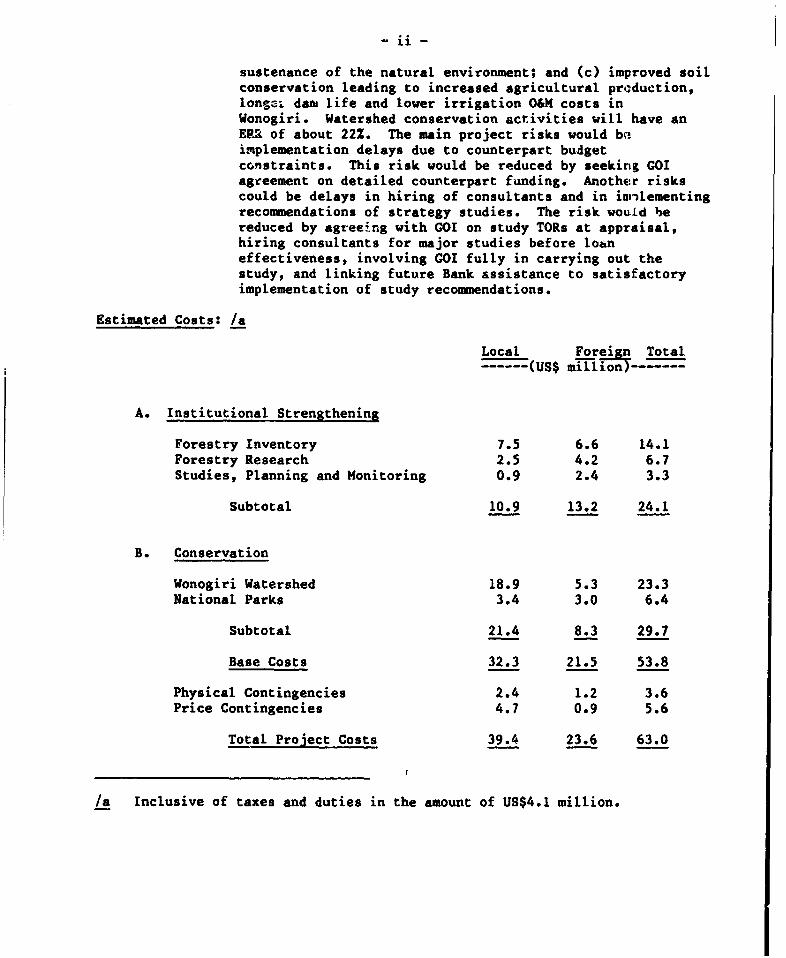
Estimated Costs: /a
Local Foreign Total------(US$ million
A. Institutional Strengthening
Forestry Inventory 7.5 6.6 14.1Forestry Research 2.5 4.2 6.7Studies, Planning and Monitoring 0.9 2.4 3.3
Subtotal 10.9 13.2 24.1
B. Conservation
Wonogiri Watershed 18.9 5.3 23.3National Parks 3.4 3.0 6.4
Subtotal 21.4 8.3 29.7
Base Costs 32.3 21.5 53.8
Physical Contingencies 2.4 1.2 3.6Price Contingencies 4.7 0.9 5.6
Total Project Costs 39.4 23.6 63.0
/a Inclusive of taxes and duties in the amount of US$4.1 million.
- ih -
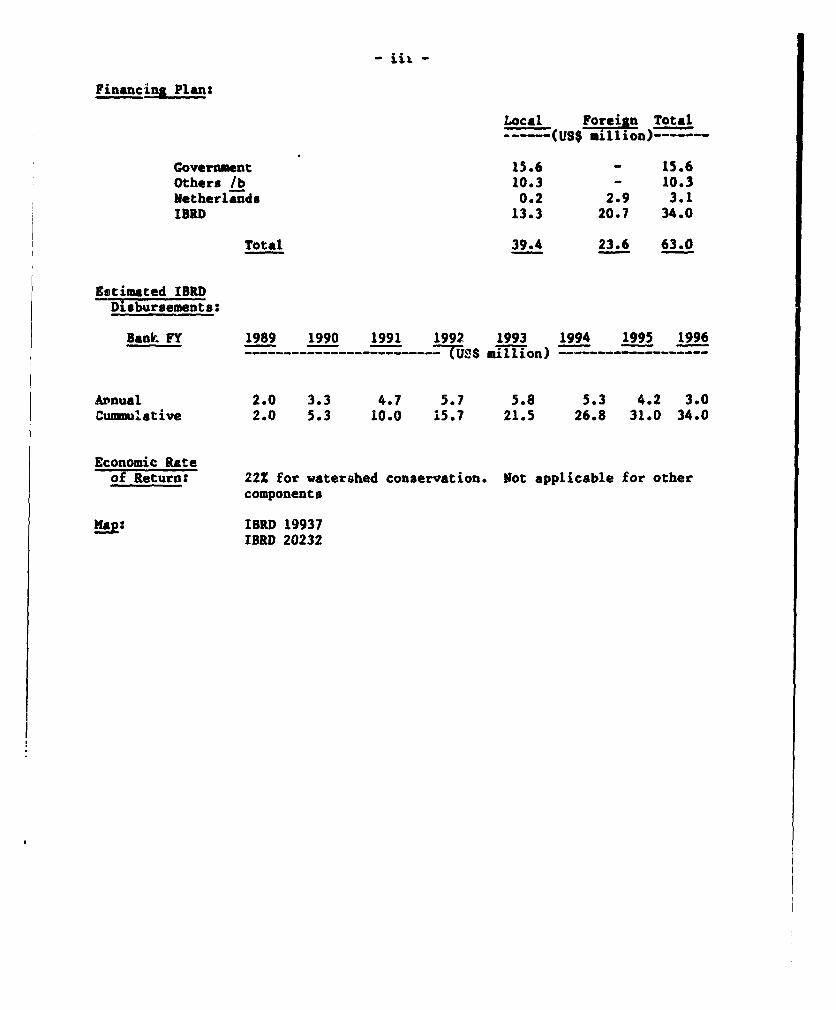
Financing Plan:
Local Foreign Total~- -(11( mlillion)------
Government 15.6 - 15.6Others /b 10.3 - 10.3Netherlanda 0.2 2.9 3.1IBRD 13.3 20.7 34.0
Total 39.4 23.6 63.0
Estimated IBRDDisbursements:
Bank FY 1989 1990 1991 1992 1993 1994 1995 1996-- ------- $ million) …----- - --
Aznual 2.0 3.3 4.7 5.7 5.8 5.3 4.2 3.0Cummulative 2.0 5.3 10.0 15.7 21.5 26.8 31.0 34.0
Economic Rateof Return: 22% for watershed conservation. Not applicable for other
components
IBRD 19937IBRD 20232

INDONESIA
FORESTRY INSTITUTIONS AND CONSERVATION PROJECT
I. INTRODUCTION
1.1 This report apprAises the proposed Forestry Institutions andConservation Project in Tndonesia. This is the first project proposed forWorld Bank financing in Indonesia's forestry sector, and was prepared by theMinistry of Forests (MOF) with substantial assistance from FAO. Projectpreparation was completed in May 1987, and the project was appraised in June1987. This report summarizes the findings and conclusions of the appraisalmission.
II. THE FORESTRY SECTOR
Role in the Economy
2.1 Indonesia is well endowed with forest resources which cover morethan half of its land area, and constitute the world's second largest area oftropical forests after the Amazons. Forestry activities account for less than3% of GDP in current prices and employ some 0.5 million persons, but thesector is much more important in export trade where it contributes over 20% ofnon-oil exports and is currently the most important source of such exports.Forest products provide most of rural energy consumption through firewood andcharcoal, and housing construction material. Indonesian forests are alsoimportant ecologically, constituting one of the world's most biologicallydiverse areas with more than 500 species of mammals, 1,500 species of birds,and 10,000 species of trees. These forests play a significant role inprotecting Indonesia's watersheds, preventing soil erosion and ensuring asustained flow of irrigation and drinking water for downstream population.
Forest Resources
2.2 Size. Indonesia's forest area is variously estimated at between 100and 144 million ha, with FAO ectimate at 113 million ha. Precise resourcedata is not available and this is one of the most significant constraintspreventing proper development planning and management of the sector. Improvedresource assessment is an important objective of the proposed project.
2.3 Natural Forests. Indonesian forests have been classified into sixmajor forest types, of which the tropical rain forest is the most significant,covering three quarters of the forest area. This consists mainly of timberspecies of the Diptocarpaceae family, in particular Siorea (Meranti),Dipterocarpus (Keruing), Hopea (Merawan) and Dryobala.iops (Kapur). Theseforests, particularly in western parts of the indonesian archipelago, are richin commercial species which average 50 to 90 m per ha, st diameter (DBH)above 50 cm, out of a total volume of about 260 to 300 m per ha for allspecies. The average annual growth in the voluTe of commercial species innatural forests is currently estimated at 1.1 m per ha. Indonesia's natural

- 2 -
forests are subdivided into four usage/conservation categories (para. 2.7), ofwhich the production forests account for about 44%. These for¶sts have thepotential, if properly managed, to produce 25 to 50 million m p.a. on asustainable basis, and to support US$2 to 4 billion p.a. in exports Howeverthis considerable resource and export potential is threatened because ofseveral sectoral problems (para. 2.20).
2.4 Plantations. Indonesia has a long history of forest plantationswhich were started in the 19th century. Currently the total area ofplantations is estimated at around 1.8 million ha, about half of which ismainly teak. The next most important species planted is -;.he indigenous Pinusmerkusii, which covets 600,000 ha. Other planted species include Gmelinaarborea (with disappointing results, but warranting further research andtrials), various Eucalyptus such as E.deglupta, and Acacia mangium. They aresuitable for pulpwood, and with some work on tree improvement they couldperhaps produce rough lumber and plywood veneer logs for plywood cores. Thetropical pines, mainly P.caribaea and P.oocarpa, do not appear to have beentried in comprehensive provenance trials in Indonesia. Apart from their valuefor pulpwood, these species can produce good lumber and veneer logs.
2.5 Location. Over 95% of Indonesian forests are in the sparselypopulated Outer Islands, with the islands of Kalimantan, Irian Jaya andSumatra accounting for most (over 80%) of the forest area. Production forestsin Kalimantan and Sumatra are the richest in commercial hardwood species, andthey account for over 75% of Indonesia's production potential for logs ofcommercial spacies.
The Min£itry of Forestry (MOF)
2.6 The Indonesian Constitution (Chapter 14, Article 13) gives to theState the authority to control land and natural riches for the welfare of allIndonesians. Based on this authority and directive, the Basic Forestry Law(UUPK) of 1967 gave the authority over Indonesian forests to the Ministry ofAgriculture and Forests. In 1983, the Ministry was split and a separateMinistry of Forests was formed with the authority to plan and manageIndonesia's forestry sector. The Ministry has three Directorates-Generalresponsible for forest utilization, forest rehabilitation and soilconservation, and nature conservation (Annex 4). It also has support agenciesfor research and inventory, and a Secretariat-General responsible forplanning, budgeting and manpower development. MOF employs about 17,000persons, most (6UZ) of whom are in the Directorate-General for Reforestationand Land Rehabilitation. The responsibilities and staff of MOF have increasedrapidly, and there is a need to stren,then their capacity by establishingappropriate policies and procedures for forest management, by strengtheningits information, planning and monitoring capacity, and by the development ofits manpower. The strengthening of institutional capacity is an essentialpre-requisite before MOF can assist in the efficient management of investmwatsin this sector. Development of an efficient training program is hindered bythe lack of a manpower development plan. The proposed project will assist inpreparing such a plan (para. 3.6). Forestry staff deployment also needs to beimproved by stationing more staff near forest areas, and the proposed projectwill assist by providing appropriate infrastructure (para. 3.15).

- 3-
Forestry Planning and Land Use Policy
2.7 The Basic Forestry Law (UUPK) of 1967 recognizes that Indonesianforests play several important roles, including production of logs and othersecondary forest products, protecting watersheds, conserving biologicaldiversity of flora and fauna, and conserving land which is to be later usedfor agricultural production. It directs the Central Government to plan,cla4sify and manage forest lands accordingly. To implement the Law, aPresidential Implementation Directive (PP No. 33/1970) on forestry planningwas t sued in 1970 vesting the authority for preparing forestry land use planswith che Forestry Minister. On the basis of this, MOF has prepared a-.onsensus Forest Land Use Plan (TGHK) for each province, classifying forestlands into the following four categories:
(a) protection forest, which accounts for 30 m ha (211 of forest lands),has been set aside for the protection of critical watersheds, and toprevent soil erosion logging is not permitted in these forests;
(b) conservation forest, which accounts for 19 m ha (13%), has been setaside to protect biological diversity of flora and fauna, and inthese areas also logging or hunting is nit permitted;
(c) production forest, which accounts for 64 m ha (44X), has beenallocated for forestry production and the major portion (over 53million ha) of this is under forestry concession arrangements (para2.9), managed typically by the private sector under MOF regulationsand supervision; and
(d) conversion forest accounting for 31 m ha (22%) has been allocatedfor agricultural production, and accordingly in these areas clearfelling of trees and conversion to agricultural usage is permitted.
2.8 Though the forestry land use policy is sound in that it recognizesthe multiple role of forest lands, including conservation and protection needsfor which one-quarter of Indonesia's land area (a third of the forest area)has been set aside, the implementation of this policy and resulting TGHKforestry land use plans need to be improved. The TGHK plan was prepared byconsensus between Provincial Agriculture, Forestry, Lands (Agraria), PublicWorks, Planning (BAPPEDA) and Transmigration rg.acies, but was based onout-dated maps and poor forestry and land resource information. Consequently,some areas suitable for agricultural and forestry production purposes havebeen put under the very restrictive protection/conservation classification,whereas other areas that need to be protected have been put under lessrestrictive classification. There is an urgent need to improve forestresource information to provide a firmer basis for forest land use planning.While soil survey for the Sumatra Island is being done under an ADB-assistedLand Resource Evaluation and Planning Project and base maps with land systeminformation are being produced under the Bank-assisted Transmigration VProject (Loan 2578-IND), there is still a need to improve information aboutthe standing volume of commercial species and forest productivity informationto provide the basis for forest land use planning. The proposed project will

- 4 -
assist in collection and interpretation of such information for forestryplanning.
Forest Utilization and Management
2.9 The utilization of production forests increased rapidly between 1968and 1979, and log production increased from a level of 5.2 million cu m to25.3 million cu m, at the rate of 15Z p.a. Since then 'og production hasfluctuated in the 13 to 26 million cu m range in response to export demand andtrade policy (para 2.16). The forests also produce a range of secondaryforest products including rattan, fuel, wood/charcoal, silk, turpentine andresins. Of tihese rattan is commercially the most significant with aproduction of about 40,000 tons in 1985.
2.10 While all forest lands are owned by the State, the extraction,processing and sale of logs from the forests is done mainly by the privatesector under forest concession arrangements. These concessions are of twotypes. One, Hak Pengusahaan Hutan (HPH), is granted by MOF for a minimum areaof 35,000 ha and a max1immu period of 20 years. Tre other, Hak PemungutanHasil Hutan (HPHH), is granted by the Provincial Covernment for a maximum areaoi 100 ha and a period of two years. HPHH concessions are not of economicsize for any significant investment in log extraction and play a minor role inforest production (less than 1OZ) and management. Forestry concessions underHPH are more important and these cover 83Z of production forest area (53million ha) with an average a-ca of about 100,000 ha per concession. Theconcession agreement obliges the concessionaire to:
(a) conduct a forest resource survey and a feasibility study for theextraction of logs and processing activities (if any);
(b) implement measures for forest protection;
(c) respect rights of indigeneous tribal population for collection offorest products for their own consumption;
(d) prepare annual operational plans, along with five year and 20 yearmanagement plans that are acceptable to GCO;
(e) follow MOF guidelines for log extraction, which in line with MOFDecree of 1981 specify a 35 year rotat:ion period in natural forests,extraction of trees with minimum diameter (DBH) of 50 cm, leavingbehind at least 25 trees per ha of commercial species with DBH morethan 20 cm to act as seed trees for natural regeneration;
(f) restock forest through enrichment planting of commercial speciesafter logging;
(g) mark boundaries and develop suitable forest roads; and
(h) post a performance bond to guarantee compliance.

2.11 While the concession agreement does oblige the concessionaire tofollow environmentally sound logging methods for the sustainable developmentof Indonesian production forests, in practice the implementation of forestmanagement policy and the compliance with concession agreements have beenpoor. The concessionaires generally do comply with minimum diameterrestrictions, but they are less careful in their logging methods, which resultin substantial damage to the remaining forest. The proposed project willprovide technical assistance for recommending appropriate techniques andincentives for improving logging.
Nature Conservation
2.12 Though Indonesia has classified a third of its forest area, some49 m ha, as protection and conservation forest, these areas are coming underpopulation pressure. In some cases the biological diversity of Indonesia'sforests is also being threatened by uncontrolled and ill planned development,The construction of new roads is bringing larger areas of the previouslyinaccessible forest within reach of settlers. Consequently, settlers areincreasing'-y encroaching on conservation areas. Even where adequate legalinstruments exist for the control of encroachment, they are either notenforced or only partially applied since they conflict with local or tradi-tional customs. These problems could result in irreparable losses to bothIndonesia and the world community at large. Since sanctions have notprevented encroachment, new approaches are required to protect conservationareas, by promoting development and directing it in an environmentally soundmanner. To do this PHPA needs to strengthen its relationship and services tothe population in areas around the nature conservation areas, for instance bycreating buffer zones for the benefit of the local population. This willcreate incentives for them to prevent encroachment by outsiders. PHPA shouldalso cooperate with local and international scientists to monitor and studyrare and endangered species in these areas, e.g. Komodo lizard in NTT, Balistarling in Bali Barat, and Orang Utan, Sumatran tiger, and rhino in Sumatra,So that it is better able to respond to any emerging problems threateningtheir survival. For creating greater awareness, appreciation and support fornature conservation in Indonesia, PHPA should strengthen its services andfacilities for local tourists at those national parks that are close topopulation centers in Java and Bali. Management plans for these activitieshave now been developed for the highest priority areas with help fromFAO/IUCN, and support for their implementation is proposed under theproject. The Bank will also be reviewing other options and the level offunding for conservation as a part of its economic and sector work.
Watershed Conservation
2.13 Owing to population pressure, deforest-tion and increasedcultivation of annual crops on steep slopes, Indonesia is increasingly facingproblems of soil erosion, loss of productivity of agricultural land, siltationof river basins and dams, flooding, and consequent environmental and economicdegradation. The problem is most severe in Java, but is also accelerating inthe Outer Islands. GOI with UNDP assistance has identified 81 watersheds ofwhich 36 are considered priority areas, and of these 22 are considered to bein a highly critical condition. The conservation of watersheds posesdifficult problems. It is difficult to resettle population from the criticalstopes. The range of agro-forestry activities that can be done on the slopes,
-6-
which are financially viable and ecologically appropriate, are limited andhave to be developed through location-specific adaptive research. Whileappropriate recommendations have been developed for several areas in Java,further research in Outer Islands will be required. Support for agriculturalactivities in several of these watersheds has been provided by USAID and theBank, in particular under the Upland Agricultural Development Project(Loan 2474-IND). Experience with these activities have shown the' importanceof inter-agency co-ordination, strengthening technical support and involvingfarmers in decision making. The proposed project will provide assistance forimproving inter-agency co-ordination (para 5.10), strengthening technicalsupport (para 5.8), and for implementing participatory planning of watershedareas invoLving the participation of both the farmer and the technicalspecialist (para 3.12). The technical support for soil conservationactivities is currently provided by MOF, and the technical support foragricultural activities by the Ministry of Agriculture (MOA). The Bank-financed National Agricultural Extension II Project (CR 96$-IND) has alreadystrengthened technical support for agricultural activities in many of thecritical wvtershed areas, and the proposed project will strengthen the supportfor soil conservation and watershed conservation activities in the Wonogiriwatershed in Cenitral Java, an area which is considered the most criticalwatershed in Indonesia.
Processing, Markets and Exports
2.14 Wood Processing. Indonesia's wood processing industry is dominatedb sawmilling and plywood industries, which together produce about 12 millionm" p.a. of processed wood products, with sawmills producing about 7 million mp.a. The main problem in the sawmilling industry is the low economicviability of some mills (30 to 40Z of the total) that are running at below 50%capacity utilization due to a variety of reasons including management,location, and the type of machinery in the mills. It is expected thatcompetition would force less efficient mills to close, while efficient millswill continue to add c¶pacity. Indonesia's plywood industry with a productionlevel of 5.0 million m p.a. is more efficient and has good (80%) capacityutilization. Partly due to the rapid increase in production and exports andalso market recession, the export price for hardwood plywood was depressed andthis war affecting industry profitability. Since Indonesia now accounts for50 to 70% of the hardwood plywood export market, and the price elasticities ofdemand and supply are typically between 0.3 and 0.7 (absolute values),Indonesian manufacturers are finding it advantageous to limit export volumesto support prices and profitability. GOI is now not permitting additions ofnew plywood manufacturing capacity. Pr ces have consequently improved andindustry profits are improving. The plywood induutry also faces a shortage ofqualified t.echnicians, and has pragmatically employed expatriates to overcomethe shortage. This has helped in maintaining good quality and capacityutilization. An ongoing Wood Industry Study financed under the Bank-supportedBapindo V Project (Loan 2277-IND) is helping GOI identify key constraints inthe industry. The main recommendations are that: (a) forest concessions andprimary industries should function as integrated units until an efficient wooddistribution system is developed; (b) improving efficiency and capacityutilization of the existing industries should be stressed before new capacityis added; (c) secondary industry need not be integrated with forest
- 7 -
concessions and should be in locations nearer market; and (d) information andlog distribution should be improved. The consultaats are now helping GOIdevelop proposals for implementing these recommendations.
2.15 Pulp and Paper Industry. Indonesia currently has 32 pulp and papermills with an installed production capacity of about 0.9 million tons forpaper and 0.4 million tons for pulp. Between 1980-85, the growth in capacitywas dramatic for both paper (25Z p.a.) and puip (33% p.a.). Consequentlypaper capacity is in excess of demand (0.7 million tons) and capacity utiliza-tion is low for paper (but not pulp). The considerable excess capacity haskept paper prices low and inefficient producers are going out of business (sixsince 1984). In planning future investments in forest plantations forsupplying the pulp and paper industry, MOF must be careful to support onlythose plantations that are within marketable distance of efficient pulp andpaper mills, to avoid the risk of having plantations for which the main marketoutlet disappears after the trees have matured. Any feasibility study forplantation investments must analyze market prospects, including prospects forany pulp and paper mills that would purchase logs from the proposedplantation.
2.16 Exporc Markets. Indonpsia has emerged as the world's biggestexporter of processed tropical hardwoods, and in 1986 its exports reached alevel of about US$1.7 biliion. The growth in exports has been rapid (30%p.a.), and has been fueled mainly by the expansion of plywood exports, whichnow forms two-thirds of Indonesia's wood product exports. The main marketsfor Indonesian plywoods are USA, China/Hongkong, and Europe/Middle East, eachof which account for about a quarter of Indonesia's exports (includingre-exports through Singapore). Japan, though a potentially large market,currently accounts for only about 10 of exports, due to tariff barriers of17.5 to 20%. EEC employs tariff quotas. Other countries (Korea, Taiwan andAustralia) have tariff rates ranging between 25-31%, but these are lessimpo.tant because of much smaller size of their Local markets. For thefuture, it is expected that growth of wood product exports will be 3 to 4%p.a. in overall volume, though some segments such as furniture which are smallcurrently may show growth rates in excess of 10% p.a. The future exportmarketing strategy of Indonesia should emphasize increasing export valuethrough increases in local value added and quality improvemrients.
2.17 Local Market. Prior to 1980 the processed wood products went mainlyto local markets, which accounted for over 75% of total production. Sincethen local consumption has increased at about 5% p.a., in line with tLaegeneral growth in local incomes, but the share of local consumption hasdropped below 50% owing to the mucn more rapid growth in exports. Thestructure of local demand is the opposite of export demand, and is mainly forsawnwood, which accounts for about 80% of the total demand for processed woodproducts. This is typical of the pattern in lower to middle incomecountries. In the next decade local consumption of sawnwood is expected toincrease by 2 to 4% p.a., and of plywood by 3 to 6% p.a.

-8-
Fiscal Policy
2.18 The level of tax collections from the forestsy sector is low, andhas declined from a nominal level of about US$20 per m of log production in19P0 to a level of US$ 10 per m in 1984. The decline in real terms isgreater. The low level of taxes gives inadequate compensation to theGovernment for the depletion of its valuable natural forest resources. Bypricing wood cheaply it also does nct give sutficient incentive to improve theefficiency of utilization of wocd and wood waste. Preliminary analysis showst at the wood industry could withstand a doubling of tax level to tlS$20 perm , though there is some concern that increasing taxes could affect incentivesin this export oriented industry. This issue has been discussed with GOI, andMOF has formed a high level committee to review the level of forestry taxesand fees. The Wood Industry Study has also recommended a review of forestrysector taxes and fees. The proposed project will provide technical assistancefor reviewing fiscal policy in the forestry sector.
Forestry Products Trade Policy
2.19 Indonesia's trade policy for forestry products has been dominated byuccessive bans on the export of primary products such as hardwood logs andrattan. Starting in 1980, GOI started restricting log exports to encouragelocal processing and employment creation, and by 1985 log exports were totallybanned. This decision has been controversial. On the one hand, log exportban has been criticized for reductions in log pr3duction from a level of about25 million m in 1980 to a level of 13 million m , two years later, and acorresponding reduction in export revenues. Others have pointed out that thedrop was temporary, and that with the development of a relatively efficientand export oriented plywood industry, log production and forestry sectorexports have recovered to former levels. Similarly, some have welcomed thetemporary reduction in logging due to log export ban as an environmentallysound policy because of a concern about forestry resource depletion(para 2.20). Forestry products trade policy will be reviewed under project-sponsored forestry strategy studies.
Sectoral Problems and Constraints
2.20 Forest Resource Depletion. While Indonesian forests are large,there is a growing concern that the forestry resources are being depleted at arapid pace of about one million ha (1%) per annum. While the forests arecurrently providing 25 million m3 p.a. and generating annual rent of US$750million and exports of US$1.7 billion, at the current rate of depletion thisincome stream will be exhausted in about 40 years. In addition to the loss oftimber, the loss of forest area also poses serious environmental problembecause of irreversible loss of the rich genetic diversity of Indonesianforests, the erosion of soil, and siltation of dams and waterways. Some ofthe contributing factors are discussed below.
2.21 Logging Damage. Studies have shown that about 10 to 50X of theremaining stand after logging is damaged due to careless logging practices,and the loss of productive forest area is estimated at about 0.1 million hap.a. The proposed project will help develop guidelines and incentives for

improved logging prectices (para. 3.4), and would intensify forestry researchfor developing improved techniques for the regeneration of logged-over forests(para. 3.10).
2.22 Shifting Cultivation. While traditional forms of shiftingcultivation, with rotations of over 20 years, are environmentally sound andsustainable, the shorter rotation shifting cultivation is not. Because ofpopulation increase in the Outer Islands of Indonesia, where most of theforests are located, shorter rotation shifting cultivation is increasinglyleading to degradation of forest lands into low fertility grass lands(alang-alang). The forest area lost due to shifting cultivation is estimatedbetween 0.3 and 0.5 million ha p.a. The proposed project will assist indeveloping guidelines and action program for reduction in damage due toshifting cultivation (para. 3.5).
2.23 Conversion to Agricultural Usage. GOI has had an ambitioustransmigration program under which half a million families migrated to theOuter Islands during the previous plan period (1980-84), and settled on2.5 million ha of forest land. Similarly, other agricultural developmentprograms, such as the tree crop NES programs, have also led to the clearing ofup to 100,000 ha of forest land p.a. for agricultural usage. Recently, GOIhas slowed down these programs due to budget constraints. Still, it isexpected that conversion to agricultural usage will take up between 0.2 and0.5 million ha of forest land p.a. While conversion to agricultural usage isto some degree inevitable in the face of increasing population and demand forfood and agricultural commodities, such conversion needs to be well planned toensure that it does minimal damage to the environment. For instance, criticalwetlands which act as breeding grounds for large numbers of species of fishand migratory birds need to be protected, and agricultural development shouldbe carried out in other areas. In addition, agricultural development strategyshould put less emphasis on increasing production through increases in area,and more on increasing production by making better use of existingagricultural areas through their intensified development and increases inyield per unit area. This, for instance, is being done under the Banksupported Fisheries Support Services Project (Loan 2773-IND) which willincrease shrimp proauction by increasing yields from existing ponds ratherthan increase the area of shrimp ponds by converting critical wetlands. Underthe fisheries project some support is also being provided to the Ministry ofPopulation and Environment for developing agricultural development strategiesthat will be less destructive of the environment. Similarly, under GOI'sTransmigration Program, there is greater need to emphasize increasingproductivity of existing areas (second stage development) and to putrelatively less emphas.s on creating new settlements. The Bank is supportingsuch an approach through assistance for the preparation of the proposedTransmigration VI Project, which will concentrate on second stage developmentof existing transmigration areas. Yields from forest plantations also need tobe increased so that there is less pressure for logging of natural forests.The proposed project will intensify forestry research for improving woodplantation yields (para. 3.10). Forestry resource survey will also need to bestrengthened to improve decisions on the location of future agricultural andforestry investments, and the proposed project will provide such assistance(para. 3.8)
- 10 -
2.24 Forest Fires. Because of increasing population near forests,inappropriate forms of shifting cultivation, and also natural causes, forestfires are increasing. Generally these fires do not spread far because ofhumid conditions in tropical rain forests. But, in some years, unusually dryconditions do cause extensive damage, as was the case in 1983/84 when about3.5 million ha of forests in East Kalimantan were destroyed. In some areas,the forest fires are deliberately started by encroachers to convert forestland to grass lands for cattle grazing. Estimates of forest area lost rangebetween 0.1 and 0.2 million ha p.a. The encroachers are quite often broughtinto the forests by ill planned roads. COI has now issued a decree whichrequires environmental impact studies of proposed development projects, andthe Ministry of Population and Environment is reviewing such studies.
2.25 Encroachment and Poaching in Nature Conservation Areas. While GOIhas designated some 19 m ha to conserve the biological diversity of flora andfauna (para. 2.7.), and has laws and directives to protect endangered speciesin thase areas, the implementation of these directives and laws needs to bestrengthened. GOI staff responsible for protecting nature conservation areasoften live far from such areas, and are poorly trained for such activities.While the international community has been interested in the conservation ofnature in Indonesia, its assistance has often taken the form of supplyingexperts. This has helped in producing a large number of useful studies,research reports, and management plans for nature conservation areas, butquite often these plans have not been implemented because of the problemsnoted above. The proposed project will fill this critical implementation gapby improving staff deployment, staff training and supervision (para. 3.15).
2.26 Forestry Research. Prior to 1983, forestry research was done mainlyby the Ministry of Agriculture and Forests, and suffered because of the higherpriority given to rice research. Consequently, annual funding for forestryresearch has been less than $2 million (0.2% of exports), one of the lowestlevels in the Asia-Pacific Region. The research is currently centralized atBogor in Java, and does not focus on basic technical issues concerningforestry management problems of the Outer Islands where most Indonesianforests are located. Therefore the current level of understanding about thedevelopment and regeneration of tropical rain forests in Indonesia is poor,andthis hampers the ability of the forestry research service to offer effectiveadvice on techniques to support sustainable management of Indonesia'sforests. Furthermore, with increasing population pressures in the OuterIslands and the inevitable reduction in production forest area, Indonesia willhave to supply larger quantities of wood from a smaller forest area. This mayeventually require the establishment of higher-yielding forest plantations inthe Outer Islands. To support this, forestry research must expand adaptivetrials for the screening of exotic speries. This would include fertilizertrials, end use tests, and the measurement of yield, establishment cost, andpest/disease vulnerability. Another priority area for research is theregeneration and growth of natural forest under alternative logging andmanagement regimes. This would include measurement of regeneration on siteswith varying intensity of logging, levels of mechanization in logging andskidding, and post-logging silvicultural practices. This will allow researchto advise the forestry service and concession holders on cost-effectivepolicies and techniques for the management of Indonesian forests, keeping in
- 11 -
mind financial, economic, ecological and anthropological concerns. Researchin these priority areas is constrained by a shortage of adequately trainedmanpower, research funds and facilities in most Outer Islands other thanKalimantan. The proposed project would assist in alleviating theseconstraints. (para 3.10).
Sectoral Objectives and Strategies
2.27 In line with its broader economic development objectives, GOI'sobjectives in the forestry sector are to:
(a) improve the management of natural forests and plantations to sustaintheir productivity for the future;
(b) increase nonoil export revenues through increased exports offorestry products;
(c) improve the supply of industrial raw material and forestry productsfor local industry and local consumption;
(d) conserve watersheds to ensure uninterrupted flow of water forirrigation and urban consumption; and
(e) protect and conserve wildlife, genetic resources in natural forests,and scenic and recreation areas.
Within the framework of the objectives and the national five-year developmentplans (Repelita), MOF has formulated a number of programs and performancetargets in priority areas. The most important of these programs involveforest inventory, nature conservation, watershed protection, plantationestablishment, research, training and administration development, for whichthe proposed project will provide support.
Rationale for Bank's Involvement and Proposed Strategy
2.28 A strong forestry sector is important to the Indonesian economybecause of its role in export earnings and environmental protection. TheBank's agriculture and rural development strategy had to date largelyconcentrated on irrigation, tree crops and transmigration activities.Involvement in these a_:ivities has clearly revealed their sensitiveinter-relationships with the forestry sector, and the need to address theserious planning, management, nature conservation and watershed protectionproblems of the forestry sector. Nature conservation, in particular, isbecoming a global issue, because Indonesian forests contain a significant partof the world's biological resources, and their biological diversity isthreatened by developmental pressures. Therefore, the Bank has adopted anassistance strategy which includes:
(a) strengthening nature conservation efforts by improving MOFimplementation capacity through improved deployment of staff, bettersupervision and practical training;
- 12 -
(b) supporting watershed conservation efforts by developing andimplementing production techniques which are consistent withenvironmental requirements, and which, at the same time, promote thewelfare of poor rural farmers who, because of their poverty, areforced to encroach on critical watersheds;
(c) supporting policy improvements by strengthening GOI's policyformulation efforts;
(d) improving the sector information base, so that policy choices aremade on the basis of sound information, and sectoral changes arem_nitored and revealed in a timely fashion;
(e. developing improved and locally adapted techniques for themanagement of forests and forestry investments in Indonesia bystrengthening forestry research;
(f) improving the quality of investment planning effort so that thesectoral investments bring the intended benefits;
(g) improving policy and investment implementation capacity throughimproved manpower development; and
(h) as sectoral policies, investment planning and implementationcapacities improve, the Bank's assistance strategy will begin toemphasize funding of larger sectoral investment programs forincreasing forest production, improving sawmilling, improving wooddistribution, and increasing the local value added in the woodprocessing sector.
III. THE PROJECT
Project Objectives and Strategy
3.1 The primary objective of this first Bank-assisted forestry projectwould be to strengthen planning, management and conservation efforts in thissector for maximizing long-term contributions from forest resources for thewelfare of the Indonesian people. Strategies to achieve those objectiveswould include: (a) improving sectoral planning and management through studiesfocussed on policies for improved forest management, while ensuring thewelfare of local people who derive their sustenance from the forests; (b)strengthening sectoral information to provide an improved basis forformulating sectoral plans; (c) improved planning and management of adaptiveforestry research in the OuLer Islands to improve productivity of naturalforests and plantations; and (d) 3trengthening of MOF's capacity for manpowerdevelopment planning and implementation. Critical conservation needs would beaddressed, particularly in catchment areas at greatest risk in Java, wheresuitable technical packages have been developed and tested and where themajority of the population is in the poverty group. Implementation of natureconservation plans will be strengthened in areas which are particularlyimportant from species diversity point of view, and are particularlythreatened because of proximity to densely populated areas.

- 13 -
Brief Proj2ct Description
3.2 The proposed project will include the following components:
Institutional Strengthening
(a) P These will focus onforestry management policies and incentives for sustainablemanagement of natural forest, including issues such as shiftingcultivation and plantation development as appropriate, including therole of social forestry. Manpower development plan for MOF willalso be prepared. Following discussion of investment strategies andagreement between GOI and the Bank, follow-up investment projectswould be prepared;
(b) Forest Inventory. The sectoral planning information base would bestrengthened through a national forest inventory focussed onpriority areas for development, and a system for regular updating ofthis information to monitor change; and
(c) Forestry Research would be strengthened through improved planning,management and funding of research mainly for natural forestmanagement, and tree improvement in the forest areas of the OuterIslands.
Conservation
(a) Upper Solo (Wonogiri) Watershed Conservation. This will includerehabilitation of about 22,000 ha of terraced lands and associatedconservation structure, planti.g of some 5,000 ha of fruit, fodderand fuelwood trees on private lands, and 3,500 ha of conservation-oriented forests on state land in Wonogiri. No resettlement will beinvolved. Technical packages have been established and proven onfarmers' fields; and
(b) Nature Conservation. Management of five existing natureconservation areas in East Java, Bali, North Sumatra, Aceh and NorthSulawesi would be strengthened through technical assistance, stafftraining, and improved facilities.
Detailed Project DescriptionPolicy, Planning and Investment Studies
3.3 In view of the increasing demand for forestry products, and concernsabout the sustainable supply of logs and other products from Indonesia'sforests, MOF plans to carry out studies focussed on strategies to ensuresustainable development of Indonesia's forests. The studies will focus onseveral areas, including policies and plans for improved management offorests, shifting cultivation and strategies for avoiding more destructiveforms of such cultivation, manpower development plans to strengthen MOPcapacity to implement its policies and programs, and finally the preparationof investmenl projects and programs consistent with proposed strategies.These aspecLs are described in the following paragraphs in greater detail.

- 14 -
3.4 Forest Management Strategy Study. The study will focus on forestmanagement and timber concession poli:ies and will suggest incentives andcontrol mechanisms for ensuring sustainable production from forests,cozisistent with environmental considerations and the welfare of people who aredependent on those forests for their sustenance (TORs in Annex 1). In thefirst phase of the study, the current market and incentive framework would beanalyzed including the concession license tenure system, pricing and fiscalpolicies, linkages between forest management and industrial utilization,forest logging and harvesting systems. and their ecological, social andsilvicultural implications. The analysis will include assessment of policyimplementation capacity and potential for technical and administrative policychanges that could lead to improved efficiency in thi. sector. In order tokeep the study practical and implementation oriented, the feasibility andimpact of alternative strategies would be analyzed for three typical types ofconcessions supplying (a) an integrated pulp and paper mill; (b) an integratedplywood/sawmill; and (c) non-integrated processors. Following discussions andreview of first phase results, recommendations for long-term developmentstrategy would be formulated, followed by an action program for the next fiveyears including recommendations for policy changes. For this purpose, theproposed project will include 110 man-months of internationally recruitedconsultants and 165 man-months of locally recruited consultant assistance.MOF has invited proposals from FAO for carrying out of forestry managementstrategy studies, and signing of a consultancy agreement acceptable to theBank is proposed as a condition of Loan effectiveness. At negotiations, anassurance was obtained that an action program for forestry developmentstrategy would be presented to the Bank by September 30, 1990 and followingdiscussions an acceptable action program would be adopted by March 31, 1991.
3.5 Shifting Cultivation Study. In view of the growing problem ofshorter cycle non-sustainable forms of shifting cultivation, and widelyvarying views about the magnitude and nature of the problem, the study willinitially assess the area under different forms of shifting cultivation andevaluate the economic impact of such activity. The study will also describethe practices of representative groups and their claims to land cultivation.Based on this analysis the study will improve welfare by developing andanialyzing alternative approaches for reducing environmental degradation andresource depletion while promoting the welfare of local peoples. Theinstitutional and implementation arrangements would also be analyzed (TORs inAnnex 1). The project will provide about 24 man-months of internationallyrecruited and 28 man-months of locally recruited consultant assistance. Thestudy recommendations will be presented to GOI and the Bank for discussion andreview by September 30, 1990, and finalized by March 31, 1991.
3.6 Manpower Development Plan. The proposed project would assist MOF toprepare a manpower development plan. This would include a review of thecurrent structure of the Ministry, preparation of a complete list of jobcategories along with number of employees in each category and updated jobdescriptions, preparation of staff skills inventory, and an assessment ofskill gaps, both current and future. Based on the assessment of needs, thestudy will propose future manpower development strategy and an action plan foraddressirg both structural deficiencies and manpower skills gaps. About 36man-months of internationally recruited consultants and 48 man-months of
- 15 -
locally recruited consultant assistance will be provided. Since the MOF wouldnleed to update manpower development plans annually, its capacity for manpowerplanning would also need to be strengthened by on-the-job training ofcounterparts by study consultants supplemented by 30 man-months of formaltraining.
3.7 Investment Planning. It is expected that action plans from theforestry strategy and planning studies will be available by March 31, 1990.Following agreements on these action plans, the study teams will developterms-of-reference for more detailed planning of any investment proposalscontained in the action plans. It is expected that the preparation ofinvestment proposals will take 8 to 12 months, and after preparation theproposals will be considered by the Bank for possible financing. Since theefficiency of investments would depend on an appropriate policy framework, atnegotiations assurances were obtained that the detailed investment preparationwork will be started only after agreements are reached with the Bank on theaction plans developed under the main policy oriented studies described underparas. 3.4 and 3.5.
Forest Inventory
3.8 In view oi the outdated and inaccurate forestry resource informationand the need to monitor changes in forestry resources on a regular basis, theproposed project would assist GOI in carrying out a national forestry resourcesurvey. The survey would provide reliable estimates of standing -'olumes bymajor forest types, species and marketing groups, and mark their location onsmall-scale low-cost maps for use by both MOF and the private sector inplanning and administering proposals for forest utilization. The forestresource information would also be used to develop longer range forestmanagement plans and policies.
3.9 To minimize the cost of forest inventory for Indonesia's vast forestarea extending over 144 million ha, a sampling approach will be adopted withmore emphasis given to areas that are important either because of highpotential for development or because of problems and pressures on the forestryresources. A stratified sampling design will be adopted, with strata definedon the basis of existing remote sensing images. In high priority areas, new1:20,000 aerial photography will be obtained at systematically spacedintervals with line spacing varying between 10 to 20 km. It is estimated that7,500 line km will be flown. Field sampling will be done for calibratingremote sensing and aerial photography data. It is expected that the number ofsamples per million ha will range between 17 to 64. To facilitate forestrymanagement and development, stand and stock tables will be prepared by mainforest strata and geographic sub-divisions. This will show distribution ofvolume by species and diameter classes and will be useful for guiding forestrysector industrial investment and resource development decisions. About 110man-months of consulting services and about 210 man-months of training will beprovided to assist in the implementation of the forest inventory component.MOF has invited proposals from FAO and the signing of a consultancy agreementacceptable to the Bank is proposed as a condition of Loan effectiveness.

- 16 -
Forestry Research
3.10 The project s-ill strengthen forestry research effort in the twohighest priority areas of (a) tree improvement research for increasingproductivity of forest plantations; and (b) development of applied technologyfor the improved regeneration of logged-over natural forest. For this, theproject will support the development of the newly created forestry researchstation in North Sumatra, and minor improvement of existing facilities atBogor and Samarinda. Research funds will be provided for research in thosetwo high priority research areas az several locations in Sumatra andKalimantan. Institutional arrangements for determining research prioritieswill be strengthened (para 5.06). Management and effectiveness of researcheffort will be strengthened by providing 84 man-months of internationallyrecruited consulting services, 24 man-months of locally recruited consultingservices, and foreign training for about 40 research staff. Hiring ofconsultants satisfactory to the Bank is proposed as a condition ofdisbursement for this component.
Wonogiri Watershed Conservation
3.11 Soil Conservation Structures. The project will strengthen soilconservation efforts in the Wonogiri watershed, which is considered to be themost critical watershed in Indonesia, because of heavy soil erosion andsiltation of the Wonogiri dam. For this the project will construct soilconservation structures including 250 gulley head control structures, 1,300small earth fill gulley plugs, 160 earth and rockfill gabion type check dams(up to 4 meter height), and 40 small reservoirs. Sloping and grassing of50,000 sq m of guiley sides will be done to prevent further erosion. About 10km of eroding stream banks will be protected by construction of gabions andabout 50 km of roadside will be protected by reshaping of existing drainagechannels, grassing of banks, and providing channels with permanent dropstructures. These soil conservation structures will prevent worsening ofexisting gulleys and will help to trap silt which is moving down from farms onsteep slopes in the catchment, to the Wonogiri reservoir. To prevent furthersoil erosion and silt movement, the project will assist in planting of treeson steeper slcpes and on strengthening on-farm conservation practices.
3.12 On-farm Conservation Practices. The project will strengthen on-farmconservation practices in the Wongiri area by improving existing terraces onabout 22,000 ha of erodable slopes, and providing them with stable waterwaysand drop structures. To ensure that farmers take up on-farm conservationpractices, these practices have been formulated with a view to both increasingfarmer incomes in the short-term, as well as conserving soil for longer termproductivity. These agricultural practices involve growing of two crops peryear consisting mainly of maize with inter-crops of groundnut, rice or cassavaon terraces that are designed so that more moisture is retained during drierperiods and excess moisture drained off during wet season, in such a way thaterosion is minimized. These agricultural practices have already been tried infarmer field conditions in the project area and found to be successful in bothincreasing short-term farmer returns and improving soil conservation forlonger-term benefits. Continued development of location-specific recommenda-tions will be carried on to improve end adapt existing technology to the
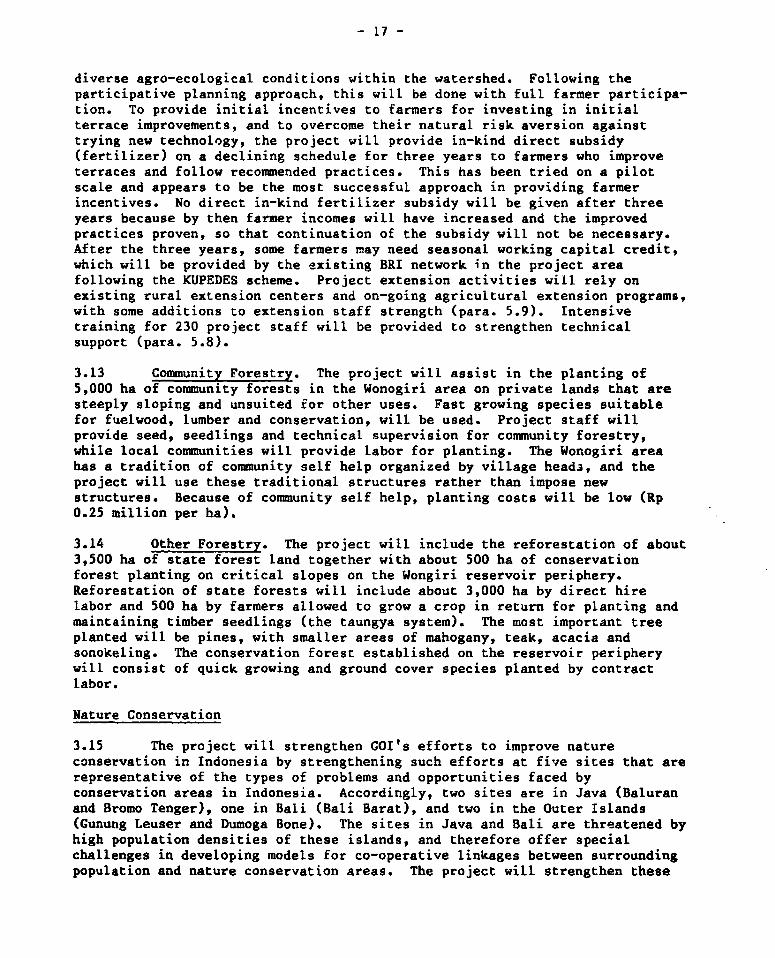
- 17 -
diverse agro-ecological conditions within the watershed. Following theparticipative planning approach, this will be done with full farmer participa-tion. To provide initial incentives to farmers for investing in initialterrace improvements, and to overcome their natural risk aversion againsttrying new technology, the project will provide in-kind direct subsidy(fertilizer) on a declining schedule for three years to farmers who improveterraces and follow recommended practices. This has been tried on a pilotscale and appears to be the most successful approach in providing farmerincentives. No direct in-kind fertilizer subsidy will be given after threeyears because by then farmer incomes will have increased and the improvedpractices proven, so that continuation of the subsidy will not be necessary.After the three years, some farmers may need seasonal working capital credit,which will be provided by the existing BRI network in the project areafollowing the KUPEDES scheme. Project extension activities will rely onexisting rural extension centers and on-going agricultural extension programs,with some additions to extension staff strength (para. 5.9). Intensivetraining for 230 project staff will be provided to strengthen technicalsupport (para. 5.8).
3.13 Community Forestry. The project will assist in the planting of5,000 ha of community forests in the Wonogiri area on private lands that aresteeply sloping and unsuited for other uses. Fast growing species suitablefor fuelwood, lumber and conservation, will be used. Project staff willprovide seed, seedlings and technical supervision for community forestry,while local communities will provide labor for planting. The Wonogiri areahas a tradition of community self help organized by village head3, and theproject will use these traditional structures rather than impose newstructures. Because of community self help, planting costs will be low (Rp0.25 million per ha).
3.14 Other Forestry. The project will include the reforestation of about3,500 ha of state forest land together with about 500 ha of conservationforest planting on critical slopes on the Wongiri reservoir periphery.Reforestation of state forests will include about 3,000 ha by direct hirelabor and 500 ha by farmers allowed to grow a crop in return for planting andmaintaining timber seedlings (the taungya system). The most important treeplanted will be pines, with smaller areas of mahogany, teak, acacia andsonokeling. The conservation forest established on the reservoir peripherywill consist of quick growing and ground cover species planted by contractlabor.
Nature Conservation
3.15 The project will strengthen GOI's efforts to improve natureconservation in Indonesia by strengthening such efforts at five sites that arerepresentative of the types of problems and opportunities faced byconservation areas in Indonesia. Accordingly, two sites are in Java (Baluranand Bromo Tenger), one in Bali (Bali Barat), and two in the Outer Islands(Gunung Leuser and Dumoga Bone). The sites in Java and Bali are threatened byhigh population densities of these islands, and therefore offer specialchallenges in developing models for co-operative linkages between surroundingpopulation and nature conservation areas. The project will strengthen these

- 18 -
opportunities by encouraging local tourism and educational programs forschools and community groups in the surrounding areas. For this the servicesof a park interpretation specialist will be made available and visitor centersconstructed.. Park patrolling would also be improved by deploying more staffnear park boundaries. The approach at nature conservation sites in the OuterIslands would be similar, but with more emphasis on research and monitoring ofvaluable species, and patrolling to control poaching. At these sites staffdeployment would also be improved by building guard/ranger posts and housingcloser to the areas to be patrolled. The boundary demarcation will beimproved at sites such as Dumoga Bone and Bajuran, where demarcation has notbeen completed. Additional staff is not needed, and improved management ofconservation areas will come through better deployment of staff, improvedtraining and supervision, and improved mobility. Management of conservationwill be strengthened by providing 42 man-months of internationally recruitedconsultants and 34 man-months of foreign training. The consultants will alsoprovide on-the-job training of counterparts. Hiring of consultants satis-factory to the Bank is proposed as a condition of disbursement for thiscomponent.
IV. PROJECT COST AND FINANCING
Project Cost
4.1 The project is estimated to cost Rp 104 billion (US$63.0 million),of which Rp 6.7 billion (US$4.1 million) would be in duties and taxes, andRp 39.3 billion (US$23.6 million) in foreign exchange (Table 4.1). Base costsare calculated on early October 1987 prices based on recent contracts andquotations. Physical contingency estimates for civil works and on-farmimprovements are estimated at 10%, and for other categories at 5%. Pricezontingencies are based on estimated annual local inflation o- 10% (1987), 5%(1988), and 3.5Z (1989 onwards); and estimated annual foreign inflation of 3%(1987), 1% (1988-90), and 3.5% (1991 onwards).
Financing
4.2 The proposed IBRD loan of US$34 million will finance 60% of totalproject costs net of duties and taxes (US$4.1 million) and reservedprocurement (US$1.9 million). The loan will finance 88% of foreign costs andabout 34% of local costs, and will be at standard variable interest rate for20 years with a 5-year grace (Table 4.2). GON has expressed its interest forcontributing US$3.1 million equivalent as an untied grant for the project.Local contribution, net of duties and taxes, will be about US$22 million, ofwhich GOI will contribute US$12 million, and farmer in-kind contribution willbe US$10 million. Retroactive financing of up to US$0.5 million of expendi-tures incurred after July 1, 1987 would be required.

Table 4.1: PROJECT COST SUMMARY
Rp million US$'000 2 foreign % totalLocal Foreign Total Local Foreign Total exchange base costs
Institutional Strengthening
Forestry inventory 12,343.1 10,843.9 23,187.0 7,480.7 6,572.0 14,052.7 47 26
Forestry research 4,229.8 6,899.4 11,129.2 2,563.5 4,181.4 6,745.0 62 13
Studies, planning and monitoring 1,395.8 3,965.8 5,361.6 845.9 2,403.5 3,249.4 74 6
Subtotal 17,968.7 21,709.1 39,677.8 10,890.1 13,157.0 24,047.1 55 45
Forest Conservation
Wonogiri catchment 29,711.1 8,714.6 38,425.7 18,006.7 5,281.6 23,288.3 23 43
National parks 5,553.2 4,988.1 10,541.3 3,365.6 3,023.1 6,388.7 47 12
Subtotal 35,264.3 13,702.7 48,967.0 21,372.3 8,304.7 29,677.0 28 55
Total Baseline Costs 53,233.0 35,411.8 88.644.8 32,262.4 21,461.7 53,724.1 40 100
Physical conzingencie- 3,923.4 2,095.8 6,019.2 2,377.8 1,270.2 3,648.0 35 7
Price contingencies 7,768.4 1,496.0 9,264.4 4,708.1 906.7 5,614.8 16 10
Total Project Costs 64,924.8 39,003.6 103,928.4 39,348.3 23,638.6 62,986.9 38 117

- 20 -
Table 4.2: FINANCING PLAN(USS million)
IBRD CON GOI Other localAmount X Amount Z Amount X Amount X Total
Civil Works 8.7 91 - - 0.9 9 - - 9.6On-Farm improvements
and nursery 5.5 57 - - 0.1 1 4.0 42 9.6Incremental working capital - - - - - - 6.3 100 6.3Equipment, research, trials,aerial photos & maps 9.9 91 - - 0.9 9 - - 10.8
Vehicles - - 0.3 14 1.9 100 - - 2.2Incremental operatingcosts 2.3 16 0.4 3 11.8 81 - - 14.5
Technica. assistance andtraining 7.6 76 2.4 24 - - - - 10.0
Total 34.0 54 3.1 5 15.6/a 25/a 10.3 16 63.0
/a Includes duties and taxes. Funds required net of duties and taxes areUS$11.5 million, or about 18X of total costs.
Procurement
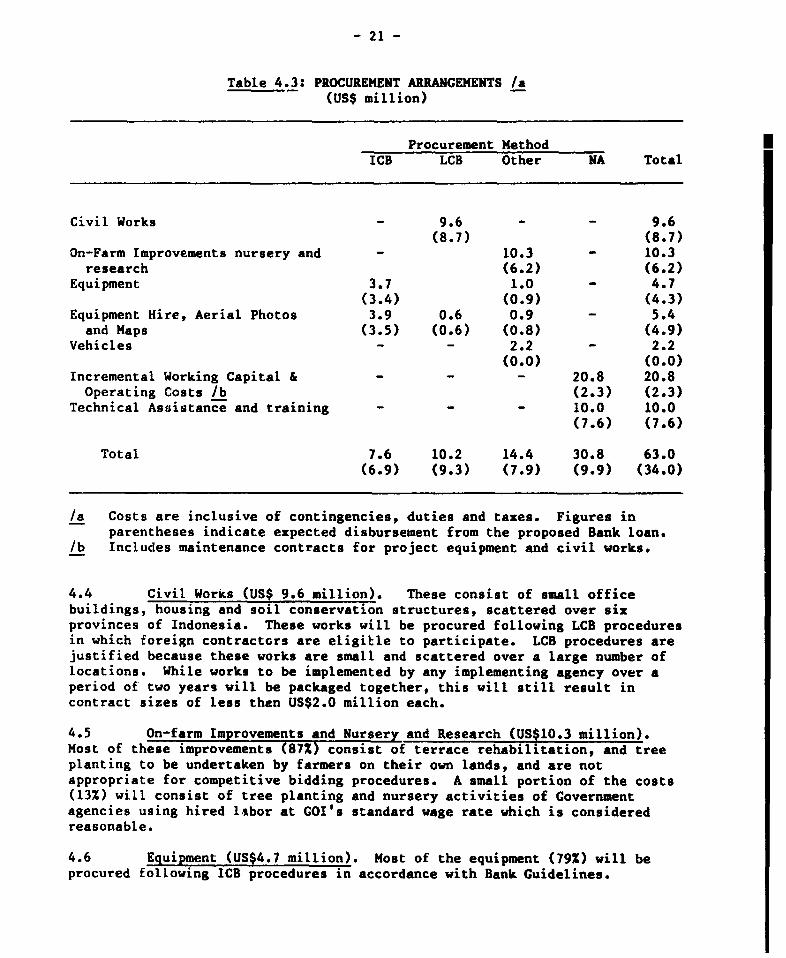
4.3 Procurement arrangements are summarized in Table 4.3 and discussedbelow.
- 21 -
Table 4.3: PROCUREMENT ARRANGEMENTS /a(US$ million)
Procurement MethodICB LCB Other NA Total
Civil Works 9.6 - - 9.6(8.7) (8.7)
On-Farm Improvements nursery and - 10.3 - 10.3research (6.2) (6.2)
Equipment 3.7 1.0 - 4.7(3.4) (0.9) (4.3)
Equipment Hire, Aerial Photos 3.9 0.6 0.9 - 5.4and Maps (3.5) (0.6) (0.8) (4.9)
Vehicles - 2.2 - 2.2(0.0) (0.0)
Incremental Working Capital & - - - 20.8 20.8Operating Costs /b (2.3) (2.3)
Technical Assistance and training - - - 10.0 10.0(7.6) (7.6)
Total 7.6 10.2 14.4 30.8 63.0(6.9) (9.3) (7.9) (9.9) (34.0)
/a Costs are inclusive of contingencies, duties and taxes. Figures inparentheses indicate expected disbursement from the proposed Bank loan.
/b Includes maintenance contracts for project equipment and civil works.
4.4 Civil Works (US$ 9.6 million). These consist of small officebuildings, housing and soil conservation structures, scattered over sixprovinces of Indonesia. These works will be procured following LCB proceduresin which Eoreign contractGrs are eligitle to participate. LCB procedures arejustified because these works are small and scattered over a large number oflocations. While works to be implemented by any implementing agency over aperiod of two years will be packaged together, this will still result incontract sizes of less then US$2.0 million each.
4.5 On-farm Improvements and Nursery and Research (US$10.3 million).Most of these improvements (87%) consist of terrace rehabilitation, and treeplanting to be undertaken by farmers on their own lands, and are notappropriate for competitive bidding procedures. A small portion of the costs(13%) will consist of tree planting and nursery activities of Governmentagencies using hired libor at GOI's standard wage rate which is consideredreasonable.
4.6 Equipment (US$4.7 million). Most of the equipment (79Z) will beprocured following ICB procedures in accordance with Bank Guidelines.

- 22 -
Off-the-shelf items, each of less than US$60,000 in value, will be procuredafter inviting quotations from at least three suppliers. These will notexceed US$1.0 million in total value.
4.7 Equipment Hire and Maps (US$5.4 million). The project will needcopies of base maps and prints from negatives of high resolution satelliteimagery (SPOT) of forest areas (US$0.9 million). These are available withGOI's national mapping agency, Bakosurstanal, and will be obtained by MOF atcost. This procurement method is the most economic, considering the fact thatif MOF were to try to obtain new satellite imagery from outside sources thecost will be several times higher because new negatives will need to beprepared. In addition, the project will obtain aerial photographs of someforest areas (US$3.9 million). These services will be obtained following ICBprocedures in accordance with Bank Guidelines. Helicopters will also need tobe hired (US$0.6 million) on a sporadic basis over a five year period fortransferring field survey crew to remote areas. Because the size of contractis small and is unlikely to exceed US$0.2 million over any two year period,LCB procedures will be followed, in which foreign firms will be eligible tobid.
4.8 Vehicles (US$2.2 million). Following GOI regulations, vehicleimport is not permitted, and the project will procure locally assembledvehicles. Because of the reserved procurement these vehicles will not befinanced by the Bank. In addition, at negotiations, assurances were obtainedthat vehicles will be provided in accordance with the schedule in Annex 4,Table 1.
4.9 Other (US$30.8 million). Consulting services (US$5.4 million) willbe procured following Bank Guidelines for hiring of consultants. GOI iscurrently considering obtaining FAO assistance for hiring of consultants, andthe arrangements will be reviewed by the Bank. Training ($4.6 million) willbe at institutes acceptable to the Bank. The remaining costs are forincremental salaries ($10.0 million), other incremental operating costs ($4.5million) including maintenance contracts for civil works and equipment, andworking capital ($6.3 million).
4.10 Contract Review. After an initial review of standard civil worksbidding documents by the Bank for LCB contracts, only bidding documents forcontracts estimated to exceed US$500,000 will be reviewed prior to issuance.This will result in prior Bank review of seven documents covering about 75% ofthe value of contracts. Similarly for equipment, all bidding packagesestimated to cost over US$300,000 will be reviewed prior to issuance. Thiswill result in Bank review of six documents covering over 80% of the value ofcontracts. The remaining contracts will be reviewed on a random basis afteraward of contracts.
Disbursements
4.11 Disbursements under the Bank loan are expected to be completed byJune 30, 1996, about eight years after Board Presentation (Annex 3). This issomewhat shorter than the typical disbursement period for agriculturalprojects in Indonesia, and forestry projects Bank-wide (para. 5.11).

- 23 -
4.12 Disbursements from the Bank loan will be made for:
(a) 91% of expenditures on civil works;
(b) 91% of expenditures on locally procured equipment (100% of local ex-factory cost) or 100% of foreign expenditures on internationallyprocured equipment;
(c) 91% of expenditures on equipment maintenance and hire, aerial photosand maps;
(d) 100% of expenditures on technical assistance and training;
(e) 100% of payments to farmers for terrace rehabilitation andassociated waterways; and
(f) 91Z of expenditures for the establishment of forestry research plots(including field trials), and nurseries.
4.13 Disbursements for training (US$4.6 million), payments to farmers forterrace rehabilitation and waterways (US$4.9 million), and nursery andresearch plots (US$0.7 million) will be based on Statements of Expenditures(SOE). In addition, disbursements (US$3.3 million) for the purchase of itemsof less than US$60,000 (para. 4.6) will also be on the basis of SOEs. TheseSOEs will be prepared by MOF and detailed documentation will be kept at fieldoffice at Solo and at headquarters in Jakarta. At negotiations, assuranceswere obtained that these SOEs will be audited and the supporting documentationwill be made available to the Bank for inspection during supervision.Disbursements for other components (US$19 million) or 56% of loan amount willbe based on fully documented withdrawal applications.
4.14 To facilitate disbursement administration, loan withdrawalapplications will be aggregated as far as possible, and will not be for lessthan US$60,000 equivalent for reimbursement and US$10,000 equivalent fordirect payment. In addition, a Special Account (SA) will be set up in theBank of Indonesia (BI) with a maximum of US$1 million. Following GOI policythat SA in foreign currency should not be set up, the proposed SA will be forlocal currency payments only. Since most of project expenditures (over 60%)will be in local currency, the benefits from the SA will be substantial. Atnegotiations an assurance was obtained that GOI will set up a Special Accountin BI for disbursements from the proceeds of 'he Bank loan, followingprocedures and under terms and conditions satisfactory to the Bank.
Accounting and Audits
4.15 Separate project accounts, clearly indicating the various sources ofreceipts and expenditures by functional categories for their respectiveproject components, will be maintained by MOF, and by the Wonogiri projectoffice. The accounting and internal audit procedures of the implementingagencies are satisfactory. Each agency has an internal audit office whichcontinuously audits its accounts. Strict budget control is maintained basedon standard unit costs, and expenditure beyond budgeted amounts is

- 24 -
difficult. As required by GOI regulations, agency accounts are auditedannually by the Directorate of State Accountancy (BPKP). Audits are usuallydelayed due to shortage of accountants and auditors in Indonesia, and theseproblems will be addressed by an Accountancy Development Project proposed forBank financing. At negotiations, assurances were obtained that unauditedproject accounts and SOEs will be submitted for audit and to the Bank withinfive months of fiscal year-end, and the audit report made available to theBank within nine months of the fiscal year. The report would include aseparate auditors' opinion on SOE, verifying that the related expenditureswere made for the agreed purposes of the project.
V. ORGANIZATION, MANAGEMENT AND IMPLEMENTATION
5.1 General. The project will be implemented for the most part by theMinistry of Forests (MOF), with the Ministry of Home Affairs (MHA) and theMinistry of Agriculture (MOA) playing important roles in the implementation ofthe watershed protection component.
The Ministry of Forests (MOF)
5.2 Coordination. MOF will have the overall responsibility for projectcoordination, and for this purpose a Project Coordination Committee (PCC) hasbeen set up, with the Minister as Chairman and the Directors General andAgency heads as members. A project liaison office has been formed under theDirector of Planning. This office will help implementing agencies in: (a)solving any problems concerning project accounting, budgeting and procurementprocedures; and (b) channelling disbursement requests and progress reports tothe Bank.
5.3 Strategy Studies. The forest management strategy studies and theshifting cultivation study will be coordinated by the Directorate General ofForest Utilization (PH), and will be conducted with the help of consultants.GOI has invited FAO to submit a proposal for carrying out of the study to befinanced by the proposed loan funds. Signing of an agreement satisfactory tothe Bank, is a condition of loan effectiveness. Interim results from strategystudies will be reviewed by a steering committee which will have representa-tives from MOF as well as other concerned agencies such as the Ministry ofFinance, Bappenas (Planning), the Ministry of Population and Environment(KLH), and the Directorate General of Multifarious Industries. The Bank willalso participate in these reviews as a part of its loan supervision responsi-bilities.
5.4 Manpower Development Planning Study. The Directorate of ManpowerPlanning within the Secretary General's office in MOF will be responsible forpreparing manpower development plans, with the assistance of two internation-ally recruited consultants and two locally recruited consultants. Forpreparing the manpower development plan, the Director of Manpower Planningwill form a manpower planning technical team with representatives from eachDirectorate-General and Agency in MOF. An assurance was obtained that thetechnical team will be established by September 30, 1988.

- 25 -
5.5 Forest Inventory. The Agency for Forest Inventory and Land UsePlanning will be responsible for carrying out the national forest inventorycomponent, using the existing organizational structure. The Director ofForest Inventory will act as Project Director, and will be assisted by aProject Planning and Implementation Unit (PPIU). The PPIU has already beenestablished. The Agency has ten regional offices with adequate staff, andthese offices will assist in the implementation of the inventory. Theinventory consultants will organize seminars for further training of projectstaff. The only incremental staff required are for computer assisted dataanalysis, for which one systems engineer and six programmer/technicians willbe needed only after forest inventory data collection is completed. Thereforethese staff will be hired by April 1, 1990. To ensure that information isresponsive to user needs, at negotiations an assurance was obtained that anational forestry information users group satisfactory to the Bank will be setup by September 30, 1988 and maintained thereafter. The group will includerepresentatives of each of the Directorates General and Agencies in MOF, and arepresentative of private industry. The group will meet as necessary, but atleast twice a year.
5.6 Forestry Research. The forestry research component will beimplemented by the Research and Development Agency of MOF. To assist withproject implementation, a Project Planning and Implementation Unit (PPIU) hasbeen set up. PPIU is assisting in detailed design and procurement activitiesfor the proposed project. To assist with the setting up of researchpriorities, and for coordination of research and development activitiesundertaken by the Agency, Universities, private sector, and in some cases DCRRL, a Forest Research Advisory Council will be set up which will includerepresentatives of MOF, universities, Bappenas and the private sector. Atnegotiations, assurances were obtained that a high level Forestry ResearchAdvisory Council, satisfactory to the Bank, will be set up by September 30,1988. The Council will set research goals and priorities consistent withforestry sector plans and strategies, and will allocate research implementa-tion responsibilities and budgets. The Council will meet as frequently asnecessary, but at least once a year. The Council will be assisted by a forestresearch policy analysis and development group which will act as itssecretariat and will be set up by September 30, 1988. The group will havefour professional officers, at least one of whom would have some competence ineconomic analysis. Detailed annual research programs will be developed by theagency, and will be sent to the Bank for review at least two months prior tothe start of each fiscal year. At negotiations, appropriate assurances wereobtained.
5.7 Nature Conservation. The Directorate Ceneral for Forest Protectionand Nature Conservation (PHPA) within MOF will be responsible for implementingthe nature conservation component. Within PHPA, the Director National Parkswill act as the Project Director, and will be assisted by a PPIU (NatureConservation). The PPIU has already been formed. Current staff levels inproject national parks are adequate, and no additional staff will be required.The main emphasis during project implementation will be on increasing theeffectiveness of project staff to implement the project better, and for thispurpose technical assistance will be provided.

- 26 -
5.8 Watershed Conservation - Technical Support. MOF through itsDirectorate General for Soil Conservation and Rehabilitation (RRL) would bethe lead agency providing technical direction in the project. Within RRL, theDirector of Soil Conservation will be responsible for supervision of technicalactivities for watershed protection. Most of the technical activities wouldbe centered on the sub-Balai's office in Wonogiri and a post of ProjectManager (Technicai) with additional administrative and technical staff wouldbe established in this office to manage and coordinate technical activities,including: (a) detailed conservation planning and design within the context ofa comprehensive watershed plan prepared by the Balai V office; (b) submissionof annual plans and budget proposals for conservation design and farmermotivation activities; (c) training of PLPs and PPLs in conservation planningand implementation; and (d) technical supervision of the construction ofconservation works. Intensive training of project staff at all levels will beprovided at the beginning of the project followed by continuous upgrading oftechnical skills, especially for integrated watershed planning and the designof conservation works. Consultants (45 man-months internationally recruitedand 48 man-months locally recruited) will be hired to strengthen technicalsupport for project implementation. Hiring of consultants, satisfactory tothe Bank and in accordance with the schedule in Annex 4, is a condition ofdisbursement for this component. A liaison officer in MOF HQ will facilitatecommunication between the Balai/sub-Balai office and agencies at the nationallevel in project matters.
Other Agencies
5.9 Watershed Conservation - Field Implementation. The Ministry of HomeAffairs (MHA through its District (Kabupaten) level administration will beresponsible for field level implementation and co-ordination of watershed con-servation activities, which are all confined in a single Kabupaten ofWonogiri. The District Administrator's (Bupati's) office will have the mainresponsibility for supervising and coordinating field implementationactivities of agricultural, forestry and public works staff, and for thispurpose a Project Manager (Field) will be appointed. At negotiations,assurances were obtained that Project Manager (Field) satisfactory to the Bankwill be appointed before September 30, 1988. Agricultural extension will bethe responsibility of agricultural extension workers (PPL) and soilconservation extension work will be the responsibility of soil conservationextension workers (PLP). The Project Manager (Field) will co-ordinate theactivities of agriculture (PPL) and soil conservation (PLP) excension workersin the Wonogiri Watershed project area (para. 5.1C). He will ensure that PPLsand PLPs work jointly during the initial period when soil conservationstructures are being constructed/rehabilitated. Current extens; .a stafflevels (60 PLP and 50 PPL) are inadequate for the more intensive extensioneffort required to extend the new technology. An additional 50 PLPs and 40PPLs will be posted in the Wonogiri watershed area for the duration of theproject. As conservation works are completed, PLPs will be progressivelymoved out to other watersheds, leaving the PPLs to carry out agriculturalextension work.
5.10 Watershed Conservation-Coordination. Since the implementation ofwatershed conservation activities involves the activities of a large number of
- 27 -
agencies including Home Affairs, Forestry, Agriculture and Public Works, theco-ordination of these activities will be specially important. Accordingly,co-ordination structures will be set up at the District, Provincial andNational levels to co-ordinate watershed conservation activities. At theDistrict level the 3upati (D_trict Head) will be responsible for fieldimplementation, assisted by a co-ordination team headed by the head ofDistrict Planning Agency (Bappeda-Level II) with members from all agenciesinvolved. Similar co-ordination structures will be set up at Provincial levelheaded by Provincial Planning Agency, and at National level headed by theDirector-General of RRL in MOF, with the Director-General of RegionalDevelopment in MHA acting as the alternate chairman. Amongst these co-ordination structures, the field level co-ordination committee will be themost important for ensuring smooth project implementation. At negotiations,assurances were obtained that the District level co-ordination committee willbe set up before September 30, 1988.
Project Implementation Plans and Status
5,11 The project will be implemented over an eight year period, startingApril 1, 1988, with some components such as studies being completed in threeyears, and others, such as watershed conservation being implemented over eightyears. The longer eight year period for watershed conservation is requiredbecause of the need to train farmers to adopt new technology. The longerperiod is consistent with the Bank's experience with similar projects in othercountries. Detailed terms-of-reference for key consultancies have beenprepared and agreed with GOI. Land for most of the civil works constructionis already available with implementing agencies, and for terraces withfarmers. The implementation schedule for key project actions, vehicleprocurement and additional staff required (Annex 4) have been discussed withGOI and will be agreed at negotiations. Detailed design for first year civilworks have been completed, and for civil works construction in subsequentyears, the detailed design will be completed in each preceding year. Thedetailed work program for agricultural activities in the Wonogiri watershedwas discussed during negotiations.
Monitoring and Evaluation
5.12 Project monitoring will be done by Project Planning andImplementation Units (PPIU), and these have been already created for allproject components. A project liaison office has been set up for overall pro-ject monitoring and liaison with outside agencies. The PPIU and the liaisonoffice will issue quarterly progress reports showing physical achievements ofthe project on indicators such as hiring of consultants, number of personstrained, completion of interim and final reports on studies, establishment ofresearch plots, forest area covered by inventory, watershed area protected,conservation structures, and infrastructure constructed. These reports willalso include explanations for major variations in plans, expenditures anddisbursements, as well as detailed plans for the next quarter and anyrevisions in longer term plans.
5.13 Project evaluation will be done in several stages. A mid-termevaluation of the project will be started by September 30, 1991, and completed

- 28 -
by March 31, 1992. A project completion report (PCR) will be started byMarch 31, 1997, and completed not later than six months after loan closing.In addition to recording physical and financial achievements of the projectand explaining major deviations from plans, these evaluation reports will alsoassess quality of project outputs and the benefits that would accrue from theproject. These reports will be prepared by the project liasion office withassistance from PPIU, Bappeda Central Java, and consultants. Since evaluationfor the Wonogiri component will be specially complex because of the largenumber of project participants (50,000 families), locally recruitedconsultants will be employed to carry out a base line socio-economic samplesurvey of Wonogiri watershed area, followed by sample surveys of projectparticipants every three years. At negotiations, assurances were obtainedthat a base line survey will be completed by March 31, 1989, a mid-termevaluation report by September 30, 1992, and a PCR not later than six monthsafter the loan Closing Date.
VI. PROJECT IMPACT
Benefits/Cost Effectiveness of Institutional Strengthening Components
6.1 The benefits from institutional strengthening components aretypically large relative to costs, but such benefits are often difficult toquantify. Therefore, during the project preparation/appraisal stage specialcare has been taken to ensure cost effectiveness of proposed investments forinstitutional strengthening. For instance, the initial proposal for forestinventory was for an investment of over US$60 million and required aerialphotographs of large areas of Indonesia's forests. During the preparation/appraisal stage, the cost was reduced by over 75X by using efficient samplingtechniques and satellite imagery. Similarly, the cost of the forestryresearch component was reduced by postponing lower priority activities.
6.2 While the benefits from institutional strengthening components aredifficult to quantify, some attempt has been made to relate the size of thesecomponents to the size of sectoral assets and investments, which will benefitfrom these components. In all cases, efficiency increases of one percent orless are sufficient to justify the costs of these components, and it is highlylikely that actual efficiency increases due to project components will exceedthese levels.
6.3 Studies. The forest management strategy studies will suggest policyand incentives to ensure that Indonesian production forests, estimated at 40to 60 m ha, continue to produce hardwood logs on a long-term sustainable basisand in a manner consistent with environmental requirements and the welfare oflocal populations dependent on those forests. These forests are currentlyproducing about 25 million cu m p.a. and generating annual rent of aboutUS$750 million, but in a manner that could completely exhaust this incomestream in about 40 years. Under these conditions, the value of the forest, inpresent value terms, would be only about US$6.2 billion. However, withimproved policies and investments, these forests can produce 25 million cu mp.a. and generate annual rent of US$750 million and exports of US$1,700million on a sustainable basis. Under those conditions the present value of
- 29 -
future income from forests would be in the range of US$6.4 to 7.6 billion.Clerly, the potential gain of between US$200 and 1,400 million in net rent isvery large when compared with the proposed cost of strategy studies of aboutUS$3 million and reasonable costs of implementing the strategy.
6.4 Forestry Research, The proposed investment in forestry researchwill bring additional benefits by developing techniques for improved produc-tivity of both natural and plantation forests consistent with environmentaland social welfare considerations. Under current silvicultural and loggingpractices, the Indonesian natural forests are estimated to produce an averageannual increment of about one cu m per ha, which is far below the potential ofsuch forests. Considering that Indonesia's production forests are worth overUS$6 billion, even a one percent productivity increase due to improvedresearch efforts would bring benefits valued at about US$30 million in presentvalue terms. This is far in excess of incremental forestry research costs ofabout US$7 million, and would produce an ERR tf more than 20%.
6.5 Forest Inventory. The proposed strengthening of forestry resourceinformation would improve investment decisions in the forest based industrialsector. The inventory will allow the Government and the private sector toidentify areas of the production forest that are specially rich in commercialspecies, and relatively close to infrastructure for extraction purposes.Similarly, investments in resource development would be most effective inaras that are shown by the proposed resource survey and monitoring effort, tobe specially productive. Between 1990 and 2000 over US$4 billion in forestrysector investments are expected. Improved resource information and locationof investment will increase the effectiveness of this investment, and evenwith a one percent increase in efficiency of these investments the benefitsfrom resource information will exceed the cost of obtaining such i.±forma-tion. In addition, the forest inventory and monitoring information willimprove forest land use planning and management. It will provide an improvedbasi for allocation of forestry land between competing forestry, agricultureand conservation needs. By highlighting the magnitude and rate of changes inforest areas due to encroachment, forest fires and illegal felling, it willallow MOF to deploy its resources more effectively to prevent furtherdepletion of resources.
Benefits from Nature Conservation
6.6 The proposed investments in nature conservation will improve theprotection of several unique species of fauna and flora. This includes over100 mamal species including Sumatran orang utan, Sumatran rhinoceros tiger,banteng, siamang, clouded leopard and elephants. The avifauna includes theendangered Bali starling. The nature conservation areas will also conserveprimary rainforests with a large variety of tree species, including commer-cially important species such as Dipterocarpus spp. Preserving natural standsof these species, which account for over US$1 billion p.a. in exports, isimportant to act as a gene pool for tree breeding and tree improvementprograms, so that improved and higher yielding planting material are developedfor plantations as well as for enrichment planting in natural forest. TheGovernment is planning to increase the plantation area from the current 2 mil-lion ha to 6 million ha, yielding about 40 million cu m of logs valued at over
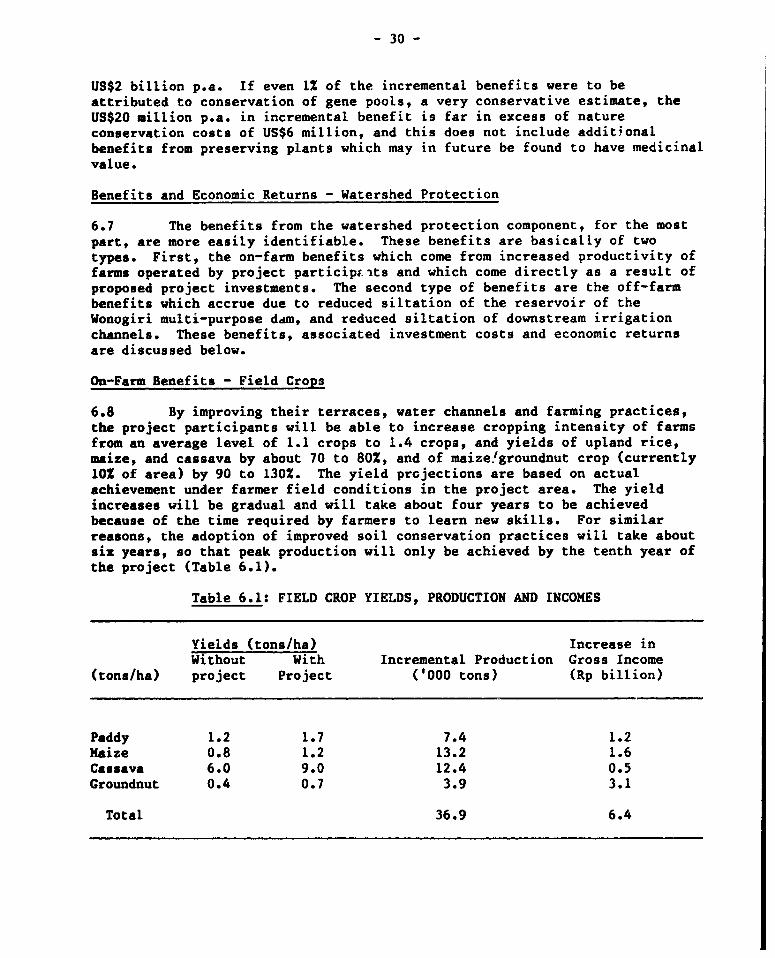
- 30 -
US$2 billion p.a. If even 1Z of the incremental benefits were to beattributed to conservation of gene pools, a very conservative estimate, theUS$20 million p.a. in incremental benefit is far in excess of natureconservation costs of US$6 million, and this does not include additionalbenefits from preserving plants which may in future be found to have medicinalvalue.
Benefits and Economic Returns - Watershed Protection
6.7 The benefits from the watershed protection component, for the mostpart, are more easily identifiable. These benefits are basically of twotypes. First, the on-farm benefits which come from increased productivity offarms operated by project participt its and which come directly as a result ofproposed project investments. The second type of benefits are the off-farmbenefits which accrue due to reduced siltation of the reservoir of theWonogiri multi-purpose ddm, and reduced siltation of downstream irrigationchannels. These benefits, associated investment costs and economic returnsare discussed below.
On-Farm Benefits - Field Crops
6.8 By improving their terraces, water channels and farming practices,the project participants will be able to increase cropping intensity of farmsfrom an average level of 1.1 crops to 1.4 crops, and yields of upland rice,maize, and cassava by about 70 to 80%, and of maize!groundnut crop (currently101 of area) by 90 to 130X. The yield projections are based on actualachievement under farmer field conditions in the project area. The yieldincreases will be gradual and will take about four years to be achievedbecause of the time required by farmers to learn new skills. For similarreasons, the adoption of improved soil conservation practices will take aboutsix years, so that peak production will only be achieved by the tenth year ofthe project (Table 6.1).
Table 6.1: FIELD CROP YIELDS, PRODUCTION AND INCOMES
Yields (tons/ha) Increase inWithout With Incremental Production Gross Income
(tons/ha) project Project ('000 tons) (Rp billion)
Paddy 1.2 1.7 7.4 1.2Maize 0.8 1.2 13.2 1.6Cassava 6.0 9.0 12.4 0.5Groundnut 0.4 0.7 3.9 3.1
Total 36.9 6.4
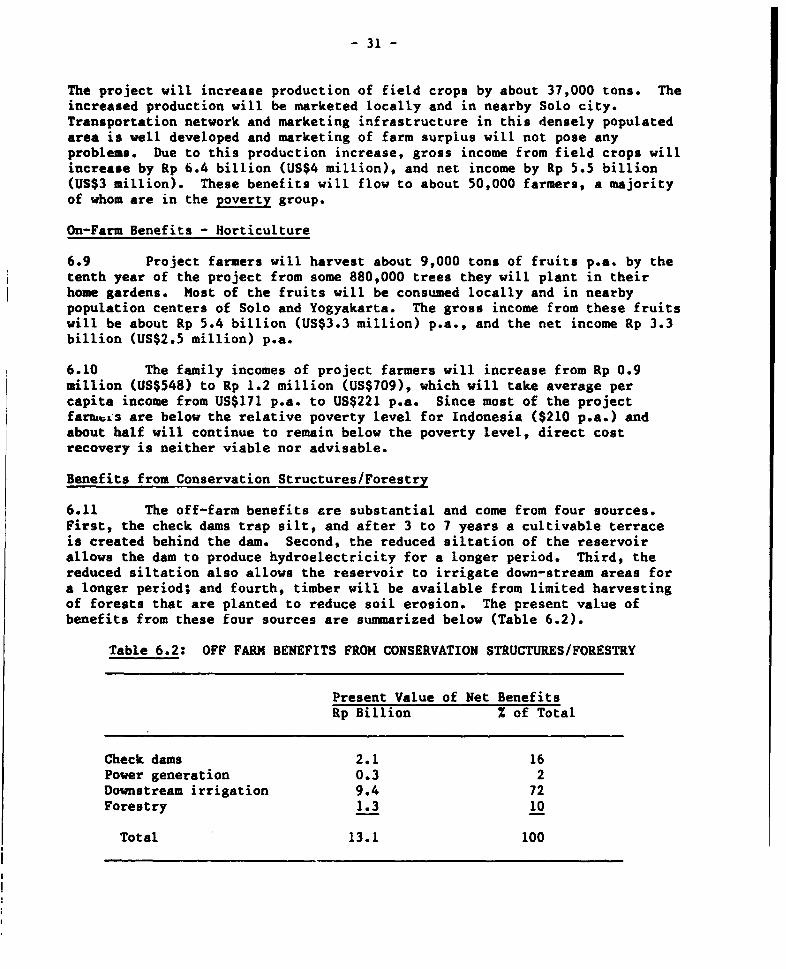
- 31 -
The project will increase production of field crops by about 37,000 tons. Theincreased production will be marketed locally and in nearby Solo city.Transportation network and marketing infrastructure in this densely populatedarea is well developed and marketing of farm surplus will not pose anyproblems. Due to this production increase, gross income from field crops willincrease by Rp 6.4 billion (US$4 million), and net income by Rp 5.5 billion(US$3 million). These benefits will flow to about 50,000 farmers, a majorityof whom are in the poverty group.
On-Farm Benefits - Horticulture
6.9 Project farmers will harvest about 9,000 tons of fruits p.a. by thetenth year of the project from some 880,000 trees they will plant in theirhome gardens. Most of the fruits will be consumed locally and in nearbypopulation centers of Solo and Yogyakarta. The gross income from these fruitswill be about Rp 5.4 billion (US$3.3 million) p.a., and the net income Rp 3.3billion (US$2.5 million) p.a.
6.10 The family incomes of project farmers will increase from Rp 0.9million (US$548) to Rp 1.2 million (US$709), which will take average percapita income from US$171 p.a. to US$221 p.a. Since most of the projectfarniis are below the relative poverty level for Indonesia ($210 p.a.) andabout half will continue to remain below the poverty level, direct costrecovery is neither viable nor advisable.
Benefits from Conservation Structures/Forestry
6.11 The off-farm benefits are substantial and come from four sources.First, the check dams trap silt, and after 3 to 7 years a cultivable terraceis created behind the dam. Second, the reduced siltation of the reservoirallows the dam to produce hydroelectricity for a longer period. Third, thereduced siltation also allows the reservoir to irrigate down-stream areas fora longer period; and fourth, timber will be available from limited harvestingof forests that are planted to reduce soil erosion. The present value ofbenefits from these four sources are summarized below (Table 6.2).
Table 6.2: OFF FARM BENEFITS FROM CONSERVATION STRUCTURES/FORESTRY
Present Value of Net BenefitsRp Billion Z of Total
Check dams 2.1 16Power generation 0.3 2Downstream irrigation 9.4 72Forestry 1.3 10
Total 13.1 100
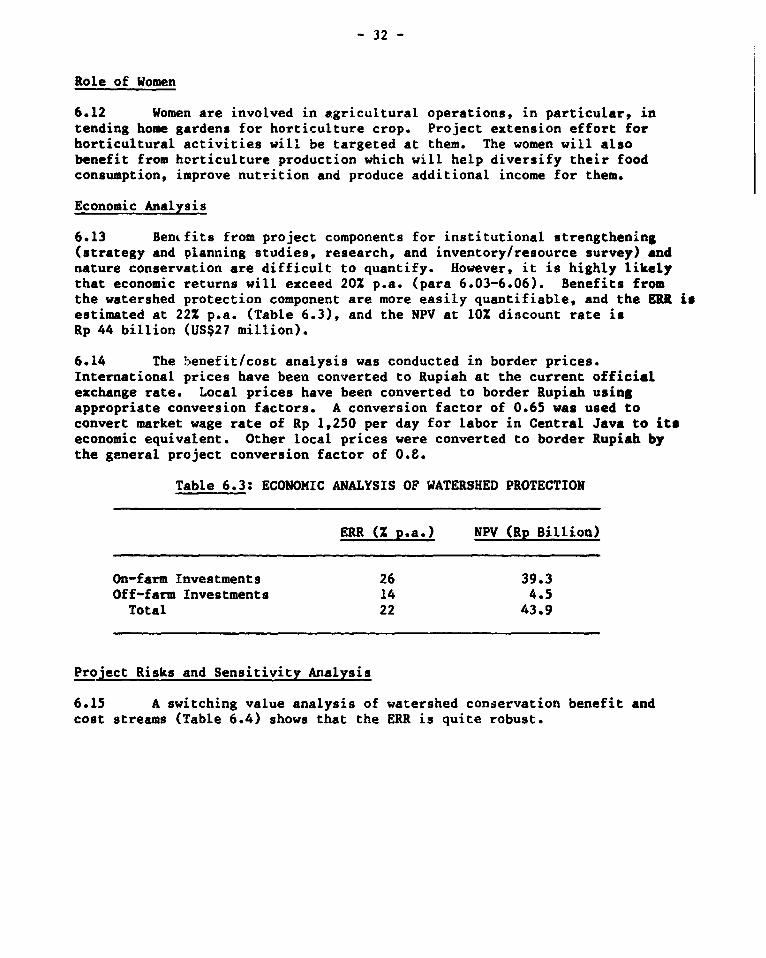
- 32 -
Role of Women
6.12 Women are involved in agricultural operations, in particular, intending home gardens for horticulture crop. Project extension effort forhorticultural activities wil'l be targeted at them. The women will alsobenefit from horticulture production which will help diversify their foodconsumption, improve nutrition and produce additional income for them.
Economic Analysis
6.13 BenLfits from project components for institutional strengthening(strategy and planning studies, research, and inventory/resource survey) andnature conservation are difficult to quantify. However, it is highly likelythat economic returns will exceed 20% p.a. (para 6.03-6.06). Benefits fromthe watershed protection component are more easily quantifiable, and the ERR isestimated at 22% p.a. (Table 6.3), and the NPV at 10% discount rate isRp 44 billion (US$27 million).
6.14 The benefit/cost analysis was conducted in border prices.International prices have been converted to Rupiah at the current officialexchange rate. Local prices have been converted to border Rupiah usingappropriate conversion factors. A conversion factor of 0.65 was used toconvert market wage rate of Rp 1,250 per day for labor in Central Java to itseconomic equivalent. Other local prices were converted to border Rupiah bythe general project conversion factor of 0.8.
Table 6.3: ECONOMIC ANALYSIS OF WATERSHED PROTECTION
ERR (2 p.a.) NPV (Rp Billion)
On-farm Investments 26 39.3Off-farm Investments 14 4.5Total 22 43.9
Project Risks and Sensitivity Analysis
6.15 A switching value analysis of watershed conservation benefit andcost streams (Table 6.4) shows that the ERR is quite robust.

- 33 -
Table 6.4: SWITCHING VALUES AT 10% OCC
Present value Switching valueRp billion x
Off-farm benefits 13 -100Benefits from Annual Crops 46 -89Benefits from Home Gardens 35 -100Total Benefits 94 -44
Off-Farm Investment Coste 8 +492On-Farm Investment Costs 45 +92Total Investment Costs 53 +78
Delay in Benefit Stream - 8 years
Even if off-farm benefits were not present or benefits from home-gardens donot materialize, the watershed conservation investments would still have anERR higher than Indonesia's OCC or 10% p.a. The sensitivity is greatest tobenefits from annual crops, but these could be reduced by 89% withoutaffecting the viability of these investments. On a total basis, even if allbenefits reduce by 44% these investments will remain viable. Similarly evenif the total investment costs increase by 78% or the benefits are delayed byup to 8 years the project will remain viable. The probability of thishappening is small.
6.16 On the institutional strengthening side, the main risk is whetherthe policy recommendations of the forestry management strategy studies willindeed get implemented. The risks are of two types. First, whether the localinstitutions will be willing to accept sensitive policy recommendations thatmay result from these studies. And, second, even if the recommendations areaccepted by GOI, whether they will indeed get implemented because of theinherent difficulties of managing and controlling an arpa extending over tensof millions of hectares.
6.17 To overcome the first risk, the study has been designed to involvenot only external consultants but also the various agencies which will beinvolved in implementing study recommendations, including the privatesector. This will ensure that while study recommendations are beingformulated, diverse view points are fully aired, so that the finalrecommendation is of better quality, and its rationale is well understood byall parties. This will also ensure that policy implementav ion difficultiesare fully recognized during the policy formulation stage. This aspect hasbeen specially emphasized in study TORs. In addition, at negotiations,assurances were obtained that an action program for forestry strategydevelopment will be presented to the Bank by September 30, 1990, and followingdiscussions, an acceptable action program would be adopted by March 31, 1991(para. 3.4).
- 34 -
VII. RECOMMENDATIONS AND ASSURANCES OBTAINED AT NEGOTIATIONS
7.1 At negotiations, the following assurances were obtained:
(a. an action program for forestry development strategy would bepresented to the Bank by September 30, 1990, and followingdiscussions an acceptable action program would be adopted by March31, 1991 (para 3.4);
(b) the detailed investment preparation work will be started only afteragreements are reached on the action plans developed under the mainpolicy oriented studies described under para 3.4 and 3.5 (para 3.7);
(c) unaudited project accounts and SOEs will be submitted for audit andto the Bank within five months of fiscal year-end, and the auditreport made available to the Bank within nine months of the fiscalyear. The report would include a separate auditors' opinion on SOE,verifying that the related expenditures were made for the agreedpurposes of the project (para 4.13, 4.15);
(d) a Special Account will be maintained in BI for disbursements fromthe proceeds of the Bank loan, following procedures and under termsand conditions satisfactory to the Bank (para 4.14);
Ce) a manpower planning technical team will be established by Septem-ber 30, 1988 (para 5.4);
Cf) a national forestry information users group satisfactory to the Bankw1' be set up by September 30, 1988 and maintained thereafter(pare 5.5);
(g) a Forestry Research Advisory Council, satisfactory to the Bank, willbe set up by September 30, 1988 (para 5.6);
(h) a forest research policy analysis and development group will be setup by September 30, 1988 (para 5.6);
(i) a Project Manager (Field) and the District level co-ordinatingcommittee, satisfactory to the Bank, will be appointed beforeSeptember 30, 1988 (para 5.9, 5.10); and
(j) a base line survey will be comp.eted by March 31, 1989, a mid-termevaluation report by September 30, 1992 and a PCR by the loanclosing date (para 5.13).
7.2 Signing of a consultancy agreement with the FAO or consulting firmsfor forestry strategy studies and for technical assistance for forestinventory satisfactory to the Bank, is proposed as a condition of loaneffectiveness (para 3.4, 3.9).
7.3 Signing of consultancy agreements for providing technical assistancefor forestry research, Uppe.- Solo (Wonogiri) watershed protection and nature

- 35 -
conservation components, are proposed as conditions of disbursement for therespective components (para 3.10, 3.15, 5.8).
7.4 With the above actions and assurances, the proposed project issuitable for a Bank loan to GOI of US$34 million equivalent for 20 years witha grace period of 5 years at the standard variable interest rate.

ANNEX 1- 36 - Page 1 of 22
INDONESIA
FOREST UTILIZATION AND MANACEMENT IN INDONESIA
DEVELOPMENT STRATEGY STUDY
Terms of Reference
I. BACKGROUND
Indonesian's forests play a major role in economic development insustaining agricultural productivity and protecting the environment.
While logging for export has, in the past, been the major element ofIndonesia's forest industries subsector, the Government ban on log exportswhich took effect in 1985, has shifted the emphasis to domestic processing.Primary forest industries (pulp and paper, sawmilling and wood-based panels)employed an estimated 160,000 persons in 1985. In addition, exports ofprimary forest products, mainly plywood, were second only to oil in terms ofexport revenues, earning some US$1.7 billion in 1986.
Forest Resources
A forest/land use plan (TGHK) has been formulated by MOF based on aconcensus agreement between agencies such as Forestry, Lands, Agriculture,Public Works, Planning and Transmigration, with the following results:
Table 1
Classification Area (Millions of Hectares)
Protective forests 30Nature conservations 19Production forest 64Conversion forest 31Total forest area 144
A total of 144 million ha of forest has been designated as officialforest land under the Basic Forest Law No. 5 of 1967, and the responsibilityassigned to the Minister of Forests. These figures are today accepted as thebest estimate but they need to be improved. About 15 to 30 million ha out ofa total of 64 million ha of production forests have already been exploited.

- 37 - ANNEX 1Page 2 of 22
Despite the apparent abundance of Indonesia's forest resourcesincreasing population and constant pressure for conversion of forest land toagriculture are today raising doubts about Indonesia's ability to meet therapidly rising domestic demand for industrial forest products (sawn lumber,veneer, plywood pulp and paper). By the year 2020 preliminary calculationssuggest that the domestic market will be consuming all of the sustained yieldoutput from the natural forests leaving nothing for export. (see Table 2).
Table 2: INDONESIA - DOMESTIC SUPPLY AND DEMANDSITUATION FOR INDUSTRIAL FOREST PRODUCTS
1985 2000 2020
Sawntimber (000m3) 4,500 7,200 8,600Plywood/panels (00m3) 1,200 2,500 3,700Paper, paperboard (OOOMT) 680 1,220 2,200Industrial roundwood equivalentrequirements to meet domesticdemand (OOOm3) 26,000 46,500 63,500
Availability of industrial woodfrom natural forest area of60 million ha approx. operatedon a sustained yield basis 60,000 60,000 60,000
Surplus or deficit 000m3 +46,000 +26,500 -3,500
Source: IBRD Appraisal Mission Estimate.
Given Indonesia's commanding position in the tropical hardwood trade and thepotential of the forest resources to go on contributing to foreign exchangeearnings and economic development GOIs Ministry of Forestry plans to introducemore intensive natural forest management and to establish fast growing planta-tions. The current proposals are to convert about 10 percent of theproduction forest area (i.e. 6 million ha) to fast growing industrial planta-tions. About 1.4 million hectares of plantations have already been planted(mainly teak in Java and in Sumatra).
Changing Structure of Indonesia's Forest Industries
Partly as a result of its log export ban the structure ofIndonesia's forest industries and the type of output have changed dramaticallyin the last decade:
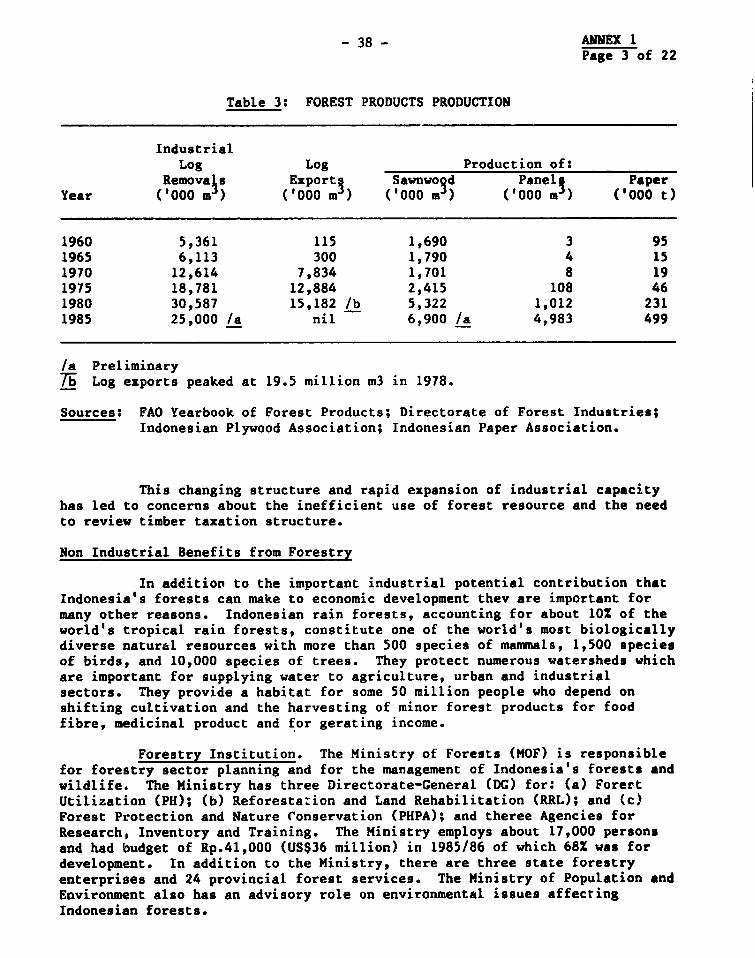
- 38 - ANNEX 1Page 3 of 22
Table 3: FOREST PRODUCTS PRODUCTION
IndustrialLog Log Production of:
Removals Export Sawnwo3d P;neli PaperYear ('000 m>) ('000 m') ('000 m ('000 m ('000 t)
1960 5,361 115 1,690 3 951965 6,113 300 1,790 4 151970 12,614 7,834 1,701 8 191975 18,781 12,884 2,415 108 461980 30,587 15,182 /b 5,322 1,012 2311985 25,000 /a nil 6,900 /a 4,983 499
/a PreliminaryTh Log exports peaked at 19.5 million m3 in 1978.
Sources: FAO Yearbook of Forest Products; Directorate of Forest Industries;Indonesian Plywood Association; Indonesian Paper Association.
This changing structure and rapid expansion of industrial capacityhas led to concerns about the inefficient use of forest resource and the needto review timber taxation structure.
Non Industrial Benefits from Forestry
In addition to the important industrial potential contribution thatIndonesia's forests can make to economic development thev are important formany other reasons. Indonesian rain forests, accounting for about 10X of theworld's tropical rain forests, constitute one of the world's most biologicallydiverse natural resources with more than 500 species of mammals, 1,500 speciesof birds, and 10,000 species of trees. They protect numerous watersheds whichare important for supplying water to agriculture, urban and industrialsectors. They provide a habitat for some 50 million people who depend onshifting cultivation and the harvesting of minor forest products for foodfibre, medicinal product and for gerating income.
Forestry Institution. The Ministry of Forests (MOF) is responsiblefor forestry sector planning and for the management of Indonesia's forests andwildlife. The Ministry has three Directorate-General (DG) for: (a) ForertUtilization (PH); (b) Reforestation and Land Rehabilitation (RRL); and (c)Forest Protection and Nature Conservation (PHPA); and theree Agencies forResearch, Inventory and Training. The Ministry employs about 17,000 personsand had budget of Rp.41,000 (US$36 million) in 1985/86 of which 68% was fordevelopment. In addition to the Ministry, there are three state forestryenterprises and 24 provincial forest services. The Ministry of Population andEnvironment also has an advisory role on environmental issues affectingIndonesian forests.

- 39 - ANNEX 1Page 4 of 22
Sectoral Problems and Constraints
Depletion of Resources. Between 1968 and 1979, extraction of logsfrom Indonesian forests accelerated from a level of 5 million m3 p.a. to27 million m3 p.a. While a ban on log exports initially reduced extraction,with the rapid development of wood processing industries, log extraction hasagain reached a level of 25 million m3 p.a. Most of these logs are removedfrom fragile tropical rain forests, and this has raised concerns about thedestruction of these forests and the impact on their biological diversity.While the mean annual increment from Indonesia's production forest is esti-mated at about 60 million m3 p.a. there is still a concern that because ofuncertainty about the effectiveness of forest management, forest resources inmore accessible areas are being depleted at a rate faster than the rate atwhich the forest can regerrrate itself. The problem is compounded by theconversion of forest land to agriculture, both by local cultivators anddevelopment programs such as the Transmigration Settlement Program. While thearea cleared has been at the rate of only about 100,000 ha p.a. (0.lZ p.a. ofthe forest area), there are international concerns about illegal logging andthe danger of forest fires caused by spontaneous settlers. The informationbase in the sector is poor, and in the absence of reliable data, estimates ofdamage are based on highly anecdotal and often unsubstantiated information.
Forest Management and Timber Concession Policies
Most of the production forest in Indonesia is managed by privatesector concessionaires under the supervision of MOF. Because of the extensivenature of the forest and the shortage of trained staff, MOF has been unable tosupervise properly the operation of these concessions, nor has it been able toestablish the right incentives for the private sector to manage these conces-sions soundly. A recent survey by GOI has shown that about 150 out of a totalof about 500 concessions, are poorly managed and many of these are underconcessionaires who have made little investment in processing. To giveconcessionaires greater stake in the longer-term viability of the forest, MOFis planning closer integration between processing plant and forest conces-sions. The legal administrative and social implications of future concessionpolicy options are a key development strategy issue on whlich COI is seekingWorld Bank and other agency advice.
Fiscal Policy. The level of tax collection from the forestry sectoris low, and has declined , frdm a nominal level of about US$20 per m3 of logproduction in 1980 to a level of US$10 per m3 in 1984. The decline in realterms is greater. The low level of taxes gives inadequate compensation to theGovernment for the depletion of its valuable natural forest resources. Bypricing wood cheaply it also doe. not give sufficient incentive to improve theefficiency of utilization of wood and wood waste. While a preliminaryanalysis shows that the wood industry could stand a doubling of tax level toUS$20 per m3, the analysis needs to be confirmed. An on-going Bank financedWood Industries Study being conducted by Atlanta Consult from West Germany hasalso recommended that a review of forestry sector fiscal policy be carriedout. The proposed development strategy study will carry out indepth analysisof the likely impact on profitability o, logging sawmilling, plywood andpaper production given increased royalty fees and it will review policy
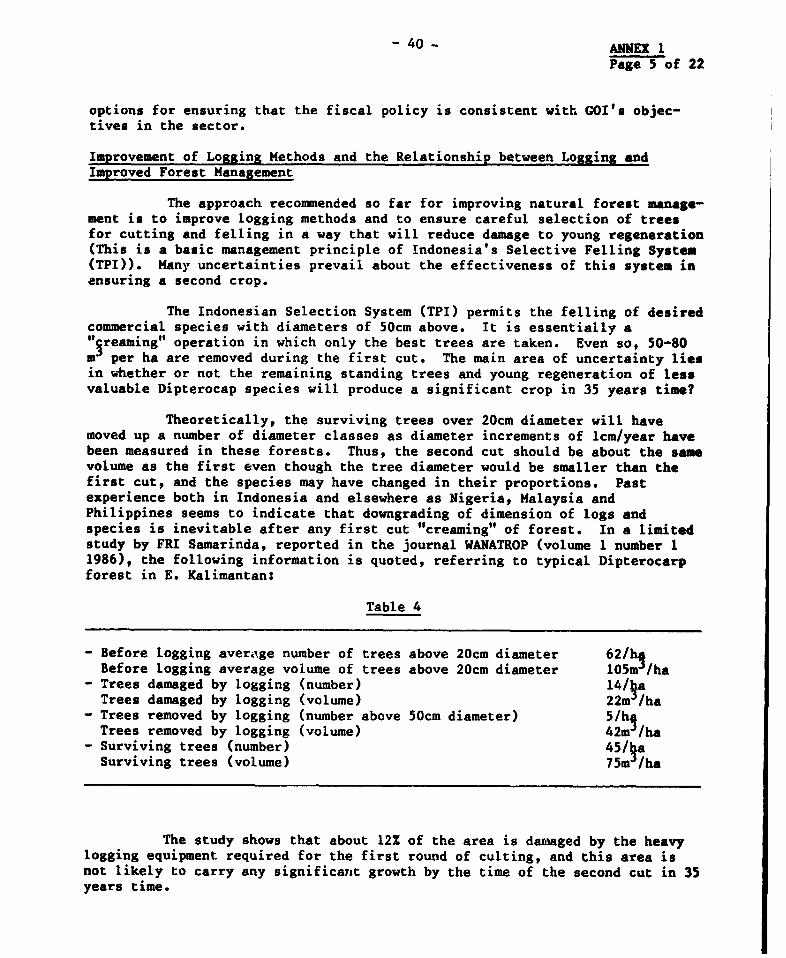
- 40 - ANNEX I
Page 5 of 22
options for ensuring that the fiscal policy is consistent with GOI's objec-tives in the sector.
Improvement of Logging Methods and the Relationship between Logging andImproved Forest Management
The approach recommended so far for improving natural forest manage-ment is to improve logging methods and to ensure careful selection of treesfor cutting and felling in a way that will reduce damage to young regeneration(This is a basic management principle of Indonesia's Selective Felling System(TPI)). Many uncertainties prevail about the effectiveness of this system inensuring a second crop.
The Indonesian Selection System (TPI) permits the felling of desiredcommercial species with diameters of 50cm above. It is essentially a"toreaming" operation in which only the best trees are taken. Even so, 50-80m per ha are removed during the first cut. The main area of uncertainty liesin whether or not the remaining standing trees and young regeneration of lessvaluable Dipterocap species will produce a significant crop in 35 years time?
Theoretically, the surviving trees over 20cm diameter will havemoved up a number of diameter classes as diameter increments of lcm/year havebeen measured in these forests. Thus, the second cut should be about the samevolume as the first even though the tree diameter would be smaller than thefirst cut, and the species may have changed in their proportions. Pastexperience both in Indonesia and elsewhere as Nigeria, Malaysia andPhilippines seems to indicate that downgrading of dimension of logs andspecies is inevitable after any first cut "creaming" of forest. In a limitedstudy by FRI Samarinda, reported in the journal WANATROP (volume 1 number 11986), the following information is quoted, referring to typical Dipterocarpforest in E. Kalimantan:
Table 4
- Before logging average number of trees above 20cm diameter 62/h1Before logging average volume of trees above 20cm diameter 105m /ha
- Trees damaged by logging (number) 14/ .aTrees damaged by logging (volume) 22m /ha
- Trees removed by logging (number above 50cm diameter) 5/haTrees removed by logging (volume) 42m /ha
- Surviving trees (number) 45/ aSurviving trees (volume) 75m /ha
The study shows that about 12X of the area is damaged by the heavylogging equipment required for the first round of culting, and this area isnot likely to carry any significanLt growth by the time of the second cut in 35years time.

- 41 - ANNEX 1Page 6 of 22
The issues currently being investigated and on which this developingstudy would focus concern the technical and economic viability and ecologicalsustainability of various the TPI and other alternative logging and forestmanagement systems.
Need for Strengthening of Forestry Planning and Administration
Overall sectoral planning is the responsibility of the Directorateof Planning in MOF. Planning capability is weak. A UNDP-funded and FAO-executed project is helping MOF strengthen its planning capacity. The projectis helping MOF develop overall sectoral plans with special reference todeveloping a model for rationalising the geographic distribution of forestindustry capacity, and evaluating alternative strategies for meeting futuredemands through various combinations of natural forest anc plantation. Theproposed study would complement this ongoing FAO study by linking it moredirectly to the forest utilization and management operations being conductedby the Directorate General for Forest Utilization. Case studies of specificconcessions operations to be carried out by the Bank financed study will givean opportunity to assess the implications of concession policy reform, changesto fiscal and forest management policy and administrative arrangement forimproved revenue collection. It would link FAO's macroeconomic studies topreparation of overall development strategy for the forestry sector and thepreparation of investment proposals for the coming Plan Period.
II. OVERALL OBJECTIVES OF PROPOSED STUDY
The overall objectives of this study are to review alternativestrategies and to make recommendations for long term development of theforestry sector and to identify key areas of policy reform that could lead tomore efficient industrial operations and improved forest management. Based onthe recommended development strategy, the study would prepare investmentproposals for possible World Bank and/or other agency financing.
The study would cover all of Indonesian forest utilization sector,including:
(a) Domestic marketing and export prospects for wood and major non-woodforest products in the form of raw materials as well as in semi andfinished products.
(b) Forest utilization industrial processing options for all majorforest industries, in the other islands as well as on Java. Thiswould cover both HPH-based - and non-HPH based industries andincluding the pulp and paper industry. This would build on theinformation already developed in a separate World Bank financedstudy on wood industries.
1/ Forest industries which concession licencies to operate in specificforest areas.
- 42 - ANNEX IPage 7 of 22
(c) Logging and harvesting development strategy for both wood andnon-wood forest resources in the other islands as well as on Java.
(d) Resource development options (natural forest and plantation based)for all forests areas in the both in Java and in the other island.
(e) The institutional and policy framework for improved forest utiliza-tion with special reference to policy reform in the areas of conces-sion licence agreement fiscal pricing policy, and revenue collec-tion.
The study will be divided into four parts:
Phase 1 - Analysis of the Current Supply/Demand and Forestry DevelopmentSituation and of the potential for techr.ical and policy changes thatcould lead to improved efficiency in the sector.
Phase 2 - Recommendations for long term development strategy to the year2035.
Phase 3 - A recommended Action Programme for the coming 5 year PlanPeriod with special reference to changes in forest policy that could helpto ensure an orderly transition towards the recommended developmentstrategy option.
Phase 4 - Identification of a specific project(s) suitable for World Bankand/or other agency financing which would begin to implement the recom-mended development strategy, and develop TORs for feasibility studies.
Phase 5 - Feasibility studies of selected projects.
PHASE I - ANALYSIS OF CURRENT SITUATION AND POTENTIAL AREAS FOR IMPROVEMENT
Market Prospects
Utilizing, for the most part, existing sources of international andlocally available data, this part of the study would focus on analyzingpresent and estimated future demand, both domestic (local and inter-island)and overseas, for various forest products, wood and non-wood products, semifinished and finished products. The study would determine the magnitude ofthe present market and assess likely future growth of Indonesian forestutilization sector products trade as a share of world trade. Market prospectsfor various stages of utilization/processing of forest commodities would beanalyzed for the major overseas market of actual or possible relevance forIndonesia. Indonesia currently has a 30Z share of the Southeast Asia hardwoodsawrn lumber market and 58Z of the hardwood plywood trade. The marketing studywill review long-term propects for sustaining exports to year 2035 taking intoparticular consideration the changing structure of Japan's forest industriesand other emerging markets such as China, Korea and Taiwan. Also the likelycompetitiveness of Indonesian producers compared with Malaysia, Philippines,Papua New Guinea and other major tropical hardwood producers in the region.
- 43 - ~~~~ANNEX 13Page 8 of 22
The marketing study would assess Indonesia's present and possiblefuture comparative advantages in producing principal forest product (both woodand major non-wood prc.ict). These analyses would take into account the dataon production costs to be collected in Section of the study below. Also otheraspects that wn?r;,d affect the competetiveness of Indonasia producers such asavailability of raw material and other inputs, technology, management, qualitycontrol, logistical management and distribution flows, fiscal incentives, andavailability of skilled labour. Also the comparative strength of Indonesia'smain overseas competitors.
The marketing study will give special attention to the prospects forensuring sustained future supplies of wood for the domestic market which willreach about 60 million cubic meters of round wood equivalent by year 2020(i.e., about the same amount as the Government's annual allowable cut from allof Indonesia's Production Forest - See Tabie 2 above). The marketing studywill examine likely acceptability in the domestic market of the faster growingplantation timber species that are being use for replacement of the naturalforest and make preliminary projections of the price differentials betweennatural forest and plantation timber species used for production of lumberveneer plywood and other wood-based panel products. The study will examinethe extent to which investment in an accelerated plantation program of fastgrowing species could help to ensure sustained supplies of medium-lower gradeconstruction timbers for the domestic market thereby maintaining an increasedand sustainable flow of higher value natural forest hardwood, timber, veneerand plywood for export through the next century.
The marketing study would give special attention to the marketprospects for ratta, vesins, fruits and other minor forest products that arethe basis for both subsistence and income generation for many forest devellingcommunities.
Structure of Forest Processing Industry
The study would collect and evaluate existing data on the productionand distribution of forest industrial processing plants by geographicalregions, including smaller rural industries. This data would be combined withspecific forest resource information as a basis for determining the scope forclose intergration between-processing plant and the forest areas that willsupply them. Also the need to maintain an assured log supply for smaller nonintegrated sawnmills and other wood using industries.
This part of the study will be based mainly on the finding ofexisting GOI studies and particularly the Bank-financed Wood ProcessingIndustry Sector study supplemented by recent evalu P ions carried out by staffof the World Bank's Industries Project Department._ Also by the recommendedstudies on Distribution Systems for forest products recomended in Section -below.
2/ See Back-to-Office report of A. Ewing, January 27, 1987.
- 44 - ANNEX IPage 9 of 22
Distribution System for Logs and Finished Products
In order to provide a basis for decisions relating to more optimalgeographic distribution of industrial processing capacity of above, the studywill provide quantitative estimates, for current and recent years, of thelogistical management and distribution system, and marketing channels offorest products, including:
(a) Logs or round wood and processed wood products.
(b) Rattan products.
(c) Other major non-wood or minor forest products.
Estimates will be cross-tabulated by subsectors: wood, rattan, otherminor forest products, etc. by type, and by market (export or domestic), withdomestic market broken into main geographical areas.
The study will review the principal methods and costs/freight ratesof transporting products to main domestic and export markets. The adequacy ofrolling stock and vessels, and the logistics of infrastructure to handle theseshipments should also be assessed.
The study will quantify the approximate volume of end products alongthe major transport routes, analyse the general efficiency of these opera-tions, and identify these parts of the logistics chain which are major con-straints to efficient distribution. The study would recommend investment andadjustments to geographic location of industry that would result in an optimalmanagement and distribution system for forest products.
Forest Resources Supply Side Situation
The supply side of the study will include: (a) A review of existingforest inventory data in Indonesia and other sources of information, present-ing a sufficiently detailed picture of past current and potential futuresupply patterns of logs and major non-wood products in the domestic and exportmarkets for the purpose of broad long range planning.
The study will assemble all information already available on thephysical area and availability of logs from:
(a) Natural forests; and
(b) Existing and planned future plantations.
The study will project approximate availability of logs based onexisting information to the year 2035, using plausible upper and lower levelestimates of supply based on existing inventory data and past loggingexperience. The study will review GOI's ongoing and planned program of forestinventory and that proposed for support in the IBRD financed forestry projectand make recommendations for intensifying inventory work in any areas the-t arenot adequately covered by existing or proposed inventory proposals. Special
- 45 - ANNEX 1Page 10 of 22
reference will be given to limiting inventories only to those areas that arejustified for purposes of obtaining (a) an approximate overview of timberavailability for long range planning purposes, (b) short term more detailedoperational inventories covering only those areas that are likely to be loggedover in the coming decade.
The study will prepare a long term wood supply/demand balance to theyear 2035 giving special attention to the extent to which in order to ensure asustained and significant export trade, it will be necessary to supplementnatural forest log supplies with plantation grown timber.
Logging and Harvesting System
The study will assess the existing logging and non-wood extractionor harvesting (exploitation) systems under the HPH-concession system (20 yearspermit) the HPHH-system (2 years permit), clear cutting system (Java) andusing primarly existing sources of information and other related studies.
The study would evaluate and anlyze logging and extraction activi-ties and recommend strategy to optimize logging and extraction methods, andways to minimize logging/extraction wastes, including improvement/newapproach/new methods of logging and extraction of major non-wood products,i.e., rattan, gondorukem, sago, medicinal plant and other products, energy,etc.
In carrying out this review of alternative logging methods specialattention will be given to the issue of ensuring logging systems that can helpto minimize damage to young regeneration and to ensure a sustainable forestyield.
In relation to possible pricing policy reforms and adjustments tologging methods that will lead to improved forest management, economic modelswill be developed to demonstrate the likely effect on the delivered log costto mill site of the alternative logging/forest management systems working onthe hypothesis that restrictions on harvesting to ensure adequate youngregeneration raise per hectare log extraction costs (because fewer trees areto be removed and because of the need for more careful felling to avoiddamaging young regeneration). Restricted harvesting will also increase thetransportation distance over which log will have to be moved from forest tomill site. That could imply a larger radius of haulage in order to maintain amill of given size. This selective logging/management system will be comparedwith the alternative option of increasing the felling area and replanting offelled over areas.
Forest Management systems and their implications for concession license policy
The study will review the technical and economic data relating toalternative forest management systems ranging from zero silvicultural treat-ment through tArichment' planting and plantation forestry.
In particular this part of the study will examine the of technicaland economic evidence on the sustainability of the Indonesian Selective
- 46 - ANNEX 1Page 11 of 22
logging system (TPI) compared with alternative for improving the survival ofDipterocarp species by using a two story management system as involvingplanting of light hardwood. The study will develop physical species with anunderplanted dipterocarp crop and economic data that will enable a comparisonto be made of the relative financial rates of return for various forestmanagement systems ranging from zero treatment through to intensive planta-tions.
The ecological implication of these various forest managementsystems will be reviewed in particular, the ecological sustainability ofplantation monocultures taking into account their likely, increased nutrientdrain compled to an assesment of the economic viability of maintaining plan-tation productivity by periodic fertilizer application.
Concession Licence Tenure Systems
This topic will be approached in 3 ways:
(a) A review of current licences systems used in Indonesia;
(b) A review of international experienced of possible relevance toIndonesia;
(c) Case studies of specific situations in Indonesia in which the effectof application of different systems of licesing could be assessed.
The review of local systems would comprise an in-depth analysis ofthe present status of Forest Tenure System (HPH Concession, HPHH permits,industrial forest management in Java, and traditional tenure rights). Thereview of overseas concession lease systems of possible relevance to Indonesiawould include in particular to Canadian experience where various forms oflicence have been tested over the last 30 years. As a starting point formaking recommendations concerning future developed strategy and as a way oftesting out the practicability and likely economic impact of possibleincreases in royalty and/or other timber taxes.
In selecting local companies for detailed Case Study three typicalsituation will be pursued:
(a) A non-integrated forestry/forest industries situation from whichlogs are being supplied from a Government owned concession toexisting independent smaller sawmills, veneer or plywood mills. Theassumption is that in such situations the main responsibility forforest management would probably lie with the government's ForestService. (Small scale sawmillers or independent logging companieswould be unlikely investors in long-term forest management).
(b) An integrated medium-sized forest industries complex (i.e., milllinked to forest concession) probably located on Kalimantan produc-ing primarily mechanical wood products (lumber, veneer, ploywood) ina situation where the investment in logging equipment and associatedindustrial plant is quite large (say over US$5 million) and where
-47 -ANNEX 1Page 12 of 22
industrial enterprise management could be supportive of the need forreinvestment in forestry.
(c) A large size integrated pulp and paper mill, e.g., in Sumatra in asituation where the mill has a strong interest in developing a fastgrowing plantation resource to sustain its future raw materialneeds.
The Case Studies would cover the following main aspects in each ofstudy areas:
(a) A review of inventory data of the timber resources in the concession(depending on the concession area selected for study some of thisinformation may already be available);
(b) A review of marketing prospects for the industrial enterprises (bothdomestic and overseas);
(c) For the integrated situations a review of future industrial process-ing options (based on a review of inventory ard marketing dataabove) including analysis of costs and benefits and financialviability for industrial processing facilities likely to be in placeL-ve the next 10-15 years;
(d) Examination of the key policy interventions that could lead toassurance of a sustainable supply of raw material for industry viaimproved forest management, and/or plantation development; and
(e) A study of the necessary policy measures and investments that wLuldbe needed to protect the interests of local people living in theconcession and to assist them in development of marketing of minorforest products.
Based on the above review and taking into account the findings ofpricing and fiscal policies studies in Section - below - the study willrecommend policy changes to the current concession license system that couldhelp to ensure more efficient industrial operations and improved forestmanagement.
Pricing and Fiscal Policies
As an essential input to the above study of concession licenceoptions it would be necessary to review the current royalty assessment timbertaxation and forest revenue collection systems. This topic should be relatedto an analysis of logging methods and forest resource replacement costs.
The pricing studies to be carried out by the study team will examinethe incidence of stumpage and other taxes on logging, and timber manucturingopeations. The Study Team economist will develop production cost profilesfor:
- 48 - ANNEX 1Page 13 of 22
- Independent logging
- Sawmilling
- Veneer/plywood
- Pulp and paper operations
to test the sensitivity of operational profitability and competitiveness tosignificant increases in stumpage fee and other taxes on natural foresttimber. Also the likely impact of deliberately increasing the differentialroyalty between high and low value species. This part of the study willdevelop recommendations for improved forest management concession license,timber pricing and incentive policies that could encourage more intensivesustained yield forest management by both public and private sectoragencies. It will review fiscal incentive mechanisms used in other countriessuch as Brazil and Chile for encouraging private sector investment in forestmanagement and make recommendations on their relevance to Indonesian condi-tions.
PHASE II - LONG RANGE DEVELOPMENT STRATEGY OPTIONS FOR THE FORESTRY SECTOR
Based on market prospects of the forest utilization sector productsand commodities, availability of natural resources and technological andmanagerial requirements, the study would establish medium-term, five years(1989-94), and longterm, 35 years (1995-2030) objectives and priorities forthe various forest utilization and management sub sector/fields, includingwood and non-wood/minor forest products development.
The plan would include target growth rates for the princinal sectorproducts 'wnod, non-wood), geographical patter of production, the overallinvestment requirements, and the implications for income, employment andforeign exchange earnings, and environmental protection and management.
It would set out alternative development strategies that would achieveGOT's development objectives under various assumptions relating to phasing ofrelocation and raw investment in industrial processing capacity and in forestmanagement.
It would focus in particular on the issue of efficient economic"zoning" of new investment, particularly as this relates to new largescaleplantation investment, so as to ensure concentration of forestry invest-ient inlocations close to industrial enterprises with expectation of long-termsustained production and to market for industrial wood.
PHASE III - AN ACTION PROGRAM FOR THE COMING 5 YEAR PERIOD
In this part of the study a 5 year Action Program would be recom-mended for the Government for and private sector to achieve the indicativestargets/plans outlined in Part III above. The study would identify criticalconstraints to the development of the forest utilization and managementsectors and make detailed recommendations on how to eliminate and minimize
- 49 - ANNEX IPage 14 of 22
them. Similarly, the study would identify important positive measures thatgovernment and private sector would need to take.
In particular the Action Program would identify and recommend policyadjustments and investment programs that could:
(a) Rationalise distribution of forest ;ndustrial processing capacityand pinpoint those geographic areas i which investment in moreintensive forest management would bt justified.
(b) Optimise inter-island and international shipping of both major andminor forest products and identify potential areas for investment inimproved road rail or port handling facilities;
(c) Improve the concession licence framework to encourage integrationbetween large mills and forest concession whilst at the same timeensuring a sustained flow of logs for smaller non integrated mills;
(d) Modify the tariff incentive and pricing policy framework for fores-try with special references to measurer that could stimulate privatesector investment in forest protection; and;
(e) Lead to improvements in logging/harvesting/forest management systemsso as to maximise regeneration and minimise ecological damage;
(f) Facilitate institutional changes that would strengthen administra-tion of timber concessions and ensure more effective revenue collec-tion;
(g) Strengthen training and re-training of MOT staff to ensure effectiveimplementation of recommended development strategies;
(h) Strengthen data collection and dissemination of information onpricing informatio and other key data;
(i) Strengthen technical assistance support for development of thesector;
(j) Recommend effective ways of mobilising capital for facilitatingorderly relocation of industrial capacity, and accelerated invest-ment on key areas oF development such as particle board and otherwaste residue based in particular for encouraging the production ofminor forest products such as rattan joining, furniture and otherproducts of smallscale woodworking industries.
IV. PRE FEASIBILITY CAPITAL STUDY OF RECOMMENDED PROJECT(S)
For specific projec.(s) that would emerge from the study as withpotentinl for development in the coming 5 Year Plan Period. The Study willprepat:- _-liminary data on project acope, technical and economic viability*nd on suggested institutional arrangements for project implementation. Itwould identify spccific policy changes emerging from thp main ntudy above that
- 50 - ANNEX 1Page 15 of 22
could help to create a more favourable investment climate for the recommendedproject(s). It would specify terms of reference for more detailed projectpreparation studies of individual projects that would carry them on phase Vthrough to a stage ready for World Bank or other agency appraisal.
V. OUTPUT
The Study output will comprise four draft reports, correpsponding toPhase I through IV of the above Terms of Reference. Each report would bereviewed by the Steering Committee and the World Bank and the final reportwould incorporate the comments received. The approximate time table forsubmissions of the draft reports is outlined in the implementation proceduresection and in Annex 1.
Implementation of the Study
The study will be implemented by a joint GOI and foreign consultantsteam. Responsibility for administration of the study and selection of GOIexperts and local consultants will lie with the Directorate General for ForestUtilisation in the Ministry of Forestry working in cooperation with otherDirectorates of the same Ministry. Responsibility for recruitment of indivi-dual foreign consultants for organisation and management of field work andproduction of the Final Report will lie with FAO. To facilitate administra-tion of the foreign experts component and to ensure the possibility of secur-ing the technical backstopping support of FAOs Forestry Department, a TrustFund will be established between GOI the World Bank and FAO. The fund will beadministered by FAO's Jakarta office. Recruitment of all foreign expert wouldbe in consultation with GOI's Ministry of Forestry and the World Bank.
Composition of the Study Team
The study team for phases I-IV will comprise experts covering thefolloving disciplines:
Forest economics (Team leader)Data analyst anu Computer ProgrammerMarketing expert with a specialisedKnowledge of the S. E. Asian tropical hardwood tradeMinor Forest product production and marketing specialistForest inventory expertLogging and harvesting specialistSilviculturiesPulp and Paper expert 3Wood based parely 3Sawmilling expert 3EcologistSociologistInstutional p3licy/training expertTenure and Resource Pricing expertSector S/D Modelling (econometrician)
-51- ANNEX 1Page 16 of 22
About 110 - of foreign and 165 m of local consultants will beneeded for Phase I-IV, costing US$1.7 million. Phase V is expected to costUS$1.0 million. Formulation of a Detailed Work Program for each of the aboveexperts will be prepared by the Team Leader.
Steering comittee
An "Inter-departmental Steering Committee" would be formed to assistand provide an overall guidance and direction for the study. A technicalsubcomittee would be formed to supervise the implementation of the study andliaise with all the parties concerned.
ANNEX 1- 52 - Page 17 of 22
A STUDY OF THE IMPACT OF SHIFTING CULTIVATION
ON INDONESIA's PRODUCTION FOREST
TERMS OF REFERENCE
1. Justification of Project
1.1 Shifting cultivation, a practice encountered throughout Indonesia,is most often equated with "slash-and-burn agriculture". Under this cultiva-tion system, areas of primary or secondary forest are cleared, most of thefelled timber is burned, and food crops or other plants for subsistence useare established. The burning is necessary to create a clean site and fertilesoil. The cleared site is usually cultivated for one or more years, until thesoil starts to loose its fertility or until weeds take over. In the past,shifting cultivators abandoned such land and did not return until the foresthad regenerated and could be burned and cultivated again.
1.2 To ensure sustainable cultivation, it is estimated that about twentyyears of fallow are required for every year of cultivation, although thisvaries considerably according to the type of soil. In recent times, however,these rotation periods have become progressively shorter under the impact ofpopulation pressures, thus reducing the ability of the land to regenerate.Immigrants have also encroached on land under traditional forms of rotationand in some instances have introduced new forms of cultivation incompatiblewith sustainable land use. As shifting cultivation is also practiced byfamilies who plant crop in excess of their subsistence requirements and whomarket the.r product, increasing amounts of land, particularly vulnerable landon hillsides where drainage is best suited for food crops, are thus beingbrought into the production cycle and more and more forest is being des-troyed. The greatly reduced rotation cycles have led to serious degradationof the quality of vast tracts of land throughout Indonesia.
1.3 As shown in Table 1, the Department of Forestry estimates that some101 of total forest area in Kalimantan, Sulawesi and Nusa Tenggara is affectedby the acitivities of shifting cultivators. For Indonesia as a whole, FAOestimates that some 13.5 million ha are in the shifting cultivation/fallowcycle (about 11 to 12 percent oil the total forest area). This figure mayunderstate the magnitude of the problem and other observers have suggestedthat the area might be in the order of 30 million ha. As many as 1.5 millionfamilies engage in some form of shifting cultivation. It is not know with anycertainty how much new forest is actually put into agricultural production inthe process of shifting cultivation, but it may be on the order of 500,000 haannually.

-53 - AN l 1Page 18 of 22
Table 1: FOREST AREA AND FAMILIES IN SHIFTING CULTIVATION, 1984
Estimated Proportion of Number of Proportion ofArea of Total Forest Area in Families Total PopulationShifting Forest Shifting in Shifting in Shifting
Island Cultivation Area Cultivation Cultivation Cultivation------'000 ha------ ----percent--- --- ' OOC--- ----percent-----
(1) (2) (3) (4) (5)
Sumatra 924 30,2C8 3.1 262 4.9Kalimantan 4,477 44,9t0 10.0 228 17.3Sulawesi 1,352 12,- 10.5 244 12.7Nusa Tenggara 568 5,547 10.2 251 23.0
Total 7,321 93,601 7.8 985 9.2
Source: GOI/IIED Review "Forest Policies in Indonesia", Background Paper.
1.4 Shifting cultivation cannot be unambiguously defined; there areinnumerable different types of shifting cultivators and some are able toensure sustainable management practices while others are not. One factorleading to increase in shifting cultivation may be the fact that conces-sionaires can prevent the establishment of permanent crops within theconcessions. Whether the activities are traditional or not, however, it isnecessary to understand the social, cultural land tenure and economic factorsthat motivate such practices in order to minimize their destructiveness.
2. Objectives
2.1 The lone-term obiective of the study is to reduce the pressures tobring forest land under shifting cultivation, by promoting sustainable andenvironmentally stable systems of agriculture under conditions of increasingpopulation density. The study will give special attention to productionforest areas in which the inflow of shifting cultivators along logging roadscreates localimed pressure on the forest land and makes the practise ofsustained yield forestry very difficult.
2.2 The immediate objectives are:
(a) to assess the area under shifting cultivation by province;
(b) to evaluate the economic impact of such activity;
(c) to develop a typology of shifting cultivation and describe thepractices of representative groups and their claims to the landunder cultivation; and
-54 - ANNEX 1Page 19 of 22
(d) to document alternative approaches used in S.E. Asia for upgradingoroduction systems in situ and stabilizing cultivation boundaries.
Based on this assessment the consultants would recommend ways to providesubsistence cultivators with security of tenure and improved productionsystems and discuss alternative approaches for reducing environmentaldegradation with special reference tc the production forest areas whileminimizing any reduction in the welfare of local peoples. T. carrying outthis study, the capacity of the Department of Forestry to understand andaddress human and social issues will also be strengthened.
3. Project Design
3.1 It is a fundamental assumption of this study that shifting cultiva-tors represent a very diverse group including sedentary agriculturalistsengaged in marginal shifting cultivation, immigrants seeking land for perma-nent settlement, and traditional cultivators for whome shifting cultivation isthe basic mode of subsistence; and it is assumed that this diversity will bothpermit and require a broad spectrum of programs if environmental degradationis to be reduced. It is further hypothesized that the total ntumber of peopledependent entirely on shifting cultivation for their subsistence is smail, andthat these people cause relatively little harm to the environment. It follewsthat programs to upgrade the production systems of largely sedentary agricul-turalists, and to permit immigrants access to planned settlements mP-y do moreto limit resource depletion than past programs to relocate tradiLlonal shift-ing cultivators from forest concessions. These hypotheses are subject toreview. Finally, the design of the study reflects the conviction that onlyprograms based on a sound knowledge of local people and designed in consulta-tion with them will have a strong probability of success.
3.2 The proposed two-year study would be carried out by consultantsengaged by the Department of ForecLry and would consist of three phases. Inthe first phase, backgrcind iniormation would be collected on the area undershiftins cultivation, cl- zurrcnt rulez and regul^ti^ne ir.d!t-r rrgrar-i mrl y-ing to shifting cultivation. An evaluation of the economic impact of shiftingcultivation would be carried out, and a typology of shifting cultivators wouldbe developed in consultation with 'Local officials. The second phase wouldinvolve a detailed analysis of representative types of shifting cultivators,description of traditional land rights (adat), and consultation with lovalpeople on appropriate methods of upgrading agricultural systems and limiting,where possible, the need for shifting cultivation. In the third phase, policyoptions would be developed, in consultation with Government officials andlocal peoples, and the impact of proposed options evaluated. The final reportshould indicate alternative strategies for minimizing environmental degrada-tion, discuss their pros and cons and make specific recommendation onstrategies to be followed. It would identify potential projects or programssustainable for World Bank or other agency support in which the variouspossible approaches to minimized impact of shifting allocation on forestresource management could be tested.

ANNEX 1- 55 - Page 20 of 22
4. Work Plan
4.1 Phase I: Background (6 months)
(a) Analysis of Land Use DataData gathered by FAO and by the LandResources Development Centre (LRDC) under the World Bank-assistedTransmigration III/V projects can be used to analyze the area undershifting cultivation and to assess the amount of such land (i) inProtection, Conversion and Production Forest; and (ii) underdifferent land forms, i.e. steep hills (with high erosion poten-tial), flat lands, etc. LRDC data are only available for provinceswith transmigration potential, but these are also the most heavilyforested provinces. Data from this source are not available formore densely settled areas such as NTT. If shifting cultivation isa problem in these areas, the quality of existing data should beassessed and recommendations made on further studies.
(b) Other Data
Information should be collected on legislation relating to shiftingcultivation and on the history and impact of past programs intendedto address the problem. General information on land tenure, parti-cularly among shifting cultivators, should be gathered. Also,existing information describing different types of shifting culti-vators should be collected.
(c) Initial Assessment
An assessment should be made of the economic impact of shiftingcultivation in terms of losses to both the logging industry and toagriculture as a result of environmental degradation and flooding.The extent of the problem should be evaluated in different provincesand the impact of apst programs in restricting shifting cultivationshould be assessed.
(d) Preparation of Terms of Reference for Phase II
At the conclusion of Phase I, a draft report evaluating the impactof shifting cultivation and presenting a preliminary typology ofshifting cultivators would be prepared. This would lead to detailedterms of reference for Phase II which lay out a methodology forfurther study.
4.2 Phase II: Detailed Study of Shifting Cultivators (12 months).
The main objectives of this phase of the study would be to develop amore detailed picture of shifting cultivators in selected provinces; todescribe the pressures leading to shifting cultivation, and to describe andevaluate land rights and the understanding local people have of them and toexamine the intcr relaticnships between shifting cultivation and productionforest management. The team of researchers would review with the people and
- 56 - ANNEX 1Page 21 of 22
local officials, programs and policies which could potentially reduce the needfor cultivation in restricted areas or on steep slopes. To the extentpossible, the team should try to determine the area under shifting cultivationby different kinds of cultivators, although this will be difficult. The scopeof work will be set out in terms of reference developed in Phase I (4.1 'd)above), and will involve--to the greatest extent possible--an approach thatinvolves participation of the local people. The findings of this work will besunmarized in a set of background papers (with a summary report) 12 monthsafter this phase commenced.
4.3 Phase III: Preparation, Discussions and Revisions of the Main Report (6months)
In Phase III, a draft report will be prepared which describes theexisting situation, identifies policy options and assesses their impact onshifting cultivation and on the welfare of the groups involved. Ideally, theteam would recommend ways to restrict destructive cultivation among people whohave alternative sources of income, and to permit such cultivation where noviable alternative exists. Special attention would be paid in the part of thestudy to identifying the potential of industrial cost crop tree farming toprovide a livelihood for shifting cultivators along the lines of the success-ful scheme in Philippines. In about month 15, the draft report includingassessment and options would be presented to Government. The report wouldthen be discussed with local peoples, Government officials, the Bank and otherinterested parties, and revised in light of their recommendations and objec-tions. A final report would be issued two years after the study commenced.
5. Outputs
5.1 At the conclusion of Phase I, a report addressing the followingbroad topics will be prepared (for details, see section 4):
(a) an assessment of svran tinder shifting cultivation and a review ofexisting literature on the subject;
(b) preparation of a preliminary typology of shifting cultivators; and
(c) a methodology and terms of reference for studying these groups inPhase III.
5.2 At the end of Phase II Background Papers should be produced on thegroups studied which identifies policy options and assess their impact onshifting cultivation practices and the forest and on the welfare of the groupsinvolved. An executive summary will describe the findings of these reports.
5.3 At the end of Phase III a final report will be prepared whichincorporates in greater detail the concerns and recommendation of localpeoples, Government officials and other interested parties and which recom-mends strategies which optimize the forest and social concerns. Phase III ofthe report will identify provide situation in the production forest areaswhere a project(s) couid be introduced to Lest ouL Lhe recummeIIdaLiunu uL' L;11
study. It will define the broad scope of such a project(s) possible phasingand likely costs and return.
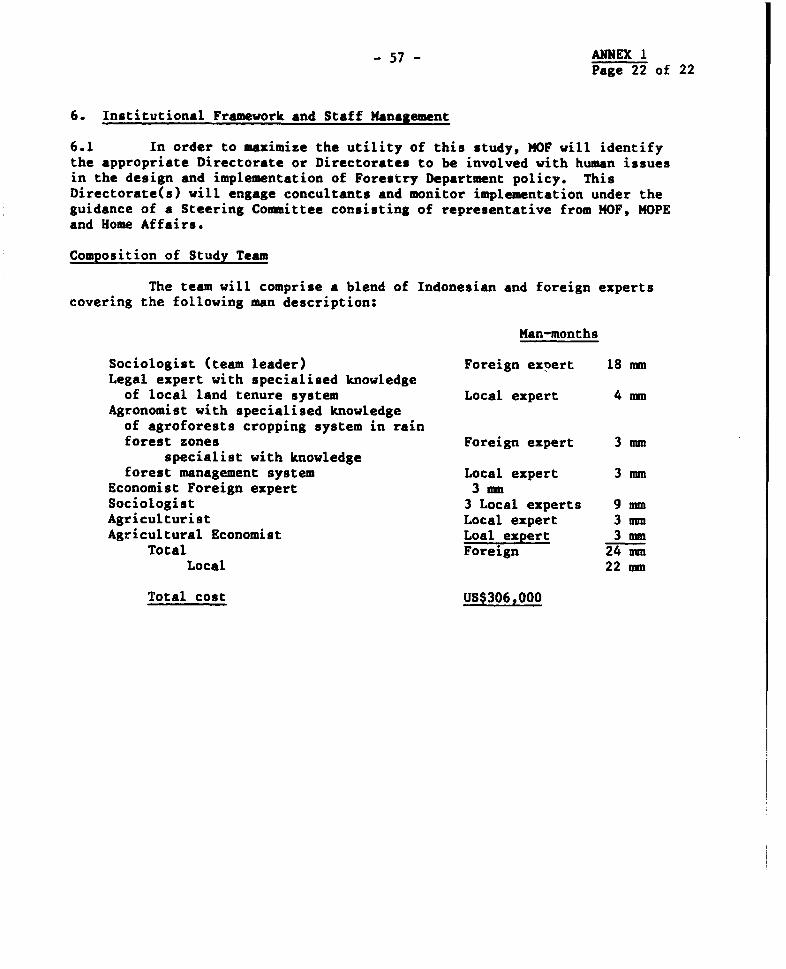
57 - ANNEX 1Page 22 of 22
6. Institutional Framework and Staff Management
6.1 In order to maximize the utility of this study, MOF will identifythe appropriate Directorate or Directorates to be involved with human issuesin the design and implementation of Forestry Department policy. ThisDirectorate(s) will engage concultants and monitor implementation under theguidance of a Steering Committee consisting of representative from MOF, MOPEand Home Affairs.
Composition of Study Team
The team will comprise a blend of Indonesian and foreign expertscovering the following man description:
Man-months
Sociologist (team leader) Foreign exnert 18 mmLegal expert with specialised knowledgeof local land tenure system Local expert 4 mm
Agronomist with specialised knowledgeof agroforests cropping system in rainforest zones Foreign expert 3 mm
specialist with knowledgeforest management system Local expert 3 mm
Economist Foreign expert 3 mmSociologist 3 Local experts 9 mmAgriculturist Local expert 3 mmAgricultural Economist Loal expert 3 mm
Total Foreign 24 mmLocal 22 mm
Total cost US$306,000
_58- ANNEX 2Page 1 of 2
TECHNICAL ASSISTANCE FOR FOREST INVENTORY
TERMS OF REFERENCE
Background
The Government of Indonesia (GOI) is negotiating with the World Banka $34 million loan, for a Forestry Institutions and Conservation (PIC) Projectof which the National Forest Inventory is a component.
Indonesia is one of the few developing countries in the world withsignificant forest resources which, if properly managed, can contribute woodand wood products on a sustained basis for national development as well as toa growing world market. Thus, a development objective of the government is toincrease the contribution of the forestry sector to national social andeconomic development through forestry land use planning which reconcilesconflicting claims on forest lands.
However, existing basic information on the physical and economicdimensions of the resource is inadequate, and an information system supportingforest land use and investment decisions does not exist. Consequently thistechnical assistance component will support the collection of the inventorydata in general, but will stress the development of an information system tofacilitate forestry land use planning in particular. Along with thedevelopment of the inventory database the project will develop the capacity ofthe Ministry of Forests to use forest inventory information in an efficientmanner by establishing systems and procedures for managing the databasesubsequent to its collection.
The inventory data will be stored on a Geographic Information System(GIS), which is a database management system designed to efficiently managemap-based data. The GIS technology is especially suited to forestry, whereproduction is area based and affected by complex interactions among factorssuch as stand type, site, management treatment, etc. GIS technology is widelyused by forestry agencies in North America for storing, updating, retrievingand analyzing inventory data as well integrating forestry data with other landuse data.
In Indonesia, a program to instull a comprehensive GIS in eachBAPPEDA has been initiated as part of the Land Resource Evaluation andPlanning Project (LREP) funded by the Asian Development Bank. BAKOSURTANAL isthe lead agency for the project. The GIS technology selected for the BAPPEDAsis used increasingly by forestry institutions througlhout the world. Theforest inventory GIS to be developed under this technical assistance componentwould be compatible with and complementary to the BAPPEDA system, and wouldaim to integrate forestry within the overall national and provincial planning.
ANNEX2Page 2 of 2
- 59 -
Objectives
The main objectives of the proposed Technical Assistance for theNational Forest Inventory component of FIC project are:
(i) to develop an information system to manage the forest inventory dataand produce information products to support strategic planningdecisions;
(ii) to develop the capability of the Agency for Inventory and Forest LandUse to maintain and update a forest inventory Geographic InformationSystem;
(iii) to improve the capability of the Agency for Inventory and Forest LandUse to undertake inventory projects on an ongoing basis and produceinformation products.
Inputs
1. Personnel. To assist in the implementation of the National Inventorycomponent of the FIC project and to establish a Forestry Management InformationSystem, the following inputs will be required:
- 110 man-months of international personnel, and
- 24 man-months of specialist consultants.
A detailed description of the Personnel Inputs is included in Appendix 1.
2. Training. Two study tours will be arranged for a study ofapplications of national inventory and Geographic Information Systems incountries that are advanced in the field:
A three month fellowship will be provided with a view to undertakinga pilot study of a selected area in Indonesia Digital Image Analysisand Geographic Information Systems.
3. Equipment. The consultants will prepare a GIS requirements study andsystem specifications. Procurement, installation and maintenahee will be theresponsibility of the Government of Indonesia. A preliminary list of theequipment is included in Appendix 2.
Reporting
The experts and consultants performing services in the TechnicalAssistance Component will submit a comprehensive technical report on theiractivities which will foriO L-he basis of for future continuat"on of activities,
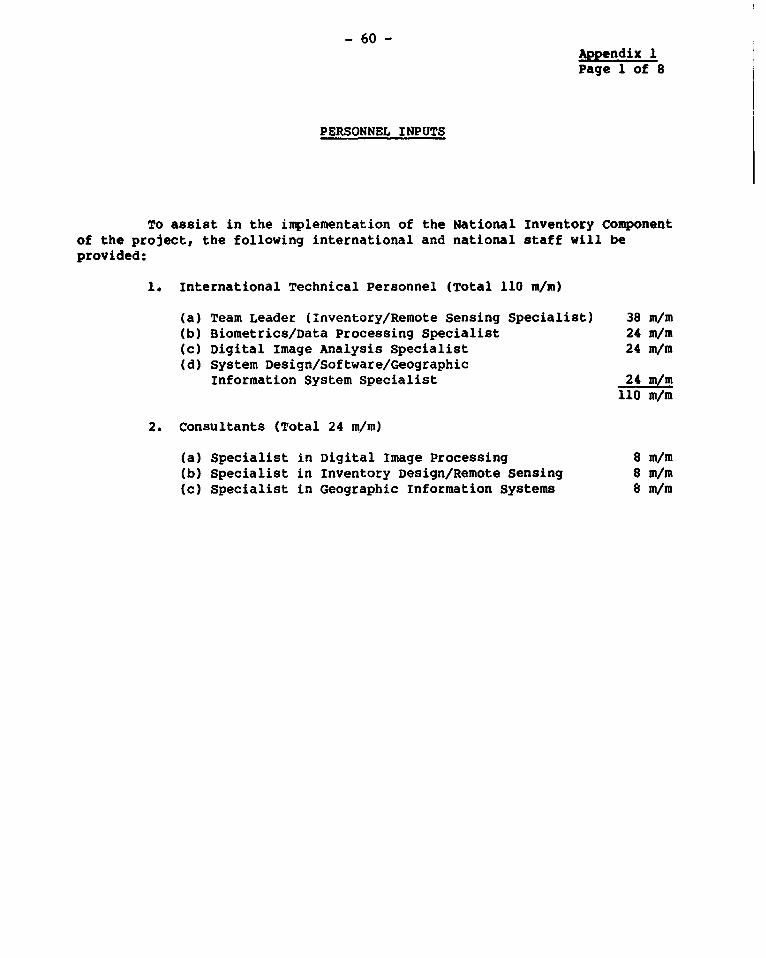
- 60 -
Appendix 1Page 1 of 8
PERSONNEL INPUTS
To assist in the implementation of the National Inventory Componentof the project, the following international and national staff will beprovided:
1. International Technical Personnel (Total 110 m/m)
(a) Team Leader (Inventory/Remote Sensing Specialist) 38 m/m(b) Biometrics/Data Processing Specialist 24 m/m(c) Digital Image Analysis Specialist 24 m/m(d) System Design/Software/Geographic
Information System Specialist 24 m/m110 m/m
2. Consultants (Total 24 m/m)
(a) Specialist in Digital Image Processing 8 m/m(b) Specialist in Inventory Design/Remote Sensing 8 m/m(c) Specialist in Geographic Information Systems 8 m/m
- 6-
Appendix 1Page 2 of 8
TERMS OF REFERENCE
Post 01 : National Forest Inventory
Title : Inventory and Remote Sensing Expert
Duty Station : Jakarta, Republic of Indonesia
Duration : 38 months
Qualifications : The incumbent will have a high level academic qualificationand Experience in forest inventory and remote sensing and at least 20
years practical relevant experience. He/she will befluent in English and have the ability to communicate andwork with people of different cultural backgrounds.
Duties In consultation with the National Project Director, theExpert will advise on all aspects of forest inventory andremote sensing. Specifically, he/she will:
(a) make a detailed conceptual plan for all the technicalcomponents of the project;
(b) prepare a report on user's data requirements followedby specifications of the national forest inventory,expected maps, output tables and database;
(c) finalize, in cooperation with the consultants, designof inventory and mapping, and a manual of inventoryand remote sensing procedures;
(d) produce, in cooperation with the Biometrics and DataProcessing Specialist, a comprehensive report on thecurrent state of forest resources, past studies andfuture prospects;
(e) guide the establishment of the geographic informationsystem and promote the use of the national forestinventory by governmental and non-governmentalagencies in development planning;

- 62 -
Appendix 1Page 3 of 8
TERMS OF REFERENCE
Post 02 : National Forest Inventory
Title : Biometrics and Data Processing Expert
Duration : 24 months
Qualifications : The iticunbent will have a high level academic degreeand Experience (preferably a PhD) in biometrics combined with several
years experience in forest inventory, data processing andstatistical analysis. The person will oe fluent inEnglish and have the ability to communicate and work withpeople of different cultural backgrounds.
: Under the direct supervision of the team leader and inclose cooperation with other members of the project, thisexpert will perform the following duties:
(a) prepare a -comprehensive plan for analysing andprocessing the statistical data of the project:
lb) prepare a system design for data processing;
it) astist in the development of volume functions andyAeld models;
i kr-itnt the data processing plan;
V,z) ? 1 he counterpart in applications of computers tot4yirl forest inventory problems;
4?i , rpNie a comprehensive short report on statisticalca4d processing techniques used by the project andfnYie't the softitre if not already done, for futurerft,v+e and use.
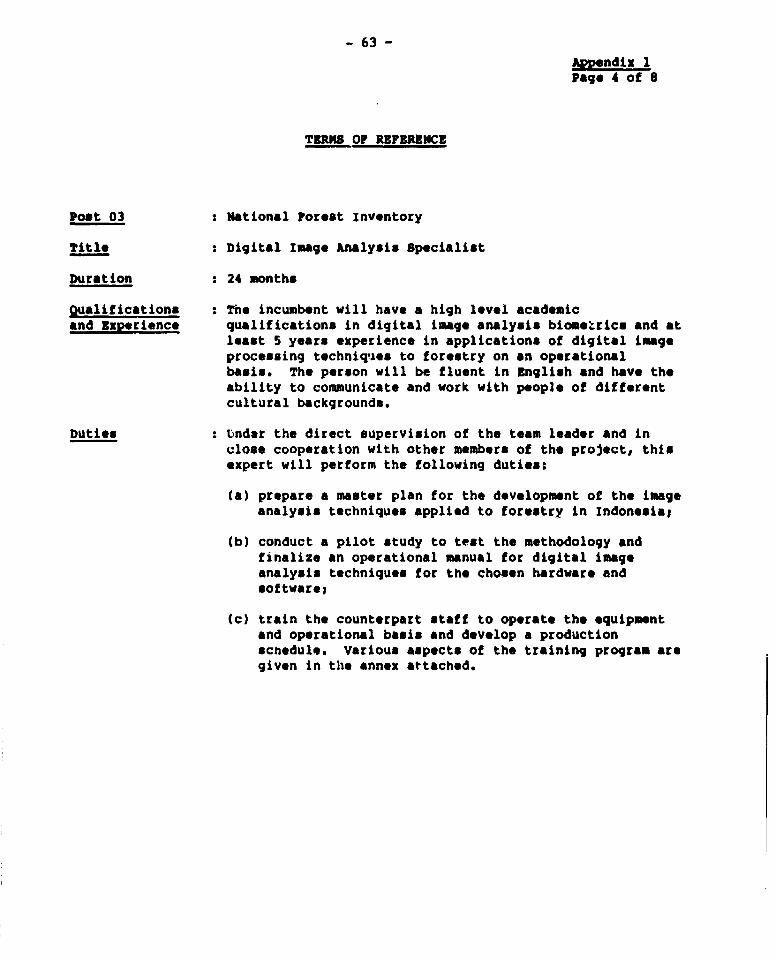
- 63 -
Appendix 1Page 4 of 8
TEM OF REFERXNCE
Post 03 : National Forest Inventory
Title :Digital Image Analysis Specialist
Duration :24 months
Qualifications : Tne incumbent will have a high level academicand Experience qualifications in digital image analysis biometrics and at
least S years experience in applications of digital imageprocessing techniqtes to forestry on an operationalbasis. The person will be fluent in English and have theability to communicate and work with people of differentcultural backgrounds.
Duties Under the direct supervision of the team leader and inclose cooperation with other members of the project, thisexpert will perform the following duties:
(a) prepare a master plan for the development of the Imageanalysis techniques applied to forestry In Indonesial
(b) conduct a pilot study to test the methodology andfinalize an operational manual for digital imageanalysis techniques for the chosen hardware andsoftware;
(c) train the counterpart staff to operate the equipmentand operational basis and develop a productionscnedule. Various aspects of the training program aregiven in the annex attached.
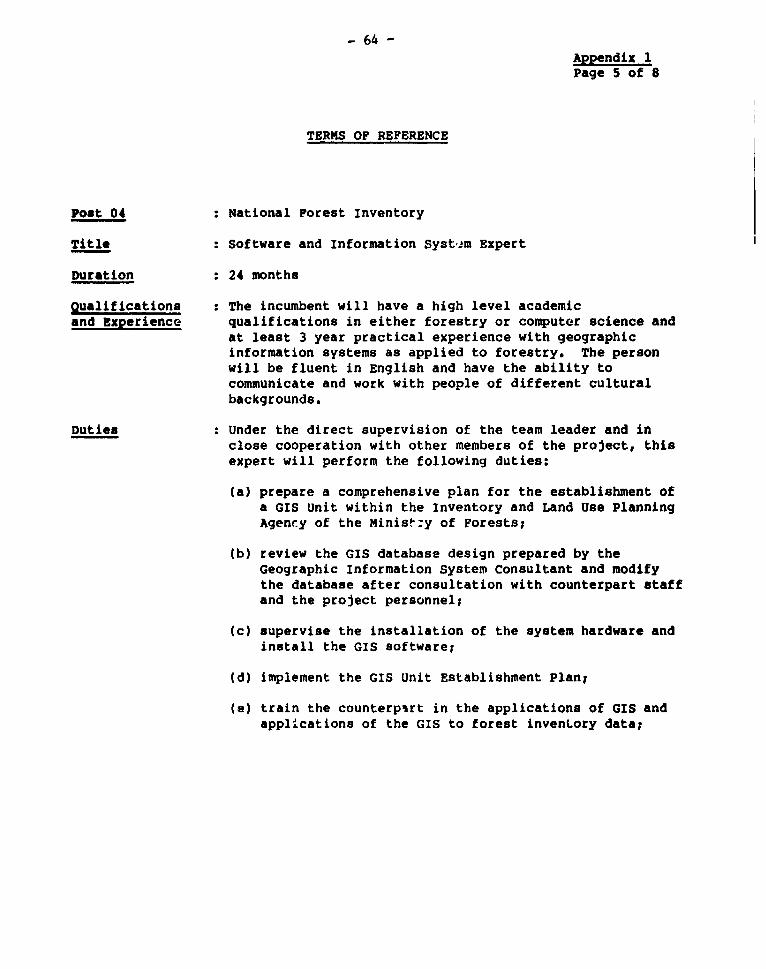
- 64 -
Appendix 1Page 5 of 8
TERMS OF REFERENCE
Post 04 : National Forest Inventory
Title : Software and Information Syst'2m Expert
Duration : 24 months
Qualifications : The incumbent will have a high level academicand Experience qualifications in either forestry or computer science and
at least 3 year practical experience with geographicinformation systems as applied to forestry. The personwill be fluent in English and have the ability tocommunicate and work with people of different culturalbackgrounds.
Duties Under the direct supervision of the team leader and inclose cooperation with other members of the project, thisexpert will perform the following duties:
(a) prepare a comprehensive plan for the establishment ofa GIS Unit within the Inventory and Land Use PlanningAgency of the Minist:y of Forests;
(b) review the GIS database design prepared by theGeographic Information system consultant and modifythe database after consultation with counterpart staffand the project personnel;
(c) supervise the installation of the system hardware andinstall the GIS software;
(d) implement the GIS Unit Establishment Plan;
(e) train the counterpirt in the applications of GIS andapplications of the GIS to forest invenLory data;

- 65 -Appendix 1Page 6 of 8
TERMS OF REFERENCE
Post 05 : National Forest Inventory
Title : consultant - Forest Inventory/Remote sensing Design
Duration : 8 months
Qualifications : The incumbent will have a high level academicand Experience qualifications and several years of practical experience
in design of national forest inventory in tropicalenvironments. The consultant will be fluent in Englishand have the ability to communicate and work with peopleof different cultural backgrounds.
Duties : Under the direct supervision of the team leader and inclose cooperation with other members of the project, thisexpert will perform the following duties:
(a) review the national forest inventory specificationsand user's needs, and prepare a sampling design fordata collection and analysis;
(b) prepare statistical procedures for the development ofvolume and growth functions;
(c) prepare a detailed short report on the statisticaltechniques used in the project and train thecounterpart staff in their use.
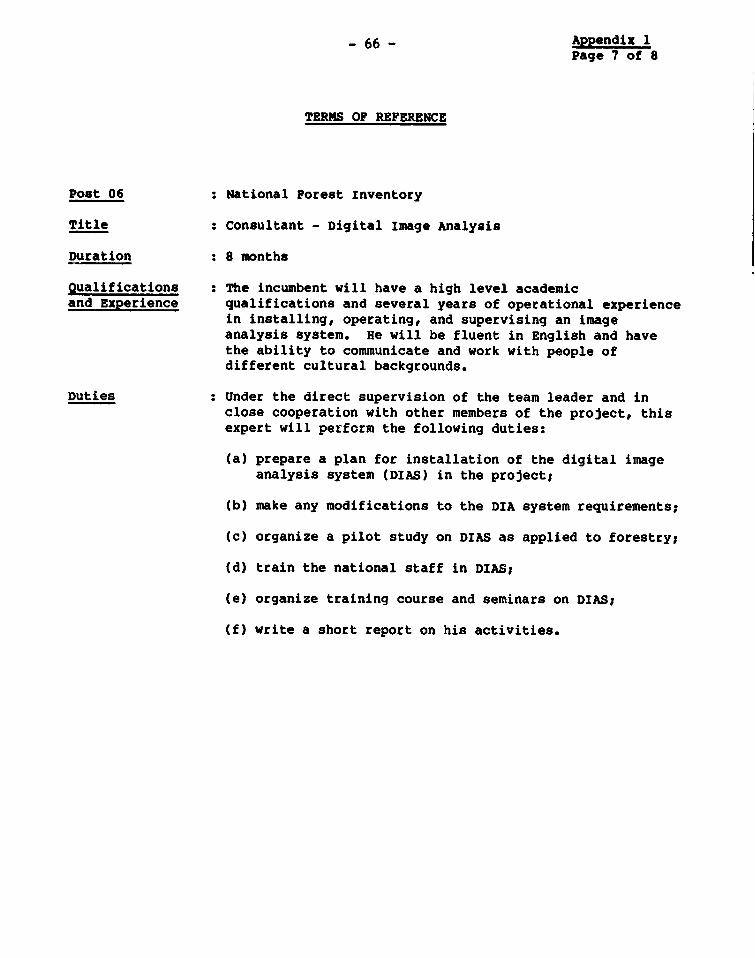
- 66 - Appendix 1Page 7 of 8
TERMS OF REFERENCE
Post 06 : National Forest Inventory
Title : Consultant - Digital Image Analysis
Duration : 8 months
Oualifications : The incumbent will have a high level academicand Experience qualifications and several years of operational experience
in installing, operating, and supervising an imageanalysis system. He will be fluent in English and havethe ability to communicate and work with people ofdifferent cultural backgrounds.
Duties : Under the direct supervision of the team leader and inclose cooperation with other members of the project, thisexpert will perform the following duties:
(a) prepare a plan for installation of the digital imageanalysis system (DIAS) in the project;
(b) make any modifications to the DIA system requirements;
(c) organize a pilot study on DIAS as applied to forestry;
Cd) train the national staff in DIAS;
(e) organize training course and seminars on DIAS;
(f) write a short report on his activities.

- 67 -
Appendix 1Page 8 of 8
TERMS OF REFERENCE
Po'st 07 : National Forest Inventory
Title : Consultant - Geographic Information Systems
Duration : 8 months
Qualifications : The incumbent will have a high level academicand Experience qualifications and several years of operational expsrience
in installing, operating, and supervising a geographicinformation system. He will be fluent in English and havethe ability to communicate and work with people ofdifferent cultural backgrounds.
Duties : Under the direct supervision of the team leader and inclose cooperation with other members of the project, thisexpert will perform the following duties:
(a) prepare a plan for installation of the geographicinformation system (GIS);
(b) make any modifications to the GIS system requirements;
(c) organize a pilot study on GIS as applied to forestry;
(d) train the national staff in GIS;
(e) organize training course and seminars on GIS;
(f) write a short report on his activities.
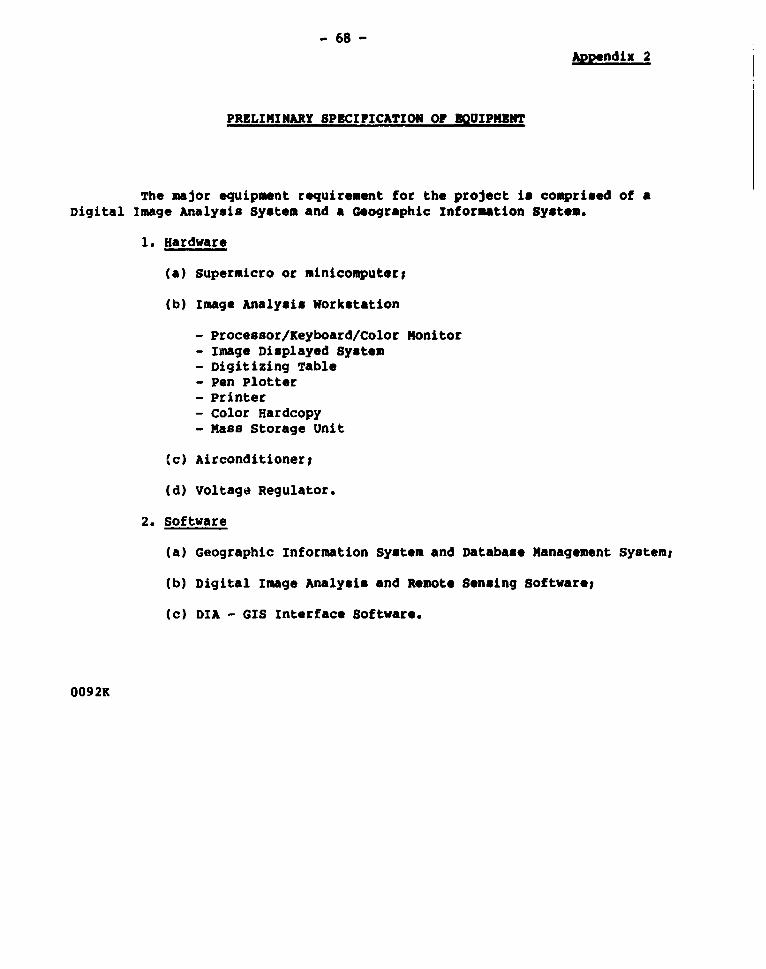
- 68 -
Appendix 2
PRELIMINARY SPECIFICATION OF EQUIPMENT
The major equipment requirement for the project im comprised of aDigital Image Analysis System and a Geographic Information System.
1. Hardware
(a) Supermicro or minicomputer;
(b) Image Analysis Workstation
- Processor/Keyboard/Color Monitor- Image Displayed System- Digitizing Table- Pen Plotter- Printer- Color Hardcopy- Mass Storage Unit
(c) Airconditionert
Cd) Voltage Regulator.
2. Software
(a) Geographic Information System and Database Management System;
(b) Digital Image Analysis and Remote Sensing Software;
(c) DIA - GIS Interface Software.
0092K
- 69 - ANNEX 3
IIDONESIA
FORESTRY INSTITUTIONS AND CONSERVATION PROJECT
Project Costs Financing Plan and Disbursement Schedules
Project Costs
Table 1 Sumary Accounts by Year - Base Costs
2 Sumary Accounts by Year - Total Costs
3 Summary Accounts - Breakdown (US$)
4 Project Components by Year - Base Costs
5 Project Components by Year - Total Costs
6 Summary Account by Project Component
7 Sectoral Strategy
8 Manpower Development
9 Shifting Cultivation
Disbursements
Table 10 Disbursement Projection
11 Disbursement Category Limits
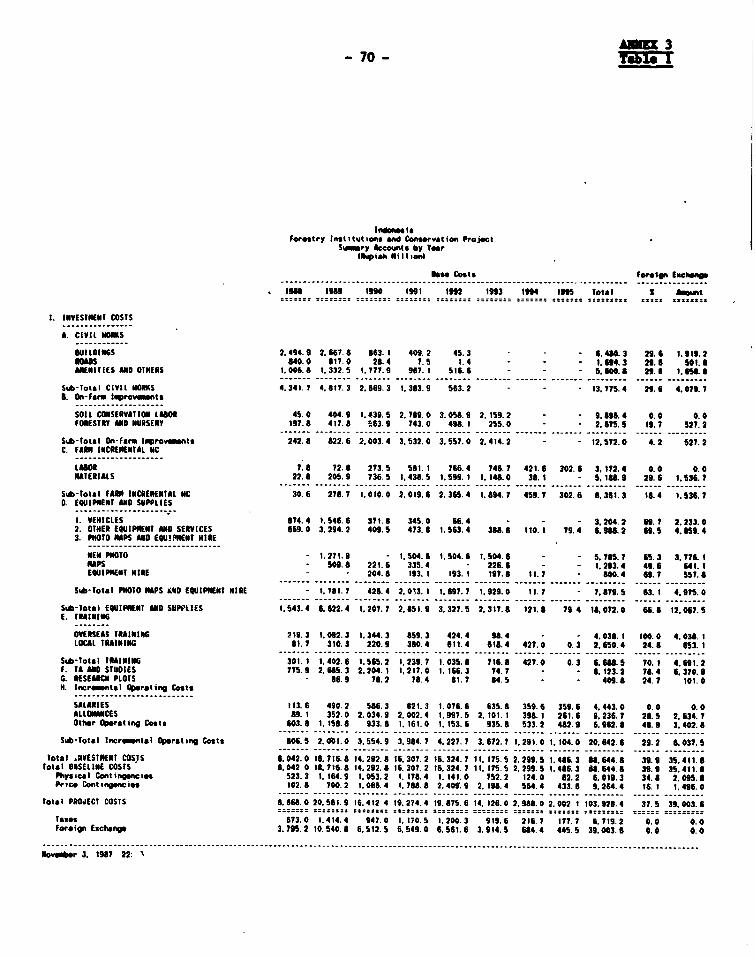
AM=E 3- 70- Ta 3 I
Fortstry Institutions ad Conrvatiou ProjectSury Acconils by Yar'
lw*iah MhlIicion)
Base Coots Forlgn Erhe_e
is" 196I 1990 1991 1992 1993 19i4 19 Total S Awmt
1. INVESTMENT COSTS
A. CIVIL Mt S
BUILDINGS 2.494.9 2. 667. 8 663. 1 409.2 45.3 4- - 6. 40.3 29.6 1. 919. 2IOADS 840.0 617. 0 28.4 7. S 1. 4 - - - 1 694.3 29.6 501.UIEINITIES AND OTHERS 1006. 1. 332.5 1. 777.9 967.1 516.6 - - a,600.8 29.6 1. H8.
Sub-Total CIVIL IORKS 4. 341. * 4,817.3 2. 669.3 1. 383.9 563.2 - - 13. 775.4 29.6 4. 079. 7B. On-Farm Improvimnts
SOIL CONSERVATION LAUOR 45.0 404.9 1.439. 5 2.789. 0 3.058.9 2. 199.2 - - 9.96. 4 0.0 0.0FORESTRY M1D NURSERY 197.6 417.8 '63.9 743.0 498.1 255.0 - - 2.67595 19.7 52?.2
Siu-Total On-farm Ilprovents 242.6 822.6 2.003.4 3.532.0 3,557.0 2.414.2 - - 12,572.0 4.2 527.2C. FAI INCREMENTAL MC
LAOR 7.6 72.8 273.5 581.1 766.4 746.7 421.6 302.6 3,172.4 0.0 0.0MATERIALS 22.8 205.9 736.5 1. 438. 5 1. 999. 1 1. 146.0 38. 1 - S. 16. 9 29. 6 1. 536. 7
Su*-Total FARM INCREIENTAL NIC 30.6 278.7 1. 010. 0 2, 019. 6 2.365.4 1. *94. 7 459.7 302.6 6. 361. 3 18. 4 1.536.70. EQUIPIENT AND SUPPLIES
1. VEHICLES 874.4 1,546.6 371.5 345.0 66.4 - - - 3,204.2 69.7 2,233.02. OTHER EQUIPIENT AND SERVICES 669.0 3,294.2 400.5 473.6 1.563.4 388.6 110.1 79.4 6,968.2 69.5 4,659.43. PHOTO RAPS AND EQUIPIENT HIRE
NEIW PHOTO - 1. 271.9 - 1,504. 6 1. 504. 6 1. 504.6 - - 5, 785.7 6. 3 3.776. 1APS - 509.8 221.6 335. 4 - 226.6 - - 1,293.4 49.6 641. 1
EQUIPMENT HIRE - - 204.8 193. 1 193. 1 197.6 11.7 - 800.4 69.7 557.8
Sub-Total PHOTO MAPS &HD EQUIPElNT HIRE - 1,761.7 426.4 2. 033. 1.697.7 1.929.0 11. 7 - 7.879.9 63.1 *4,975.0
SuA-Total EQUIPMENT MND SUPPI,ES 1. 543.4 6, 622.4 1,207.7 2,891. 9 3.327.5 2. 317. 6 121. 8 79. 4 18. 072. 0 6.6 12. 067. 5E. TRAINING
OVERSEAS TRAINING 219. 3 1, 092.3 1.344.3 659.3 424.4 98.4 - - 4. 038. 1 100.0 4. 038. 1LOCAL TRAINING 81.7 310.3 220.9 380.4 611.4 618.4 427.0 0.3 2.650.4 24.6 653. 1
Sub-Total TRAINING 301. 1 1,402.6 1.565.2 1,239.7 1.035.8 716.8 427.0 0.3 6.6U.85 70.1 4.691.2F. TA AND STUDIES 775.9 2,6 8. 3 2. 204. 1 1, 217.0 1. 166. 3 74.7 - - 8. 123.2 76. 4 6. 370. 9G. RESEAAEN PLOTS - 86.9 78.2 78.4 61.7 84.5 - - 409.8 24.7 101.0H. Incr4_ntol Operatting Costs
SALARIES 113.6 490.2 586.3 621.3 1.076.6 635.8 399.6 359.6 4,443.0 0.0 0.0ALLOANCES 69. 1 352.0 2.034.9 2. 002. 4 1. 997.5 2, 101. 1 398. 1 261.6 9.236.7 28.5 2, 634. 7Otter Operating Costs 603.8 1. 158.8 933.6 8, 161.0 1. 153.6 935.8 533.2 482.9 6.962.8 46.9 3.402.6
Sub-Total Inermtal Operat ing Costs 806.5 2, 001.0 3,554.9 3.964.7 4.227.7 3,672.7 1,291.0 1. 04.0 20.642.6 29.2 6,037.5
Total .NVESTMENT COSIS 8.042. 0 18. 716.8 14,292.8 16, 307. 2 16,324.7 11. 175.9 2,299.5 1. 486. 3 68,644. 6 39.9 35.411. 6Total BASELINE COSTS 8.042 0 18. 716.6 14,292.8 16,307.2 16,324.7 11. 179.5 2,299.5 1.486.3 68,44.8 39.9 35.411.8
Physical Continsnies 523.3 1, 164.9 1,053.2 1. 178. 4 1. 141.0 752.2 124.0 62.2 6.019.3 34.8 2. 095. 8Price Contingenieis 102.8 700.2 1, 066. 4 1, 788. 8 2. 4091.9 2. 198.4 564.4 433.6 9. 264. 4 16. 1 1, 496.0
Total PROJECT COSTS 6,668.0 20,561.9 16.412 4 19,274.4 19.875.6 14.126.0 2,988.0 2.002 t 103.928.4 37.5 39,003.6=z=:::= ::::::::::: =-=:::: :::::::: ====::::::: ::::::: -=::::::: ====== =:::
Taxes 673.0 1,414.4 947.0 1, 170.5 1.200.3 919.6 216.7 177.7 6,719.2 0.0 0.0Foreign Exchange 3.795.2 10.540.8 6,512.5 6,549.0 6.561.6 3,914.5 664.4 445.5 39,003.6 0.0 0.0
IIO_ 3. 1987 22: '

Forwtry Institutions ad Ceonvation PiojectSusmary Accounts by Yes
Totals Including Conti.pn cs Tot7ls Ineluding COnti I iessItRpish i ll ionl 4S$14$i l ion$
IOU Ion t9S0 1911 1tn2 1193 1904 Im Total It" 16 1190 19111 1 I 9192 199 114 IM Total. ,===. ====== sg ==== ======== == ===.=... .=====.= .... .... .... ..... ss= .... .... .. ==
1. INVESTlENT COSTS
A. CIVIL O5S
BUILDINGS 26U6.3 2.929.4 977.0 476.3 54.4 -, - - 7093.4 1.6 1.8 0.6 0.3 0.0 - - 4.3ROADS 937.0 939.8 33.6 9.2 1.7 - - - 1.921.3 0.3 0.6 0.0 0.9 0.0 - - - 1.2A1NITIES AND OTHERS 1, 134. 7 1. 594. 0 2,203.6 1,232.9 679.7 - - - 6,844.6 2 . 1.0 1.3 0.? 0.4 - - - 4.1
Su*-total CIVIL WORKS 4.728.0 S.463.2 3.214.2 1,718.3 735.8 - - 15,859.S 2.3 3.3 1.9 I1.0 0.4 - - - .8. On-Form Inp,ovrols
SOIL CONSERVATION LABOR 50.4 472.3 1,747.4 3,504.2 3.977.8 2.906.1 - - 12.,f` 3 0.0 0.3 1.1 2.1 2.4 1.8 - - 7.7FORESTRY AND NURSERY 220.9 482.9 674.0 915.2 633.9 335.8 - - 3,202.7 0.1 0.3 0.4 0.6 0.4 9.2 - - 2.0
Sab-lotsi On-Farm Ioprovunts 271.3 955.2 2.421.4 4.41'.4 4,611.7 3.241.9 - - 15,921.0 0.2 0.6 1.S 2.7 2.8 2.0 - - 9.6C. FAM INCRENENTAL MC
LABOR 8.3 at.0 317.0 697.0 951.3 959.3 560.6 416.4 3,930.3 0.0 0.0 0.2 0.4 0.6 0.9 0.3 0.3 2.4MATERIALS 25.2 235.1 366. 7 1,740. 1 1. 995. 6 1. 481. 9 49.0 - 6.393.6 0.0 0. I O. S 1. I 1.2 0 3 0.0 - 3.9
Sub-Tolel fARM INCRENENTAL MC 33.6 316.2 1,183.7 2.437.1 2.946.8 2.441.1 609.7 416 4 10,384.5 0.0 0.2 0.7 1.i 1.8 1.5 0.4 0 3 6.30. EQUIPIIENT AND SUPPLIES
1. VEHICLES 925.5 1. 665.6 407.4 385.1 76. 1 - - - 3,459.8 0. 1.0 0.2 0.2 0. 0 - - - 2. 12. OTHER EQUIPIENT AND SERVICES 709.3 3. 59. 9 450.2 530.5 1. 795.4 462.6 135.3 101.0 7 734.2 0.4 2.2 0. 3 0. 3 1. I 0. 3 0. I 0. 1 4. 73. PHOTO NAPS AND EOUIP'4ENT HIRE
NEN PHOTO - 1,383.2 - 1, t79.I 1. 726.2 1. 786. 6 - - 6 575. 1 - 0. 8 - 1.0 1.0 1.1 - - 4.0NAPS - 554.4 246.8 382.3 - 275.5 - - 1.453.1 - 0.3 0. 1 0.2 0.2 - - 0.EQUIPNIENT HIRE - - 235.1 225.7 232.1 246.0 15.I - 954.0 - - 0.1 0.1 0.1 0.1 0.0 - OA
S,*-Tot.l PHOTO NPS UD EQUIPMENT HIRE - 1.937.7 481.9 2.287.2 1.958.2 2,308. 1 IS. I - 8,DU9.2 - 1.2 0.3 1.4 1.2 1.4 0.0 - 5.4
Sub-Total EQUIPHENT AND SUPPLIES 1,634.9 7. 153.2 1,339.5 3.202.8 3.829.8 2,770.7 150.4 101.0 20. 182.2 1.0 4.3 0.8 1.9 2.3 1.7 0. I 0.I 12.2E. TRAINING
OVERSEAS IRAINII4G 231.5 1,164.1 1.447.0 937.1 474.7 114.4 - - 4,368.3 0.1 0.7 0.9 0.6 0.3 0.1 - - 2.6LOCAL TRAINiNG . 87. 1 341.9 251.4 446.0 740.5 775.1 554.0 0.4 3,196. 4 0. 0. 2 0 2 0. 3 0.4 0.5 0.3 .0 1. 9
St-Total TRAINING 318.6 1,506.0 1,6i98.5 1,383.1 1.215.1 U89.1 554.0 0.4 7.564.7 0.2 0.9 1.0 0.8 0.7 0.5 0.3 0.0 4.6F. TA AND STUDIES 821.1 2.88. 3 2.421.7 1.358.4 1,321.4 87.4 - - 8,898.3 0.5 1.8 1.5 0.8 0.6 A I - - 5.4G. RESEARCH PIOTS - 100.2 93. 1 96. 1 103.4 110.7 - - 503.6 - 0. 1 0.1 0.1 0.1 e. 1 - - 0.3H. Incr_mantel Operating Costs
SALARIES 122.0 546.5 66. 3 992.1 1,343.8 824.5 465.4 502.4 5.503.0 0.1 0.3 0.4 9.6 9.8 *.5 0.3 0.3 3.3ALLOWANCES 95.1 387.4 2.305. 4 2.333.6 2,403.0 2.615.5 515.3 350.6 11, 00.8 0.1 0. 2 1. 4 1.4 1. 5 I 6 0. 3 2 S.7Other Operating Costs 643.5 1.265.7 1,048.7 1,333.5 1,364.8 1.145.0 673.3 631.3 8S105.8 0.4 0.8 0.6 0.& 0.8 0.7 0.4 0.4 4.9
Sub-Total Inerimntsl Operating Costs 660.6 2.199.6 4. 040.4 4.659. 2 S,1 ;;. S 4,56S. 1 ;, 674. 0 1, 484. 3 24. 614. 6 0. S 1. 3 2.4 2. 8 3.1 2. 6 1.0 0.9 14. 9
Total INVESTMENT COSTS 8, 688. 0 20. 581. 9 16. 412. 4 19. 274.4 19. 875. 614. 126. 0 2, 988. 0 2. 002.1 103.928.4 S. 3 12.5 9. 9 1;. 7 12. 0 8. 6 1.8 1. 2 63.9
total PRJECT COSTS 6. 668.0 20.581.9 16,412.4 19,274.4 19, 875.6 14. 126. 0 2,988. 0 2. 002. 1 103, 928.4 S. 3 12. 5 9. I II. 7 12.0 8. 6 1. 8 1.2 63. 0--- - 3, -7 2 2. 0. .:: .
N; 33 1987 22.06, i
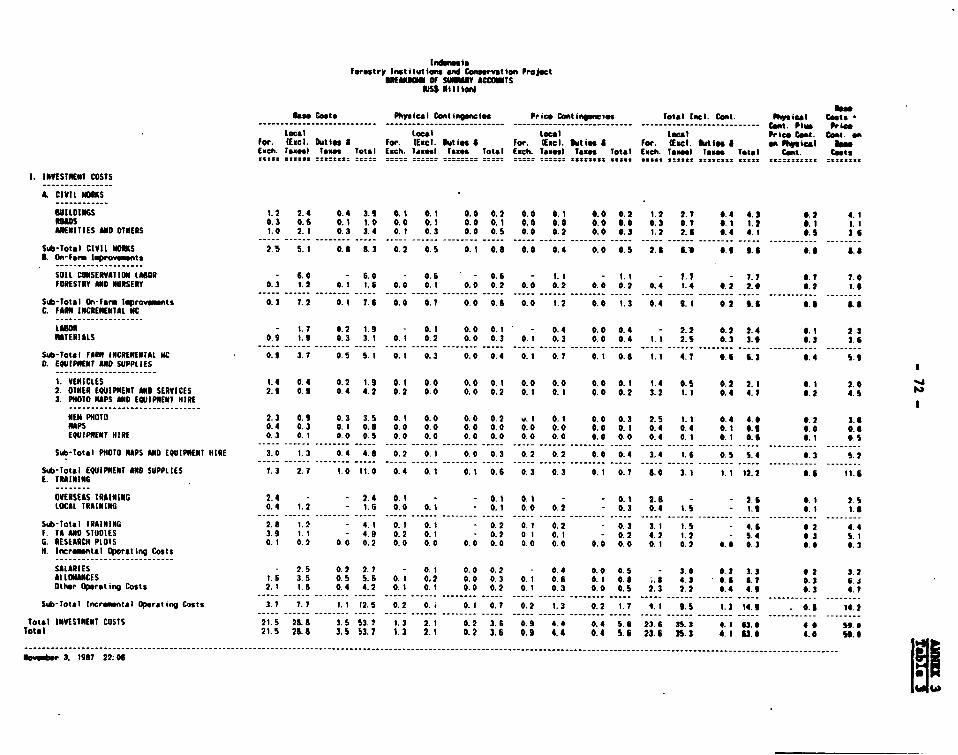
Forestry Inst itutioans aa Cosmeervat ion ProjectBOMINI OF SUNNANY ACCOUTS
Piss NilIIion)
0l.s. Costs Physical Continpnci.s Price Contingancios Total litel. Cant. phyateal Coats
Local Local toes) Local Price Cent. Coat. onfor. (Cxci. Duties 8 for. (ECcI. Duties 8 For. (Exci. Duties 8 Far. (ElCxc. Out ies S e" Phkscai uaeExch. Tax*sl taxes Total Etch. Taxesi Toxes Total Etch. Tamest Tax.s Total Each. Tax.uI taexs Total cmii. Coats
3 xx::::: :2::: SI:::~~~~~~~~~~~~~~~~~~~~~~... ..... ..... .....: -t .....h... ...... :.
I. INVESTKNEN COSTS
A. CIVIL MOAKS
BUILDINGS 1.2 2. 4 0.4 3.6 0.1 0.1 0. 0 0.2 0.0 0.1 0.0 0.2 1.2 2.?7 0.4 4.2 0.2 4.1RUGDS 0.3 0. 6 0.1 1. 0 0.0 0.1 0. 0 0.1 0.0 0. 0 0.0 0.0 0. 3 0.?7 0.1 1. 2 0.1 LI1AKNCITIES AND OTHERS 1.0 2. 1 0.3 3. 4 0. 1 0.3 0. 0 0. 6 0. 0 0.2 0.0 0.3J 1. 2 2. 6 0.4 4. 1 0. 5 3.56
Sub-Total CIVIL MORKS 2.5 5.1 0.8 II6.3 0.2 0.15 0.1 0. 8 0.0 0. 4 0.0 0.5 2.68 6.16 e.g 9. 0.0 a 8.8D. On-Form Improvesnts
SOIL CONSERVATION LAHOR - 6. 0 - 6.0 - 0. 6 - 0. 6 - 1.1 - 1.1 I 7. 7 - 7.?I 0.7 7.0FORESTRY AND NURSERY 0. 3 1. 2 0. I 1.56 0. 0 0.1I 0. 0 0. 2 0. 0 0. 2 0. 0 0.2 0. 4 1.4 0.2 2.0* 0. 2 1.6I
Sub-Total On-form Iqlovnwts 0.3 7.2 0.1 7.6 0. 0 0.7 0.0 0.8a 0.0 I. 2 0. 0 1. 3 0. 4 1. 1 0.2 6. 6 0.6 A. aC. FAIN INCREHENTAL MC
LAMO - 1. 7 0.2 1. 9 - 0.1 0. 0 0.1 - 0. 4 0. 0 0.4 - 2.2 0.2 2.4 0. 1 223NATERIALS 0. 9 1. 9 0. 3 3.1 0.1 0. 2 0. 0 0.3 0.1I 0. 3 0. 0 0.4 1. 1 2.1S 0. 3 3.6 0. 3 3. 6
Sub-Total FORM iNCRENENTAL liC 0. 9 3.7 0.5 S. I 0.1 0.3 0.0 0. 4 0.1 0. 7 0.1I 0.8a 1.1 4.7 0. 6 6.3 0.4 6.60. E4UIPENC ND M SUPPLIES
1. VEHICLES 1. 4 0. 4 0.2 1. 9 0.1 0. 0 0. 0 0.1 0. 0 0. 0 0.0 0.1 1. 4 0.6 0 .2 2. 1 0. 1 2.02. OTHER EQUIPMIENT AND SERVICES 2.9 0. 9 0. 4 4. 2 0. 2 0. 0 0.0 0. 2 0.1 0.1I 0. 0 0.2 3. 2 1. 1 0.4 4.? 0.2 4.13. PROM1 NAPS AND EQUIPMENT HIRE
MEN PHOTO 2. 3 0. 9 0. 3 3.15 0.1 0. 0 0.0 0.2 v.1I 0.1 0. 0 0.3 2.5 1. 1 0.4 4.0 0.2 3.6NAPS 0. 4 0.3 0.1I 0.8a 0. 0 0. 0 0.0 0. 0 0.0 0.0 0. 0 0.1 0. 4 0. 4 0.1 0.6t 0.0 0.6aEOIJIPRENT HIRE 0.3 0.1 0. 0 0.5 0. 0 0. 0 0. 0 0. 0 0. 0 0. 0 0. 0 0.0 0.4 0.1I 0.1I 0. 6 0.1 0.1S
Sub-Total PHOT10 NAPS ANO EQUIPYIENI HIRE 3.0 1. 3 0. 4 4.8 0. 2 0.1 0. 0 0.3 0. 2 0.2 0. 0 0. 4 3. 4 1. 6 0.5 S. 4 0. 3 S.2
Sub-Total EQUJIPNENT AND SUPPLIES 7. 3 2. 7 1. 0 11. 0 0. 4 0.1 0.1 0. 6 0. 3 0. 3 0.1 0.7 8. 0 3.1 1. 1 12.2 0. 6 11.6E. TRtAINING
OVERSEAS TRAINING 2. 4 - 2. 4 0.1 - - 0.1 0.1 - - 0.1 2. 6 - - 2. 6 0.1 2.1SLOCAL TRAINING 0.4 1. 2 - 1. a 0. 0 0.1 - 0.1 0. 0 0.2 - 0. 3 0.4 1. 5 - 1.6 0.1 1.8a
Stb-Total TRAINING 2. 8 1. 2 4. 1 0.1I 0.1 0.2 0.1 0. 2 0.3 3.1 1. 5- 4. 6 0 2 4. 4F. TA ANDOSIUDIES 3.9 1.1 I 4. 9 0. 2 0.1 - 0. 2 0 1 0.1 I 0.2 4. 2 1.2 - 5.4 0J S.1IG. RESEARCH PtOIS 0. 1 0.2 0. 0 0. 2 0. 0 0. 0 0.0 0. 0 0. 0 0. 0 0. 0 0.0 0. 1 0.2 0.0 0.3I 0.06 0. 3H. Incremental Operating Costs
SALARIES - 2.65 0.2 2. 7 - 0.1I 0. 0 0. 2 0.4 0. 0 0. 5 - 3. 0 0. 3 3.3 0.2 3.2ALLOMANCES 1. 6 3.15 0.5 S. 6 0.1I 0. 2 0. 0 0. 3 0.1I 0. 6 0. I 0.8a ".a 4.3 0. 6 6.?7 0.3S S.4Other Operating Costs 2. 1 1.8a 0.4 4. 2 0.1I 0.1I 0. 0 0.2 0.1I 0. 3 0.0 0. 5 2. 3 2. 2 0.4 4.6 0.3 4.?
…- - - - - - - - - - - - - - - - - - - - - - - - - -- - - - - - - - - - - - - - - - - - - - - - - - - - - - - - -Sub-Total Incrimnntal Oparating Coats 3. 7 7. 7 1. 1 12.5 0. 2 0. 4 0.1 0.?7 0.2 1. 3 0.2 1. 7 I,1 6.5 1. 3 14.6 . 0.8 14.2
…- - - - - - - - - - - - - - - - - - - - - - - - - -- - - - - - - - - - - - - - - - - - - - - - - - - - - - - - -Total INVESINENT COSTS 21.65 28.8 3.5 13.7 1. 3 2. 1 0.2 3. 6 0.92 4. 4 0. 4 5. 6 23. 6 31. 2 4. 1 63. 0 4 0 10.0
Total 21.6 28.89 3.6 5 3.7 1. 3 2. 1 0. 2 3. 6 0. 9 4. 4 0. 4 1. 6 23.6 35. 3 A. 1 63.0 4.0 50.0
Nowgibr 3. 1987 22: 06
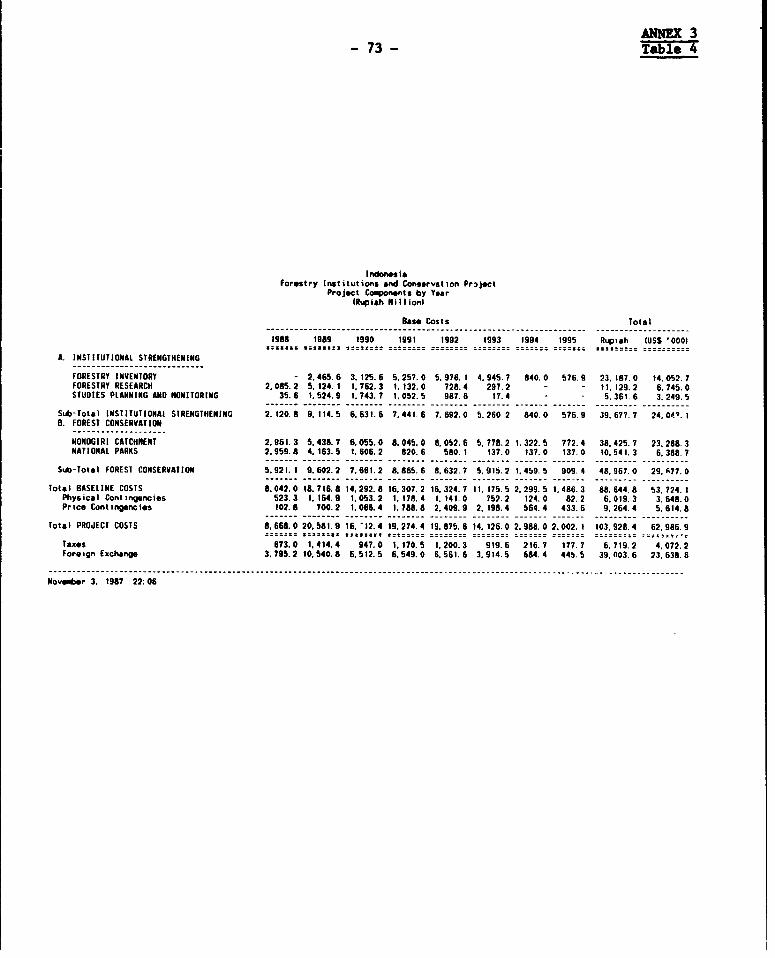
ANNEX 3-73 - Table 4
I ndones iaForestry Institutions and Conservation Pr,ject
Project Cosponents by Year(Rupish Million)
Base Costs Total
1988 1989 1990 1991 1992 1993 1994 1995 Rupiah (USS '0001
A. INSTITUTIONAL STRENGTHENING
FORESTRY INVENTORY - 2.465. 6 3. 125.6 5. 257.0 5,976. 1 4,945.7 840.0 576.9 23. 187.0 14 052. 7FORESTRY RESEARCH 2,085.2 5. 124. 1 1.762.3 1. 132. 0 728.4 297.2 - - 11, 129.2 6. 745.0STUDIES PLANNING AND MONITORING 35.6 1.524.9 1.743.7 1,052.5 987.6 17.4 - - 5.361.6 3,249.5
Sub-Total INSTITUTIONAt STRENGTHENING 2. 120.8 9, 114.5 6.631.6 7.441.6 7.692.0 5.260.2 840.0 576.9 39.677.?7 2404 1B. FOREST CONSERVATION
NONOGI RI CATCHNENT 2.961. 3 5.438.7 6.0550. 8,045. 0 8,052.6 5. 778.2 1,322.5 772.4 38, 425. 7 23, 288. 3NATIONAL PARKS 2,959.8 4, 163.5 1.606. 2 820. 6 580. 1 137.0 137. 0 137.0 10,541.3 6.388. 7
Sub-Total FOREST CONSERVATION 5.921. 1 9,602.2 7,661.2 8.865. 6 8,632.7 5,915.2 1,459. 5 909. 4 48,967.0 29. f77 0
Total BASELINE COSTS 8.042.0 18, 716.8 14, 292.8 16. 307.2 16,324.7 11. 175. 5 2. 299. 5 1,486.3 88.644.8 53 724.1Physical Contingencies 523.3 1,164.9 1,053.2 1,178.4 1, 141.0 752.2 124.0 82.2 6.019.3 3.648.0Price Contingencies 102.8 700.2 1.066.4 1.788.8 2,409.9 2, 198.4 564.4 433.6 9. 264.4 5,614.8
Total PROJECT COSTS 8,668.0 20,581.9 16. 12.4 19. 274. 4 19,875.6 14. 126.0 2.988.0 2.002. 1 103,928.4 62,986.9:=::::: :::::::: ::::::z: :======= ==z====== ==z=======-:::: ===x=:=: =:::===:: :::::::::
Taxes 673.0 1,414.4 947.0 1.170.5 1,200.3 919.6 216.7 177.7 6,719.2 4,072.2Foreign Exchange 3,795.2 10,540.8 6.512.5 6.549.0 6,561.6 3.914.5 684.4 445.5 39,003.6 23,638.6
November 3. 1987 22:06
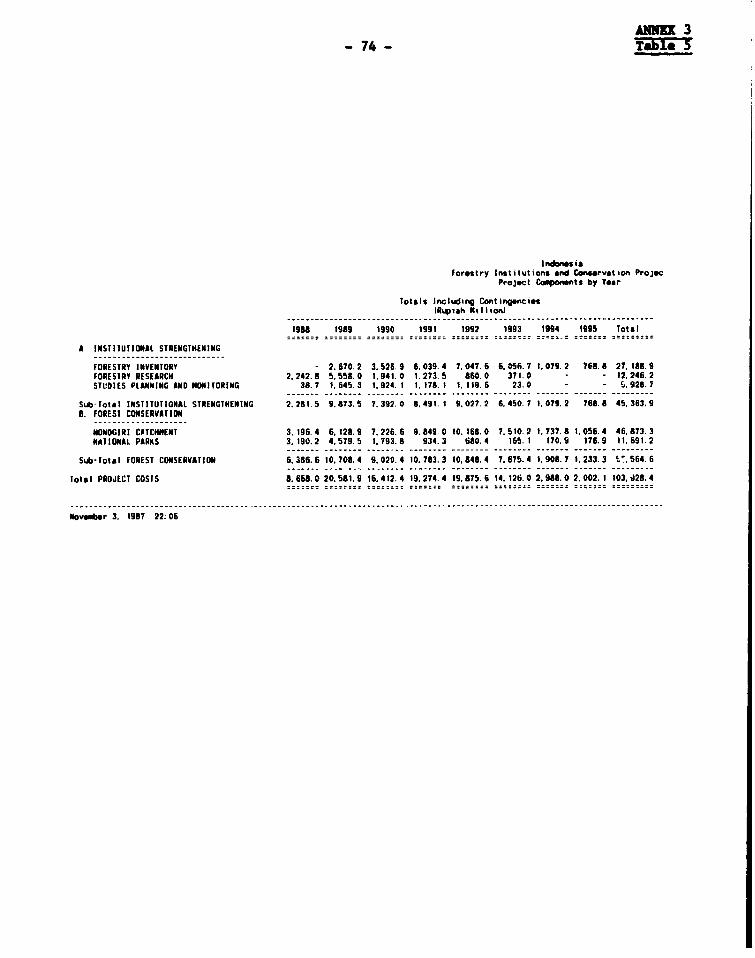
ARMEX 3-74- Table
Forestry Institutions And Consrvation ProjecProjoct Coonents by YoVr
Totals Including Contingencies19u43ah Ni I lioni
19U 1989 1990 1991 1992 1993 1994 1995 Total
A INSTITUTIONAL STRENGTHENING
FORESTRY INVENTORY - 2,670. 2 3.526. 9 6,039. 4 7.047. 6 6,056.7 1.079. 2 768.8 27. 188.9FORESTRY RESEARCH 2,242.8 5.558.0 1.941. 0 1.273. 5 860.0 371.0 - - 12,246.2STIDIES PLANNING AND MITORING 38.7 1,645.3 1,924. 1 1, 178. 1 1, 119.6 23.0 - - £,928.7
Sub-Total INSTITUTIONAL STRENGTHENING 2.281.5 9,873.5 7.392.0 8.491. 1 9,027.2 6.450. 7 1,079.2 768.8 45.363.9B. FOREST CONSERVATION
NONOGIRI CATCHENNE 3, 196.4 6, 128.9 7,226. 6 9.849.0 10, 168.0 7,510.2 1,737.8 1,056.4 46, 873. 3NATIONAL PARKS 3,190.2 4.579.5 1.793.8 934.3 680.4 165.1 170.9 176.9 11.691.2
Sub-Total FOREST CONSERVATION 6,386.6 10,708.4 9,020.4 10. 783.3 10,648.4 7,675.4 1,908.7 1.233. 3 ''. 564 6
lote I PROJECT COSTS 8.668.0 20.581.9 16.412. 4 19. 274. 4 19,875.6 14. 126.0 2,988.0 2.002. 1 103. 928. 4
November 3. 1987 22:06

ANNJX 3- 75 - Table 6
InndonesisForestry Institutions and Consarvation Project
S_ry Account by Project Coonent(Rupiah Million)
INSTITUTIONAt STRENGTHENING------------------------------- fOREST CONSERVATION Physical
STUDIES ------------------- ContingenciosFORESTRY FORESTRY PLANiNIW AND WONOGIRI NATIONAL -------------INVENTORY RESEARCH MONITORING CATCHNENT PARKS Tot)l S 4unt
1. INVESTNENT COSTS
A. CIVIL WORKS
BUILDINGS 320.3 1.854.0 - 668.7 3,637.3 6.480.3 5.0 324.0ROADS - 12.8 - - 1.681.5 1.594.3 10.0 169.4AMENITIES AND OTHERS - 671.8 4,888.2 40.9 5,600.8 14.2 792.7
Sub-Total CIVIL WORKS 320.3 2.538.5 - S.556.9 5.359.7 13.775.4 9.3 1.286.2B. On-Farm Irprovemnts
SOIL CONSERVATION LABOR - - - 9.896.4 - 9,896.4 10.0 989.6FORESTRY AND NURSERY - - - 2. 675.5 - 2. 675.5 10.0 267.6
Sub-Total On-Farm lprovemnts - - - 12,572.0 - 12. 572.0 10.0 1.257.2C. FARM INCREMENTAL WC
LABOR - - - 3.172.4 - 3.172.4 5.0 158.6MATERIALS - - 5, 188.9 - 5. 188.9 9. 1 470.2
Sub-Total FARM INCREMENTAL WC - - - 8. 361. 3 - 8,361.3 7.5 628.80. EQUIPMENT AND SUPPLIES
1. VEHICLES 367.8 968.4 17.2 621.4 1.229.S 3.204.2 S.0 160.22. OTHER EQUIPMENT AND SERVICES 2.316.2 2,330.7 147.9 1.013.1 I1 180.4 6,988.2 S. 1 358. 13. PHOTO MAPS AND EQUIPIENT HIRE
NEM PHOTO 4,513.8 - - 1,271.9 - 5.785.7 S.0 289.3MAPS 1,293.2 - - 0.3 - 1 293.4 5.0 64.7EQUIPMENT HIRE 800.4 - - 800.4 10.0 80.0
Sub-Total PHOTO MAPS AND EQUIPMENT HIRE 6,607.4 - - 1.272. 1 - 7,879.5 5.5 434.0
Sub-Total EQUIPMENT AND SUPPLIES 9,291.4 3,299.0 165.2 2.905 6 7.409.9 18.072.0 5.3 952.3E. TRAINING
OVERSEAS TRAINING 745.6 2,614.6 - 528.6 149.3 4,038.1 5.0 201.9lOCAL TRAINING 253.3 14.7 0.0 2,382.4 - 2,650.4 5.0 132.5
Sub-Total TRAINING 998.9 2.629.3 0.0 2,911.0 149.3 6.688. 5 5.0 334.4F. TA AND STUDIES 133.4 926.8 5,028.0 1.300.7 734.3 8. 123.2 5.0 406.2G. RESEARCH PLOTS - 409.8 - - - 409.8 10.0 41.0H. Incre4ntal Operating Costs
SALARIES 1.985.6 624 3 66.7 1,766.4 - 4.443.0 5. 8 259.7ALLOWANCES 7,905.3 255.4 57.2 1,018.8 - 9,236.7 5. 1 466.9Other Operating Costs 2.552.1 446. 1 44.5 2.032.0 1,888.2 6.962.8 5.6 386.6
Sub-Total Incremental Operating Costs 12,443.0 1,325.8 168.4 4,817.2 1 888.2 20,642.6 5.4 1 113.2
Total INVESTMENT COSTS 23.187.0 11. 129.2 5,361.6 38.425.7 10,541.3 88.644.5 6.8 6,019.3Total BASELINE COSTS 23, 187.0 11, 129.2 5,361.6 38,425.7 10.541.3 88,644.8 6.8 6,019.3
Physiccl Contingencios 1,239.4 624.6 273.3 3,260.0 822.0 6.019.3 0.0 0.0Price Contingencies 2,762.5 492.4 293.8 5.187.7 527.9 9.264.4 6.6 813.8
Total PROJECT COSTS 27. 188.9 12,246.2 5,928.7 46.873.3 11,691.2 103,928.4 6.4 6.633.1
Taxes 2.321.2 755.7 33.9 2.641.7 966.7 6,719.2 6.2 418.7Foreign Exchange 12.103.4 7,433.0 4,305.4 9.762. 7 5,399. 1 39,003.6 5.8 2. 178.8
llowe r 3. 1987 22:06

lormlry Ifimututs I I, ofrojmllablo PA0 Stuies Sgctoral Strategy ad i "Im.u;v PwVr
D tatad Cast Ileb(ftih Mt II i *0l
ParaI.tr
Bows Cases 8,1 S lose 000 PIhp. .... ........ . .. .... ...... .......... Cant t Gross t.u * - ,Dt *MUa Iwo twO 1i91 1992 1193 MwA 1191 fot t938 1989 ISWO 991 1997 193 1994 I99 olot Rate itch vale Account
I. limUSInI COSIS. ..... . . .
A.i" cgusrus
I .Ot*Otfl 877110 3 27 6 21 3 - -6so4 2385 0 o 09 a 1as3arhet In-g Uadt 27 6 9 2 36 a 29 6 10 0 3- O: 0 o 09 a O Ilht sng -3new Proacts 27 6 2 2 3b 6 29 5 t0 0- 39 0 05 0 9 0 IRS#0tl151 1l1tlU0 271 6 27 6 55 29 1 299 -9S 4 0 aS 09 0 65sitS6nGt 27 6 27 Ct 29 29 9 - - S94 0 9 0 11S51191612 9tm53 77 b 27 6 2 79 5 79 594 0 05 9 0 sSP1aticatG mltmlSl la 4 27 6 1 2 - - 117 29 9 Ot - S9 ? 001 0 9 0 IRSPUPM D PlO 27 6 9 2 3b t 29 t0 0 J39 0 0 0 0 01SSi iIIS 27b 92 7 b 8 29 S to 0 19 S a cS 0 9 0 1sSahl1lr 27 6 9 - 36 6 291 t0 0 11ilb a 00 0 9 0 I&S(9iO9G1St 27 6 27 6 61 29629 9 - s1 4 0 09 0 IOSoCIoGISV -27 6 27 6 - - - -29S 29 9 - - - . - 94O0 0 9 0 iaiI StIItIIt Poicty tit1 27 6 276 10 I S9 0 29 9 304 112 3 0 0M 0 9 lasT IEEM SWI i RICIG -3 6 a 9 2 9 2 - - S I 393t0010 - - 194 01909 0 S151)ltll OILII I t IIt 31 590 a968 Itsa 099 09 0 IaSIoahU 1LTUKI(S 93 5 140 2 23* - 2 tooI041t165 280 -2946 005 0 0 lIUSS6-Vo1a8 1l1lIS -6 17 213 7 96 9 - 1. 267b 64 a 61t 0 109 0 - - - -t 7S. SUPIPl l -1 1 21 2 6 1 424 19 1 to 1 67 4 2 0O 09 0 0eC AVE6 27 4 5 0 t 2 to 6 :3 6 5 6 1 4 - 20 6 0 0 0 3 009 s atD.E01 f11 -49 I 12 3 6t 4 2 9 135 - - 66 0 S 0 0 e 0OS tE. SappIES S I i I 1 s 4 6 6 67 1 34 - 1b6 0 o9 0 7 4 s 10F. uIasIItIIT St7OIES - 3 sm0 . a8S.e 9t IN 4 65o - 1. on4 Oes 9 0 ts
total IUUSIEAh COSIS 103 .0"IL2430 see0 2.- -. 32 1 71.4 5 484 9 650 - - 2563 8
tomes -703. 0 9 2 430 Mt0 - 2.3243 -?1 * U4 66 S 4 9 61 2.563 a..- - --- --- e _e .... .... Z .... . e.. Z-- e - e Z.- .
.. . . . . .... .. .... .. .. .... ..
II!1
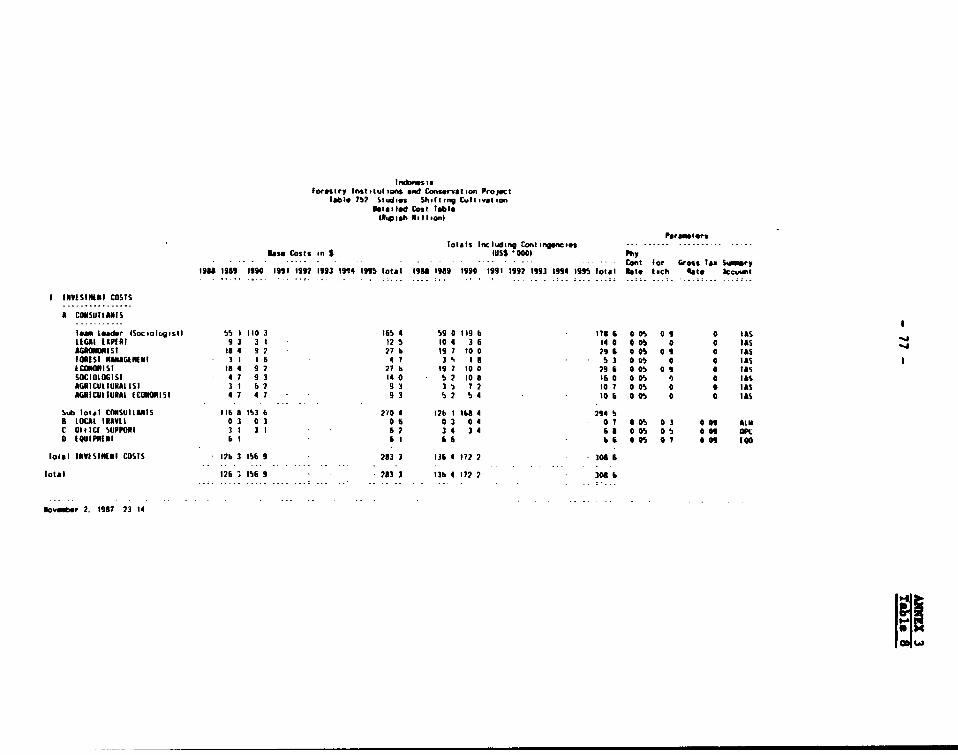
I ndoms' toforestry Institut ions and Conservatian Project
IWOl 752 Studies Sh~ifting Cialti.stionDetatied Cost Table
lIfi.pth NoItIlson)
Paramet erstotals Inc Iuding ContingeWciss------.....
Base Costs in S fus Ph0~yCont for Gross lam S.mary
1958 1989 1990 1991 1992 1993 1914 1995 lotal 1988 1INS 1990 1991 1192 1993 1994 1995 Total Note inch 4et. jccumimt
IINVISINIBI COSTS
lease ioeader lSOC.OtC4istl 55 I ItO 3 165 4 S9 0119 6 1i8 6 0 OS 0 9 0 hAsLEGICtlXPftA 9 3 3 1 125 104 3 6 140a 005 0 0 laSAMROttOKISt is4 927 27b 197 too0 29 6 a00 09 a lASfOIESI NUahGIm[NI I 1 6 47 3% aB -53 @0 0 0 lASCOtommist 15 4 9 2 27 b 19 7 to 0 29 6 0 0 0aI 0 VA%SOCIOiJOGISI 4 7 9 3 140 52 lOS 1 aS @0 OS 0 a AISAGCICUlIUMAISAL1 3 I 6 2 9 3 3'J 7 2 10 7 0 05 0 9 lASAGNICIIIIUSAi ECOIIIIISI 4 7 4 7 . 9 3 5 2 !i 4 10 6 0 @5 0 a lAS
Sub lot,ol CI1NSUIIANIS 116 A I53 6 210 4 126 I165 4 294 5iB LOCAI I1AV11 0 3 0 3 0s aI0 0 4 0 7 0 OS 03 0 01 himC OtilCi SUJPPORT It 1 3 I 6 2 3 4 3 4 61 0 5 0 a 0 fOPCA IQUlPNt1Nt1 hI 6i 66 b66 0055 017 009" (00
bolal INVESIKEWI COSTS 12b 3156 9 2533 136 4172 2- 30186
total 126i 2 156 9 253 I 13 4 172 2 301 6
Novemer 2. 1957 23 14
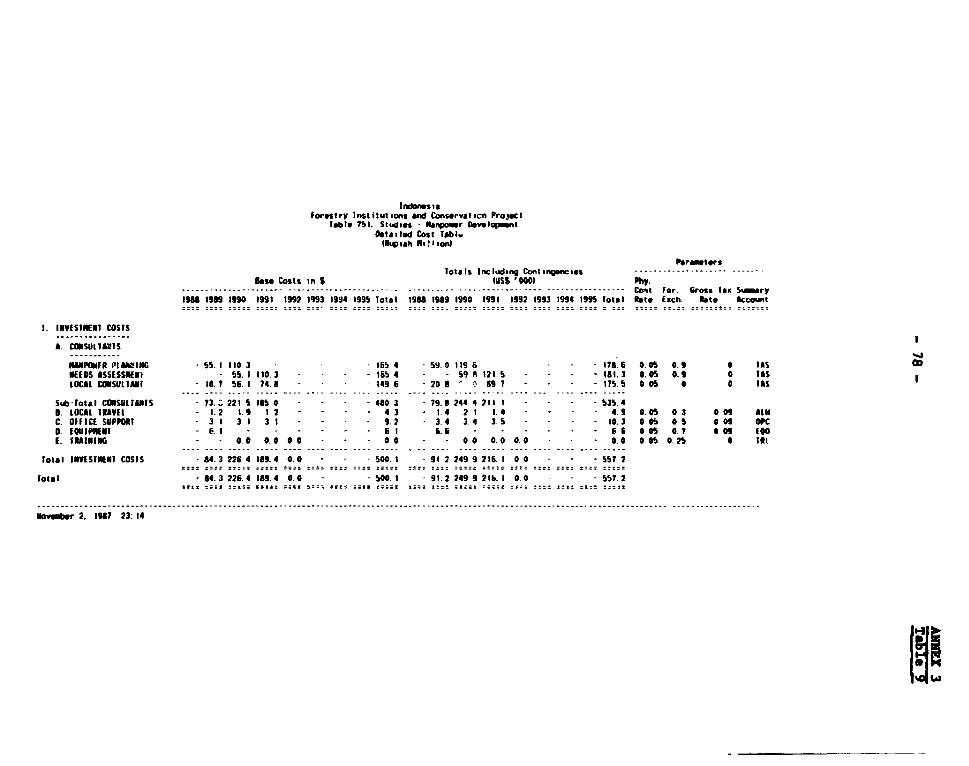
I rdonelI aForestry Institulions and Conservaticn Project
lable 752. Studies - Nariasr DevelopntDetailod Cost Tabi.
IRupish Hiat I eonl
ParmtersTotals Including Con ti n g tes ... ........-
Bes. Costs in S 2US$ 10001 I'ly.--.. . . . .... .... ... . . ...... - . .................. --- - - Camt for. Gross tax Su ary1988 1989 1990 1991 1992 1993 1994 1995 Total 188 1989 1990 1991 1992 1993 1994 199S total Rete EKch. lato, kcount
1. INWESTNEUT COSTS.. . ... ... . I
A. CONStLIARRISa. .o uis
NANPONFI P1A881 - 55. I 110 3 - 25S4 - 59.0 119 6 - - 178.6 O.OS 0.9 0 laS CD1EEDS ISSESSIIEN1 - 55. I 110.3 - - - 15 4 - - S9 8 121.5 - - I- 19.3 0.0s 0.9 0 14S0CAL CO1 SULIMI -28. 7 56. 2 74. - 149 6 -20 ' 89 7 - - - -175.5 0 Os 0 0 lAS-- - - - - - - - - - - - - .... .. . .. ... ... .... .... .... ... - - - - -
Sso-lotal COUSULTAMIS - 73._ 221 5 185 0 - 480 3 - 79.8 244 4 211 1 - 535.4B. LOCL IR3VEt -1.2 1.9 1 2 4 3 -1.4 2 1 1.4 4.9 0.05 0 3 0 09 4tEC. OfFICE SUPPOT -3 1 3 1 3 1 9.2 3.4 3.4 3.5 - 10.3 005 0.5 0 0 OPCD. EvUIP1E4 - 6. 1 -6 1 6.5 -6 0 05 0. 7 0 09 f"EE. 13tINIUG - - 0.00 0. 00.0 - - - 00 - - 0 0 0.00.0 - 0.0 0.05 0.25 0 Tlt- -- - - - - -- - - - - - - -- -- - - - - . . . . . . . . . . . .. . .. . . . . .. . . -
Total INVESINTII COSTS - 84.3 22b 4 189.4 0.0 - - - so0. 9 2 249 9 216.1 0 - - -55? 2
lotal - 84.3 226.4 289. 4 0.0 - - 500.1 - 91.2 249 9 21b. I 0.0 - - - S57.2
Novber 2. 1987 23: 14
[Ii
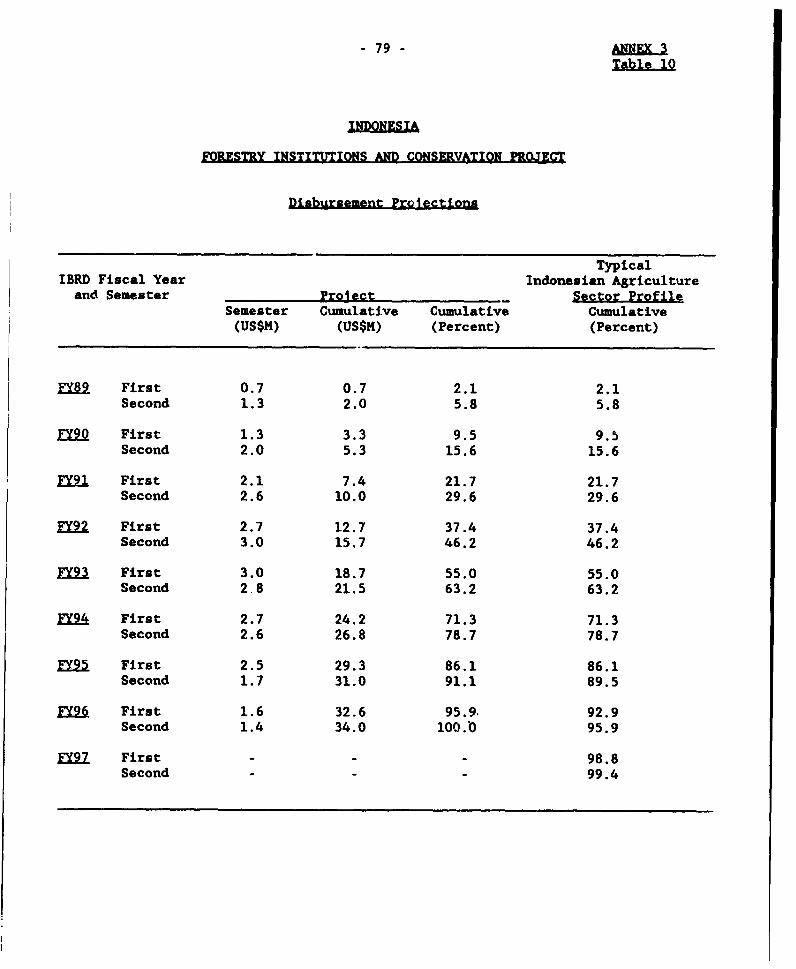
- 79 - ANEX 3Table 10
INDONESIA
FORESTRY INSTITUTIONS AND CONSERVATION PROJECT
Disbursement Proiections
TypicalIBRD Fiscal Year Indonesian Agricultureand Semester Proiect Sector Profile
Semester Cumulative Cumulative Cumulative(US$M) (US$M) (Percent) (Percent)
FY89 First 0.7 0.7 2.1 2.1Second 1.3 2.0 5.8 5.8
F90 First 1.3 3.3 9.5 9.5Second 2.0 5.3 15.6 15.6
FY91 First 2.1 7.4 21.7 21.7Second 2.6 10.0 29.6 29.6
FY92 First 2.7 12.7 37.4 37.4Second 3.0 15.7 46.2 46.2
FY2.L First 3.0 18.7 55.0 55.0Second 2.8 21.5 63.2 63.2
JX2A First 2.7 24.2 71.3 71.3Second 2.6 26.8 78.7 78.7
FY95 First 2.5 29.3 86.1 86.1Second 1.7 31.0 91.1 89.5
FIX2. First 1.6 32.6 95.9. 92.9Second 1.4 34.0 100.0 95.9
FY97. First - - 98.8Second - 99.4
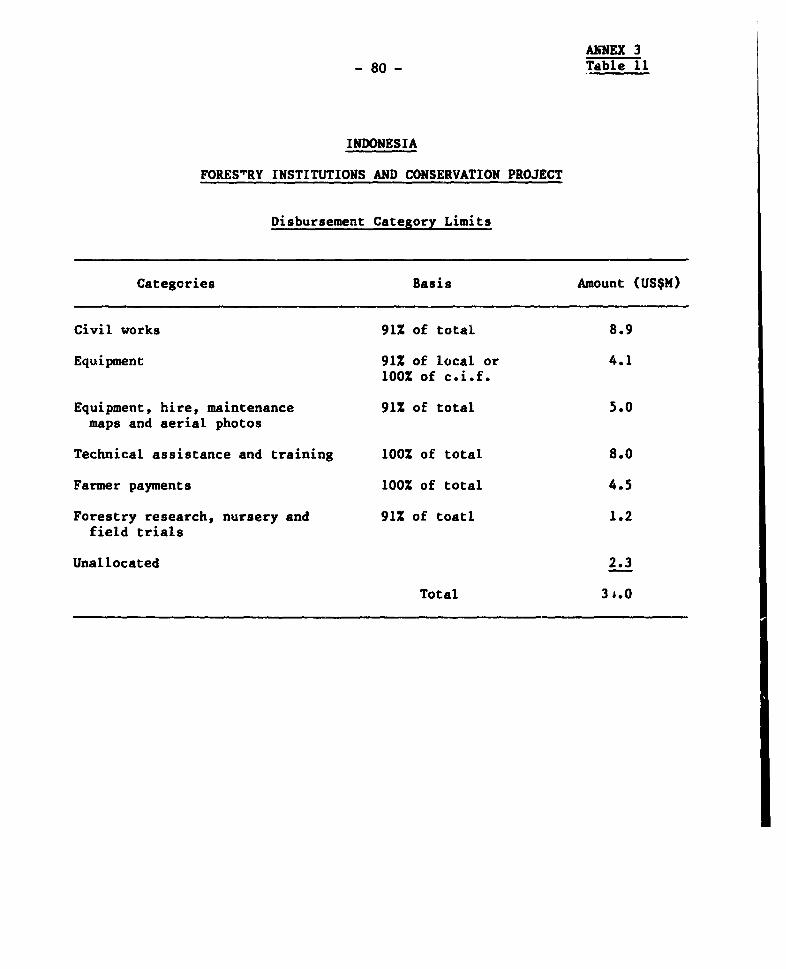
ANNEX 3- 80 - Table 11
INDONESIA
FORESTRY INSTITUTIONS AND CONSERVATION PROJECT
Disbursement Category Limits
Categories Basis Amount (US$M)
Civil works 91% of total 8.9
Equipment 91% of local or 4.1100% of c.i.f.
Equipment, hire, maintenance 91% of total 5.0maps and aerial photos
Technical assistance and training 100% of total 8.0
Farmer payments 100% of total 4.5
Forestry research, nursery and 91Z of toatl 1.2field trials
Unallocated 2.3
Total 3f.0
ANNEX 4- 81-
INDONESIA
FORESTRY INSTITUTIONS AND CONSERVATION PROJECT
Implementation Schedule and Organization
Table 1 Schedule of Vehicle Provision
2 Schedule of Staff Recruitment
3 Project Implementation Schedule
Chart 1 Forest Department (Ministry) - Organization Chart
2 Wonogiri Watershed Conservation - Organization Chart
3 Typ cal Cropping Calendar
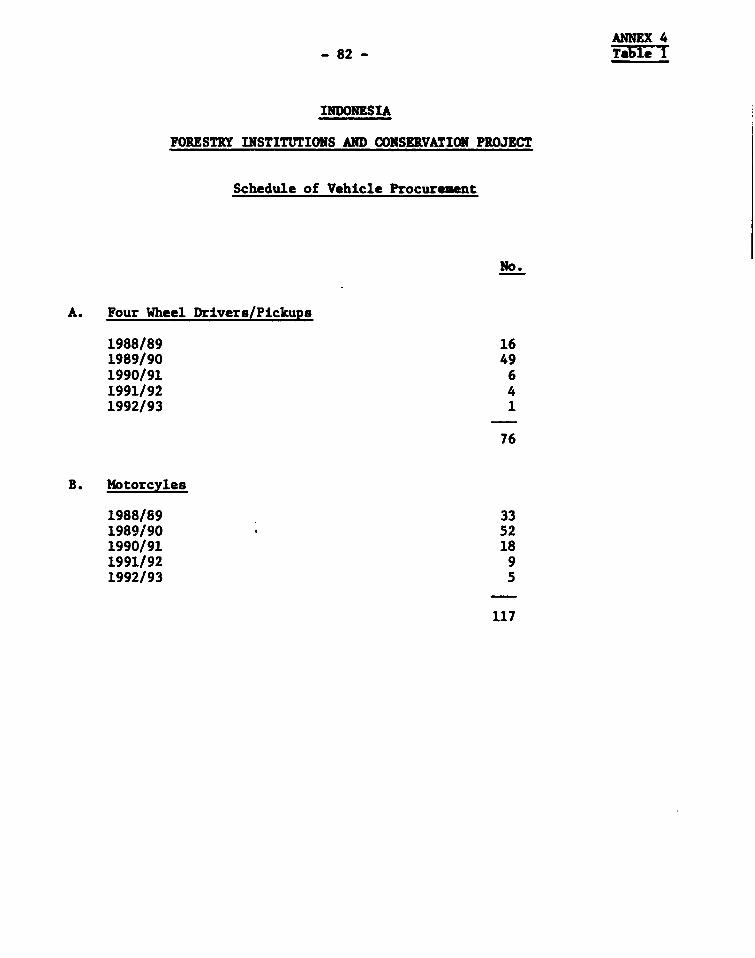
ANNEX 4- 82 - Tab e
INDONESIA
FORESTRY INSTITUTIONS AND CONSEIVATION PROJECT
Schedule of Vehicle Procurement
No.
A. Four Wheel Drivers/Pickups
1988/89 161989/90 491990/91 61991/92 41992/93 1
76
B. Motorcyles
1988/89 331989/90 521990/91 181991/92 91992/93 5
117
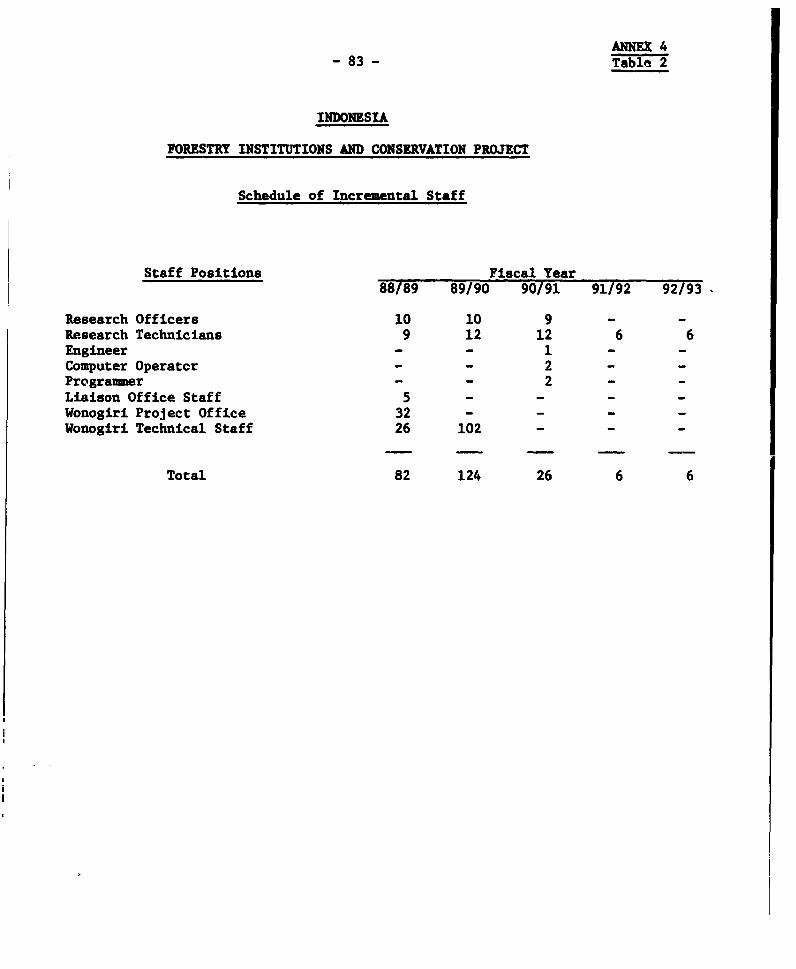
ANNEX 4- 83 - Table 2
INDONESIA
FORESTRY INSTITUTIONS AND CONSERVATION PROJECT
Schedule of Incremental Staff
Staff Positions Fiscal Year88/89 89/90 90/91 91/92 92/93
Research Officers 10 10 9 - -Research Technicians 9 12 12 6 6Engineer - - 1 - -Computer Operatcr - - 2 - -Programmer - - 2 - -
Liaison Office Staff 5 - - - -
Wonogiri Project Office 32 - - - -
Wonogiri Technical Staff 26 102 - - -
Total 82 124 26 6 6

ANNEX 4- 84 - Table 3
page I of 2
INDONESIA
FORESTRY INSTITUTIONS AND CONSERVATION PROJECT
Project Implementation Schedule
Key Actions: Dates:
A. Strategy Studies
1. Draft TORs Done2. Invite Proposals Done3. Receive Proposals January 1, 19884. Complete Review January 21, 19885. Send Comments/Invite for Negotiations February 7, 19886. Start Negotiations March 1, 19887. Complete Negotiations March 8, 19888. Sign Contract April 8, 19889. Complete Draft Proposal March 31, 199010. Start Action Program Implementation January 1, 1991
B. Manpower Development
1. Draft TORs Done2. Advertise January 7, 19883. Prepare Short List February 21, 19884. Clear Short List with Bank March 7, 19885. Invite Proposals March 14, 19886. Receive Proposals May 14, 19887. Complete Review June 7, 19888. Clear Review with Bank June 30, 19889. Complete Contract Negotiations August 15, i98810. Start Manpower Development Planning January 1, 1989
C. Forest Inventory Consultancies
1. Draft TORs Done2. Invite Proposal Done3. Intermediate Steps in Parallel with
Strategy Studies See A4. Contract Signed April 8, 19885. Consultants Assemble September 1, 19886. Information Users Group Formed September 1, 19E87. Complete Forest Cover Type Monitoring June 30, 19898. Repeat Forest Cover Type Monitoring 1992/939. Start Forest Assessment/GIS April 1, 198910. Complete Forest Assessment/GIS March 31, 199211. Start Preparation of Detailed Training Program May 1, 198812. Send Detailed Training Program to the Bank July 1, 198813. Start Implementing Program September 1, 1988
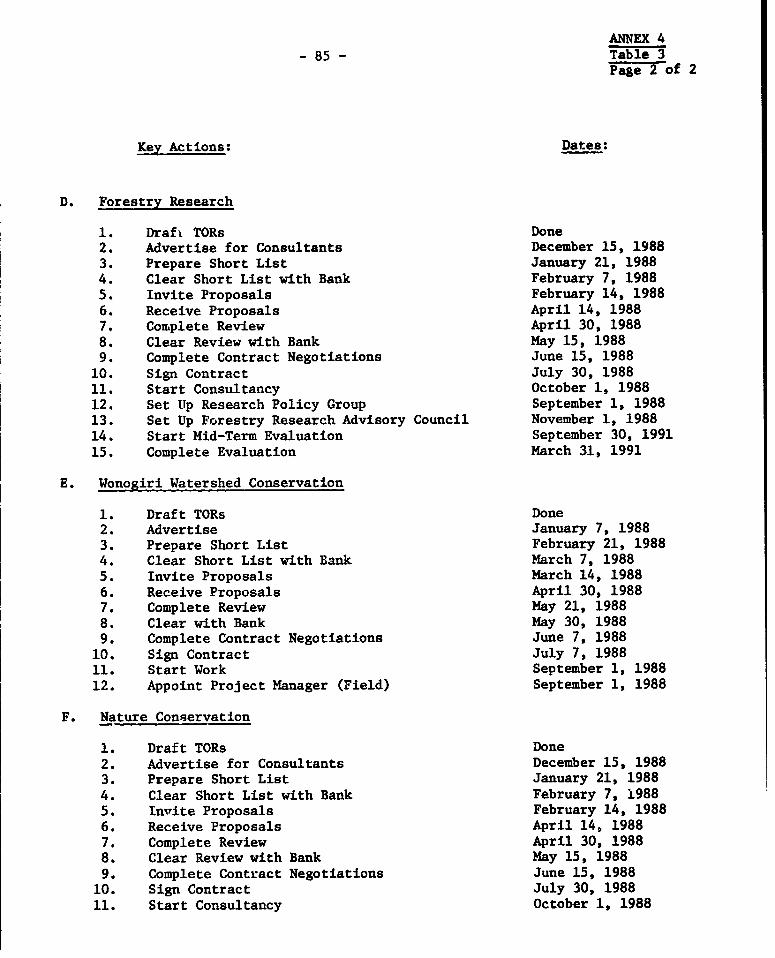
ANNEX 4
- 85 - Table 3Page 2 of 2
Key Actions: Dates:
D. Forestry Research
1. Draft TORs Done2. Advertise for Consultants December 15, 19883. Prepare Short List January 21, 19884. Clear Short List with Bank February 7, 19885. Invite Proposals February 14, 19886. Receive Proposals April 14, 19887. Complete Review April 30, 19888. Clear Review with Bank May 15, 19889. Complete Contract Negotiations June 15, 198810. Sign Contract July 30, 198811. Start Consultancy October 1, 198812. Set Up Research Policy Group September 1, 198813. Set Up Forestry Research Advisory Council November 1, 198814. Start Mid-Term Evaluation September 30, 199115. Complete Evaluation March 31, 1991
E. Wonogiri Watershed Conservation
1. Draft TORs Done2. Advertise January 7, 19883. Prepare Short List February 21, 19884. Clear Short List with Bank March 7, 19885. Invite Proposals March 14, 19886. Receive Proposals April 30, 19887. Complete Review May 21, 19888. Clear with Bank May 30, 19889. Complete Contract Negotiations June 7, 198810. Sign Contract July 7, 198811. Start Work September 1, 198812. Appoint Project Manager (Field) September 1, 1988
F. Nature Conservation
1. Draft TORs Done2. Advertise for Consultants December 15, 19883. Prepare Short List January 21, 19884. Clear Short List with Bank February 7, 19885. In-tite Proposals February 14, 19886. Receive Proposals April 14, 19887. Complete Review April 30, 19888. Clear Review with Bank May 15, 19889. Complete Contract Negotiations June 15, 198810. Sign Contract July 30, 198811. Start Consultancy October 1, 1988
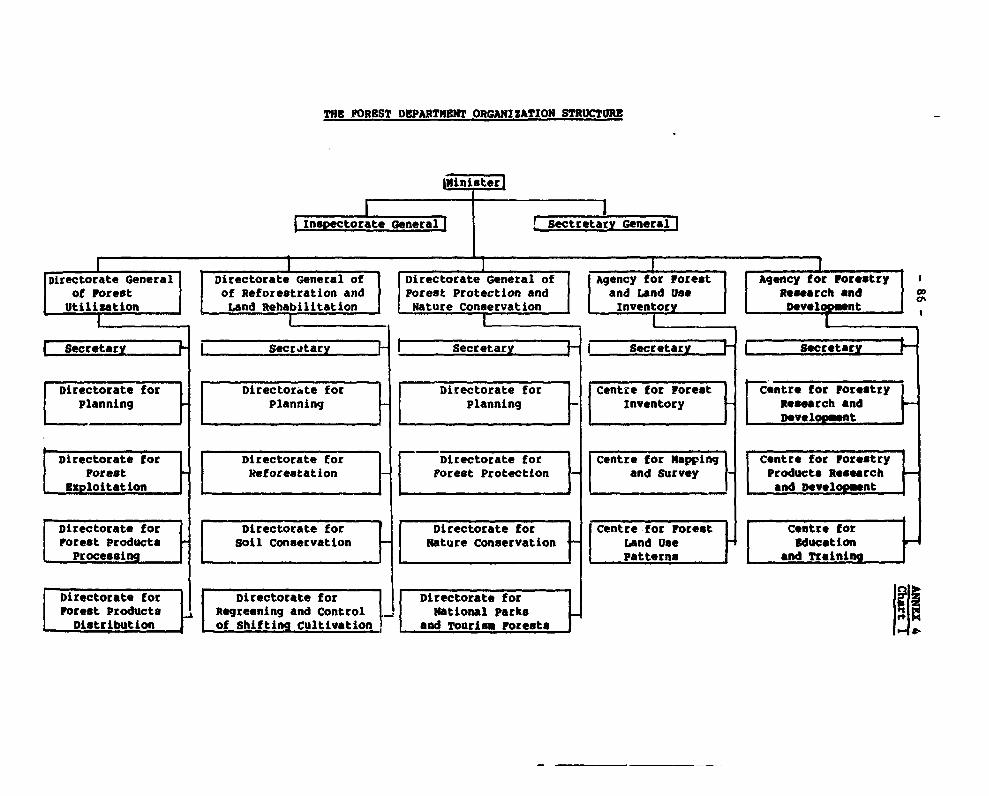
THe FOREST DEPARTMENT ORGANIZATrON STRUCTURE
MNinIster
|ns torate General| Sectretarv General
Directorate General Directorate General of Directorate General of Agency for Forest Agency for Forestry Iof Forest of Reforestration and Forest Protection and and Land Use Research and GUtilization Land Rehabilitation Nature Conservation Inventor Develomnt O
Secretar I Secratarv Sert| Scretary
Directorate for Directorate for Directorate for J f Centre for Forest Contre for ForestryPlanning I Planning Planning j | Inventory RDveloprnt
Directorate for | Directorate for Directorate for j Centre for Mapping Centre for ForestryForest R Refotestation Forest Protection _ and Survey Products ResearchExploitation I _ and Developmnt
Directorate for Directorate for Directorate for Centre-for Forest Centre forForest Products Soil Conservation Nature Conservation Land Use educationProcessing Patterns and Training-I
Directorate for 1 Directorate for Directorate forForest Products Regreening and Control | | National Parks
Distribution | of Shifting Cultivation and Tourism Forests
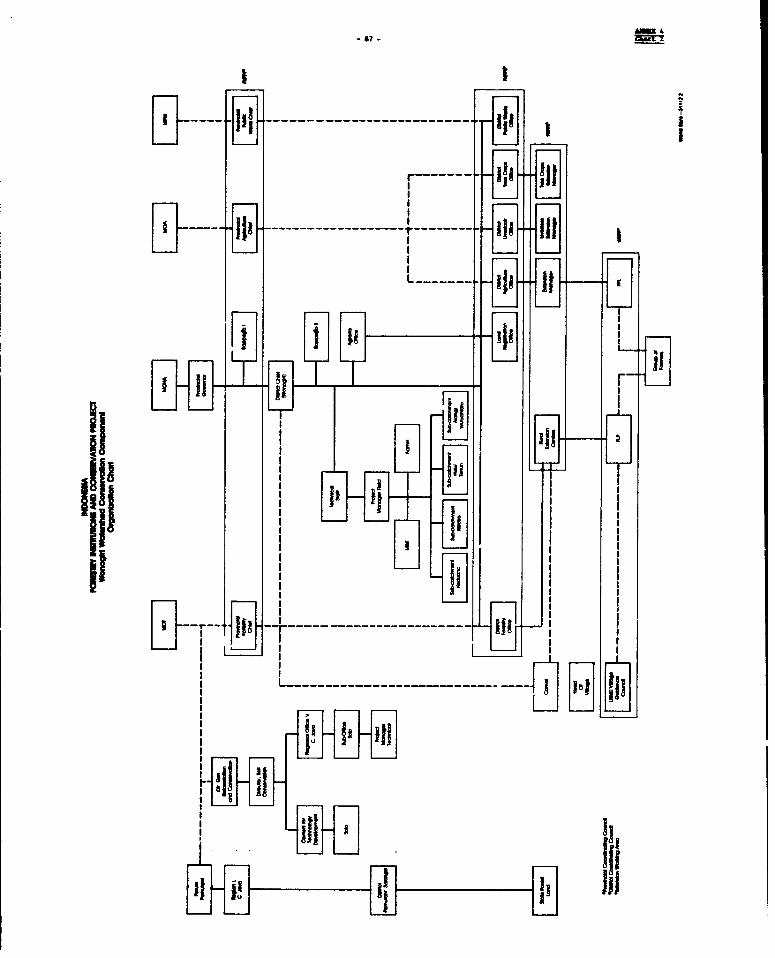
A-=4-£7-
S----< wK ------------------- ------ -- |~3II----- ir------ Ii' X3
L II I _I
iiX
X -r- -T ----- --------- _
I ______,_____________ _ _
I8.. .j I
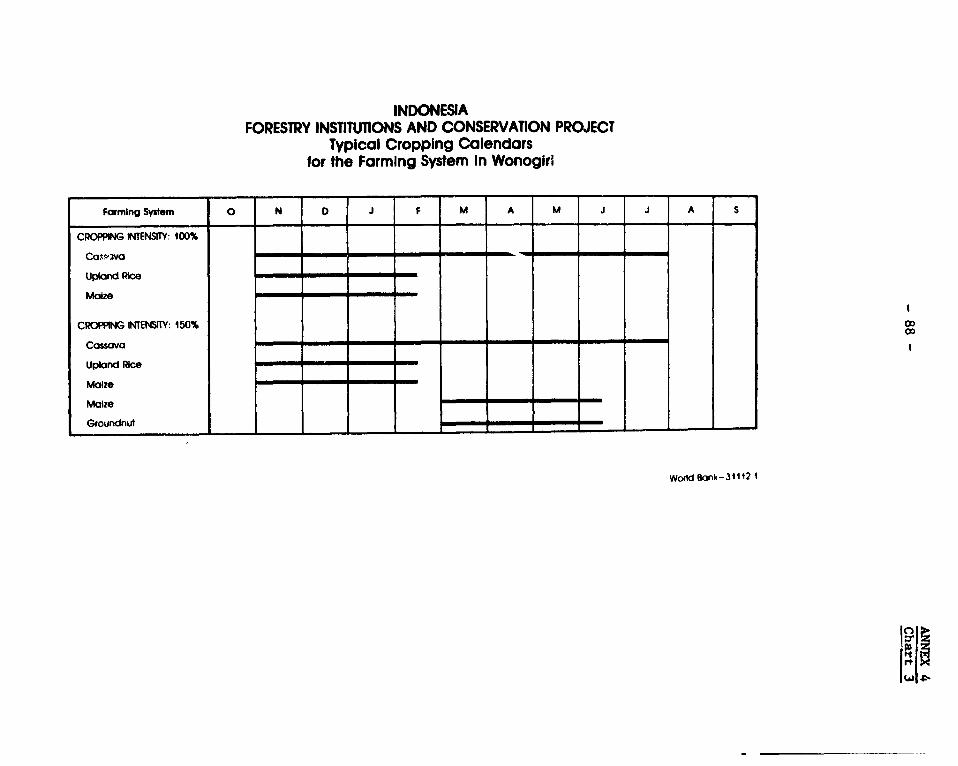
INDONESIAFORESTRY INSTITUIONS AND CONSERVATION PROJECT
Typicol Cropping Calendarsfor the Farming System In Wonogirl
Farming System 0 N D J F M A M J J A s
CROPPING INTENSITY: 100%
Upband Rice
Maize
CROPPING WENSItY: 150% Co
Cassavao
Upland Rice - - - _
Maize
Groundnut
World Bank-31112 1
| lbr
- 89 - ANNEX 5
INDONESIA
FORESTRY INSTITUTIONS AND CONSERVATION PROJECT
Financial and Economic Analysis
Yields and Inputs Per Ha
Table 1 Maize/Groundnut Model
2 Maize/Upland Paddy Model
3 Cassava Model
Production and Prices
Table 4 Project Area Production and Inputs
5 Financial and Economic Prices
Financial Budgfts
Table 6 Maize/Groundnut Model
7 Maize/Upland Paddy Model
8 Cassava Model
Economic Analysis
Table 9 On-Farm Incremental Benefits
10 Economic Analysis-On-Farm
11 Economic Analysis-Off-Farm
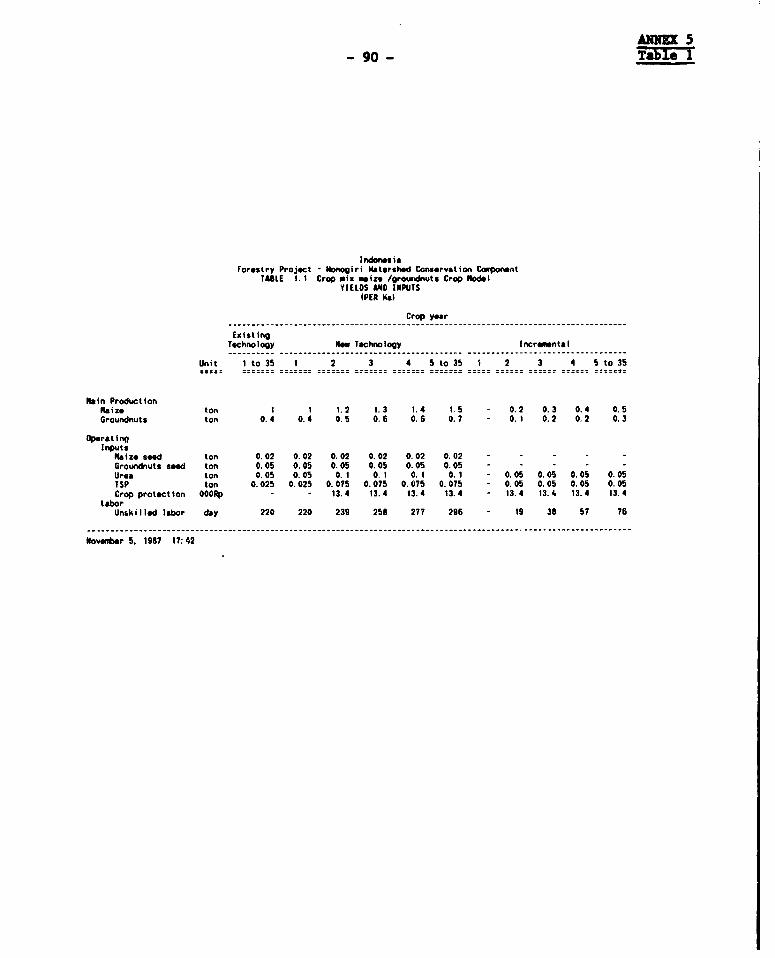
ANNEX 5- 90- Table
I ndones ixForestry Project - Wonogiri Watershed Conservation Copcnnt
TABLE 1. I Crop mix maize /groeudnuts Crop NodelYIELDS A4!1 INPUTS
(PER Hal
Crop year
ExistingTechnology New Tchnology Incremntal
Unit I to 35 1 2 3 4 5 to 35 1 2 3 4 5 to 35
Rain ProductionIaize ton I 1 1. 2 1. 3 1. 4 1. 5 - 0. 2 0. 3 0. 4 0. 5Groundnuts ton 0.4 0.4 0.5 0.6 0.6 0.7 - 0.1 0.2 0.2 0.3
OparatinoInputs
Maize seed ton 0.02 0.02 0.02 0.02 0.02 0.02 - - - - -Groundnuts seed ton 0.05 0.05 0.05 0.05 0.05 0.05 - - - -Urea ton 0.05 0.05 0.1 0.1 0.1 0.1 - 0.05 0.05 0.05 0.05TSP ton 0.025 0.025 0.075 0.075 0.075 0.075 - 0.05 0.05 0.05 0.05Crop protection 0 0ORp - - 13.4 13.4 13.4 13.4 - 13.4 13.4 13.4 13.4
taborUnskilled labor day 220 220 239 258 277 296 - 19 38 57 76
November 5. 1987 17:42
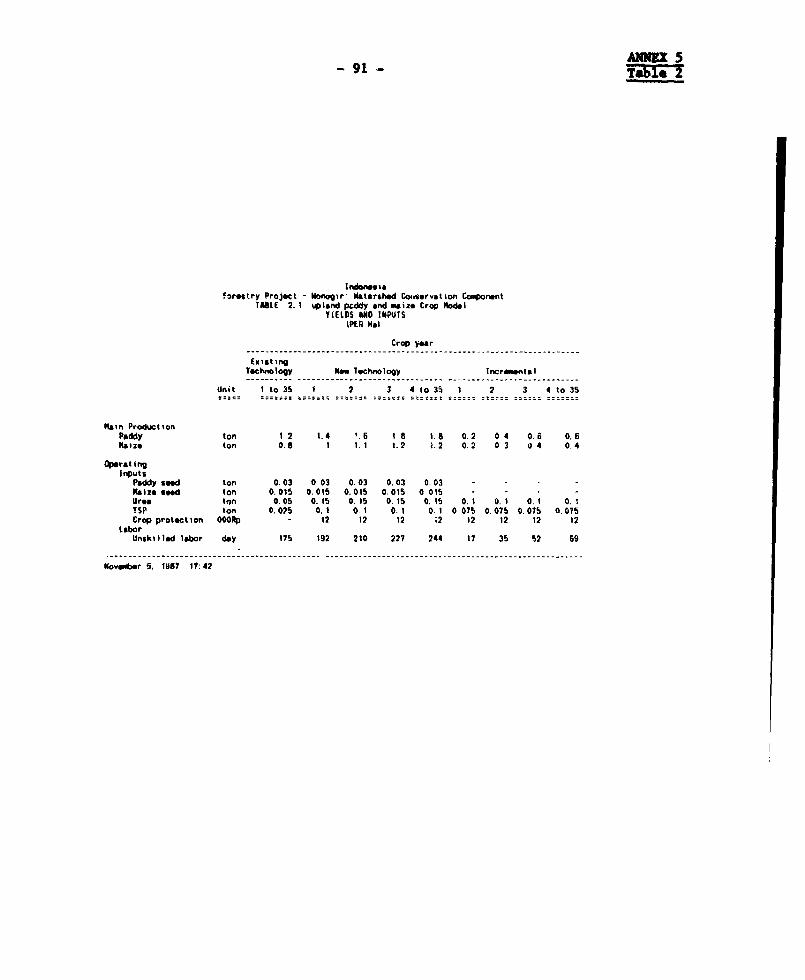
AIIME 5- 91 - Tdile2
Indonoii.go1eatry Project - li gir' Nateished Coi.servation Cowonent
TAtE 2. 1 opland pcddy and awize Crop NodalYiELDS MND INPUTS
IPER Hal
Crop year
ExistingTechnology New Tochnology Incremental
Unit I to 35 1 2 3 4 to 35 1 2 3 4 to 35
Rain ProductionPaddy ton 1 2 1.4 1.6 I a 1.8 0.2 0 4 0.6 0.6"Size ton 0.6 I t l 1.2 1.2 0.2 0 3 0 4 0.4
Operat inInputs
Paddy aeed ton 0.03 0 03 0.03 0,03 0.03 - - -Maize seed ton 0.015 0.015 0.015 0.015 0 OIS - - -Ursa ton 0.05 0. 15 0. 15 0.15 0. 15 0.1 0.1 0.1 0. TSP ton 0.075 0.1 0.1 0.1 0.1 0 075 0.075 0.075 0.075Crop protection @00
Rp - 12 12 12 ;2 12 12 12 12Labor
UnskIil1ed labor day 175 192 210 227 244 17 35 52 69
Noveer 5, 1987 17: 42
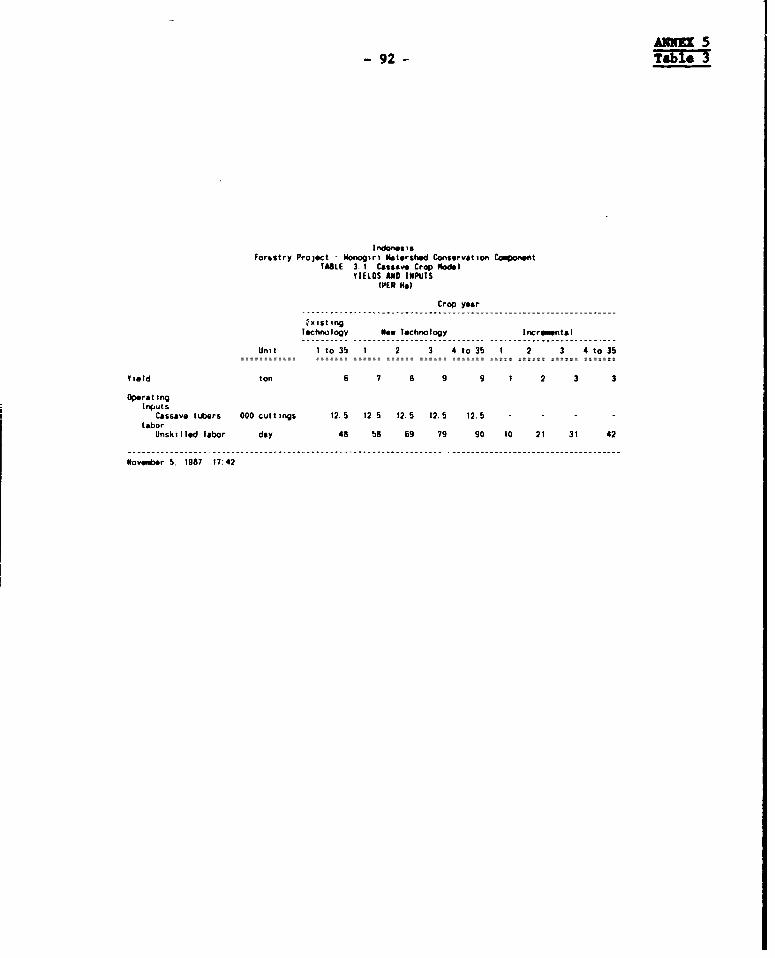
ANNEX 5-92 T 3
I ndonesi CFor.stry Project - Wonogiri toshed Consertion Crwonent
TABLE 3. I Cassave Crap todelYIELDS AND INPUTS
(PER Hal
Crop year
------ S --t ------- ---- ------------ ~ -~-~ ------- ~----------misit ing
Technology Now Technology Increimntal
Unit to 35 1 2 3 4 to 35 1 2 3 4 to 35
Yield ton 6 7 8 9 9 1 2 3 3
OperatingInputs
Cassavo tubers 000 cuttings 12.5 12 5 12.5 12.5 12.5 - - -Lator
Unskilled labor day 48 58 69 79 90 10 21 31 42
Noveer 5. 1987 17:42
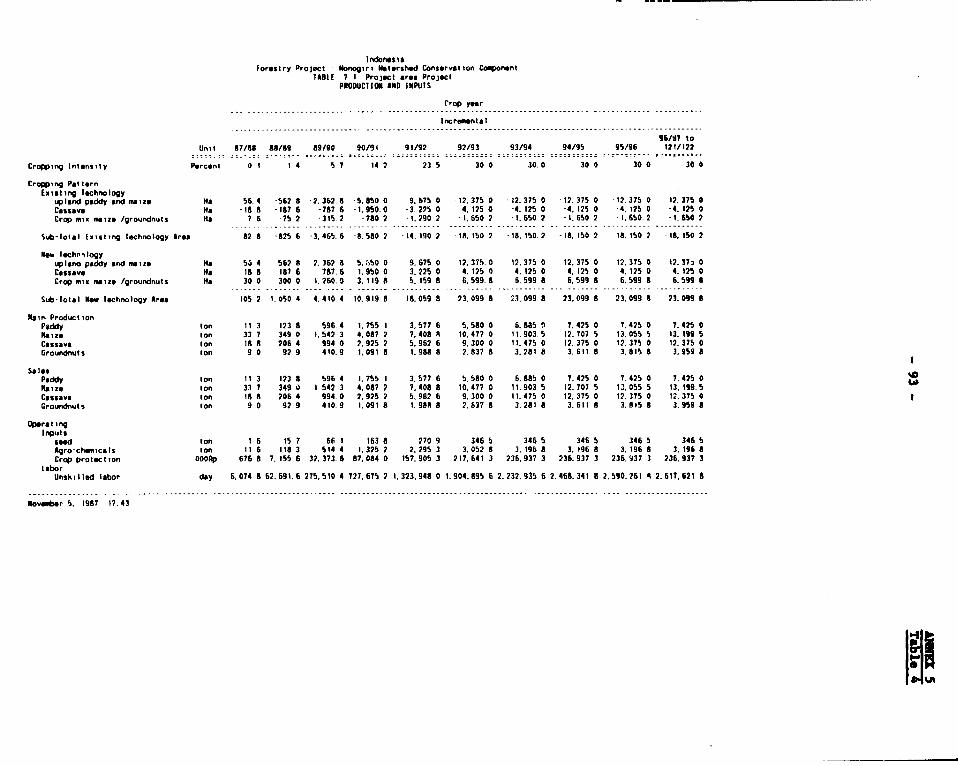
Inrdones iaForestry ProjeCt - onogiri Watersted Conservation Cowonent
TABLO 7 1 Project area ProjectPRODUCTIOSN AND INPUTS
C'rop year
I ncrmentalI
96/9~7 toUnit 87/88 88/89 89/90 90/Ot 91/92 92/93 93/94 94/95 95/96 121/t22
Cropping Intensity Percent 0 I 1 4 5 7 14 2 23 5 30 0 30.0 30 0 30 0 30 0
Cropping PatternExsteing Techntotogy
upland paddy and maize Ha 56. 4 -562 8 2. 362. 8 -5.850 0 9. biS 0 I.12375 0 -12.375 0 112. 375 0 - 12. 375 0 12. 375 0Cassave "a -18 a -to? 6 -787 6 -1,950.0 -3, 225 0 .4, 125 0 -4. 125 0 -4. 125 0 -4.015 0 -4. 125 0Crop mixi maize /groundnuts Ha 7 6 -752 -315.2 -780 2 -1.290 2 -t. 652 .1.650 2 -t,650 2 -. .650. 2 -1,650 2
Sik-Ttoai Iaisi ing Technology Area 82 8 -825 6 -3. 46b.6 -8. 580 2 - 14. 190 2 18. ISO 2 -18. I50.? - to. is 2 18. tS0 2 18. Iso 2
Niew Techr"iIogyuplano paddy and maize Ha s3 4 562 8 2.367 8 5.:i50 0 9. 67S 0 12. 37S.0 12. 375 0 12. 375 0 12. 37S, 0 12. 37: 0Cassave Ha 18a 187 6 787.6 1.950 0 3.225 0 4.125 0 4.125 0 4.125 0 4.125 0 4.125 0Crop mix maize /groundnuts Ha 30_0 .. 300_0 1.I,260.,0 3. 119 a 5. 159 a 6,599.8a 6.599 8 6.599 8 6.599 8 6.599 8
Sub-Totat iuw Technology Area lOS 2 . OSO 4 4.410 4 10. 919 8 18. 059 8 23. 099 8 213. 099 8 23. 099 a 23. 099 8 23. 099 8
Natir, ProductionPaddy ton II 3 123 8 596.4 1.7S5 1 3,577 6 S.S80 0 6.885 S 7. 425 0 7.42S 0 7.425 0Maize ton 33 7 349 2 1.542 3 4.087 2 7.408 A 10.477 0 11.903.5 12.707 5) 13.055 5 13. 199 5Cassava ion 18a 205 4 994 0 2.92S2 S. 962 6 9.300 0 11.475 0 12.375 0 12.375 0 13. 37S 0Groundnuts ton 9 0 92 9 410.9 1.091 8 1.9888a 2.837 8 3.281 8 3.611 8 3.815 8 3.959 8
Paddy ton Ii 3 I1238 5 964 1.751I 3.577 6 S.S80 0 6.885 0 7.425 0 7.425 0 7.425 0 Maize ion 33 7 349 0 1 542 3 4.087 2 7.408 0 10.477 0 11.903 5 12.707 5 12.055 5 13. 129.5 Cassava ton 188 706 4 994.0 2.925 2 S,962 6 9.300 0 11,475 0 12.375 0 12.375 0 1.2.375 0Groundnuts ion 90 92 9 410. 9 1. 091 a 1. 909 8 2.6378a 3.281 8 3. 611 8 3. 8158 3.959 8
OperatingInputs
sewd ton 16 15 ? 66 1 163 8 270 9 346 5 346 5 346 b 346 5 346S5Agro-chemicals ton 1t6 118 3 514 4 1.325 2 2.295 3 3.052 8 3.196 8 3,1968a 3.196 8 3.196 8Crop protect ion 0GOOP 676 8 7. iSS 6 32. 373. 6 87. 084 0 157. 905 3 217.641 3 236. 937 3 236. 937 3 236. 937 3 236. 937 3
LaborUnski lled labor day 6.074 8 62.69i,6 27S. S10 4 727. 67S 2 1.323.948 0 1. 904. 895 6 2.232.935 6 2.468,341 8 2.590.261 A 2.617,621 8
Novanjber S. 1987 17.43
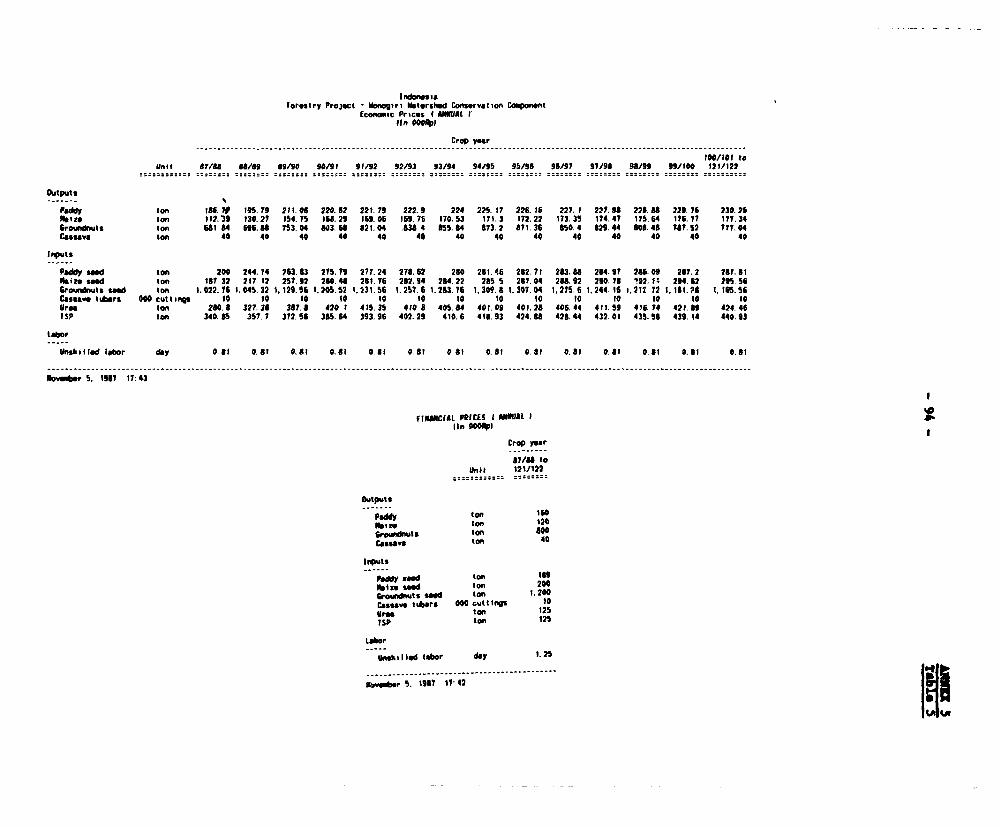
torestry Project - Nonogiri Ostershed Conservation CoponentEconomic Prices I UUAL I'
Un OOOtIpl
Crop year
100/101 toUnit 87/8eU "8/ag 819/90 g/1t 911/2 92/93 93/94 94/95 95/96 96/97 97/91 98/93 99/100 121/122Outputs
Paddy ton t6. 7 195. 79 211. 06 220. 82 221. 79 222. B 224 225. 17 226. 16 227. 1 22t 98 228. U 229. 76 230.26Nt.iz ton 112.139 130.27 154.75 168.29 1169.06 169.76 170.53 171.3 172.22 173.35 174.47 175.64 176.77 177.346roudnuts ton 681 84 696.5U 753.04 803.6U 821.04 .836 4 855.84 873.2 871.36 850.4 829.44 Oft.48 t87.52 777.04Cassava ton 40 40 40 40 40 40 40 40 40 40 40 40 40 40Inputs
Paddy seed ton 200 244. 74 753.83 275.79 277.24 278.62 280 281.46 282.71 283.88 2U4.97 286.00 287.2 287.81Slite seed ton IN? 32 217 12 257.22 260.48 281.76 282.94 284.22 285 5 287.04 2U8.92 290.78 192.N7 294.62 295.56Groundnuts seed ton 1. 022.76 1. 045.32 1 129.56 1. M05.52 1.231.56 1 257.6 1.283.76 1 309.8 . 307.04 1, 215.6 1.244.16 i. 212. 72 1. 11.72 1. 165.56Cassave titors 000 cuttinqgt tO 10 tO 10 to 10 to 10 to 10 10 to to 10Urea ton 280.8 327.38 387.J 420 1 415.35 410 8 405.14 401.09 401.28 406.44 411.59 416.74 421.89 424.46ISP ton 340. I5 357. 7 372. 56 315.64 393.96 402.29 410.6 416.93 424. U 428.44 432.01 435.58 439. 14 440.93tabor
Unskilloed .ior day 0.5 0.f 0.St 0.Ut 0.ll 0.ttl 081 t0.S 0.J8 0.8?I 0.31 0.8? 0.01 0.8o--- -- -- -- -- -- - . .. . . . .. . -- -- -- --- -- -- -- -- -- -- --- -- -- -- -- -- -- -- --- -- -- . - -- -- -- --- . - -- -- -- -- -- --- -- -- -- -- -- -- --
Nove r 5. 1967 17: 43
fIIDACiAt PIlCES t ANNUAL Ilin OOp)
Crop year
87SI/ tottnit 121/122
outputs
-P- -- ton 160btite ton 1MBroundnuts ton 800Castsav ton 40
Irnuts
PWa seed ton ISObtia Sd ton 200Growidnts seed ton 1.200Casseve tubers 000 cuttings 10
tSr! ton 125TSP ton 125
Labor
wnkilled labor dey 1.25
wav_er 5. 1¶97 17 42
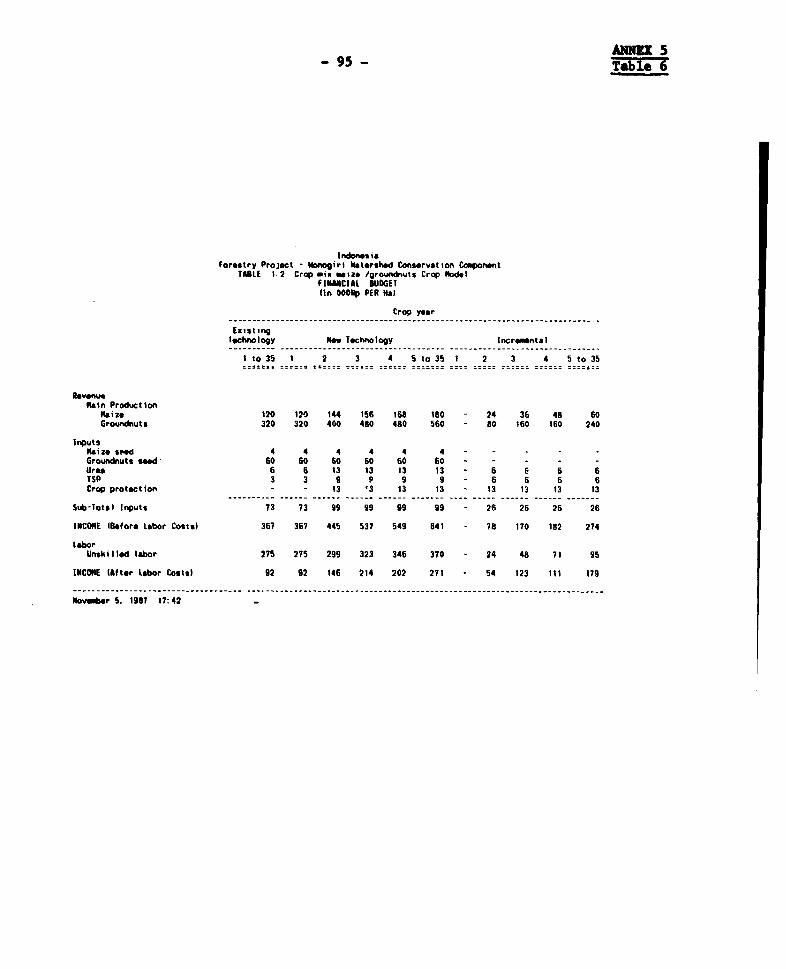
AN 5-95 - Table 6
I dones iaForestry Project - onogirt 14tershed Conservation Cowponent
TALE 1. 2 Crop mix maize /groundnuts Crop ModelflIN141CIAL UDOGETfin OOORp PER Ha)
Crop year
Existinglechnology New Technology Incrental
I to 35 1 2 3 4 5 to 35 1 2 3 4 5 to 35
RevenueMain Production
Maize 120 120 144 156 168 180 24 36 48 60Groundnuts 320 320 400 480 480 560 - s0 160 160 240
InputsMaize seed 4 4 4 4 4 4 - - - -Groundnuts seed 60 60 60 60 60 60 - - - -Uroa 6 6 13 13 13 13 - 6 6 6 6TSP 3 3 9 9 9 9 - 6 6 6 6Crop protoction - - 13 '3 13 13 13 13 13 13
Sutb-Total Inputs 73 73 99 99 99 99 26 26 26 26
INCONE lBefore Labor Costsl 367 367 445 537 549 641 - 78 170 182 274
LaborUnskilled labor 275 275 299 323 346 370 - 24 48 71 95
INCOME (After tsaor Costsl 92 92 146 214 202 271 - 54 123 III 179
Nov_>er 5, 1987 17:42
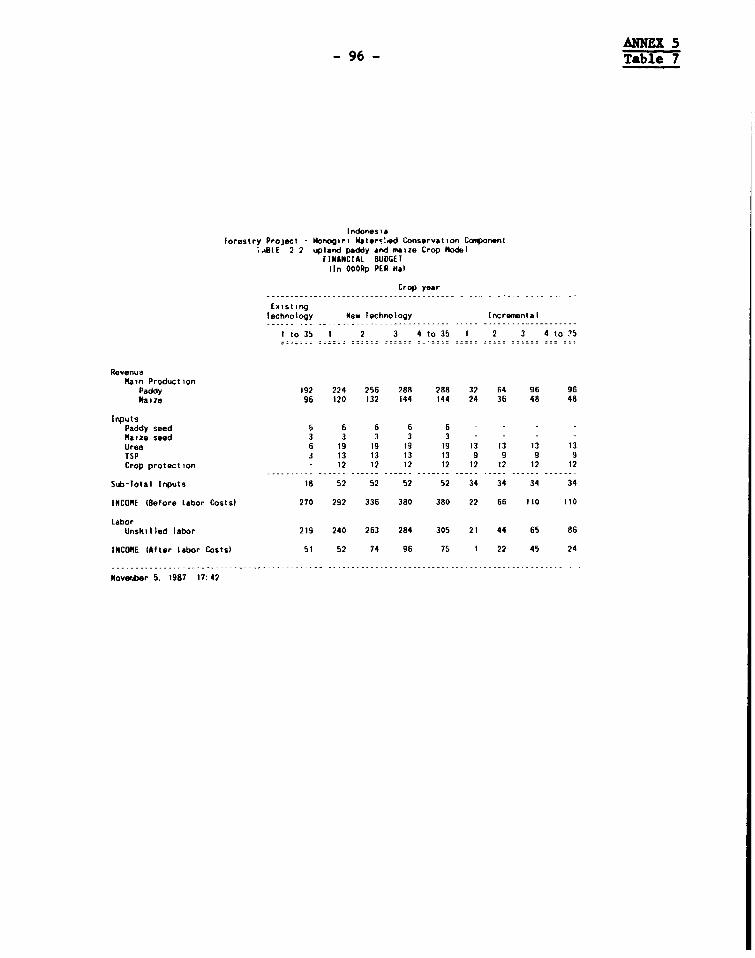
ANNEX 5- 96 - Table 7
I ndonesi1aforestry Project - Wonogir! "Nater'.ed Conservation Component
;..eiE 2 2 upland paddy and mize Crop ModelFINANCIAL BUDGET
tin OOORp PER Hal
Crop year
ExistingTechnology New Technology Incremental
I to 3b 1 2 3 4 to 35 1 2 3 4 to ?5
RevenueMain Production
Paddy 192 224 256 288 288 32 64 96 96Malze 96 120 132 144 144 24 36 48 48
InputsPaddy seed S 6 6 6 6 - - -
Maize seed 3 3 3 3 3 - - - -
Urea 6 19 19 19 19 13 13 13 13TSP J 13 13 13 13 9 9 9 9Crap protection - 12 12 12 12 12 12 12 12Crop~~~~~~- - - - -- - - - -- . .- - - - -- -- - - - -- - - - ~ '-- -' - --- --- - -- -'-- -~~
Sub-Total Inputs 18 52 52 52 52 34 34 34 34
INCOME IBefore Labor Costsl 270 292 336 380 380 22 66 ItO 110
LaborUnskilled labor 219 240 263 284 305 21 44 65 86
INCOME lAfter Labor CostsI 51 52 74 96 75 1 22 45 24
Nover.ber 5. 1987 17:42
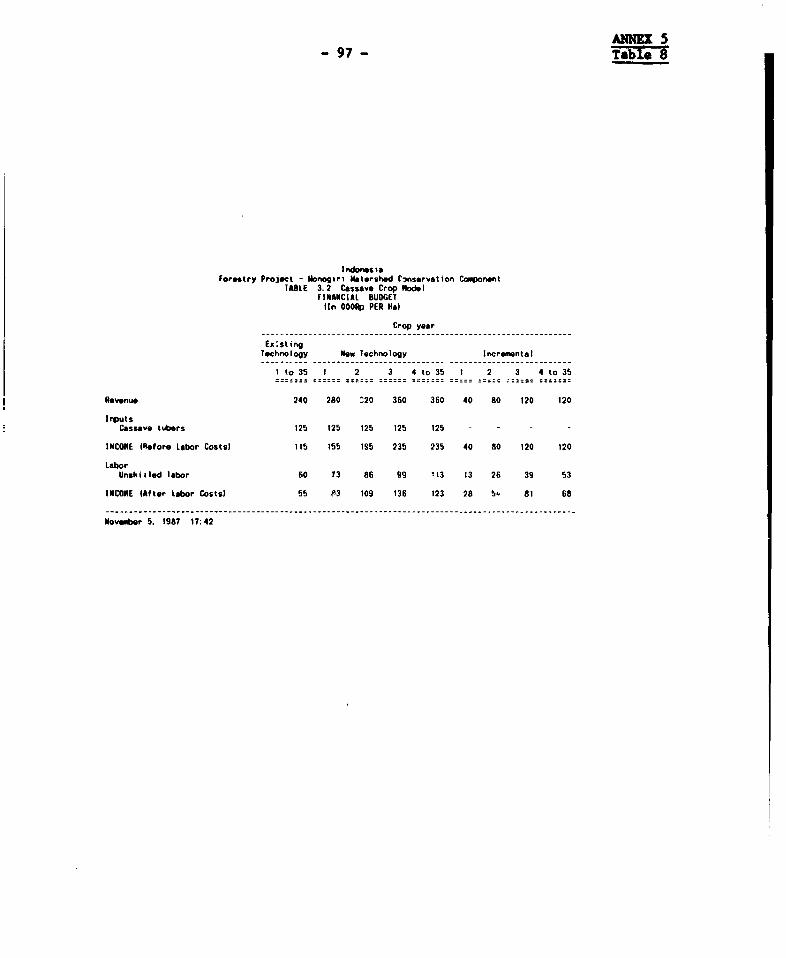
ANNIS 5-97 - Tabre 8
I ndones 'aForestry Project - llonogiri Watershed Conservation Component
TABLE 3.2 Cassave Crop NodelfIlNACIAL BUDGETtin OOORp PER Ha)
Crop year
Ex.stingTechnology New Technology Incremental
I to 35 1 2 3 4 to 35 1 2 3 4 to 35
Revenue 240 280 Z20 360 360 40 80 120 120
InputsCassave tubers 125 125 125 125 125 - - - -
INCOME (Refore Labor Costsl 115 155 125 235 235 40 8o 120 120
LaborUnakiIed labor 60 73 86 99 a13 13 26 39 53
INCONE (After Labor Costsl 55 P3 109 136 123 28 5' 81 68
Noveiber 5. 1987 17:42
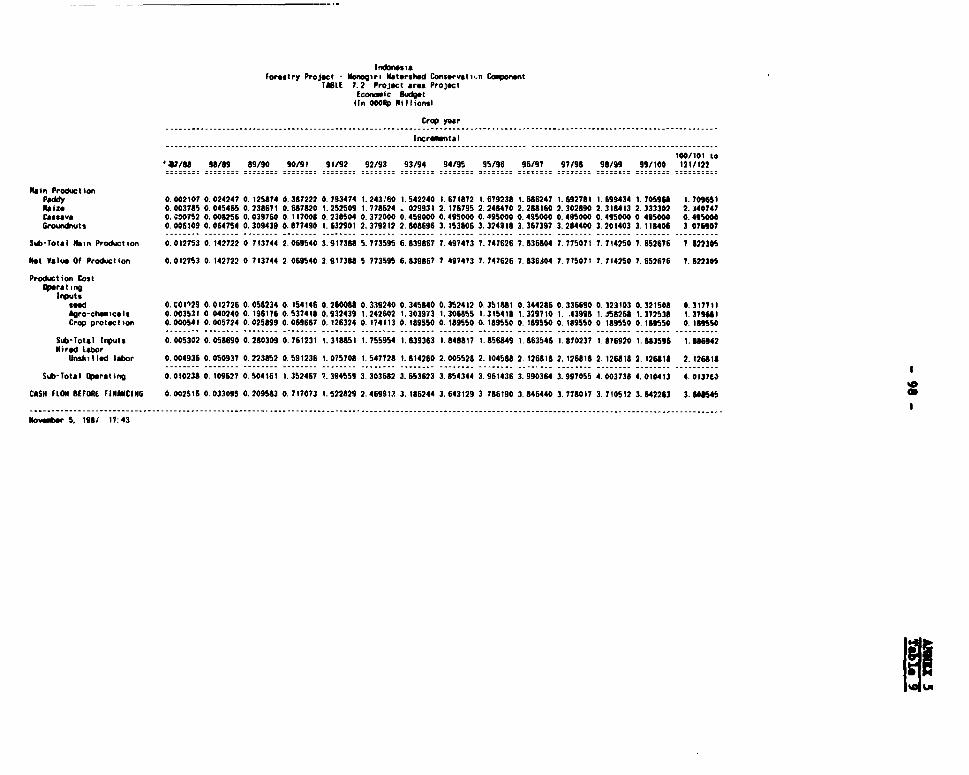
IndonesiForestry Project - "nire Watershed Conservat.ia Component
IS8LE 7.2 Project area ProjectEconomic Budget
(in 00Op Millionsl
Crop year- .-.. ..-...-.--. . -... .- . . . .-.-. .... -.-. ---. .- ......------ . .. . ..... .......-.....------......-.-. -. -----.... ------.-....
Incremnta I--..---. - - --- --- --. -. - - --- - ---..- . ... -. - -- -.. -. -.. ---..--.. --- --. -... - - ... - -- -.. .-. ----- -- - -- -- ---- -- - -- -- -- -- ---- --- -- -.- .. -..
100(101 toa/788 88/89 89/90 90/91 91/92 92/93 93(94 94/95 95/96 96/97 97/98 98/99 99/100 121/122
Main ProductionPaddy 0.002107 0.024247 0.125874 0.387222 0.793474 t. 243.60 1.542240 t.571872 1.679238 1.686247 1.692781 1.599434 1.70596 1. 7096?SIttize 0.003785 0.045465 0.238671 0.687820 1.252509 1.778624 . 02993? 2. 176795 2.248470 2.288160 2.302890 2.318413 2.333302 2. £40747Cssava O. 00752 0. 008256 0. 039760 0. 117008 0. 238504 0. 372000 0. 459000 0. 495000 0. 495000 0. 495000 0.495000 0. 495000 0 49500 0. 49$000Groundnuts 0. 006109 0.064754 0.309439 0.877490 1.532901 2.379212 2.808696 3. 153806 3.324318 3.367397 3.284400 3.201403 3.118406 3 076907
Sut-Total Main Production 0.012753 0.142722 0 713744 2.069540 3.9173U 5.773595 6.839867 7.497473 7.747626 7.836804 7.715071 7.714250 7.652676 7 62230$
Not Value Of Production 0.012753 0.142722 0 713744 2.069540 3.9173U 5 773595 6.839867 7 497473 7.747626 7.836104 7.715071 7.714250 7.652576 7.62230$
Production CostOperat ing
Inputssted 0. C01129 0.012726 0. 058234 0.154146 0.260088 0.339240 0. 345840 0.352412 0. 351188 0.344286 0. 336690 0.312103 0.321508 0.317711Agro-ctmicals 0.003531 0 040240 0. 196176 0.537418 0.932439 1.242602 1.303973 1.306855 1.315418 1.329710 1. .43998 1.I58268 1.372538 1. 379UICrop protection 0.000541 0.005724 0.025899 0.069667 0.126324 0.174113 0.189550 0.189550 0.189550 0.189550 0.189550 0 189550 0.189550 0.189SS0
....... - - -- -- -- - - -- . . .. . .. ... . . .. . . .. -- - - - -- -- - --- -- - - - -- - -- - -- - -- - - -- - - -- - I - -- - --- -- - - 1.... .... .... . ..... . .... ..
Sit-Total Inputs 0.005302 0.058690 0.280300 0.761231 1.316851 1.755954 1.839363 1.848817 1.856849 1.863546 1.870237 1.876920 1. 883596 1.886942Mired LaborUnskli t led labor 0.004936 0.050937 0.223852 0. 591236 1. 075708 1. 547728 1. 814260 2. 005528 2. 104588 2. 126818 2. 126818 2. 126818 2. 126818 2. 126818
Sub-Total Operating 0.010238 0. 100627 0.504161 1.352467 7.394559 3.303682 3.553623 3.854344 3.961436 3.990364 3.997055 4.003738 4.010413 4. 01370
CASH FLOW BEFORE FINANCING 0.002516 0.033095 0.209583 0. 717073 1.522829 2.469912 3. 186244 3.643129 3 786190 3.845440 3. 778017 3.710512 3.842263 3. S0845 c
Nover S. 198 17: 43
U!f

Ecuonoic Analysis of In-f are kyulopust Compounmnt
Crop Years 87/861 *fVbf 99/90 90191 91192 92/93 93/94 94195 95/96 96/97 97/91 "1/" 99/0 0001 01/02 02/03 03104
lncremetal knitfits - Aftil Crops 12.9 142.7 713.7 4069.5 3917.4 5773.6 6839.9 7497.5 7747.6 7846.8 fl75.1 7714.3 7652.7 7622. 7622.3 7f22.3 7622.3
Hue-gardem Bkntfits -5.0 -17.0 -28.0 40.0 353.0 476.0 726.0 1262.0 2357.0 3746.0 5164.0 6O44. 50,0 # 521.0 923.0 9930.0 10639.0
Incrssmtal Costs 1201.0 2072.3 3330.1 6141.0 7619.1 7342.6 5049.6 5154.5 5150.5 5490.6 5155.3 5105.3 5112.7 5136.4 51O3. 51U.11 5116.4
Ant Ilncruumtal lmosfits -1193.2 -1946.6 -2644.4 -4031.4 -3348.8 -1093.0 2516.2 3605.0 4954.1 6522.2 7800.8 905.9 10041.0 11013.9 11611.7 12372.3 13144.9
Economic Rate of Return: 26%
04/05 05/06 06/07 07/08 05/09 09/10 10/11 11/12 12/13 1.3/14 14115 15/16 16/17
7622.3 7622.3 7622.3 7622.3 7622.3 7622.3 7622.3 7622.3 7622.3 7622.3 7622.3 7622.3 7622.3
11325.0 11967.0 12556.0 13225.0 14004.0 14671.0 15015.0 14875.0 14937.0 14991.0 15451.0 15085.0 15085.0
5173.6 5116.4 5136.4 5116.4 5173.6 5196.0 5116.4 5:73.6 5136.4 5116.4 5116.4 5173.6 5116.4
13773.7 14472.9 15041.9 15730.9 16452.7 1710M. 17520.9 17323.7 17422.9 17503.9 17556.9 17533.7 17590.9
----- ---- ----- ---- ----- ---- ----- ---- ----- ---- ----- ---- ---- ---- ----- ---- ----- ---- ----- ---- ----

Econosic mnalysis o! 011-tfru 0v. Coupomnt
(Rupiah million)_ ---_ -- __ _-----~~- --__ ------------------ - ------- - --- --- --------------- - -------------- - - -_ ------ -- - --- _ ------------- ---- _- _
Crop Years 37/fl 7U07 m9/90 90/91 91/92 92/93 93/194 94/95 95/S4 9/197 97/" "/9 "/in /el O1/2 02/03 03/N4 54/0
Icraaetal DefitsIncremental hef its
Small has (140 dams) 0.0 0.0 0.0 0.3 3.3 9.3 13.B 15.4 14.1 1U.1 14.1 14.1 14.1 16 .1 . 14.1 14.1 14.1Larle Om 424 dams, red soil) 0.0 0.0 0.0 0.0 0.0 0.0 0.0 0.0 0.0 2.3 9.8 23.4 33.9 37.7 39.2 39.2 3.2 39.2Large kms (14 daes, voltaic soil) 0.0 0.0 0.0 0.0 0.0 0.0 0.0 0.0 0.0 0.0 0.0 a.0 0.0 0.0 0.0 1.5 5.3 10.4
Irrigatim - Largf lred soill 0.0 44.3 154.0 327.4 374.4 405.5 363.1 242.7 102.2 50.1 12.3 5.2 1.5 0.3Irrigation - Large Oams (eOlcanic soil) 0.0 31.2 73.0 140.4 171.4 218.4 19;4 148.5 92.5 44.4 22.4 22. 22.3 20.3 17.3 13.4 3.7 4.5
Sole rivnr dam-strem Irrigation 0.0 0.0 0.0 0.0 0.0 54.1 144.0 327.8 539.4 300.0 1107.7 12M.7 1713.1 1990.6 2WI.5 2545.7 213.2 3074.0Poer Supply Ifr" the ha 0.0 0.0 0.0 0.0 o .. 1.4 4.1 9.4 15.5 23.0 31.3 40.4 4.9 57.1 65.2 73.0 0.7 0.2Smnokeling 0.0 0.0 0.0 0.0 2.5 2.3 2.1 1.9 0.0 u1.3 6.3 51.3 44.3 0.0 32.1 92.1 43.7 42.0Pine 0.0 0.0 0.0 0.0 12.3 17.4 7.3 19.4 0.0 '09.5 212.0 94.4 234.4 0.0 262.2 371.5 145.9 414.4
fahoffny 0.0 0.0 0.0 0.0 0.4 0.3 0.3 0.0 0.0 2.9 1. 1.4 0.0 0.0 5.1 2.4 2.4 3.0kacla 0.0 0.0 0.0 0.3 1.1 0.0 7.5 X.1 0.0 13.0 45.. 0.0 0.0 3.0 0.0 0.0 3.0 0.3Teak 0.0 0.0 0.0 0.0 3.0 0.5 1.2 1.3 0.0 3.0 1.2 3.2 4.3 0.0 12.0 1.6 4.3 7.2
Sebtotal 0.0 73.0 234.0 4631.5 54.7 709.4 754.5 307.2 744.4 1149.9 1511.2 1447.7 2n79.5 2116.9 2M7. 103.1 172.3 1439.1
Foelueod Warvestifs Cost 0.3 0.0 0.0 0.1 7.3 3.3 4.9 10.7 0.0 3.7 44.1 27.9 34.3 0.0 54.4 54 39.7 10.9Incresental Cste 1,330.3 2,454.3 2,100.9 1,730.3 2,271.4 632.3 404.2 23.3 137.5 95. 153.1 9.3 95.3 115.3 15S.1 17.5 95.0 13.1
fet lacrestal isnefits -1330.3 -2576.3 -1346. -1241.9 -712.7 19.0 345.4 506.2 574.9 1035.4 1313.3 1324. 1949.3 2WI.1 250.9 374.2 30.3 54M.1
Ecfssaec ate of eturn 153
btet: s0d products ha hl" eM djUtd to KfuiC prices.
0510o 04107 07i01 o0/0 09/10 It/Il 11/12 12/13 1311 14/15 15114 14/17
14.1 14.1 1i.1 14.1 14.1 14.1 14.1 14.1 14.1 14.1 14.1 1.139.2 39.2 39.2 39.2 39.2 39.2 39.2 39.2 39.2 39.2 39.2 39.215.1 13.1 19.6 19.4 19.4 19.4 19.4 19.4 19.4 19.4 19.4 19.4
1.3 0.53323.1 3575.4 3314.1 4050.0 4277.3 U497. 4711.7 4913.3 5119.2 5312.9 5499.9 5499.9
95.5 102.4 109.5 116.4 122.7 129.0 135.2 141.1 144.9 152.4 157.8 157.80.0 273.1 312.1 232.7 210.0 0.0 220.5 247.5 154.5 146.5 0.0 0.00.0 343.0 466.5 217.0 542.5 0.0 2435.3 3454.2 1540.7 3351.3 0.0 0.00.0 24.0 13.0 13.0 0.0 0.0 27.0 13.5 13.5 0.0 0.0 0.00.0 0.0 0.0 0.0 0.0 0.0 9.0 0.0 0.0 0.0 0.0 0.00.0 430.0 72.1 192.2 233.3 0.0 50.0 75.9 202.4 303.4 0.0 600.3
3M4.2 4755.9 4714.3 419.2 5399.3 4633.0 7773.1 3532.4 7C73.2 9414.4 5714.3 4257.0 f!
0.0 225.4 176.7 131.0 203.2 0.0 637.3 753.2 3331.2 I.A 0.0 120.195.8 115.3 f5.3 153.1 147.5 95.3 153.1 115.3. 95.3 95.1 153.1 95.5
3390.4 4414.7 4512.3 4535.1 5023.7 453.0 917.3 7653.4 4539.2 3454.4 5563.7 4041.5
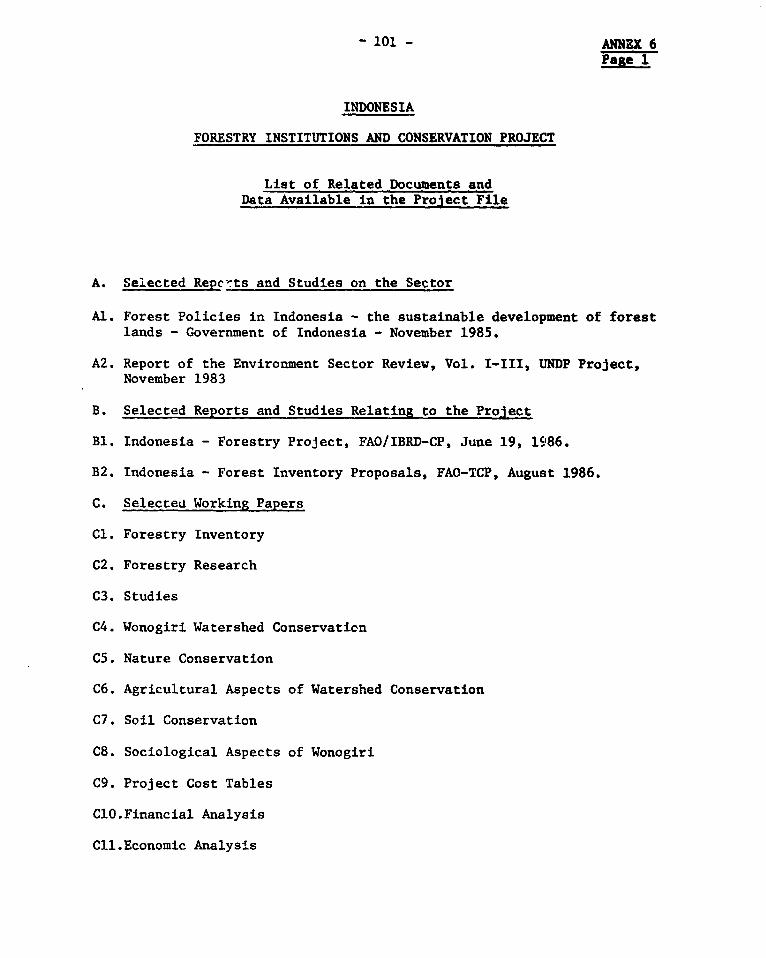
- 101 - ANNEX 6Pa8e 1
INDONESIA
FORESTRY INSTITUTIONS AND CONSERVATION PROJECT
List of Related Documents andData Available in the Project File
A. Selected Rep c'ts and Studies on the Sector
Al. Forest Policies in Indonesia - the sustainable development of forestlands - Government of Indonesia - November 1985.
A2. Report of the Environment Sector Review, Vol. I-III, UNDP Project,November 1983
B. Selected Reports and Studies Relating to the Project
Bl. Indonesia - Forestry Project, FAO/IBRD-CP, June 19, 1986.
B2. Indonesia - Forest Inventory Proposals, FAO-TCP, August 1986.
C. Selected Working Papers
Cl. Forestry Inventory
C2. Forestry Research
C3. Studies
C4. Wonogiri Watershed Conservaticn
C5. Nature Conservation
C6. Agricultural Aspects of Watershed Conservation
C7. Soil Conservation
C8. Sociological Aspects of Wonogiri
C9. Project Cost Tables
ClO.Financial Analysis
Cll.Economic Analysis

NOTES

MAP SECTION
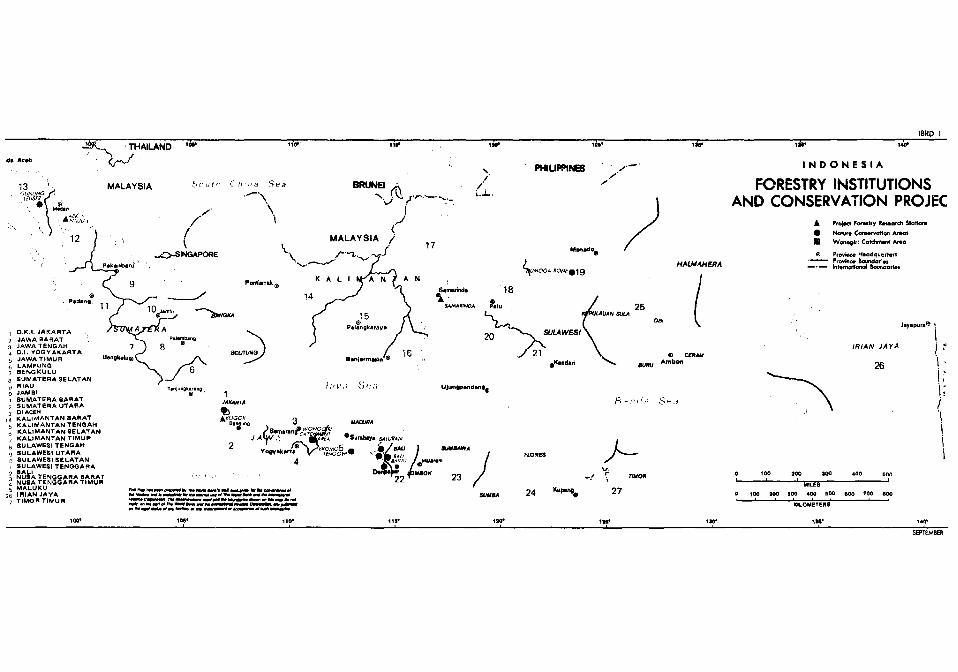
-. THAILAND 'ii 1io lie 11.r ,
d. Afth \ \PIUPNS -- I N D O N E S I APHIUPPINES I D NEI
13 MALAYSIA S Co ,a,n Sea BfrUNJ FORESTRY INSTITUTIONSAND CONSERVATION PROJEC
A| 7 1
, / I/ 2 A hr1w Forty Ronr 5 tkon
12 / MALAYSIA A 7 W/*0
br A..
12 / * Nolo~~~~~~~~~~~~~~~~~~~~~~~~~M-d4,P-.- Ho..do0on t...
_,. SINGAPORE rb P.ov4 Hndq04rt..1
k.,b-n1 _ 'UOG4 80NE19 HALMAHERA
; f 9 ~~~~~~~~P..&-k, r K A L I 11tNtA N |
* 9 KAI A A wd." 18/
Pd.n 0.1 14 LOO RN 25 I11 0
b -1NDA 5 2AIAMSOLA 25
D(.K.1 JAK0ARTA A .000,.SULAWESI
JAYA BARAT \\
3 JAWATENGAH 1 \ IRIAN JAYA
D .0. YOGYAKARTA AETU4J 621* FA
JAWA TIMU F Oo-gkn., 8SnIrld ( .n- Alb- 26
6 LAMPUNG oxrdad SOU A
7 BENGKULU _/-6
8 BUMATERASELATAN v P
JAMB I V.0 S lxi
SUMATEBA BARAT JAKARA KA2SUMATERAAUTARA31 IACEA
0 KALbAANTAN BAPtAT ABOGORI5 KALIMANTAN TENGAN 0270810 3 MAA
i
KIALIMANTAN SELATAN Fo..~,0 ~
7 KALIMANTAN TIMU. J UB0 *nn bAIURANUi
SULAWESI TENGIAH 29 SULAWESI UTAPA YOgykBlt * * UU 0) IBAWA
n SULAWESI ELATAN 4 ' /VAR, MIO Mmn / ,SULAWESI TENGA. 4
NSA TENGGARA AtAMU D6.R.a 2 / 7 2100 00 4,NUUSA TSENGGARA !,,, I ,2 *196( 23 UILES TO
MALUKUY Kup 2 a 10 20 300 00 5 6.07.f
2,' IRIAN JA_A LSUOJMA 24 P"U 27
KILOMETERO
100. 700' 110- nV 120- 1i2' 130 1T 140SEPT_MBER

IBRD
_. _ _ /x r O S 111°KABUPATEN
SUKOHRJO/ \ KABUPATEN KARANG ANYAR
on ~ ~~~~~~~~~~~0IAWS ~ ~ ~ A 581& /4 A N / s
'OGYAKARTAX < .
71
/~~~~~~~~~
nto,o e --- Nguntoroadi
/ Gritaonr! X /G~~~~~~~~~~~~~~~~~~~~~~~~~~~~~~~~~Ii" - = N D 0 N E S I AFORESTRY INSTITUTIONS AND CONSERVATION PROJE
WONOGIRI CATCHMENT AREAPROPOSED PROJECT EXISTING:
/ / 12' CATCHAREEJE BOUNDARY RURAL EXTENSION CENTERST< STREAM CONSERVATION WORKS WATER LEVEL RECORDING STATIONSJAWA TENGAH / \ / ROADSIDE CONSERVATION WORKS SUB WATERSHED ROLINDAOD SEO
* / ** '~~~~~~~~~~~~~~~~~ STREAM RANK PROTECTION~~~~~~~~~~~~TRA BN POTCIO UBWTESHDBONARE* r / } ,/ 0 ---TERRACE REHABILITATICN DISTRICT BOUNDARIES
*0 P~~~~~~~~~~~~~~~~~~~~~~~~~ ~ ~~~ ~~~~~~~~~~~~~~~~~~OREST REHABUTLrATICN AREAS -. PROVINCE BOUNDARIES
JAWA TIMUR P - INTERNATIONAL BOUNDARIES
0 10 To P.,.,-
KILOMETERS
; / '!'~~~~~~~~~~~~~~~~~~~~~~~~~~~~11