Embed Size (px)
Citation preview
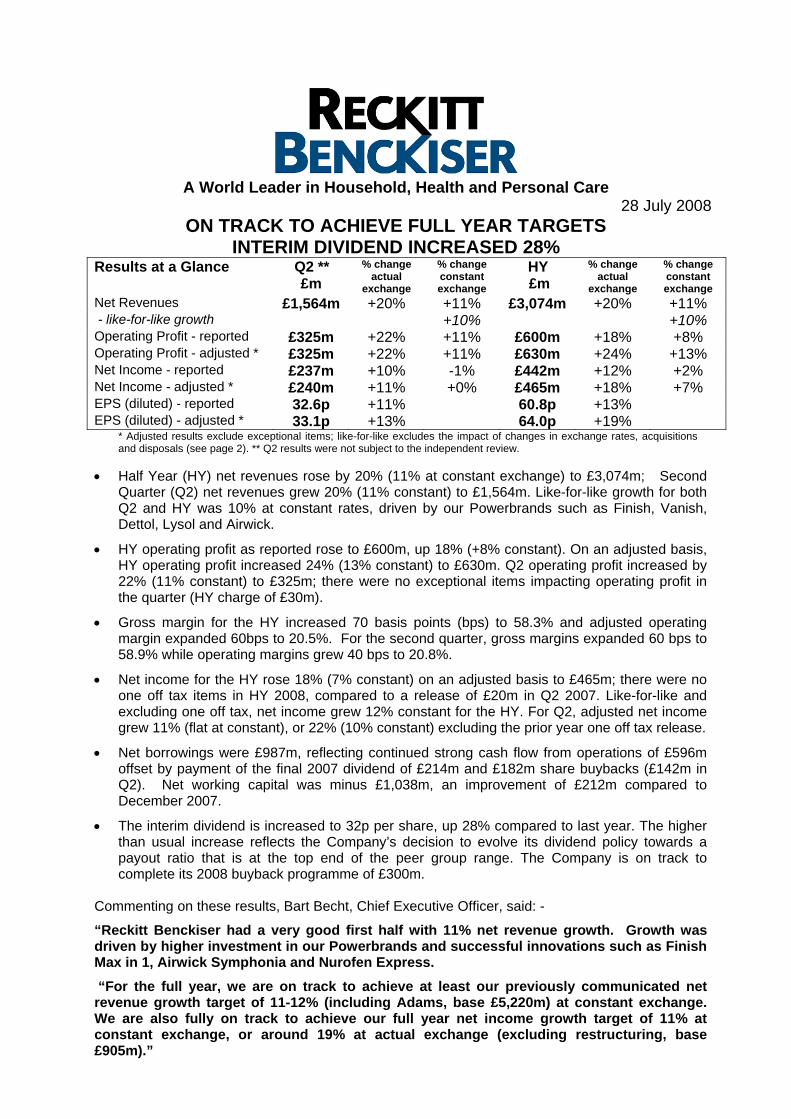
A World Leader in Household, Health and Personal Care
28 July 2008 ON TRACK TO ACHIEVE FULL YEAR TARGETS
INTERIM DIVIDEND INCREASED 28% Results at a Glance BQ2 **
£m % change
actual exchange
% change constant exchange
BHY £m
% change actual
exchange
% change constant exchange
Net Revenues £1,564m +20% +11% £3,074m +20% +11% - like-for-like growth +10% +10% Operating Profit - reported £325m +22% +11% £600m +18% +8% Operating Profit - adjusted * £325m +22% +11% £630m +24% +13% Net Income - reported £237m +10% -1% £442m +12% +2% Net Income - adjusted * £240m +11% +0% £465m +18% +7% EPS (diluted) - reported 32.6p +11% 60.8p +13% EPS (diluted) - adjusted * 33.1p +13% 64.0p +19%
* Adjusted results exclude exceptional items; like-for-like excludes the impact of changes in exchange rates, acquisitions and disposals (see page 2). ** Q2 results were not subject to the independent review.
• Half Year (HY) net revenues rose by 20% (11% at constant exchange) to £3,074m; Second Quarter (Q2) net revenues grew 20% (11% constant) to £1,564m. Like-for-like growth for both Q2 and HY was 10% at constant rates, driven by our Powerbrands such as Finish, Vanish, Dettol, Lysol and Airwick.
• HY operating profit as reported rose to £600m, up 18% (+8% constant). On an adjusted basis, HY operating profit increased 24% (13% constant) to £630m. Q2 operating profit increased by 22% (11% constant) to £325m; there were no exceptional items impacting operating profit in the quarter (HY charge of £30m).
• Gross margin for the HY increased 70 basis points (bps) to 58.3% and adjusted operating margin expanded 60bps to 20.5%. For the second quarter, gross margins expanded 60 bps to 58.9% while operating margins grew 40 bps to 20.8%.
• Net income for the HY rose 18% (7% constant) on an adjusted basis to £465m; there were no one off tax items in HY 2008, compared to a release of £20m in Q2 2007. Like-for-like and excluding one off tax, net income grew 12% constant for the HY. For Q2, adjusted net income grew 11% (flat at constant), or 22% (10% constant) excluding the prior year one off tax release.
• Net borrowings were £987m, reflecting continued strong cash flow from operations of £596m offset by payment of the final 2007 dividend of £214m and £182m share buybacks (£142m in Q2). Net working capital was minus £1,038m, an improvement of £212m compared to December 2007.
• The interim dividend is increased to 32p per share, up 28% compared to last year. The higher than usual increase reflects the Company’s decision to evolve its dividend policy towards a payout ratio that is at the top end of the peer group range. The Company is on track to complete its 2008 buyback programme of £300m.
Commenting on these results, Bart Becht, Chief Executive Officer, said: -
“Reckitt Benckiser had a very good first half with 11% net revenue growth. Growth was driven by higher investment in our Powerbrands and successful innovations such as Finish Max in 1, Airwick Symphonia and Nurofen Express. “For the full year, we are on track to achieve at least our previously communicated net revenue growth target of 11-12% (including Adams, base £5,220m) at constant exchange. We are also fully on track to achieve our full year net income growth target of 11% at constant exchange, or around 19% at actual exchange (excluding restructuring, base £905m).”

2
Basis of Analysis
The results include the Adams Respiratory Therapeutics business (Adams) from 30 January 2008, the date of acquisition. Operating profit is not separately disclosed for the Adams business as, in the view of the Directors, it is not practicable to identify its operating profit due to its integration into the commercial infrastructure of Reckitt Benckiser.
Where appropriate, the term ‘adjusted’ excludes the impact of exceptional items. Exceptional items in 2008 consist of a restructuring charge of £30m mainly relating to the integration of Adams. There were no exceptional items in HY 2007.
Where appropriate, the term ‘like-for-like” describes business performance on a comparable basis, excluding the impact of business acquisitions, disposals and exchange.
Detailed Operating Review Second Quarter 2008
Q2 net revenues increased 20% (11% at constant exchange) to £1,564m. Like-for-like growth (excluding acquisitions, disposals and exchange) was 10%. Adams contributed £33m for the quarter, representing a like-for-like growth rate of 38% against the comparable quarter in 2007. Disposed businesses contributed £18m to Q2 revenues in 2007.
Gross margin increased by 60 bps to 58.9% due to sales price increases, benefits from cost optimisation programs and the impact of a positive mix more than offsetting increases in input costs. The inclusion of the recently acquired Adams business contributed approximately 20bps to this increase.
Marketing investment was significantly higher. Pure media investment increased 22% (12% constant) to a level of 14.2% of net revenues, an increase of 20bps on Q2 last year.
Operating profit as reported was £325m, 22% higher than last year. Operating margins increased by 40 bps to 20.8% due to gross margin expansion and fixed cost leverage, partially offset by increased marketing investment.
Net finance expense was £10m (2007 £8m), reflecting interest on the debt taken on to finance the Adams acquisition earlier in the year. The underlying tax rate for the quarter is 24%, in line with the expected rate for the full year.
Net income was £237m, an increase of 10% (decrease of 1% constant) on Q2 2007. Adjusted net income was £240m (reflecting an adjustment of £3m to the tax rate applied to the exceptional items), up 11% (flat at constant) on the prior period. Excluding the one off tax release in Q2 2007, adjusted net income increased 22% (10% constant).
Diluted earnings per share grew 11% to 32.6 pence per share. Earnings per share (diluted, adjusted) increased 13% to 33.1p, ahead of net income growth as the accretion from the buyback more than offset dilution from new share issues. Excluding the one off tax release in 2007, diluted, adjusted EPS grew 24%.
Half Year 2008 HY net revenues increased 20% (11% at constant exchange) to £3,074m. Like-for-like growth was 10%. Adams contributed £66m for the half year, representing a like-for-like growth rate of 33% against the comparable five months in 2007. Disposed businesses contributed £36m to HY revenues in 2007.
Gross margin increased by 70 bps to 58.3% due to sales price increases, benefits from cost optimisation programs and the impact of a positive mix more than offsetting increases in input costs. The inclusion of the recently acquired Adams business contributed approximately 20bps to this increase.
Marketing investment was significantly higher. Pure media investment increased 25% (16% constant) to a level of 13.5% of net revenues, an increase of 50bps on HY 2007.

3
Operating profit as reported was £600m, 18% higher than last year. Excluding the restructuring charge, operating profit was £630m, an increase of 24% on 2007. Operating margins excluding restructuring increased by 60 bps to 20.5% due to gross margin expansion and fixed cost leverage, partially offset by increased marketing investment.
Net finance expense was £19m (2007 £16m), reflecting interest on the debt taken on to finance the Adams acquisition early in the year. The underlying tax rate for the half year is 24%, in line with the expected rate for the full year.
Net income was £442m, an increase of 12% (2% constant) on HY 2007. Adjusted net income was £465m, up 18% (7% at constant) on the prior period. Excluding the one off tax release in HY 2007, net income increased 24% (12% constant).
Diluted earnings per share grew 13% to 60.8p. Earnings per share (diluted, adjusted) increased 19% to 64.0p, ahead of net income growth as the accretion from the buyback more than offset dilution from new share issues. Excluding the one off tax release in 2007, diluted, adjusted EPS increased 26%.
Business Review (at constant exchange rates) Summary: % Net revenue growth
Half Year Like-for-like Exchange Acquisitions & Disposals
Reported
Europe +7 +12 -2 +17
NAA +7 +4 +10 +21
DvM +17 +4 - +21
Pharma* +43 +6 - +49
TOTAL +10 +9 +1 +20 *Pharma represents the Group’s prescription drug business of Subutex and Suboxone
Europe 52% of Net Revenues
Total net revenues for the HY increased 5%; excluding disposals, like-for-like net revenues grew 7% to £1,606m, with all categories contributing to the growth. In Fabric Care, Vanish Oxi Action Multi, Crystal White and Magnets drove growth along with Calgon Water Softeners. In Surface Care, growth came from new Cillit Bang variants such as Grease and Floors, Dettol All in 1 and from Harpic, including the new cageless in-the-bowl toilet cleaners. A strong performance by Finish Max in 1 drove Automatic Dishwashing while in Home Care, new initiatives such as Airwick Freshmatic mini and the new Symphonia liquid electricals range drove growth. Health & Personal Care growth was led by Nurofen and Strepsils following increases in marketing support.
HY operating margins (adjusted) were 20bps ahead of last year at 22.5% due to modest expansion in gross margins and fixed cost control partially offset by higher marketing investment in new products. This resulted in a 6% increase in operating profits to £362m.
In Q2, like-for-like net revenues increased 6% to £805m with disposals deducting 2% to give a total growth rate of 4%. Operating profits increased by 5% to £183m.

4
North America & Australia 25% of Net Revenues
Like-for-like net revenues grew 7% to £692m for the HY. Including Adams, net revenues grew 17% to £758m. Adams contributed £66m to net revenues in the first five months of ownership, 33% ahead of the comparable prior period.
HY growth in Household came particularly from Surface Care, Automatic Dishwashing Home Care and Health & Personal Care. Surface Care growth was driven by Lysol disinfectants and disinfectant cleaners. Automatic Dishwashing increased as a result of the continuing success of Electrasol 3in1 Powerball tabs and Jet Dry Turbo Dry. In Home Care, Air Care growth came from Airwick Freshmatic and Freshmatic Mini while Pest Control growth was driven by a strong season for Mortein in Australia. In Health & Personal Care (excluding Adams), growth came from Nurofen and Strepsils following increased marketing investment.
Food grew strongly due to the consumer brands of French’s yellow mustard, French’s Fried Onions and Frank’s Red Hot sauce.
HY Operating margins were 40bps higher at 15.8% due to the mix benefit from the Adams acquisition. Operating profits increased 15% to £120m.
Q2 net revenues grew 5% on a like-for-like basis to £351m and 15% in total to £384m. Operating profits were ahead by 10% to £57m.
Developing Markets 19% of Net Revenues
HY net revenues grew 17% to £573m with strong growth across all regions of Asia, Latin America and Africa Middle East, in Fabric Care, Surface Care, Home Care and Health & Personal Care. In Fabric Care, the growth came from Vanish, driven by initiatives to drive category penetration across the Area. In Surface Care, growth was driven by Harpic across the area and Veja in Brazil. In Home Care, growth came from both Airwick, driven by Freshmatic, and Mortein, driven by Electricals. In Health & Personal Care, Dettol and Veet drove growth, particularly with Dettol personal care benefiting from range extensions in the personal wash segment and additional investment. In Healthcare, Strepsils grew strongly due to higher investment.
HY operating margins expanded 30bps to 12.6% resulting in operating profits increasing by 18% to £72m.
Q2 net revenues increased by 18% to £296m. Operating profits increased 18% to £40m.
Pharmaceuticals 4% of Net Revenues HY Net revenues for the Group’s Subutex and Suboxone prescription drug business grew 43% to £137m. These buprenorphine-based products are used to treat opiate dependence. This very strong growth was exclusively driven by a continued increase in penetration of Suboxone in the USA.
HY Operating margins improved by 120bps to 55.5%. Operating profit was £76m, an increase of 46%.
Q2 net revenues increased by 39% to £79m while operating profits increased 36% to £45m.
Suboxone has exclusivity in the USA until the end of September 2009 and in Europe until 2016. Within the Pharmaceuticals division, in HY 2008, the US Suboxone business generated net revenues of £112m and an operating profit of £65m. While the Group continues to search for ways to offset the impact of the loss of exclusivity in the USA at the end of September 2009, up to 80% of the revenues and profits of that business might be lost to generic competition in 2010, with the possibility of further erosion thereafter.

5
Category Review (at constant exchange rates)
Fabric Care. Net revenues increased 7% to £720m. Growth was driven by continued success for Vanish Oxi Action Multi, Crystal White and Magnets. In Water Softeners, Calgon grew, benefiting from higher marketing investment. Q2 net revenue grew 7% to £369m.
Surface Care. Net revenues grew 8% to £532m principally due to the launch of further variants in the Cillit Bang range such as Cillit Bang Grease and Floors, strong growth for the Lysol range including Disinfectant Spray, Neutra Air Freshmatic and Deep Reach toilet, and Veja in Brazil. Harpic Lavatory Care net revenues were also stronger due in part to the new cageless in-the-bowl toilet cleaner. Q2 growth was 8% to £264m.
Dishwashing. Net revenues increased 10% to £370m due to the success of the launch of Finish Max in One in Europe and strong growth of Electrasol 3in1 Powerball tablets and Jet Dry Turbo Dry in North America behind increased investment. Q2 growth was 13% to £184m.
Home Care. Net revenues improved by 9% to £422m. Air Care grew strongly due to the continuing success of Airwick Freshmatic and Mini Freshmatic and initial success for Airwick Symphonia, the brand’s new range of liquid electrical products. Pest Control growth came mainly as a result of good seasonal growth in Latin American and Australia. Q2 growth was 7% to £205m.
Health & Personal Care. Net revenues increased 18% to £768m, with like-for-like growth (excluding acquisitions and disposals) of 15%. Dettol antiseptic grew strongly in Developing Markets due to the expansion of the personal wash range and increased marketing investment. Healthcare grew strongly, led by Nurofen and Strepsils as a result of successful initiatives such as Nurofen Express and Strepsils Sore Throat and Blocked Nose, supported by higher investment. The Adams business contributed £66m to net revenue for the five months of ownership, growing 33% compared to the equivalent period of 2007 as marketing investment drove increased penetration of Mucinex.
In Q2, Health & Personal Care grew 16% to £396m, including like-for-like growth of 13%.
Total Household and Health & Personal Care. Net revenues were ahead by 10% to £2,842m, +9% on a like for like basis. In Q2, total Household and Health & Personal Care grew 10% to £1,434m, +9% on a like-for-like basis.
Pharmaceuticals. HY net revenues for the Group’s Subutex and Suboxone prescription drug business grew 43% to £137m exclusively driven by a continued increase in penetration of Suboxone in the USA. HY operating margins improved by 120bps to 55.5%. Operating profit was £76m, an increase of 46%.
Q2 net revenues increased by 39% to £79m while operating profits increased 36% to £45m.
Food. Net revenues grew 7% to £95m with good performance across the consumer portfolio, in particular further growth for French’s Yellow Mustard, French’s Fried Onions and Frank’s Red Hot Sauce. Operating profits increased 4% to £16m.
Q2 net revenues grew 3%, and operating profit was flat at £10m.

6
Powerbrand Focus One of the main elements of the Company’s strategy is to drive above industry average growth through a disproportionate focus on its Powerbrands. Following a recent review the Company has decided to reduce the number of Powerbrands from 18 to 17. Specifically, Mucinex has been added, Lemsip has been removed and Calgonit will be transitioned to Finish. The Company believes the tighter focus will help drive growth and further strengthen the Company’s portfolio globally. An overview of the strength of the Company’s portfolio in household, health and personal care and the full list of 17 Powerbrands is provided below. Fabric Care: Fabric Treatment, worldwide #1 – led by Vanish Water Softeners, worldwide #1 – led by Calgon Garment Care, worldwide #2 – led by Woolite Surface Care: worldwide #1 – driven by: Multipurpose Cleaners, worldwide #1 – led by Lysol, Dettol and Bang Lavatory Care, worldwide #1 – led by Harpic & Lysol Dishwashing: Automatic Dishwashing, worldwide #1 – led by Finish Home Care: Air Care, worldwide #2 – led by Airwick Pest Control, worldwide # 2 – led by Mortein Personal Care: Antiseptic Personal Care, worldwide #1 – led by Dettol Depilatories, worldwide #1 – led by Veet Acne Treatment, worldwide #2 – led by Clearasil Health Care: Medicated Sore Throat Relief, worldwide #1 – led by Strepsils Cough Relief, worldwide #2 – led by Mucinex Leading positions in Analgesics and Upper Gastro Intestinal Relief in Europe and Australia led by Nurofen and Gaviscon Food: Mustard, worldwide #1 – led by French’s The Company is also accelerating its efforts of transitioning local brands (called transitional brands) into Powerbrands, for example, in Automatic Dishwashing, Electrasol and Jet Dry will be transitioned to Finish. Henceforth, the Company will report Powerbrand data including transitional brands which currently represent approximately 6% of net revenues. The impact of this change in definition is illustrated below:
% of net revenue
Old basis (18 Powerbrands)
New basis (17 Powerbrands)
Net revenue growth rate (% const)
HY 2008 62% 68% 16%
FY 2007 61% 66% 14%
HY 2007 60% 65% 16%

7
New Initiatives H2 2008
The Company announces a number of new product launches today for the second half of 2008.
• In Fabric Care:
o Launch of Vanish Oxi Action Intelligence, a revolutionary new formulation that seeks out tough visible stains such as grease, as well as ‘invisible’ stains such as grime on cuffs and collars.
o Calgon Energis is launched in Europe with the additional benefit of preventing limescale deposits building up on clothes, protecting colours from fading and whites from graying.
• In Surface Care: o Lysol Dual Action disinfecting wipes are launched in North America, a new
disinfecting wipe with two different sides, one for scrubbing to remove tough residues, and one for wiping for a completely clean surface.
o In the Cillit Bang range, the launch of Stain and Mildew (trigger) and Stain and Floors (dilutable), both using an ultra shine bleach for a more effective clean on tough stains like Mildew.
• In Dishwashing: o Roll out of Finish Max in 1 and Finish Quantum into new markets. o Launch of Finish Intensive Clean & Care machine cleaner with a more effective
formula for the removal of grease and lime scale in a new bottle design to better fit dishwashers.
• In Home Care: o Launch of Airwick Aqua Essences, a range of clean, refreshing fragrances based on
water-borne plants for a more natural fragrance experience; available in all major formats (Freshmatic, electricals and aerosols).
o In Pest Control, the Company is launching Mortein Naturgard Automatic Insect Control System, an automatic release product containing plant-based active ingredients to provide round-the-clock protection against flying insects.
• In Health & Personal Care: o Roll out into new countries of Nurofen Express, which targets the source of pain twice
as fast as standard ibuprofen. o Launch of Strepsils Cool to provide an instant cooling sensation and effective relief
from a burning sore throat.
o Launch of Veet High Precision facial wax, a complete facial depilation kit with an applicator and tool for precise eyebrow shaping and with aloe vera for the sensitive facial skin.
o Launch of E45 Endless Moisture to provide intense moisturizing that lasts all day.

8
Financial Review Net interest. Net interest expense in HY was £19m (2007 £16m). This resulted from the debt taken on following the acquisition of Adams, offset by strong cash inflow during the period. Q2 interest payable was £10m (2007 £8m).
Tax. The tax rate is 24% (2007 20%), in line with the expected rate for the full year. 2007 benefited from a £20m one-off tax release in Q2.
Cash flow. Cash generated from operations increased 24% to £788m due to increased operating profits and further improvements in net working capital. Net cash flow from operations increased 28% to £596m, with net capital expenditure of £86m (£62m) due to further investment in manufacturing infrastructure and the acquisition of Muse, an antiseptic personal care brand in Japan for a cash consideration of £29m.
Net working capital (inventories, short term receivables and short term liabilities excluding borrowings and provisions) decreased by £212m in the period to minus £1,038m, mostly due to further improvements in payables.
Net borrowings at the half year were £987m (December 2007 £125m), an increase compared to year end 2007 of £862m. This reflected the debt taken on as a result of the Adams acquisition of £1.1bn, the payment of the final dividend for 2007 of £214m and the ongoing share buyback programme spend of £182m partially offset by net cash flow from operations of £596m.
Financing. At the half year, the Group had shareholders’ funds of £2,553m (2007 year end £2,385m), an increase of 7%. Net debt was £987m (December 2007 £125m). Total capital employed in the business increased to £3,514m from £2,510m at December 2007, an increase of 40%, largely due to the Adams acquisition.
Acquisitions. During the half year, the Group acquired Adams Respiratory Therapeutics Inc for a total cash consideration of £1,096m. Further details are provided in note 15 to the Half Year Condensed Financial Statements.
Dividends. The Board of Directors announces an interim dividend of 32.0 pence per share (2007 25.0 pence per share), an increase of 28% reflecting the Company’s decision to evolve its dividend policy towards a payout ratio that is at the top end of the peer group range. The ex dividend date will be 6th August and the dividend will be paid on 25th September to shareholders on the register at the record date of 8th August. The last date for election for the share alternative to the dividend is 4th September.
Share buyback. Between February and June 2008, the Group purchased 6.4m shares at a cost of £182m as part of its ongoing share buyback program. In Q2, the Company purchased 4.9m shares at a cost of £142m. The Company is committed to completing its £300m program for full year 2008.

9
Outlook For the full year, the Company is well on track to achieve at least the previously communicated net revenue growth target of 11-12% (including Adams, base £5,220m) at constant exchange, or around 19-20% at actual exchange.
The Company is also fully on track to achieve the full year net income growth target of 11% at constant exchange, or around 19% at actual exchange (excluding restructuring, base £905m).
Principal Risks and Uncertainties The Directors consider that the principal risks and uncertainties which could have a material impact on the Group’s performance in the remaining six months of 2008 are the same as described on pages 6 to 7 of the Annual Report and Financial Statements for the year ended 31 December 2007. These include, but are not limited to:
• Market risks: o Expiry of the Group’s exclusive license for Suboxone in the US at the end of
September 2009. o Demand for the Group’s products adversely affected due to changes in
consumer preference. o Customer de-listing of the Group’s brands. o Competition may reduce market share and margins.
• Operational risks: o Increased costs or shortages of raw and pack materials. o Unfavourable economic or business conditions in the markets in which the
Group operates. o New product innovation declines or becomes less relevant to consumers o Adverse changes in the regulatory environment.
• Environmental, social and governance risks: o Product quality and safety risks to consumer.
• Financial risks: o Fluctuations in foreign exchange and interest rates.
The Company recognises that the substantial increase in costs of its raw and packaging materials could materially reduce its ability to continue to invest for growth. As a result, it intends to implement price increases to offset these higher costs. The Group's Annual Report and Financial Statements for the year ended 31 December 2007 is available on the Group's website at www.reckittbenckiser.com.

10
BHalf Year Financial Analysis: The Group at a Glance
BQuarter Ended 30 June BHalf Year Ended 30 June
2008 2007 2008 2007 £m £m £m £m
1,531 1,284 Net revenues – like-for-like 3,008 2,524
33 - Net revenues – acquisition 66 -
- 18 Net revenues – disposed businesses - 36
1,564 1,302 Net revenues – total 3,074 2,560
19% 6% Net revenue growth – like-for-like 19% 5%
20% 6% Net revenue growth – total 20% 7%
58.9% 58.3% Gross margin 58.3% 57.6%
350 288 EBITDA 650 554
22.4% 22.1% EBITDA margin 21.1% 21.6%
325 266 EBIT 600 510
325 266 EBIT – adjusted * 630 510
20.8% 20.4% EBIT margin 19.5% 19.9%
20.8% 20.4% EBIT margin – adjusted * 20.5% 19.9%
315 258 Profit before tax 581 494
237 216 Net Income 442 395
240 216 Net Income adjusted * 465 395
33.3p 30.1p EPS, basic, as reported 62.1p 55.1p
33.1p 29.4p EPS, adjusted and diluted * 64.0p 53.6p
* Adjusted to exclude the impact of exceptional items.
Group Balance Sheet Data 30 June 31 December 2008# 2007 £m £m Net working capital * (1,038) (826)
Net debt (987) (125) * Net working capital is defined as inventories, short term receivables and short term liabilities, excluding borrowings and provisions. # Where appropriate, these amounts include provisional fair values in respect of the Adams acquisition.
Shares in Issue First Half Millions B31 December 2007 712.0 Issued or transferred from Treasury 0.2 Repurchased and transferred to Treasury (1.5)
B31 March 2008 710.7 BIssued or transferred from Treasury 4.6 BRepurchased and transferred to Treasury (4.9)
B30 June 2008 710.4
11
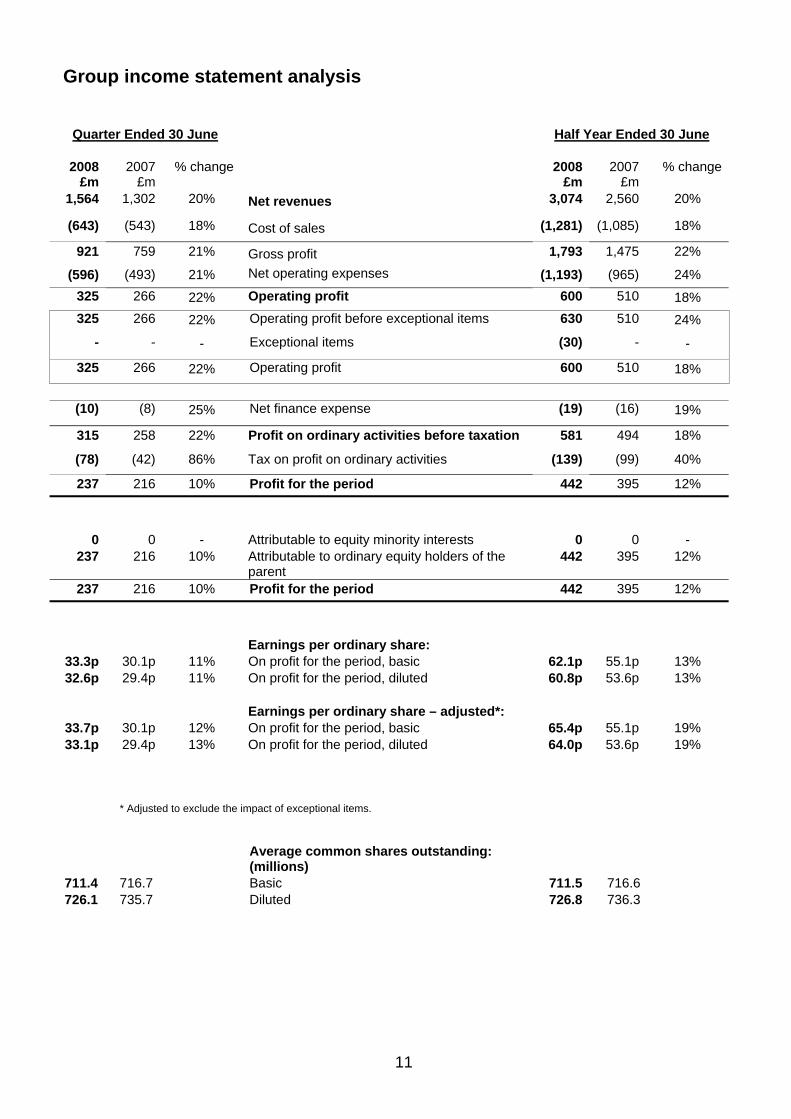
Group income statement analysis
Quarter Ended 30 June BHalf Year Ended 30 June
2008 2007 % change 2008 2007 % change£m £m £m £m
1,564 1,302 20% Net revenues 3,074 2,560 20%
(643) (543) 18% Cost of sales (1,281) (1,085) 18%
921 759 21% Gross profit 1,793 1,475 22%
(596) (493) 21% Net operating expenses (1,193) (965) 24% 325 266 22% Operating profit 600 510 18% B325 B266 22% BOperating profit before exceptional items B630 B510 24%
B- B- - BExceptional items B(30) B- -
B325 B266 22% BOperating profit B600 B510 18%
B(10) B(8) 25% BNet finance expense B(19) B(16) 19%
315 258 22% Profit on ordinary activities before taxation 581 494 18%
(78) (42) 86% Tax on profit on ordinary activities (139) (99) 40%
237 216 10% BProfit for the period 442 395 12%
0 0 - Attributable to equity minority interests 0 0 - 237 216 10% Attributable to ordinary equity holders of the
parent 442 395 12%
237 216 10% BProfit for the period 442 395 12%
Earnings per ordinary share:
33.3p 30.1p 11% On profit for the period, basic 62.1p 55.1p 13% 32.6p 29.4p 11% On profit for the period, diluted 60.8p 53.6p 13%
Earnings per ordinary share – adjusted*:
33.7p 30.1p 12% On profit for the period, basic 65.4p 55.1p 19% 33.1p 29.4p 13% On profit for the period, diluted 64.0p 53.6p 19%
* Adjusted to exclude the impact of exceptional items.
Average common shares outstanding: (millions)
711.4 716.7 Basic 711.5 716.6 726.1 735.7 Diluted 726.8 736.3

12
Segmental analysis
Quarter Ended 30 June Half Year Ended 30 June
2008 2007 % Change 2008 2007 % Change £m £m exch. Rates £m £m exch rates
actual const. actual const.
BNet revenues
805 685 18% 4% Europe # 1,606 1,372 17% 5%384 318 21% 15% North America & Australia # 758 624 21% 17%296 245 21% 18% Developing Markets 573 472 21% 17%
79 54 46% 39% Pharmaceuticals # 137 92 49% 43%
1,564 1,302 20% 11% 3,074 2,560 20% 11%
BOperating profit – Statutory basis
183 155 18% 5% Europe # 362 306 18% 6%57 46 24% 10% North America & Australia # 90 96 -6% -13%40 33 21% 18% Developing Markets 72 58 24% 18%45 32 41% 36% Pharmaceuticals # 76 50 52% 46%
325 266 22% 11% 600 510 18% 8%
Operating profit – adjusted*
183 155 18% 5% Europe # 362 306 18% 6%57 46 24% 10% North America & Australia # 120 96 25% 15%40 33 21% 18% Developing Markets 72 58 24% 18%45 32 41% 36% Pharmaceuticals # 76 50 52% 46%
325 266 22% 11% Subtotal before exceptional items 630 510 24% 13%- - Exceptional items (30) -
325 266 22% 11% 600 510 18% 8%
% % Operating margin – adjusted* % %
22.7 22.6 Europe # 22.5 22.3 14.8 14.5 North America & Australia # 15.8 15.4 13.5 13.5 Developing Markets 12.6 12.3 57.0 59.3 Pharmaceuticals # 55.5 54.3
20.8 20.4 Subtotal before exceptional items 20.5 19.9
* Adjusted to exclude the impact of exceptional items. # 2007 Comparatives have been reclassified to separately disclose Pharmaceuticals, previously reported within Europe and North America & Australia.

13
Additional Information: Product Segment
Quarter Ended 30 June Half Year Ended 30 June
2008 2007 % change 2008 2007 % exchange £m £m exch. rates £m £m exch. rates
actual const. actual const. BNet revenues by Category
369 306 21% 7% Fabric Care 720 605 19% 7% 264 227 16% 8% Surface Care 532 459 16% 8% 184 147 25% 13% Dishwashing 370 305 21% 10% 205 180 14% 7% Home Care 422 364 16% 9% 396 316 25% 16% Health & Personal Care ** 768 605 27% 18% 16 23 -30% -36% Other Household 30 42 -29% -33%
1,434 1,199 20% 10% BHousehold and Health & Personal Care 2,842 2,380 19% 10% 79 54 46% 39% Pharmaceuticals 137 92 49% 43% 51 49 4% 3% Food 95 88 8% 7%
1,564 1,302 20% 11% 3,074 2,560 20% 11% **Net revenues of £33m for Q2 and £66m for HY (2007 £nil and £nil) in respect the Adams business are included within Health & Personal Care. On a like-for-like basis, growth of Health & Personal Care is 15% for the half year and 12% for Q2.
BOperating profit – adjusted
270 224 21% 8% Household and Health & Personal Care 538 445 21% 10% 45 32 41% 36% Pharmaceuticals 76 50 52% 46% 10 10 0% 0% Food 16 15 7% 4%
325 266 22% 11% Subtotal before exceptional items 630 510 24% 13%
- - Exceptional items (30) - 325 266 22% 11% 600 510 18% 8%
% % BOperating margin – adjusted % %
18.8 18.7 Household and Health & Personal Care 18.9 18.7 57.0 59.3 Pharmaceuticals 55.5 54.3 19.6 20.4 Food 16.8 17.0
20.8 20.4 Subtotal before exceptional items 20.5 19.9
14
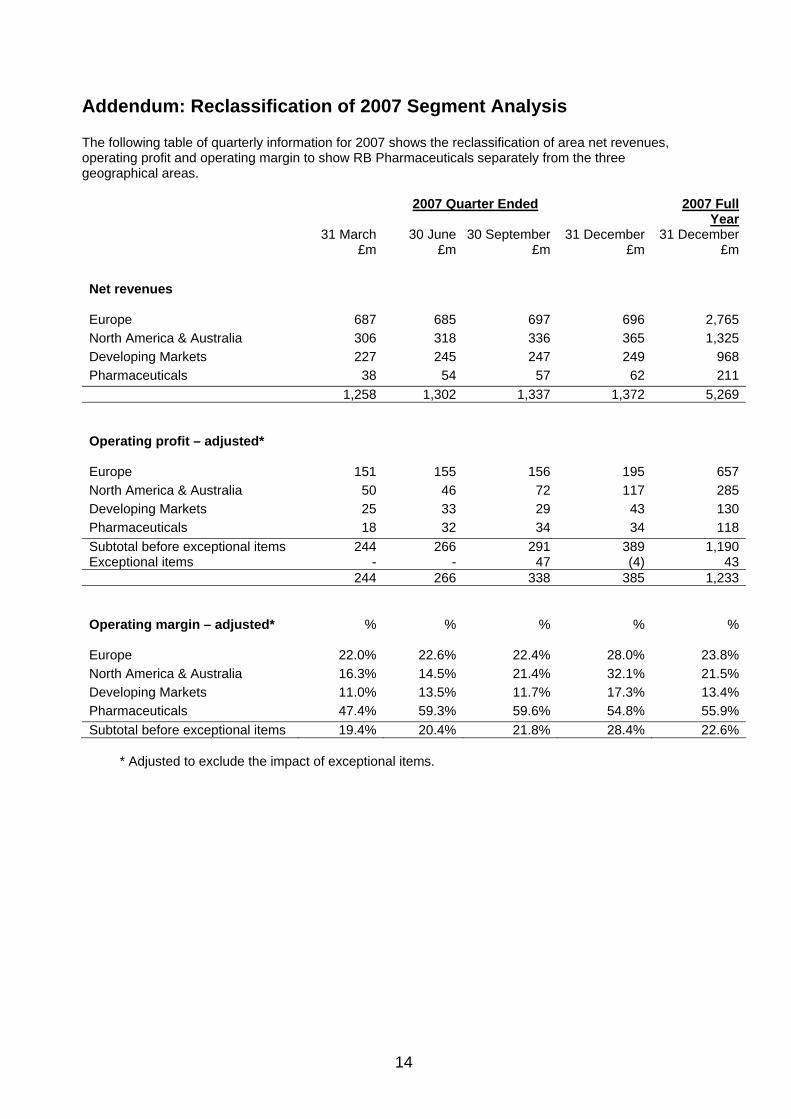
Addendum: Reclassification of 2007 Segment Analysis The following table of quarterly information for 2007 shows the reclassification of area net revenues, operating profit and operating margin to show RB Pharmaceuticals separately from the three geographical areas. 2007 Quarter Ended 2007 Full
Year 31 March
£m30 June
£m30 September
£m31 December
£m 31 December
£m
Net revenues Europe 687 685 697 696 2,765North America & Australia 306 318 336 365 1,325Developing Markets 227 245 247 249 968Pharmaceuticals 38 54 57 62 211 1,258 1,302 1,337 1,372 5,269 Operating profit – adjusted*
Europe 151 155 156 195 657North America & Australia 50 46 72 117 285Developing Markets 25 33 29 43 130Pharmaceuticals 18 32 34 34 118Subtotal before exceptional items 244 266 291 389 1,190Exceptional items - - 47 (4) 43 244 266 338 385 1,233 Operating margin – adjusted*
%
%
%
%
%
Europe 22.0% 22.6% 22.4% 28.0% 23.8%North America & Australia 16.3% 14.5% 21.4% 32.1% 21.5%Developing Markets 11.0% 13.5% 11.7% 17.3% 13.4%Pharmaceuticals 47.4% 59.3% 59.6% 54.8% 55.9%Subtotal before exceptional items 19.4% 20.4% 21.8% 28.4% 22.6%
* Adjusted to exclude the impact of exceptional items.

15
Notice to Shareholders The financial information for the year ended 31 December 2007 included in these Half Year Condensed Financial Statements is based upon the Company’s consolidated financial statements for that year. Those financial statements have been reported on by the Company’s auditors and have been delivered to the Registrar of Companies. The report of the auditors was unqualified and did not contain a statement under the following sections of the Companies Act 1985: Section 237(2) (inadequate accounting records or returns, or accounts not agreeing with records and returns) or 237(3) (failure to obtain necessary information and explanations). Cautionary note concerning forward-looking statements This document contains statements with respect to the financial condition, results of operations and business of Reckitt Benckiser and certain of the plans and objectives of the Company with respect to these items. These forward looking statements are made pursuant to the ‘Safe Harbor’ provisions of the United States Private Securities Litigation Reform Act of 1995. In particular, all statements that express forecasts, expectations and projections with respect to future matters, including trends in results of operations, margins, growth rates, overall market trends, the impact of interest or exchange rates, the availability of financing to the Company, anticipated cost savings or synergies and the completion of strategic transactions are forward-looking statements. By their nature, forward-looking statements involve risk and uncertainty because they relate to events and depend on circumstances that will occur in the future. There are a number of factors, discussed in this report, that could cause actual results and developments to differ materially from those expressed or implied by these forward-looking statements, including many factors outside Reckitt Benckiser’s control. Past performance cannot be relied upon as a guide to future performance.
For further information
Reckitt Benckiser +44 (0)1753 217 800
Mark Wilson Corporate Control & Investor Relations (Investor calls)
Andraea Dawson-Shepherd Corporate Communication and Affairs (Media calls)

16
Half Year Condensed Financial Statements (unaudited) Group income statement (unaudited) For the six months ended 30 June
At 30 June At 30 June At 31 December 2008 2007 2007 Notes £m £m £mNet revenues 5 3,074 2,560 5,269
Cost of sales (1,281) (1,085) (2,197)
Gross profit 1,793 1,475 3,072Net operating expenses (1,193) (965) (1,839)Operating profit 5 600 510 1,233
BOperating profit before exceptional items B5 B630 B510 B1,190
BExceptional items B4 B(30) B- B43
BOperating profit B5 B600 B510 B1,233
BFinance income B15 B10 B22
BFinance expense B(34) B(26) B(46)
BNet finance expense B(19) B(16) B(24)
Profit on ordinary activities before taxation 581 494 1,209
Tax on profit on ordinary activities 7 (139) (99) (271)
BProfit for the period 442 395 938
Attributable to equity minority interests - - -Attributable to ordinary equity holders of the parent
442 395 938
BProfit for the period 442 395 938
Earnings per ordinary share: On profit for the period, basic 8 62.1p 55.1p 131.2pOn profit for the period, diluted 8 60.8p 53.6p 127.9pDividend per ordinary share (paid in period) 30.0p 21.0p 50.0pTotal dividends for the period 214 152 358

17
Group balance sheet (unaudited)
At 30 June At 30 June At 31 December 2008 2007 2007 Notes £m £m £mASSETS Non-current assets: Goodwill and other intangible assets 5,324 3,827 3,811Property, plant and equipment 10 517 448 479Deferred tax assets 154 150 106Available for sale financial assets 26 - -Other receivables 11 16 30 6,032 4,441 4,426Current assets: Inventories 451 365 382Trade and other receivables 787 689 693Available for sale financial assets 24 22 39Cash and cash equivalents 485 334 328 1,747 1,410 1,442Total assets 7,779 5,851 5,868 LIABILITIES Current liabilities: Borrowings 11 (1,492) (830) (487) Provisions for liabilities and charges 12 (62) (18) (36)Trade and other payables (1,973) (1,619) (1,635)Tax liabilities (303) (277) (266) (3,830) (2,744) (2,424) Non-current liabilities: Borrowings 11 (4) (10) (5)Deferred tax liabilities (997) (773) (705)Retirement benefit obligations 6 (220) (213) (187)Provisions for liabilities and charges 12 (34) (16) (19)Tax liabilities (120) (80) (120)Other non-current liabilities (21) (22) (23) (1,396) (1,114) (1,059)
Total liabilities (5,226) (3,858) (3,483)Net assets 2,553 1,993 2,385
EQUITY Capital and reserves: Share capital 13 72 76 72Share premium account 14 - 533 -Capital redemption reserve 14 - 5 -Merger reserve 14 (14,229) 142 (14,229)Hedging reserve 14 (3) (6) (6)Foreign currency translation reserve 14 48 (151) (59)Retained earnings 14 16,663 1,392 16,605 2,551 1,991 2,383Equity minority interests 14 2 2 2Total equity 2,553 1,993 2,385

18
Group statement of recognised income and expense (unaudited) For the six months ended 30 June 30 June 30 June Full Year 2008 2007 2007 Notes £m £m £m
BProfit for the period 442 395 938 BNet exchange adjustments on foreign currency translation 14 107 1 93 BActuarial gains and losses (49) - 25 BMovement of deferred tax on pension liability 14 - (5) BTax movement on share option exercises 4 - 18 BNet hedged gains and losses taken to reserves 3 (5) (5) Net gains/(losses) not recognised in the income statement 79 (4) 126 Total recognised income relating to the period 521 391 1,064
BAttributable to equity minority interests - - - Attributable to ordinary equity shareholders of the parent 521 391 1,064 521 391 1,064

19
Group cash flow statement (unaudited) For the six months ended 30 June
30 June
2008 30 June
2007 Full Year
2007 Notes £m £m £m
BCASH FLOWS FROM OPERATING ACTIVITIES BCash generated from operations: BOperating profit 600 510 1,233BDepreciation 47 40 84BAmortisation 2 4 9BImpairment of tangible fixed assets - - 5BImpairment of intangible fixed assets - 7 27BFair value gains (1) (1) (2)BGain on sale of property, plant and equipment and intangible assets - - (1)BGain on disposal of subsidiary undertakings - - (127)BIncrease in inventories (38) (47) (39)BIncrease in trade and other receivables (6) (7) (13)BIncrease in payables and provisions 153 104 3BShare award expense 31 25 52BOther non-cash movements - (1) -Cash generated from operations: 788 634 1,231Interest paid (28) (25) (46)Interest received 15 10 22Tax paid (122) (93) (232)Net cash generated from operating activities 653 526 975
BCASH FLOWS FROM INVESTING ACTIVITIES Purchase of property, plant and equipment and intangible assets (90) (67) (134)Disposal of property, plant and equipment 4 5 19Acquisition of businesses, net of cash acquired 15 (1,068) - -Disposal of subsidiary undertakings - - 260Maturity of short term investments 13 (2) (17)Net cash (used)/generated by investing activities (1,141) (64) 128 CASH FLOWS FROM FINANCING ACTIVITIES Proceeds from issue of ordinary shares 30 30 52Share purchases (182) (143) (300)Proceeds from borrowings 1,146 - -Repayments of borrowings (142) (143) (503)Dividends paid to the Company’s shareholders 9 (214) (179) (358)Net cash generated/(used) in financing activities 638 (435) (1,109) Net increase/(decrease) in cash and cash equivalents 150 27 (6)Cash and cash equivalents at beginning of period 311 298 298Exchange gains 6 3 19Cash and Cash equivalents at end of period 467 328 311 Cash and cash equivalents comprise Cash and cash equivalents 485 334 328Overdrafts (18) (6) (17) 467 328 311
RECONCILIATION OF NET CASH FLOW FROM OPERATIONS
Net cash generated from operating activities 653 526 975Net purchases of property, plant and equipment (57) (62) (114)Net cash flow from operations 596 464 861
Management uses net cash flow from operations as a performance measure.

20
Notes to the Half Year Condensed Financial Statements (unaudited)
1. General Information
Reckitt Benckiser Group plc is a public limited company incorporated and domiciled in the UK. The address of its registered office is 103-105 Bath Road, Slough, Berkshire SL1 3UH. The Company is listed on the London Stock Exchange. The Half Year Condensed Financial Statements were approved by the Board of Directors for issue on 28 July 2008.
2. Basis of Preparation
The Half Year Condensed Financial Statements for the six months ended 30 June 2008 have been prepared in accordance with IAS 34, ‘Interim financial reporting’ as adopted by the European Union and as issued by the International Accounting Standards Board and with the Disclosure and Transparency Rules of the United Kingdom's Financial Services Authority. The Half Year Condensed Financial Statements should be read in conjunction with the Annual Report and Financial Statements for the year ended 31 December 2007, which have been prepared in accordance with IFRSs as adopted by the European Union and IFRSs as issued by the International Accounting Standards Board.
3. Accounting Policies Except as described below, the accounting policies applied are consistent with those of the 2007 Financial Statements. Taxes on income in the interim periods are accrued using the tax rate that would be applicable to expected total annual earnings. Change in accounting policy The following standard, although not yet effective, has been adopted early for the financial year beginning 1 January 2008:
• IFRS 8, ‘Operating segments’, effective for annual periods beginning on or after 1 January 2009. IFRS 8 replaces IAS 14, ‘Segment reporting’, and requires a ‘management approach’ under which segment information is presented on the same basis as that used for internal reporting purposes. This has resulted in an increase in the number of reportable segments presented, as the Reckitt Benckiser Pharmaceuticals (‘RB Pharmaceuticals’) segment is now reported separately having previously been included within Europe and NAA based upon the geographical location of its sales.
Operating segments are reported in a manner consistent with the internal reporting provided to the chief operating decision-maker. The chief operating decision-maker has been identified as the Executive Committee that makes strategic decisions. Goodwill is allocated by management to groups of cash-generating units on a segment level. The change in reportable segments has not resulted in any additional goodwill impairment. There has been no further impact on the measurement of the Company’s assets and liabilities, comparatives for 2007 have been reclassified.
The following standards, amendments and interpretations became mandatory for the first time for the financial year beginning 1 January 2008:
• IFRIC 11, ‘IFRS 2 – Group and treasury share transactions’. This standard currently does not have a material impact on the Group.
IFRIC 14, ‘IAS 19 – the limit on a defined benefit asset, minimum funding requirements and their interaction’ is expected to be endorsed by the European Union by 31 December 2008 and hence is

21
expected to be mandatory for the year ended 31 December 2008. This standard does not have a material impact on the Group.
The following new standards, amendments to standards or interpretations are mandatory for the first time for the financial year beginning 1 January 2008 but are not currently relevant for the Group:
• IFRIC 12, ‘Service concession arrangements’.
4. Exceptional Items Exceptional items in 2008 consist of a restructuring charge of £30m as a result of the acquisition and integration of Adams business, plus some further restructuring in the enlarged Group. There were no exceptional items in the first half of 2007.
5. Segmental Analysis
Management has determined the operating segments based on the reports reviewed by the Executive Committee that are used to make strategic decisions. The Committee considers the business principally from a geographical perspective, but with the Pharmaceuticals business being managed separately given the significantly different nature of the business and the risks and rewards associated with it. The geographical segments derive their revenue primarily from the manufacture and sale of branded products in Household Cleaning and Health & Personal Care. The Executive Committee assesses the performance of the operating segments based on net revenue and operating profit. This measurement basis excludes the effects of exceptional items. Finance income and expense are not allocated to segments, as they are managed on a central group basis.
Half Year Ended 30 June
2008 2007 £m £m BNet revenues
Europe # 1,606 1,372 North America & Australia # 758 624 Developing Markets 573 472 Pharmaceuticals # 137 92 3,074 2,560 BOperating profit – Statutory basis
Europe # 362 306 North America & Australia # 90 96 Developing Markets 72 58 Pharmaceuticals # 76 50 600 510 Operating profit – adjusted*
Europe # 362 306 North America & Australia # 120 96 Developing Markets 72 58 Pharmaceuticals # 76 50 Subtotal before exceptional items 630 510 Exceptional items (30) - 600 510
* Adjusted to exclude the impact of exceptional items. # 2007 comparatives have been reclassified to separately disclose Pharmaceuticals, previously reported within Europe and North America & Australia.

22
All assets and liabilities acquired as part of the purchase of Adams are located in the USA and as such are included within the North America & Australia reportable segment. As at 30 June 2008 total North America & Australia segment assets were £3,167m (31 December 2007 £1,616m). There were no other significant changes to the allocation of assets between reportable segments since 31 December 2007.
Net Revenue by Product Segment
Half Year Ended June 30
2008 2007 £m £m BNet revenues by Category Fabric Care 720 605 Surface Care 532 459 Dishwashing 370 305 Home Care 422 364 Health & Personal Care ** 768 605 Other Household 30 42 BHousehold and Health & Personal Care 2,842 2,380 Pharmaceuticals 137 92 Food 95 88 3,074 2,560
**Net revenues of £66m in HY (2007 £nil) in respect the Adams business are included within Health & Personal Care. On a like-for-like basis, growth of Health & Personal Care is 15%. Certain minor brands previously disclosed in the other household category with revenues of £9m for HY 2008 have been reclassified across the core categories. The comparatives have not been reclassified as the amounts involved are insignificant.
6. Defined Benefit Pension Schemes
The Group operates a number of defined benefit and defined contribution pension schemes around the world covering many of its employees, which are principally funded. The Group’s two most significant defined benefit pension schemes (UK and US) are both funded by the payment of contributions to separately administered trust funds. The Group also operates a number of other post-retirement schemes in certain countries. As at 30 June 2008, the present value of the Group’s scheme liabilities less the fair value of plan assets was a deficit of £211m (31 December 2007 deficit of £159m).
At 30 June
2008At 30 June
2007 At 31 December
2007 £m £m £mTotal equities 427 498 489Total bonds 303 271 296Total other assets 90 102 88Fair value of plan assets 820 871 873Present value of scheme liabilities (1,031) (1,073) (1,032)Net liability recognised in the balance sheet (211) (202) (159)

23
The net pension liability is recognised in the balance sheet as follows:
At 30 June
2008At 30 June
2007 At 31 December
2007 £m £m £mNon-current asset: Funded scheme surplus 9 11 28Non-current liability: Funded scheme deficit (42) (17) (14) Unfunded scheme liability (178) (196) (173)Retirement benefit obligation (220) (213) (187)Net pension liability (211) (202) (159)
7. Income Taxes
Income tax expense is recognised based on management’s best estimate of the weighted average annual income tax rate expected for the full financial year. The estimated average annual tax rate used for the year to 31 December 2008 is 24% (the estimated underlying tax rate for the six months ended 30 June 2007 was also 24%, excluding the one off tax release of £20m).
8. Earnings per Share
Basic Basic earnings per share is calculated by dividing the profit attributable to equity holders of the Company (2008 £442m; 2007 £395m) by the weighted average number of ordinary shares in issue during the period (2008 711,463,436; 2007 716,622,035). Diluted Diluted earnings per share is calculated by adjusting the weighted average number of shares outstanding to assume conversion of all potentially dilutive ordinary shares. The Company has two categories of dilutive potential ordinary shares: Executive Options and Employee Sharesave schemes. The options only dilute earnings per share when they result in the issue of shares at an exercise price below the market price of the share and when all performance criteria (if applicable) have been met. As at 30 June 2008, there were 15m (2007 20m) of Executive Options not included within the dilution because the contingent performance targets had not been met.
Reported Basis
The reconciliation between profit for the half year and the weighted average number of shares used in the calculations of the diluted earnings per share is set out below:
2008 2007 Profit for
the half year £m
Average Number of
Shares
Earnings per share
pence
Profit for the half
year £m
Average number of
shares
Earnings per share
pence Profit attributable to shareholders 442 711,463,436 62.1 395 716,622,035 55.1 Dilution for Executive options outstanding and Executive Restricted Share Plan
14,325,568 18,425,134
Dilution for Employee Sharesave Scheme options outstanding
1,047,416 1,257,984
On a diluted basis 442 726,836,420 60.8 395 736,305,153 53.6

24
Adjusted Basis
The reconciliation between profit for the half year and the weighted average number of shares used in the calculations of the diluted earnings per share is set out below:
2008 2007 Profit for
the half year £m
Average Number of
Shares
Earnings per share
pence
Profit for the half
year £m
Average number of
shares
Earnings per share
pence Profit attributable to shareholders 465 711,463,436 65.4 395 716,622,035 55.1 Dilution for Executive options outstanding and Executive Restricted Share Plan
14,325,568 18,425,134
Dilution for Employee Sharesave Scheme options outstanding
1,047,416 1,257,984
On a diluted basis 465 726,836,420 64.0 395 736,305,153 53.6
The Directors believe that diluted earnings per ordinary share, adjusted for the impact of the exceptional items after the appropriate tax amount, provides additional useful information on underlying trends to shareholders in respect of earnings per ordinary share.
9. Dividends
A final dividend in respect of the financial year ended 31 December 2007 of 30.0p per share amounting to £214m was paid on 29 May 2008 to shareholders who were on the register on 29 February 2008.
The Directors are proposing an interim dividend in respect of the financial year ending 31 December 2008 of 32.0p per share which will absorb an estimated £227m of shareholders’ funds. It will be paid on 25 September 2008 to shareholders who are on the register on 8 August 2008. The expected tax impact of this dividend is £nil (2007 £nil).
10. Property, Plant and Equipment
During the period there were additions of £61m (2007 £67m) and disposals of £4m (2007 £5m). The additions and disposals were across all categories of property, plant and equipment. There was no significant capital expenditure which was contracted but not capitalized at 30 June 2008 or 2007.
11. Financial Liabilities – Borrowings
At 30 June
2008At 30 June
2007 At 31 December
2007Current £m £m £m Bank loans and overdrafts (a) 191 20 32Commercial paper (b) 1,297 748 451Finance lease obligations 4 4 46.72% Notes series F due 2007 - 58 - 1,492 830 487
At 30 June
2008At 30 June
2007 At 31 December
2007Non-current £m £m £m Finance lease obligations 4 5 5Preference shares (c) - 5 - 4 10 5

25
a) Bank loans are denominated in a number of currencies; all are unsecured and bear interest based on relevant LIBOR equivalent. b) Commercial paper was issued in a number of currencies, all unsecured and bearing interest based on relevant LIBOR equivalent, predominantly to finance the acquisition of Adams (note 15). c) Preference share capital.
At 30 June2008
At 30 June 2007
At 31 December
2007
At 30 June 2008
At 30 June 2007
At 31 December
2007
Authorised, issued and fully paid No of
SharesNo of
SharesNo of
Shares £m £m £m5% Cumulative Preference Shares of £1 each - 4,500,000 - - 5 -
The terms of the cumulative preference shares are detailed in note 15 of the 2007 Financial Statements. On 23 October 2007, in conjunction with the Scheme of Arrangement (detailed in note 20 of the 2007 Financial Statements) these shares were cancelled and repaid at par plus accrued interest.
At 30 June
2008At 30 June
2007
At 31 December
2007Maturity of Debt £m £m £mBank loans and overdrafts repayable: Within one year or on demand 191 20 32 Other borrowings repayable: Within one year or on demand: Commercial paper 1,297 748 451 6.72% Notes series F due 2007 - 58 - Finance leases 4 4 4 5% cumulative preference shares - 5 -Between two and five years : Finance leases (payable by instalments) 4 5 5 1,305 820 460Gross borrowings (unsecured) 1,496 840 492
Borrowing facilities The Group has various borrowing facilities available to it. The undrawn committed facilities available, in respect of which all conditions precedent have been met at the balance sheet date (except at 31 December 2007 for those expiring within one year in which conditions precedent were met subsequent to the balance sheet date) were as follows:
At 30 June
2008At 30 June
2007
At31December
2007Undrawn committed facilities £m £m £mExpiring within one year - - 1,260Expiring between one and two years - 475 -Expiring in more than two years 1,675 750 1,225 1,675 1,225 2,485
26
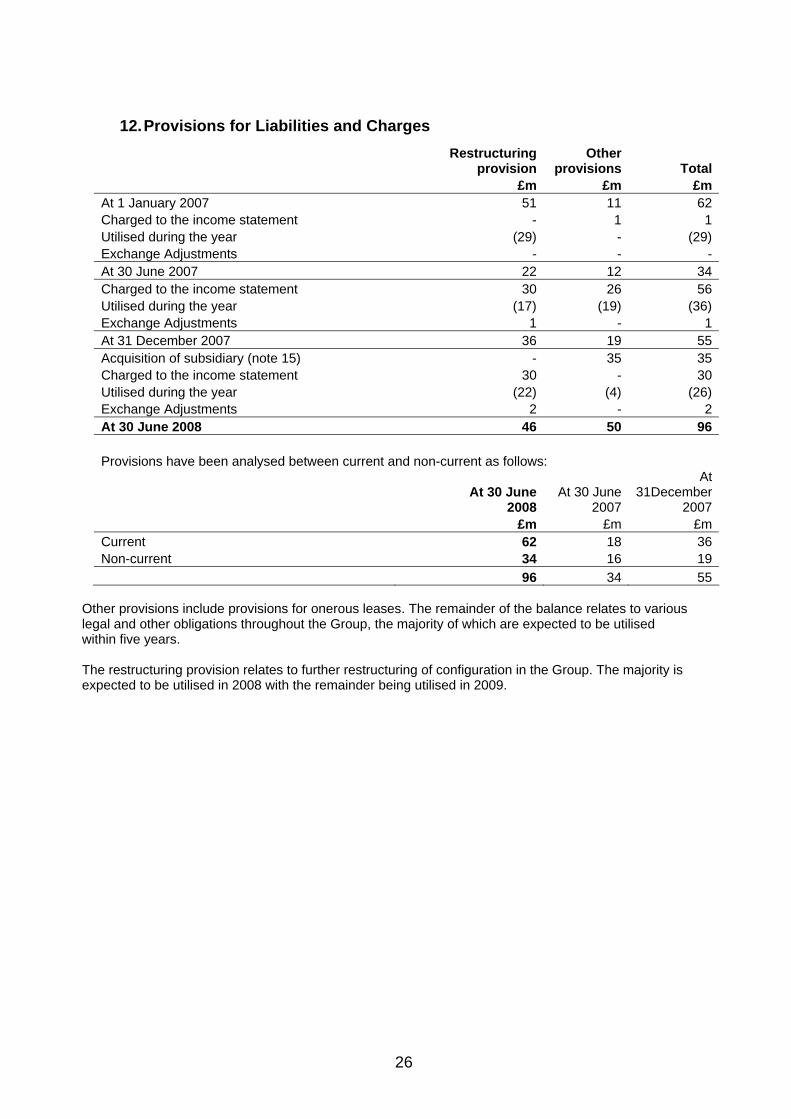
12. Provisions for Liabilities and Charges
Restructuring
provisionOther
provisions Total £m £m £mAt 1 January 2007 51 11 62Charged to the income statement - 1 1Utilised during the year (29) - (29)Exchange Adjustments - - -At 30 June 2007 22 12 34Charged to the income statement 30 26 56Utilised during the year (17) (19) (36)Exchange Adjustments 1 - 1At 31 December 2007 36 19 55Acquisition of subsidiary (note 15) - 35 35Charged to the income statement 30 - 30Utilised during the year (22) (4) (26)Exchange Adjustments 2 - 2At 30 June 2008 46 50 96 Provisions have been analysed between current and non-current as follows:
At 30 June
2008At 30 June
2007
At 31December
2007 £m £m £mCurrent 62 18 36Non-current 34 16 19 96 34 55
Other provisions include provisions for onerous leases. The remainder of the balance relates to various legal and other obligations throughout the Group, the majority of which are expected to be utilised within five years. The restructuring provision relates to further restructuring of configuration in the Group. The majority is expected to be utilised in 2008 with the remainder being utilised in 2009.

27
13. Share Capital
Non voting Equity Nominal Redeemable NominalSubscriber Nominal Ordinary Value Preference Value Ordinary Value Authorised Shares £m Shares £m Shares £m At 1 January 2007 (Reckitt Benckiser plc) Unclassified shares of 1010⁄19p each 225,958,229 24 Ordinary shares of 1010⁄19p each 719,541,771 76 945,500,000 100 At 30 June 2007 (Reckitt Benckiser plc) Unclassified shares of 1010⁄19p each 223,152,295 24 Ordinary shares of 1010⁄19p each 722,347,705 76 945,500,000 100 At 31 December 2007 (Reckitt Benckiser Group plc) Ordinary shares of 10p each 945,500,000 95 945,500,000 95 At 30 June 2008 (Reckitt Benckiser Group plc) Ordinary shares of 10p each 945,500,000 95 945,500,000 95 Issued and fully paid At 1 January 2007 (Reckitt Benckiser plc) 719,541,771 76 Allotments 2,805,934 - At 30 June 2007 722,347,705 76 Allotments 20,807 - At 22 October 2007 722,368,512 76 On formation of Reckitt Benckiser Group plc 50,000 – 2 – Group reconstruction – shares in Reckitt Benckiser Group plc of 10p each 722,368,512 72 At 31 December 2007 722,368,512 72 50,000 – 2 – Allotments - - At 30 June 2008 722,368,512 72 50,000 – 2 –

28
14. Statement of Changes in Shareholders’ Equity
Share
capital Share
premium Merger reserve
Hedging reserve
Capital redemption
reserve
Foreign currency
translation reserve
Retained earnings
Minority interest Total
Balance at 1 January 2007 76 527 142 (1) 5 (152) 1,266 3 1,866
Shares allotted under share schemes 6 6
Unvested share awards 25 25
Deferred tax on share awards 4 4
Profit for the half year 395 395
Dividends (179) (179)
Own shares repurchased (143) (143)
Transfer to capital redemption reserve 24 24
Increase in minority interest on acquisition (1) (1) Net exchange adjustments on foreign currency translation 1 1 Net hedged gains and losses taken to reserves (5) (5)
Balance at 30 June 2007 76 533 142 (6) 5 (151) 1,392 2 1,993
Shares allotted under share schemes 1 1 Net exchange adjustments on foreign currency translation 92 92
Unvested share awards 27 27
Deferred tax on share awards 9 9
Profit for second half year 543 543
Dividends (179) (179)
Actuarial gains/losses 25 25
Movement of deferred tax on pension liability (5) (5)
Cancellation of RB plc shares (76) (534) (5) 615 -
Issue of RB Group plc shares 14,447 14,447
Capital reduction – merger accounting (14,375) (14,371) 14,299 (14,447)
Tax movement on share option exercises 18 18
RB Group plc share issue costs (3) (3)
Shares repurchased and held in Treasury (157) (157)
Treasury shares reissued 21 21
Balance at 31 December 2007 72 - (14,229) (6) - (59) 16,605 2 2,385
Shares allotted under share schemes
Unvested share awards 31 31
Deferred tax on share awards (18) (18)
Profit for the half year 442 442
Dividends (214) (214)
Actuarial gains/losses (net of tax) (35) (35)
Shares repurchased and held in Treasury (182) (182)
Tax movement on share option exercises 4 4
Treasury shares reissued 30 30 Net exchange adjustments on foreign currency translation 107 107 Net hedged gains and losses taken to reserves 3 3
Balance at 30 June 2008 72 - (14,229) (3) - 48 16,663 2 2,553

29
15. Business Acquisitions
Acquisition of Adams Respiratory Therapeutics Inc. (Adams) On 30 January 2008 the Group acquired 100% of the issued share capital of Adams Respiratory Therapeutics Inc. (Adams) for a consideration of £1.1bn. Adams is a US based specialty pharmaceutical company focused on the late-stage development, commercialisation and marketing of over-the-counter and prescription pharmaceuticals for the treatment of respiratory disorders. This transaction has been accounted for by the purchase method of accounting. From the date of acquisition to the 30 June 2008 the acquisition contributed £66m to net revenue. Had the acquisition taken place at 1 January 2008, it would have contributed £85m to net revenues. Disclosure of operating profit information for the acquisition is considered by management to be impracticable due to the extent of integration into the combined group. Similarly disclosure of cash flows from the acquired business is considered by management to be impracticable as they are derived from one combined business.
All assets and liabilities were recognised at fair value. The residual excess over the net assets acquired is recognised as goodwill in the financial statements.
Adams Acquisition Book
value£m
Provisional Fair value
adjustment £m
Provisional Fair value
£m
Intangible fixed assets 61 734 795Property, plant and equipment 10 (4) 6Available for sale financial assets 52 (13) 39Inventories 19 (4) 15Receivables 47 - 47Payables (84) (23) (107)Net cash (3) - (3)Short term cash deposit investments 18 - 18Deferred tax asset 7 18 25Long-term liabilities (2) (19) (21)Deferred tax on intangibles - (278) (278)Net Assets acquired 125 411 536Goodwill - - 560Total cost of acquisition 1,096 Total cash consideration 1,092Direct costs related to the acquisition 4Total cost of acquisition 1,096
The total consideration includes directly attributable costs of £4m. Goodwill represents the strategic premium to enter and establish critical mass in the US Healthcare market, and global expansion of the brands acquired. The intangible assets acquired as part of the acquisition of Adams are analysed as follows:
Product Group Key Brands 2008£m
Health & Personal Care Mucinex, Delsym 795
The fair value adjustments contain provisional amounts which will be finalised in the 2009 Annual Report and Financial Statements, once the permitted 12-month hindsight period has elapsed post-acquisition. Fair value adjustments cover the recognition of acquired intangible assets and their associated deferred tax, accounting policy alignment and other fair value adjustments on net working capital. All assets and liabilities acquired are located in the USA and therefore are within the NAA reportable segment.

30
Acquisition of Muse On 30 April 2008 the Group acquired a local Japanese antiseptic brand, ‘Muse’ for £29m. There were no acquisitions in the prior year.
16. Contingent Liabilities
Contingent liabilities for the Group, comprising guarantees relating to subsidiary undertakings, at 30 June 2008 amounted to £33m (31 December 2007 £33m). The Group is involved in the early stages of a number of enquiries from competition authorities. Any potential liability in respect of such enquiries is not quantifiable as at the date of this report, therefore the Directors have made no provision for such liabilities.
17. Post Balance Sheet Events
Share capital issued since 30 June 2008 In the period 30 June 2008 to 25 July 2008 the parent company has not issued any ordinary shares. Details of the interim dividend proposed are given in note 9.
18. Seasonality
Demand for the majority of products sold by the Group are not subject to significant seasonal fluctuations. Within some categories such as Health & Personal Care and Pest Control, some products do exhibit seasonal fluctuations; however, peak demand in the Northern Hemisphere markets tends to largely counter that in the Southern Hemisphere markets. Other less significant seasonal relationships also occur within the group, which do not have a material impact on overall performance of the group in any one quarter.
19. Related Party Transactions
There have been no changes in the related party transactions from those described in the 2007 Financial Statements that could have a material effect on the Group’s financial position or performance in the first six months of the current financial year.

31
Statement of Directors’ Responsibilities The Directors’ confirm that these Half Year Condensed Financial Statements have been prepared in accordance with IAS 34 as adopted by the European Union and as issued by the International Accounting Standards Board and that the interim management report includes a fair review of the information required by DTR 4.2.7 and DTR 4.2.8, namely:
• an indication of important events that have occurred during the first six months and their impact on the Half Year Condensed Financial Statements, and a description of the principal risks and uncertainties for the remaining six months of the financial year; and
• material related party transactions in the first six months and any material changes in
the related party transactions described in the last annual report. The Directors of Reckitt Benckiser Group plc are listed in the Reckitt Benckiser Group plc Annual Report and Financial Statements for 31 December 2007, with the exception of the following changes in the period: P White retired from the Board of Directors at the AGM on 1 May 2008. Since the period end, on 17 July 2008, G Murphy resigned from the Board. A list of current Directors is maintained on the Reckitt Benckiser Group plc website: www.reckittbenckiser.com. By order of the Board Bart Becht Chief Executive Officer Adrian Bellamy Director 28 July 2008

32
Independent review report to Reckitt Benckiser Group plc Introduction We have been engaged by the Company to review the Half Year Condensed Financial Statements in the half-yearly financial report for the six months ended 30 June 2008, which comprises the Group income statement, Group balance sheet, Group statement of recognised income and expense, Group cash flow statement and related notes. We have read the other information contained in the half-yearly financial report and considered whether it contains any apparent misstatements or material inconsistencies with the information in the Half Year Condensed Financial Statements. Directors’ responsibilities The half-yearly financial report is the responsibility of, and has been approved by, the Directors. The Directors are responsible for preparing the half-yearly financial report in accordance with the Disclosure and Transparency Rules of the United Kingdom's Financial Services Authority. As disclosed in note 2, the annual financial statements of the Group are prepared in accordance with IFRSs as adopted by the European Union and IFRSs as issued by the International Accounting Standards Board. The Half Year Condensed Financial Statements included in this half-yearly financial report has been prepared in accordance with International Accounting Standard 34, "Interim Financial Reporting", as adopted by the European Union and as issued by the International Accounting Standards Board. Our responsibility Our responsibility is to express to the Company a conclusion on the Half Year Condensed Financial Statements in the half-yearly financial report based on our review. This report, including the conclusion, has been prepared for and only for the Company for the purpose of the Disclosure and Transparency Rules of the Financial Services Authority and for no other purpose. We do not, in producing this report, accept or assume responsibility for any other purpose or to any other person to whom this report is shown or into whose hands it may come save where expressly agreed by our prior consent in writing. Scope of review We conducted our review in accordance with International Standard on Review Engagements (UK and Ireland) 2410, ‘Review of Interim Financial Information Performed by the Independent Auditor of the Entity’ issued by the Auditing Practices Board for use in the United Kingdom. A review of interim financial information consists of making enquiries, primarily of persons responsible for financial and accounting matters, and applying analytical and other review procedures. A review is substantially less in scope than an audit conducted in accordance with International Standards on Auditing (UK and Ireland) and consequently does not enable us to obtain assurance that we would become aware of all significant matters that might be identified in an audit. Accordingly, we do not express an audit opinion. Conclusion Based on our review, nothing has come to our attention that causes us to believe that the Half Year Condensed Financial Information in the half-yearly financial report for the six months ended 30 June 2008 is not prepared, in all material respects, in accordance with International Accounting Standard 34 as adopted by the European Union and the Disclosure and Transparency Rules of the United Kingdom's Financial Services Authority. PricewaterhouseCoopers LLP Chartered Accountants, London 28 July 2008 Notes:
(a) The maintenance and integrity of the Reckitt Benckiser Group plc website is the responsibility of the directors; the work carried out by the auditors does not involve consideration of these matters and, accordingly, the auditors accept no responsibility for any changes that may have occurred to the financial statements since they were initially presented on the website.
(b) Legislation in the United Kingdom governing the preparation and dissemination of financial
statements may differ from legislation in other jurisdictions.